






Abstract
Tropomyosin receptor kinases family members TrkA, TrkB, and TrkC mediate critical processes, such as neuronal growth, survival, and synaptic plasticity, and have been implicated in neuropsychiatric disorders. In this work, we characterized the pharmacokinetics of the novel positron emission tomography (PET) radioligand [18F]TRACK for in vivo quantification of TrkB/C in the human brain. Seven healthy volunteers (three men; 20–61 years) underwent a 90 min PET scan following an intravenous bolus injection of [18F]TRACK. Arterial blood sampling was performed throughout image acquisition. [18F]TRACK was slowly metabolized, accounting for 60% of the plasma activity at 90 min, with two more polar radiometabolites observed. Regional time-activity curves (TACs) showed moderate uptake (SUV: 1–2) and good reversibility in gray matter regions. Across regions, the two-tissue compartment model (2TCM) yielded superior fits than the 1TCM for 98% of extra-striatal gray-matter TACs, whereas it improved fits for only 52% of striatal TACs. Total distribution volume (VT) ranged from 2.49 ± 0.30 ml/cm3 (thalamus) to 1.94 ± 0.21 ml/cm3 (hippocampus) showing good identifiability (%SE: 1%–5%) and low inter-subject variability (%CoV <14%). Transient equilibrium between [18F]TRACK in tissue and plasma was reached at approximately 70 min. Shortening the scan duration to 60 min preserved VT accuracy and precision.
Introduction
Tropomyosin receptor kinases A, B, and C (TrkA, TrkB, TrkC) are transmembrane glycoproteins that promote neuronal growth and survival as well as synaptic plasticity upon activation by the corresponding neurotrophins. 1 The intracellular signaling pathways depend on the specific Trk receptor and the associated neurotrophin binding to its extracellular domain. TrkA is activated by the nerve growth factor (NGF) and triggers the RAS/MAPK pathway, leading to cellular growth, proliferation, and survival. 2 The binding of brain-derived neurotrophic factor (BDNF) and neurotrophin-4 (NT-4) to TrkB initiates the RAS-ERK, PI3K, and PLCγ pathways, which are involved in synaptic plasticity, neuronal survival and differentiation. 3 Finally, binding of neurotrophin-3 (NT-3) to TrkC activates the PI3K/AKT pathway, promoting cell survival and proliferation.4,5
Growing evidence indicates that alterations in Trk signaling contribute to the pathophysiology of neurodegenerative and psychiatric disorders, as well as various cancers. 6 Investigations on the role of Trk in a wide range of diseases could be facilitated by the availability of highly quantitative Trk imaging methods with positron emission tomography (PET). The development of a radiotracer for Trk is complicated by the presence of truncated receptor forms, in which the catalytic intracellular domain, necessary for downstream signaling, is cleaved from the neurotrophin binding extracellular domain. 7 Truncated forms are present on astrocytes, where they play a role in cytoskeleton formation and occur on neurons under pathological conditions such as cerebral ischemia. 8 Since only the full-length Trk mediates synaptic and dendritic plasticity, radioligands must be designed to target the intracellular catalytic domain of the full-length receptor.7,9
[11C]-(R)-IPMICF16 was the first-in-class radiotracers evaluated for brain imaging in humans which targets the intracellular TrkB/C domain. 10 However, this radiotracer exhibited some limitations, including slow brain kinetics, P-gp efflux liability, and the short half-life of carbon-11. 11 (R)-N-(4-[18F]fluorophenyl)-6-(2-(3-fluorophenyl)pyrrolidin-1-yl)imidazo[1,2-b]pyridazine-3-carboxamide ([18F]TRACK) is a more recent radiotracer derived from the same chemical scaffold as [11C]-IPMICF16, but with largely reduced P-gp liability and improved brain kinetics. 11 [18F]TRACK has been successfully used in preclinical studies, including rat models 12 and in vivo in non-human primates, 11 as well as in humans.13,14 In addition, [18F]TRACK specificity and selectivity for TrkB/C were confirmed by pharmacological in vitro blocking studies, 15 which demonstrated a clear signal reduction in prefrontal cortex and cerebellum. 11
In the present study, we investigated the kinetic modeling of [18F]TRACK to quantify TrkB/C expression in the human brain. Our goal was to identify the compartment model that best describes its brain uptake. We assessed the identifiability of key parameters used to quantify [18F]TRACK uptake and evaluated how these parameters converge as a function of scan duration.
Materials and methods
Radiosynthesis of [18F]TRACK
The radiotracer was synthesized via copper-mediated 18F-fluorination of the corresponding enantiomerically pure (R)-pinacolboronic ester (Bpin) precursor as previously described. 11
Participants
Seven healthy volunteers (three men and four women; age, 20–61 years) were included in this study conducted at McConnell Brain Imaging Centre of The Neuro (Montreal Neurological Institute, Montreal, QC, Canada) from April 2023 to August 2023. All subjects were recruited through the Department of Neurology at the Jewish General Hospital by advertising. Inclusion criteria were a normal neurological and physical exam, Clinical Dementia Rating (CDR) of 0, Montreal Cognitive Assessment (MoCA) greater than or equal to 26 and Mini-Mental State Exam (MMSE) of 24 or greater, with normal results on the Logical Memory 2 score from the Wechsler Memory Scale-Revised (cut-offs adjusted by education level), and normal scores on the Jessen questions for subjective memory complaints. Patients with a history of neurologic diseases affecting the central nervous system or psychiatric diseases were excluded. All subjects provided written informed consent after a full explanation of the study procedures according to the Declaration of Helsinki. The protocol was approved by the Jewish General Hospital Research Ethics Board.
Positron emission tomography acquisition
All subjects underwent a 90 min cerebral [18F]TRACK PET scan which was performed using a high-resolution research tomograph (HRRT) PET camera system (Siemens Molecular Imaging, Knoxville, TN, USA). An 11-min transmission scan (using a single photon point source of 137Cs (t1/2 = 30.2 years, Eγ = 662 keV)) was acquired before the emission scan for attenuation correction. Following the transmission scan, a bolus of [18F]TRACK (171.5 ± 59.8 MBq; range 2.25–6.4 mCi) was manually injected into an antecubital vein. Images were reconstructed into a series of 28-time frames (4 × 10, 4 × 20, 3 × 40, 3 × 60, 4 × 120, 5 × 300, and 5 × 600 s). Image reconstruction was performed using an ordered-subsets expectation maximization algorithm with a three-dimensional approach (OSEM3D-OP-PSF), 16 subsets and 10 iterations
16
with a 207 × 256 × 256 matrix and isotropic voxels of 1.22 mm3. The reconstruction accounted for detector channel normalization, attenuation, random coincidences, scattered radiation, dead time, point-spread-function and decay corrections. Motion correction, accounting for emission transmission mismatch, was applied following the method validated by Costes et al.
17
The injected mass of [18F]TRACK was 0.77 ± 0.64 μg (ranged 0.19–1.78 μg) with an average molar activity (
Measurement of [18F]TRACK in plasma and metabolite analysis
An arterial canula was inserted in the radial artery of each subject. Continuous measurements of activity in blood was performed with an automatic blood sampling system (ABSS, Model #PBS-101 from COMECER Netherlands B.V., Joure, Netherlands) using polytetrafluoroethylene (PTFE) tubing for the first 23 min after injection of [18F]TRACK, starting at a rate of 350 ml/h and then slowed to 150 ml/h after 7.25 min. In addition, eight manual samples (5–10 ml each) were drawn at 3, 7, 13, 20, 30, 45, 60, and 90 min. The arterial line was rinsed with saline solution after the 13-min sample was collected. A 0.3 ml aliquot of whole blood was collected, and the remaining sample was centrifuged at 1228g for 5 min to obtain platelet-poor plasma. A 0.3 ml aliquot of plasma, along with the previously collected whole blood, was counted and weighed using the Hidex Automatic Gamma Counter (Hidex, Turku, Finland).
An aliquot of the remaining plasma (500 μl) was mixed with acetonitrile (500 μl) and centrifuged using an Eppendorf 5453 MiniSpin Plus centrifuge equipped with an F-45-12-11 rotor at 14,000 rpm for 5 min to precipitate plasma proteins. The resulting supernatant was injected into a Waters 1525 High-Performance Liquid Chromatography (HPLC) system, equipped with a binary pump and a Phenomenex Prodigy 5 µm ODS-3 100 Å LC column (250 × 4.6 mm). Radioactivity in the eluted sample was measured using a FlowCount coincidence detector (Bioscan) to quantify the unmetabolized fraction of [18F]TRACK in plasma as the ratio of the area under the parent compound peak to the total area.
Input function, delay, and dispersion
For each subject the blood time-activity curve (TAC) measured by the ABSS was corrected for dispersion using Landweber iterative deconvolution (30 iterations) in the Fourier domain (see Rusjan et al. 18 for details). The dispersion was modeled with τ = 10 s as:

This value was determined using two approaches: (a) by selecting the dispersion that maximized the identifiability of K1 in the cerebellar cortex TAC and (b) by fitting the ABSS signal—after rinsing the arterial line with saline following the 13-min sample—using a dispersed step function.
The delay was visually adjusted to align the onset of the deconvolved ABSS curve with the scanner’s “head curve” (true counts minus prompts). The delay-corrected ABSS activity curve was then rescaled to match the manually sampled data at 13 and 20 min. This rescaling accounts for radioligand adhesion to plastic surfaces in both the ABSS tubing and the manual sampling equipment. The resulting whole blood TAC is denoted as

The plasma input function was then generated by dividing
Magnetic resonance imaging and region of interest delineation
A structural magnetic resonance imaging (MRI) scan was conducted using a 3 T Siemens MAGNETOM TrioTim research-dedicated scanner at the Montreal Neurological Institute (The Neuro). A T1-weighted brain MRI scan was acquired for anatomical delineation of the regions of interest (ROIs) and co-registration with PET scans. All images were acquired with the following parameters: repetition time = 2300 ms, echo time = 2.98 ms, flip angle = 9°, 192 slices of 1.0 mm thickness, distance factor = 50%, and isotropic voxel size = 1.0 mm.
PET image analysis was performed with the in-house software ROMI. 19 ROMI nonlinearly transforms and refines based on the probability of gray matter, a set of ROIs defined in standard space to match the individual MRI. Each subject’s MRI was co-registered to their summed [18F]TRACK PET images with a rigid body transformation using the normalized mutual information algorithm. The transformations were then applied to the ROIs that were delineated in the MRI native space. The ROI for the amygdala and hippocampus were delineated with FreeSurfer v7.4.1. 20 The resliced ROIs were used to mask the [18F]TRACK PET image and generate the TACs from each participant.
Kinetic modeling analysis
TACs were fitted with one-tissue compartment model (1TCM) to estimate K11TCM, k21TCM, and VT1TCM; two-tissue compartment model (2TCM) to estimate K1, k2, k3, k4, VT, Vs, and BPND (for parameters definitions, see Innis et al.
21
), and Ichise Multilinear Analysis 1 (MA1).
22
Each model configuration was implemented to account for the contribution of vascular activity. We evaluated models using blood volume fraction in tissue (Vb) fixed to 2.7% for white matter (WM) and 4% for cortical gray matter (GM)
23
and also treating Vb as a variable to be fitted (1TCM-Vb and 2TCM-Vb). The volume of distribution, VT, is defined as the ratio of the radioligand concentration in tissue to that in plasma, at equilibrium. VT includes the concentration of radioligand specifically bound, non-specifically bound and free in the tissue. The value of VT can be estimated from the rate constants of the compartment models as
PMOD version 4.5 was used to fit the TACs. The identifiability of the kinetic parameters was assessed using the relative standard error (%SE) provided by PMOD, which is derived from the diagonal element of the covariance matrix of the non-linear least- squares fit. A smaller %SE indicates better identifiability. Data points were weighted by frame duration (∆ti), decay at time
Statistics
The Akaike Information Criterion (AIC) and the Model Selection Criterion (MSC) were used to assess the goodness of fit. Lower AIC values and higher MSC values indicated a better fit. Comparisons were performed using a paired-sample t-test. Data were expressed as mean ± standard deviation (SD).
Results
Arterial blood analysis
Analysis of plasma samples using HPLC showed the presence of two radioactive metabolites of [18F]TRACK (Figure S1). The radiometabolites exhibited shorter retention times on the reversed-phase column than the parent compound, indicating that they are more polar and therefore less likely to cross the blood–brain barrier (BBB). [18F]TRACK exhibited a slow metabolism rate and accounted for 58.17% ± 3.62% of the radioactivity in plasma at 90 min post-injection. A Hill function (equation (2)) fits well (r2 > 0.98) the fraction of unmetabolized radioligand in plasma (Figure 1(a)). The concentration of activity of the parent compound in plasma (dispersion corrected) reaches a peak between 25 and 40 s after injection with a value 29 ± 7 standardized uptake value (SUV). The tracer showed a rapid clearance from plasma within the first 10 min to 0.8 ± 0.2 SUV, followed by a slower decline to 0.33 ± 0.09 and 0.25 ± 0.08 SUVs at 60 min and 90 min, respectively (Figure 1(b)). The terminal phase of the plasma concentration–time curve (t ⩾ 20 min) can be fitted to a monoexponential model, yielding an elimination rate constant β = 0.014 ± 0.003/min (r2 > 0.93).
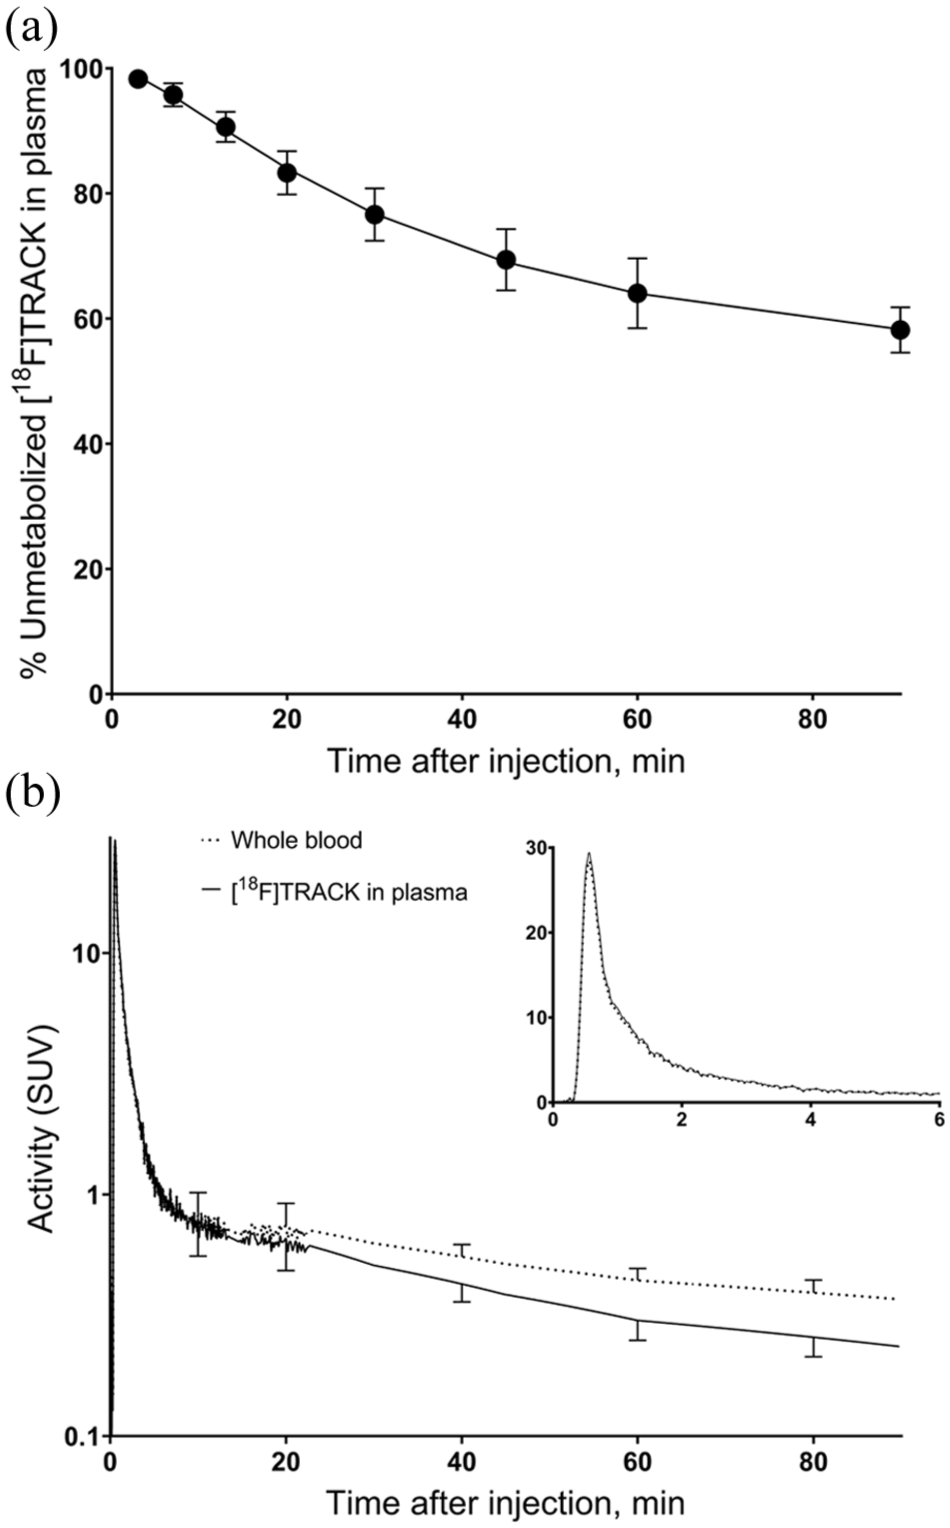
(a) Temporal evolution of the fraction of the parent compound in plasma, as determined by HPLC, with a Hill function
Brain uptake
Following [18F]TRACK injection, all subjects demonstrated moderate brain uptake in both gray and white matter (Figure 2). The regional TACs exhibited a sharp initial peak within the first minute, representing the first passage of blood in the brain vasculature. During this early phase, the radiotracer prominently highlighted regions consistent with blood flow in the carotid arteries and the superior sagittal sinus. After the initial vascular peak, GM TACs displayed a second peak between 2 and 5 min. The height of this peak varied depending on the ROIs, with typical SUV ranging from 1.2 ± 0.4 in the amygdala to 1.95 ± 0.3 in the putamen (Figure 3(a) and (b)). Conversely, WM exhibits a distinct pattern. After the initial vascular peak, the signal in WM increases slightly before stabilizing at an approximately constant value of around 0.8 SUV by 40–50 min post-injection, without displaying a clear washout of activity.
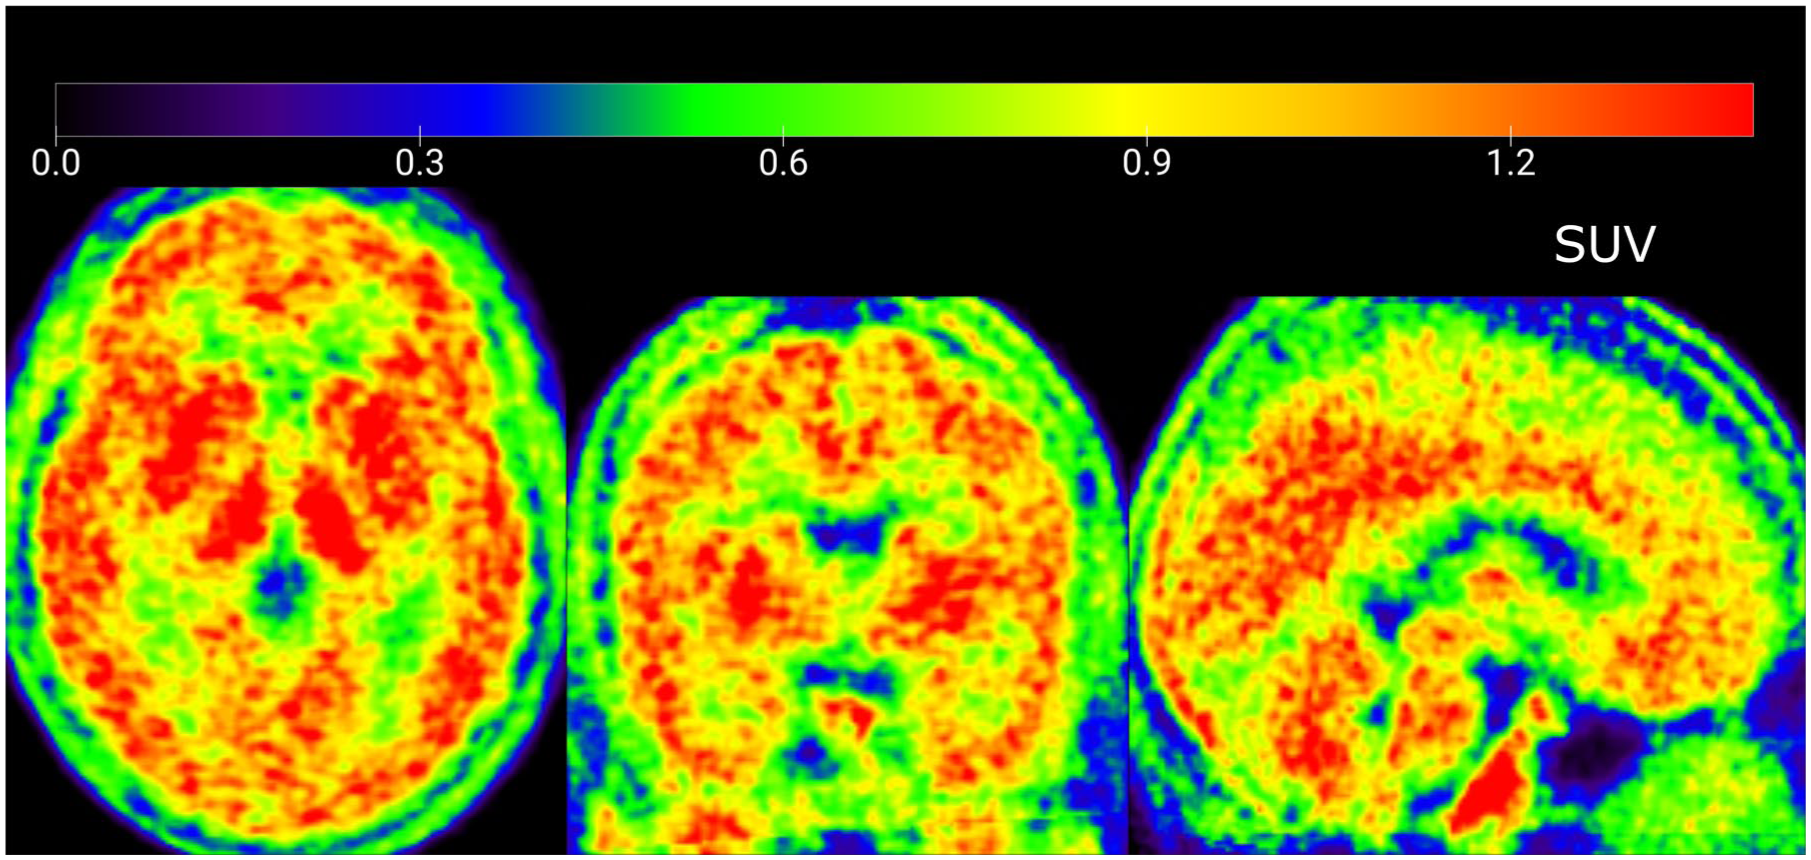
[18F]TRACK brain uptake. Mean activity across three frames (30–60 min), normalized to MNI space and averaged across seven subjects.
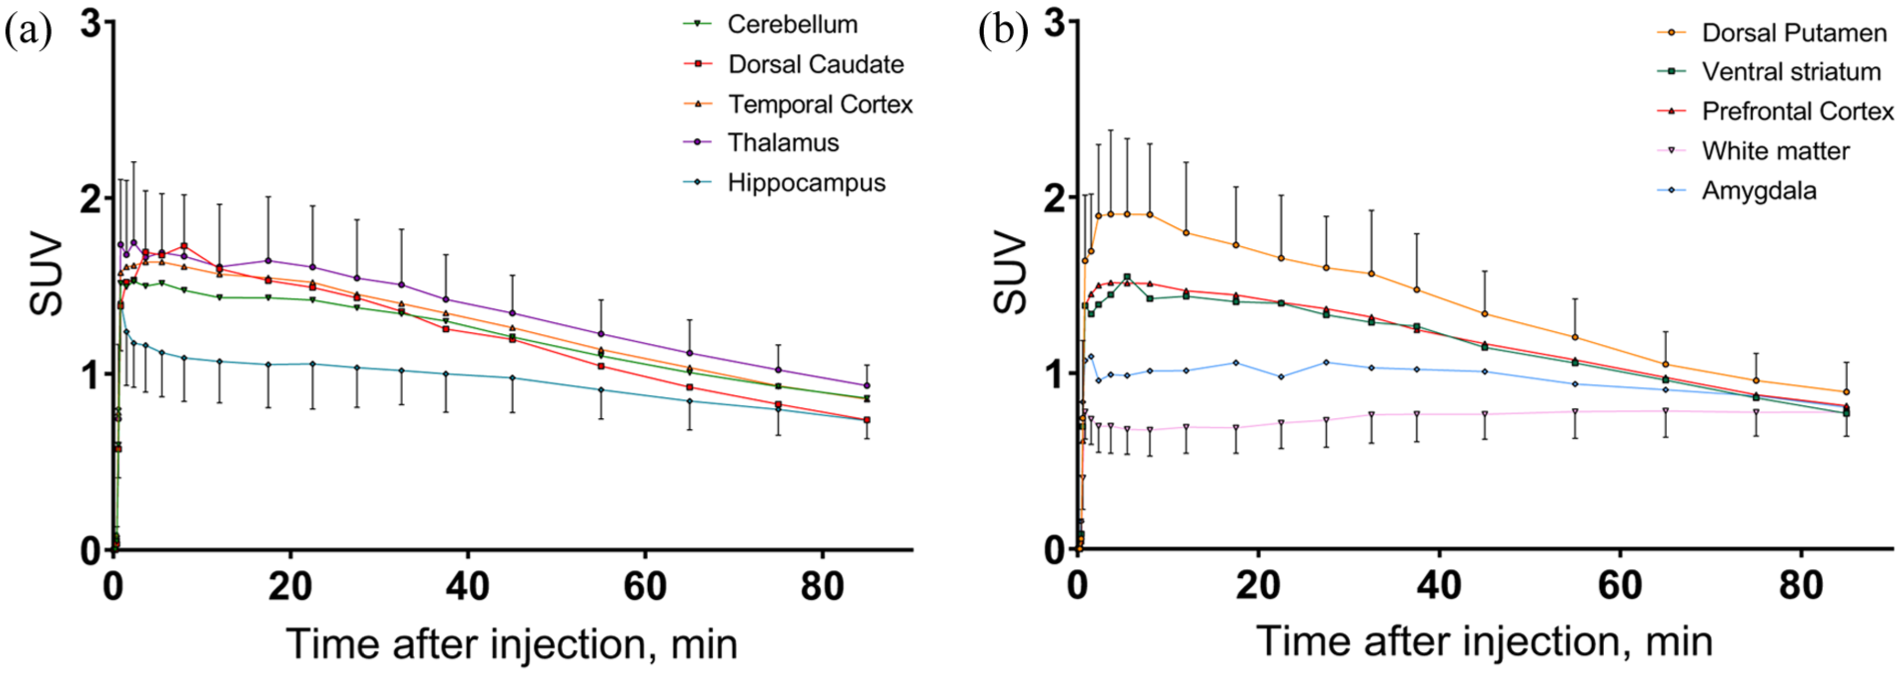
Average (n = 7) regional [18F]TRACK time activity curves: (a) [18F]TRACK time activity curves of cerebellum, dorsal caudate, temporal cortex, thalamus, and hippocampus and (b) [18F]TRACK time activity curves of dorsal putamen, ventral striatum, prefrontal cortex, white matter, and amygdala. Some initial frames were merged for better visualization.
Kinetic analysis
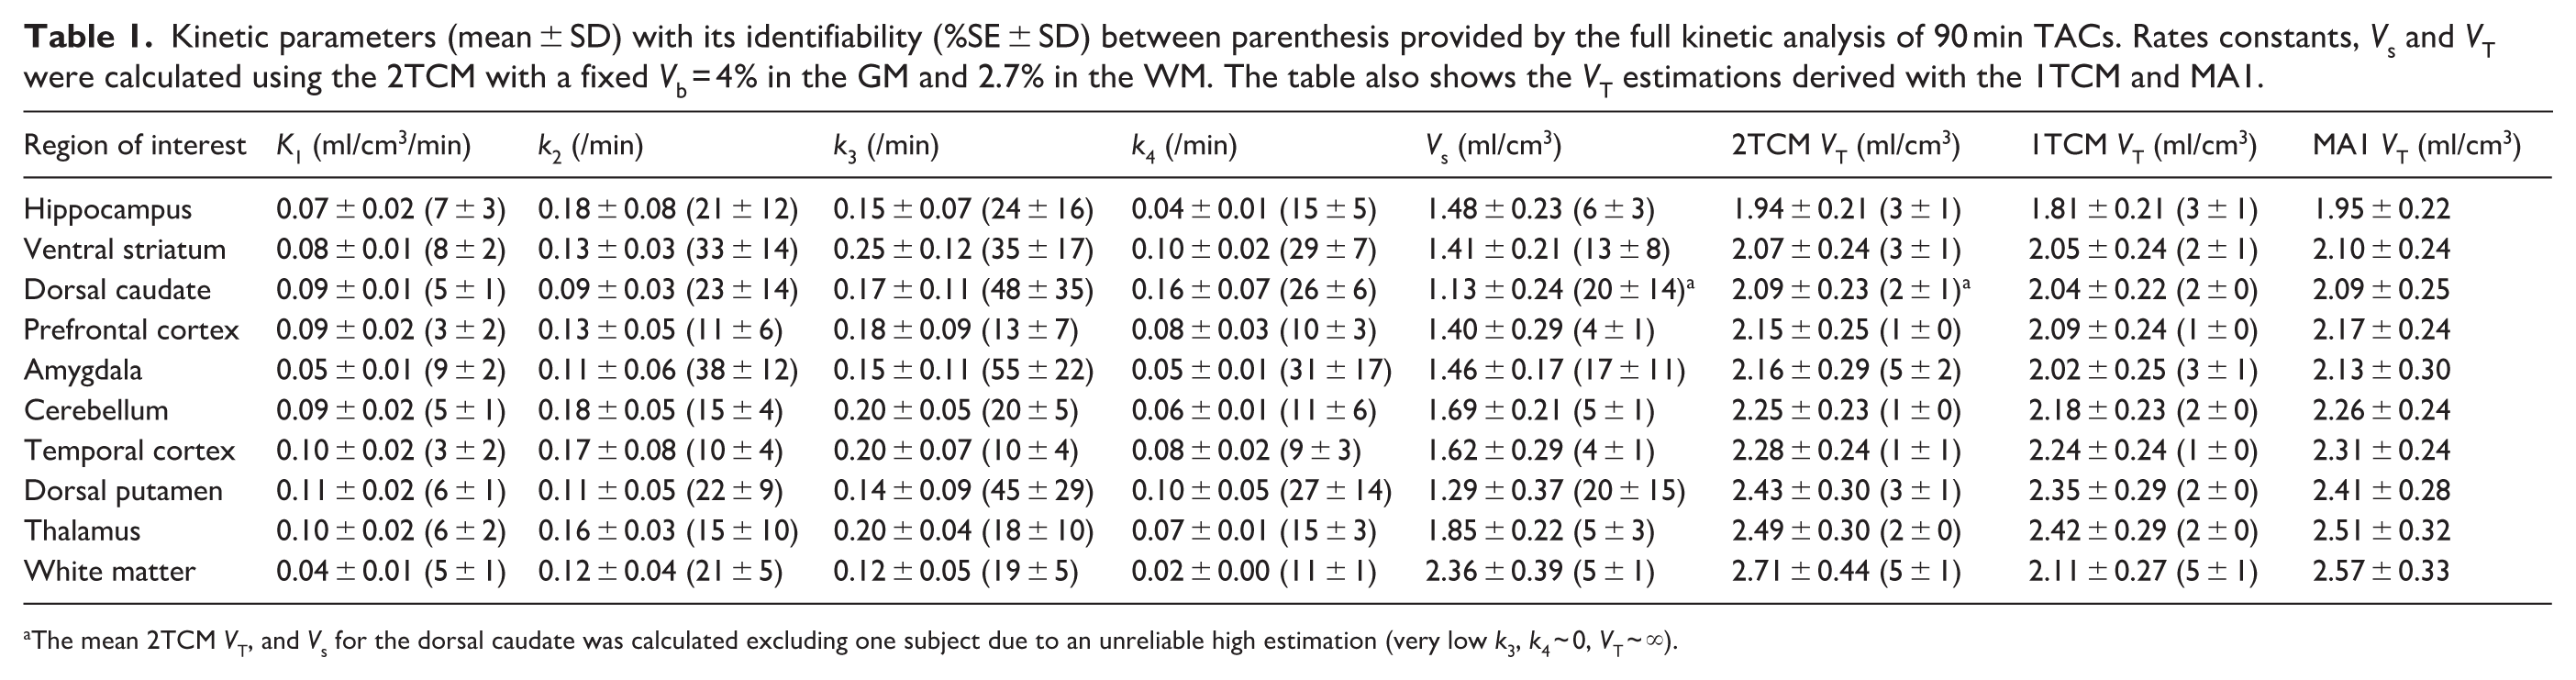
One- and two-tissue compartment models, with both fixed (1TCM and 2TCM) and variable Vb (1TCM-Vb and 2TCM-Vb), were evaluated for fitting the 90 min regional TACs (Tables 1 and S1–S3). While for GM ROIs, there was little difference between the two models (Figure 4), for the WM ROI the 2TCM fits clearly better the TAC than the 1TCM in all the subjects.
Kinetic parameters (mean ± SD) with its identifiability (%SE ± SD) between parenthesis provided by the full kinetic analysis of 90 min TACs. Rates constants, Vs and VT were calculated using the 2TCM with a fixed Vb = 4% in the GM and 2.7% in the WM. The table also shows the VT estimations derived with the 1TCM and MA1.
The mean 2TCM VT, and Vs for the dorsal caudate was calculated excluding one subject due to an unreliable high estimation (very low k3, k4 ~ 0, VT ~ ∞).
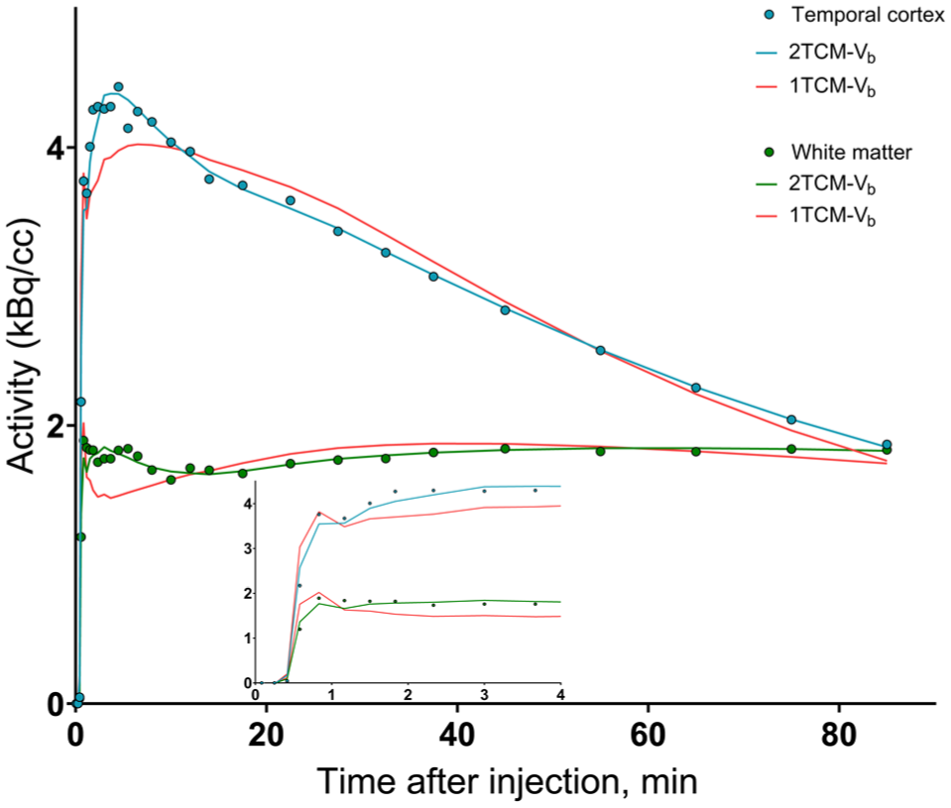
Regional activities in the temporal cortex (blue circles) and white matter (green circles) for a single scan. Solid lines show the best fit with the 1TCM-Vb and 2TCM-Vb. Data points were weighted by activity, frame length, and fluorine-18 decay. The Vb fraction was a variable to be fitted.
Evaluation of TACs using goodness-of-fit criteria using MSC and AIC (see Table S4) revealed two distinct patterns across GM ROIs. For 41 of the 42 ROIs the TACs of the extra-striatal GM ROIs were fit better by the 2TCM than by the 1TCM.
Conversely, for striatal ROIs, the 2TCM only fits better than the 1TCM in three subjects for the caudate and ventral striatum, and in five subjects for the putamen. Statistically the 2TCM did not significantly improve the fit compared to the 1TCM (paired t-test, p > 0.05).
The vascular contribution was evident in many TACs, yet the 2TCM-Vb model yielded results virtually identical to those from the standard 2TCM, with average regional VT values differing by less than 2%. Goodness-of-fit criteria showed no consistent preference for either approach—across ROIs or participants. On average, 2TCM-Vb produced slightly higher MSC values than 2TCM (see Table S4).
VT estimates in GM obtained with the 1TCM were, on average, 1%–7% lower than those derived from the 2TCM. In the dorsal caudate of one subject, the 2TCM yielded unreliable VT (k4 → 0, VT → ∞) and the same happened for the amygdala of another subject when using the 2TCM-Vb. At 90 min post-injection, regional VT demonstrated good identifiability on the GM ROIs (average %SE <6%) and low inter-subject variability (SD/mean <14%) using the 2TCM and excluding the dorsal caudate of one subject mentioned above (Table 1). The rank order of VT was: WM (2.71 ± 0.44 ml/cm3) > thalamus > dorsal putamen > temporal cortex > cerebellar cortex > amygdala > prefrontal cortex > dorsal caudate > ventral striatum > hippocampus (1.94 ± 0.21 ml/cm3; Table 1).
K1 presented good identifiability (%SE ~5% in most of the ROIs) and was low in the GM (~0.1 ml/cm3/min) and very low (0.04 ± 0.01 ml/cm3/min) in the WM. When Vb was fitted, its average value was 4%–5% in the GM areas and 3% in WM. In the extra-striatal ROIs where 2TCM fitted the TACs generally better than 1TCM, Vs showed good identifiability (%SE <10%), with values in the WM (2.27 ± 0.56 ml/cm3) higher than in the GM ROIs (1.3–1.7 ml/cm3). The other rate constants showed low identifiability (high %SE).
In GM ROIs, reducing the scan duration to 60 min decreased VT estimates by less than 5% and did not increase inter-subject variability (Table S5). However, for white matter, VT increases by 11% ± 10% from 60 to 90 min, and although there is no difference in VT between 80 and 90 min, it remains unclear whether equilibrium has been reached by 90 min. Notably, at approximately 70 min post-injection, the tissue-to-plasma ratio reached a plateau (transient equilibrium) for all regions except WM (Figure 5). Its average value between 70 and 90 min (TAC corrected by Vb contribution) correlated very well with VT 90 min (r2 = 0.93) but with an important overestimation of 54% ± 25% across subjects and ROIs (Figure S3).
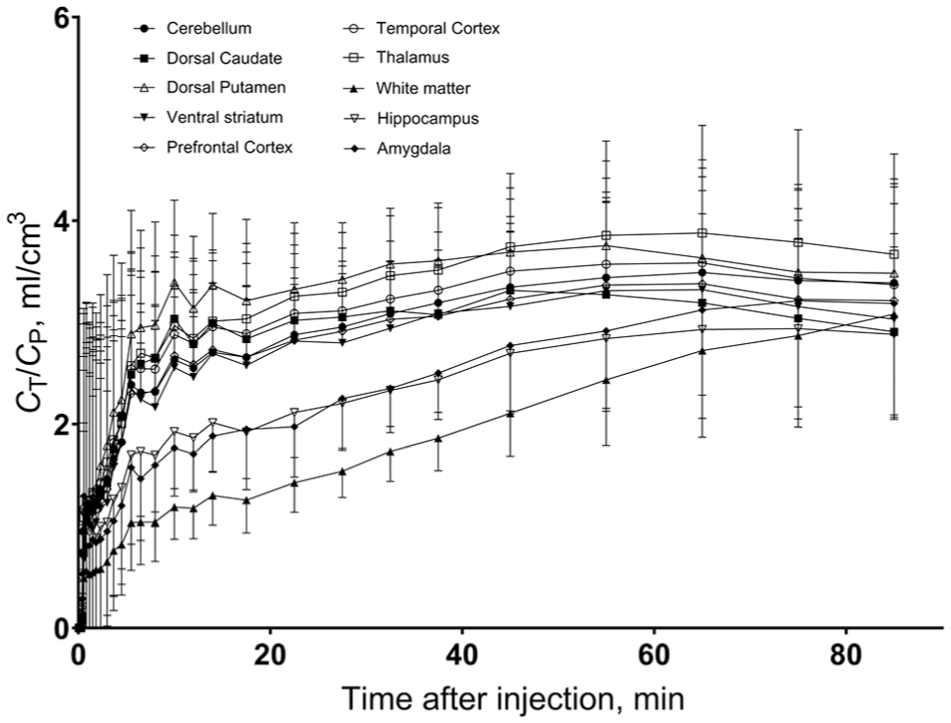
The [18F]TRACK CT/CP ratio across 90 min of scan time. [18F]TRACK reaches a plateau for all regions except the white matter.
Multilinear analysis
MA1 was applied to 90 min TACs to estimate VT using t* = 30 which visually showed good overall fitting across all ROIs. In GM ROIs averages, VT estimates with MA1 at 90 min correlated strongly (r2 = 0.98) with full kinetic model estimates (2TCM) from 90 min data (Figure 6). The inter-subject SD of VT estimates obtained using MA1 was similar to those calculated with 1TCM or 2TCM (Table 1). In WM, however, MA1 with t* = 30 min underestimated VT by 4.6% ± 5.4%.
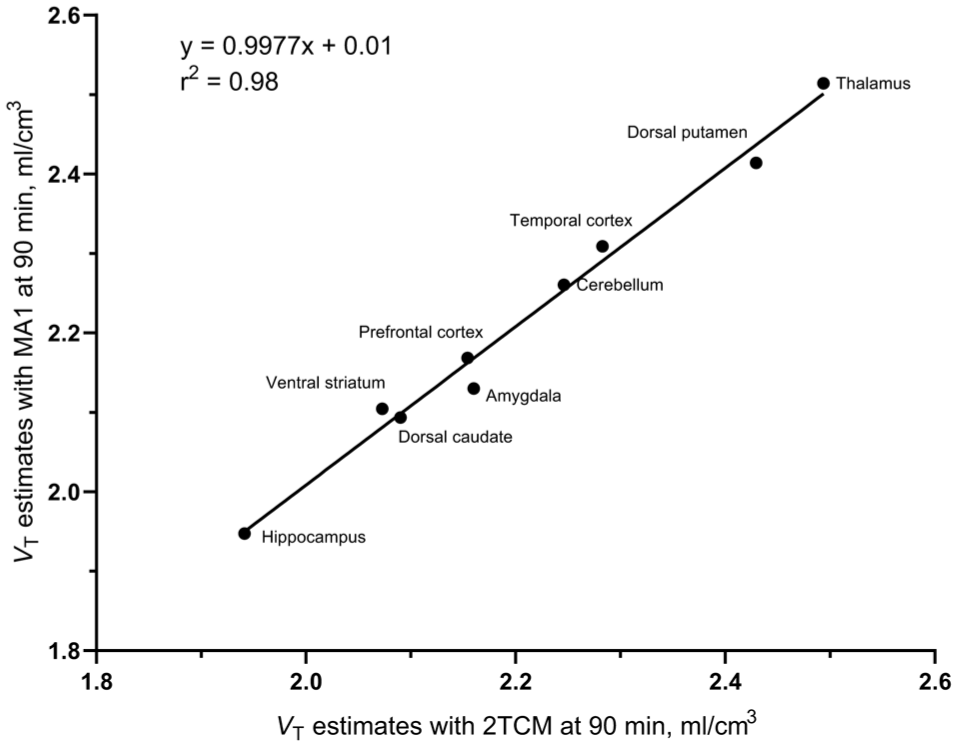
Correlation between VT estimates obtained with MA1 using 90-min data and those derived from 2TCM across gray matter ROIs. Error bars are not shown for clarity (inter-subject CoV ≈ 14% for each ROI). The mean 2TCM VT for the dorsal caudate was calculated excluding one subject due to an unreliable high estimation (VT ~ ∞).
Parametric mapping
Parametric images of VT were generated using Logan graphical analysis (LGA) in the wavelet space, employing a dyadic wavelet transform (DWT) with four levels of decomposition and Battle–Lemarié filters with a kernel size of 22, and t* = 30 min24,25 (Figure S4). In GM ROIs VT, estimates obtained with MA1 correlated strongly with average VT in the parametric map (r2 = 0.91; Figure S5). In ROI based analysis of the WM, t* = 30 is too early for the linearization of the Logan plot, producing an important underestimation of VT and increasing t* results in higher VT estimates. Therefore, the WM area of the parametric plot cannot be considered valid. Indeed, the lower values of this area (Figure S4) reflects values that are inconsistent with those obtained from the 2TCM ROI-based analysis.
Discussion
This work compared different kinetic modeling approaches to quantify [18F]TRACK for estimating TrkB/C expression in the human brain. Consistent with prior findings, 14 [18F]TRACK successfully crossed the BBB and showed a moderate uptake in the brain with SUVs between 1 and 2 across all ROIs. Across gray matter regions, based on the MSC, the two-tissue compartment model (2TCM) yielded superior fits than the 1TCM for 83% of extra-striatal (prefrontal cortex, temporal cortex, thalamus, hippocampus, amygdala, and cerebellum) TACs, whereas it improved fits for only 52% of striatal (dorsal caudate, dorsal putamen, ventral striatum) TACs. WM TACs exhibited slower kinetics than those in gray matter ROIs, and the 2TCM consistently provided a better fit than the 1TCM. In no case did the 2TCM fit yield k4 = 0 and the estimations of VT showed good identifiability (%SE <7%). There is no evidence to suggest the presence of an irreversible binding component with 90 min data. In a single TAC (for the dorsal caudate of one subject) the 2TCM led to unreliable VT. In all the other cases both the 2TCM and the 1TCM, provide VT with excellent identifiability. VT estimates in GM obtained with the 1TCM were, on average, 1%–7% lower than those derived from the 2TCM. The tracer was administered as a rapid manual bolus rather than a short syringe-pump infusion, causing rapid changes in blood and image activity and necessitating shorter, noisier early frames. Consequently, early TAC fitting is less precise. The dispersion-corrected input function was used without additional denoising (Figure 1(b)). Fitting the noisy portion of the input function with a three-exponential model to reduce noise had minimal impact on the estimated VT values. For the 2TCM analysis, the mean difference was −1.4% ± 2.6% for identifiable VT estimates (%SE <50%), whereas for MA1 the mean difference was −0.5% ± 0.8%. A three-tissue compartment model (3TCM) was also evaluated in gray matter ROIs. Of 63 TACs, 3TCM improved MSC in 20 cases, but only nine yielded reliable VT estimates, which were slightly higher (3% ± 2%) than with 2TCM. Thus, although the more complex model can improve fit quality, it does not meaningfully change VT estimates in the few cases where they are reliable. Furthermore, the MA1 method demonstrated a strong correlation with the VT estimates derived from the 2TCM across all ROIs (Figure 6), suggesting its suitability as a reliable alternative for regional quantification of [18F]TRACK uptake without assuming any number of compartments. To determine t* = 30 min, we estimated t* across a range of maximum relative residual error thresholds (5%, 7%, 10%, 12%, and 15%). We then selected an approximate value of t* that represented the minimum time point suitable across all regions analyzed simultaneously. We preferred using a fixed t* rather than a fixed residual error threshold, as some regions are noisier than others, and a uniform error criterion would typically require region-specific adjustment for each ROI. For t* = 20 min, the correlation improved to r2 = 0.99 (Figure S6).
While the 2TCM provides estimates of k2, k3, and k4, these parameters should not be used to infer specific binding in the absence of blocking studies. Their identifiability is low, and the fitted values may reflect local minima of the optimization procedure rather than physiologically meaningful compartmental behavior. Consequently, these estimates may not reliably correspond to the intended tissue compartment classification.
The regional differences in [18F]TRACK VT estimates revealed some degree of binding heterogeneity in the brain, with WM showing the highest VT values. TrkB/C receptors are widely expressed throughout the brain, predominantly localized to neuronal somata and dendrites, and also detected in the axons of hippocampal pyramidal neurons.26–28 Accordingly, WM is not expected to contain a significant density of TrkB/C. Therefore, the higher VT values in WM relative to GM may be attributed to non-specific binding, consistent with the high lipophilicity of the radioligand (logD = 4.23 ± 0.1).
We found a strong correlation between the apparent total distribution volume
For most of the GM ROIs studied, VT converged to within ~−2% to 5% of their final estimates by 60 min post-injection. However, the identifiability of the VT decreases for some ROIs (e.g. hippocampus; Table S5). Notably, reducing the scan duration to 60 min appears feasible for most regions without introducing substantial bias.
Without blocking experiments which are not feasible in healthy control, it is impossible to reliably determine the non-displaceable binding (VND) of the radioligand based solely on the 2TCM. However, a recent preclinical study using in vitro autoradiography evaluated the binding specificity of [18F]TRACK using a homologous blocker (TRACK), reporting up to 79% reduction in binding, 15 consistent with a high proportion of specific binding. In addition, the specificity of [18F]TRACK binding has also been assessed in in-vitro autoradiography using human brain tissue, where co-incubation with pan-Trk and TrkB/C inhibitors resulted in reductions of up to 34% and 36% in the prefrontal cortex and cerebellum, respectively. 11 These observations are further supported by autoradiography studies in human glioblastoma, showing up to 83% specific binding of [18F]TRACK. 15 For some PET tracers (e.g. [18F]FEPPA 30 ), the rate constants estimated by the 2TCM yield an overall good fit to the TACs, yet the first and second compartments do not correspond to non-displaceable and specific binding, respectively. On the condition that that the Vs values in the ROIs fitted by the 2TCM accurately reflect specific binding, this would account for approximately 60%–75% of VT in GM.
The inter-subject variability (coefficient of variation as CoV = SD/mean) was excellent, less than 14%, for GM ROIs even within this heterogenous population (three men and four women; age, 20–61 years). Nevertheless, future studies should include repeated scans in the same individuals (test–retest studies) to assess the reproducibility and stability of kinetic parameters. Additionally, the regional expression of TrkB/C in the human brain remains poorly characterized, and to our knowledge no published report provides a direct reference for receptor density across different regions of the brain. This lack of data limits our ability to determine the proportion of specific versus nonspecific binding in each region and to interpret the physiological significance of the observed VT values. The relative contribution of TrkB versus TrkC to the regional binding of [18F]TRACK remains unknown, as no data is available to distinguish the binding selectivity of this radioligand between these two receptor subtypes in vivo. [18F]TRACK also binds to TrkA, although its Ki is approximately one order of magnitude higher than for TrkB/C and a lower expression of TrkA is expected in the CNS. 11 Therefore, the observed signal should be interpreted as reflecting a combined TrkB/C distribution rather than being specific to one receptor. However, this should not necessarily be viewed as a limitation of the radioligand. For example, widely used PET radioligands binds to both dopamine D2 and D3 receptors, where the signal encompasses both receptor subtypes but still provides valuable insights into dopaminergic neurotransmission and its alterations in disease. 31 In particular [ 11 C]PHNO has been exploited to simultaneously give independent information of both D2 and D3 receptors.32,33 Future studies will be necessary to resolve the individual contributions of TrkB and TrkC to the binding of [18F]TRACK. Additionally, further research should investigate simplified quantification methods for the radioligand, for example, by using an image-derived input function.
In the absence of blocking studies, it is not possible to definitively determine whether a brain region is devoid of specific binding. Because gray matter ROIs reach transient equilibrium with plasma, they are also effectively in equilibrium with one another. Consequently, SUVRs between gray matter ROIs tend to plateau after approximately 70 min. If a suitable gray matter region can be identified as a reference, SUVR can serve as a reliable proxy for quantifying radioligand binding. However, it should be noted that white matter does not achieve transient equilibrium with plasma at 90 min, making it unsuitable as a reference region at earlier time points.
In summary, [18F]TRACK shows promise as a radioligand for TrkB/C imaging in the human brain, with good reversibility properties. VT estimates derived from full kinetic modeling can be used to quantify its regional distribution. However, since 1TCM is sufficient for some GM TACs while others require 2TCM, MA1 with t* = 30, which is independent of the number of compartments, provides a practical alternative for GM regions. While 60 min of scan acquisition with [18F]TRACK is sufficient for full kinetic analysis of GM regions, a 90 min scan may enable the application of alternative pseudo-quantification methods, since the tissue-to-plasma ratio reaches a plateau around 70 min post-injection. However, it remains unclear whether 90-min scan is sufficient to quantify [18F]TRACK in WM. These results position [18F]TRACK as a potential tracer to assess new aspects of a variety of important diseases, already mentioned at the beginning of our paper.
Supplemental Material
sj-pdf-1-jcb-10.1177_0271678X261463956 – Supplemental material for Kinetic modeling of the tropomyosin receptor kinases radioligand [18F]TRACK in human brain with high-resolution positron emission tomography
Supplemental material, sj-pdf-1-jcb-10.1177_0271678X261463956 for Kinetic modeling of the tropomyosin receptor kinases radioligand [18F]TRACK in human brain with high-resolution positron emission tomography by Christian Ramos-Jiménez, Kankana Nisha Aji, Chris Hung-Hsin Hsiao, Vladimir Grouza, Robert Hopewell, Carolin Jaworski, Gassan Massarweh, Jean-Paul Soucy, Daniel Chartrand, Ralf Schirrmacher, Alexey Kostikov, Alexander Thiel and Pablo M Rusjan in Journal of Cerebral Blood Flow & Metabolism
Footnotes
Acknowledgements
The authors would like to express their gratitude to Sharon Shapiro for her outstanding contributions in advancing the clinical study, and to the entire staff of the BIC PET unit for their expertise and dedication.
Author contributions
Research design: RS, AK, AT, and PMR. Performed research: CR-J, AK, AT, and PMR. Acquisition of data: CR-J, KNA, CH-H, RH, VG, DC, AK, and PMR. Data analysis: CR-J and PMR. Manuscript writing: CR-J, AK, AT, and PMR. Critical revision of manuscript: KNA, CH-H, VG, RH, CR-J, DC, GM, J-PS, RS, AK, AT, and PMR. Safety monitoring and supervision: DC, GM, J-PS, AK, and AT. Tracer synthesis: RS.
Funding
The authors disclosed receipt of the following financial support for the research, authorship, and/or publication of this article: This work was supported by an operating grant (PJT169049) from the Canadian Institutes of Health Research to AT and RS, as well as by the New Frontiers in Research Fund—Transformation (NFRF-T) grant (GR026425/GR027195) to RS.
Declaration of conflicting interests
The authors declared no potential conflicts of interest with respect to the research, authorship, and/or publication of this article.
Ethical considerations
This study was approved by the Jewish General Hospital Research Ethics Board and the Montreal Neurological Institute PET Working Committee.
Consent to participate
Written informed consent was obtained from all individuals participants prior to the study.
Consent for publication
Not applicable.
ORCID iDs

Data availability statement
The data supporting the findings of this study are available from the corresponding author upon reasonable request.
Supplemental material
Supplemental material for this article is available online.
References
Supplementary Material
Please find the following supplemental material available below.
For Open Access articles published under a Creative Commons License, all supplemental material carries the same license as the article it is associated with.
For non-Open Access articles published, all supplemental material carries a non-exclusive license, and permission requests for re-use of supplemental material or any part of supplemental material shall be sent directly to the copyright owner as specified in the copyright notice associated with the article.
