






Abstract
Susceptibility alterations in deep gray matter (DGM) across clinical stages of cerebral small vessel disease (CSVD) remain unclear. In this case–control study, we used 7-Tesla magnetic resonance imaging quantitative susceptibility mapping (QSM) with source separation (APART–QSM) to characterize stage-related changes in normal controls, preclinical CSVD, and symptomatic CSVD. Compared with controls, CSVD showed increased QSM in the basal ganglia, particularly the putamen and globus pallidus, whereas small-magnitude QSM reductions were observed in selected thalamic and amygdalar subregions (all p < 0.05). Source separation revealed that basal ganglia abnormalities were mainly associated with increased paramagnetic components, whereas some thalamic alterations may involve increased diamagnetic components, suggesting distinct susceptibility contributions. Lower MoCA scores were associated with higher QSM and paramagnetic values in the globus pallidus, as well as higher diamagnetic values across the thalamus, putamen, and nucleus accumbens (all p < 0.05). Notably, right anterior globus pallidus QSM discriminated symptomatic CSVD from controls with the highest accuracy (AUC = 0.818). These findings reveal DGM susceptibility patterns associated with cognitive impairment, suggesting that 7 T QSM and susceptibility source separation may provide complementary information for early CSVD characterization and future longitudinal evaluation.
Keywords
Introduction
Cerebral small vessel disease (CSVD) is a major cause of vascular cognitive impairment, gait disturbances, mood disorders, and stroke worldwide. It accounts for up to 25% of ischemic strokes and most cases of vascular dementia, imposing a substantial public health and socioeconomic burden, particularly in aging populations. 1 Conventional MRI markers such as white matter hyperintensities (WMH), lacunes, and cerebral microbleeds (CMBs) reflect established CSVD pathology 1 but primarily represent mid- to late-stage structural damage, limiting their sensitivity to early microstructural alterations. Identifying more sensitive imaging biomarkers is therefore essential for early characterization, risk stratification, and future disease monitoring in CSVD.
Cerebral small vessel disease (CSVD) is a diffuse brain disorder that affects not only cerebral white matter but also subcortical gray matter structures, including the caudate nucleus, putamen, globus pallidus, thalamus, hippocampus, and amygdala.2,3 These deep gray matter (DGM) and related subcortical structures play fundamental roles in motor control, cognition, emotional processing, and executive function.3,4 Moreover, they are highly vascularized and are mainly supplied by perforating arterioles and other deep small vessels, making them vulnerable to CSVD-related chronic hypoperfusion, blood–brain barrier dysfunction, and impaired microvascular regulation.5–7 Prior studies have demonstrated increased iron deposition or microstructural degeneration in deep gray matter regions in patients with CSVD, and these alterations have been associated with cognitive impairment and neuropsychiatric symptoms.8,9
Quantitative susceptibility mapping (QSM) derived from gradient-echo MRI quantifies tissue magnetic susceptibility.10,11 However, conventional QSM yields voxel-averaged (net) susceptibility value and cannot disentangle intravoxel sources with opposite signs (e.g. paramagnetic iron and diamagnetic myelin), whose effects may partially cancel each other and lead to ambiguous quantification and interpretation when susceptibility decreases are present. 12 To overcome this mixed-source limitation, susceptibility source-separation and sub-voxel QSM strategies have been developed to decompose the measured susceptibility into paramagnetic and diamagnetic components, thereby improving biological specificity for interpreting susceptibility increases versus decreases.13,14 In this study, we employ APART–QSM, an iterative sub-voxel susceptibility separation method, to estimate paramagnetic and diamagnetic susceptibility components, facilitating more specific characterization of microstructural changes in myelin- and iron-rich deep gray matter nuclei. 13 Most previous QSM studies in CSVD have been conducted using 3 T MRI,2,15,16 but this field strength has inherent limitations in spatial resolution and susceptibility contrast, compromising the precise delineation of small DGM nuclei and the detection of subtle regional microstructural changes.17,18 In contrast, ultra-high-field 7 T MRI provides markedly improved spatial resolution, signal-to-noise ratio, and susceptibility contrast,17,18 substantially enhancing the reliability of QSM for characterizing DGM microstructure.19–21
Methods
Study population
This study was approved by the Ethics Committee of West China Hospital, Sichuan University (approval no. 2024[2001]) and was conducted in accordance with the principles of the Declaration of Helsinki. Given the observational nature of the study, the requirement for written informed consent was waived by the Ethics Committee. Participants were consecutively enrolled between May 2024 and September 2025. Participants were categorized into three groups based on clinical features, MRI characteristics, and Fazekas scores. The NC group (n = 28) consisted of asymptomatic individuals with none or minimal WMH (Fazekas ⩽1). The pCSVD group (n = 24) included asymptomatic individuals with moderate-to-severe WMH (Fazekas ⩾2). The sCSVD (n = 24) comprised individuals with cognitive impairment, gait disturbance, or a history of lacunar stroke or intracerebral hemorrhage, accompanied by moderate-to-severe WMH (Fazekas ⩾2) and additional CSVD markers such as lacunes, cerebral microbleeds, or chronic hemorrhagic lesions. Demographic data, including sex, age, and years of education, were collected for all participants. Clinical assessments included the Montreal Cognitive Assessment (MoCA), Hamilton Anxiety Scale (HAMA), and Hamilton Depression Scale (HAMD). The general exclusion criteria for all participants were: (1) cerebrovascular disease due to large-artery atherosclerosis, cardioembolism, or other specific etiologies; (2) presence of other neurological disorders (e.g. Alzheimer’s disease, Parkinson’s disease, multiple sclerosis) or major psychiatric disorders that could affect cognitive function or white matter; (3) contraindications to MRI; and (4) severe systemic diseases.
MRI acquisition
All MRI examinations were performed on a 7 T scanner (SIGNA 7.0 T; GE HealthCare, Milwaukee, WI, USA) equipped with a 2-channel transmit/32-channel receive head coil (Nova Medical, MA, USA) and a high-performance gradient system (maximum gradient amplitude, 113 mT/m; slew rate, 260 T/m/s).
QSM data were acquired using an axial 3D multi-echo gradient echo (GRE) sequence (susceptibility-weighted angiography (SWAN)) with the following parameters: repetition time (TR) = 26 ms, echo time (TE) = 3.9/8.3/12.7/17.1/21.5 ms, flip angle (FA) = 10°, field of view (FOV) = 222 × 222 mm2, resolution = 0.8 × 0.8 × 0.8 mm3, 180 slices, receiver bandwidth (rBW) = 452.9 Hz/pixel, parallel imaging acceleration factor = 2.5, flow compensation. Anatomical reference images were obtained with a sagittal T1-weighted MPRAGE sequence (TR/TE/TI = 2897.1/3.7/1100 ms, resolution = 0.8 × 0.8 × 0.8 mm3, 200 slices). White-matter hyperintensities were evaluated with a sagittal T2-weighted FLAIR sequence (TR/TE/TI = 6500/119.4/1865 ms, resolution = 0.7 × 0.7 × 0.7 mm3, 200 slices). All subjects underwent the same imaging protocol to ensure consistency across groups.
To characterize the linear relationship between R2* and R2′14,22 for R2′ estimation in susceptibility source separation using APART–QSM, two healthy subjects underwent 3D multi-echo GRE and 2D multi-echo spin-echo (SE) acquisitions. R2* and R2 maps were computed for both subjects using the auto-regression on linear operations (ARLO) algorithm. 23 Image registration was performed based on the first-echo image of each sequence, and the R2 map was registered to the R2* space. R2′ was calculated as R2* − R2. 24 R2* and R2′ values were then extracted from five iron-rich deep nuclei and used to model their linear relationship via least-squares regression. 14
Susceptibility separation and registration
Quantitative susceptibility maps were generated from the complex-valued multi-echo SWAN dataset. First, the 4D magnitude images were temporally averaged to generate a single 3D magnitude volume, which was bias-corrected using AFNI 25 and then subjected to brain extraction with the high-definition brain extraction tool (HD-BET). 26 A brain mask was generated and further refined using AFNI for subsequent analyses. Phase images of individual echoes were unwrapped and echo-combined using the rapid open-source minimum spanning tree algorithm (ROMEO), 27 which provides robust and topology-preserving phase unwrapping. Background field removal was carried out with the variable kernel sophisticated harmonic artifact reduction for phase data (VSHARP) method. 28 Susceptibility dipole inversion was performed by applying the improved sparse linear equation and least-squares (iLSQR) algorithm10,29 to obtain the final QSM images. The ROMEO MATLAB toolbox was accessed at https://github.com/korbinian90/ROMEO, and both VSHARP and iLSQR were implemented using the STI Suite MATLAB toolbox available at https://people.eecs.berkeley.edu/~chunlei.liu/software.html. The recently proposed APART–QSM 13 method was subsequently applied to reconstruct the paramagnetic (χpara) and diamagnetic (χdia) susceptibility maps.
For spatial normalization of QSM images to Montreal Neurological Institute (MNI) space, a multi-step registration approach was performed using FSL (https://fsl.fmrib.ox.ac.uk/fsl/). First, the previously generated single 3D SWAN magnitude volume was linearly co-registered to the T1-weighted MPRAGE volume using FSL’s flirt. T1-weighted MPRAGE was then non-linearly normalized to the MNI152 template using FSL’s flirt and fnirt. The transformation matrices obtained from these two registration steps were applied directly to the QSM images to warp them into MNI space, minimizing resampling artifacts and preserving susceptibility values. The χpara and χdia maps were also similarly registered to MNI space. The overall processing workflow is illustrated in Figure 1. All intermediate registration steps and ROI overlays were visually inspected to ensure accurate anatomical alignment.
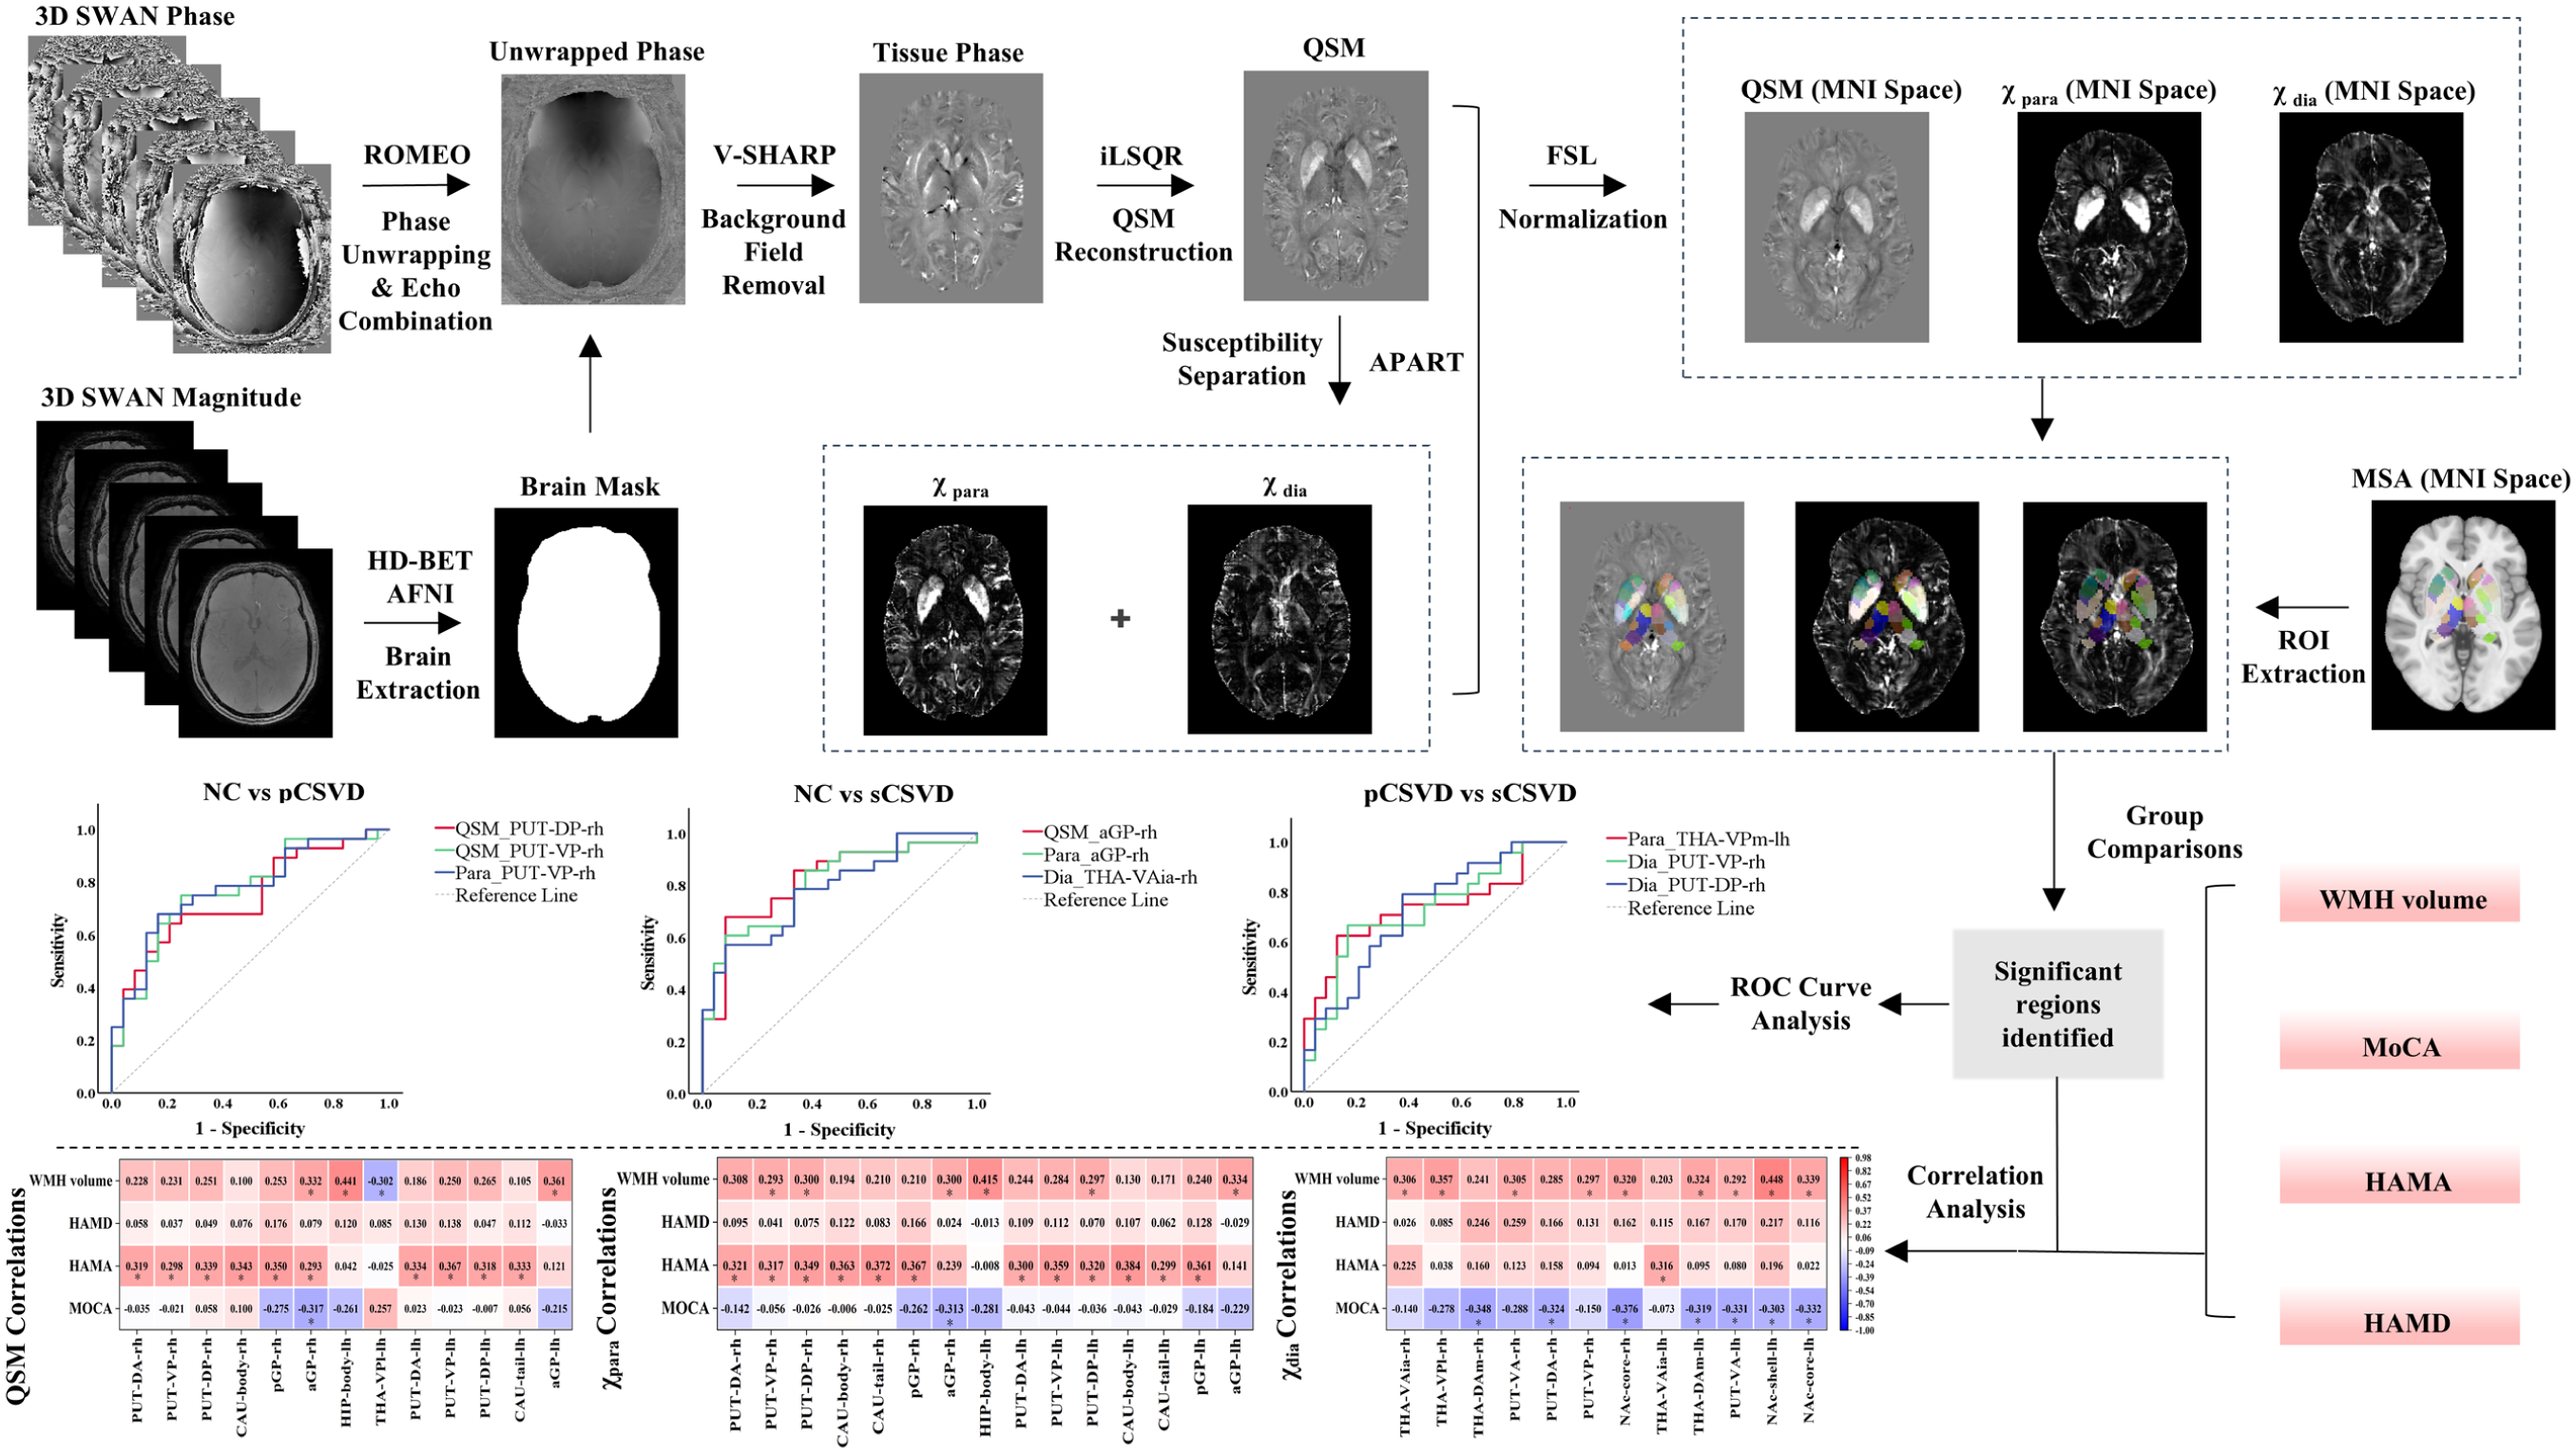
Overview of the image processing and analysis pipeline. This flowchart summarizes the complete processing and analysis pipeline based on 7.0-T multi-echo SWAN data. First, raw data underwent preprocessing, including brain tissue extraction using HD-BET, phase unwrapping and echo combination using ROMEO, background field removal using V-SHARP, and reconstruction of QSM using the iLSQR method. QSM was then separated into Para and Dia components using the APART algorithm. The resulting QSM, Para, and Dia maps were normalized to MNI space, and DGM nuclei were extracted as ROIs to obtain regional susceptibility values. Finally, these processed measures were used for group comparisons (NC vs pCSVD, NC vs sCSVD, and pCSVD vs sCSVD), correlation analyses with clinical variables, including MoCA, HAMA, HAMD, and WMH volume, and exploratory ROC analyses to assess discriminative performance.
Deep gray matter segmentation and susceptibility quantification
DGM regions of interest (ROIs) were defined in MNI space using the Melbourne Subcortex Atlas. 30 The same atlas-derived masks were applied to the normalized QSM, χpara, and χdia maps to extract mean values from bilateral subcortical nuclei, including the thalamus, caudate, putamen, pallidum, hippocampus, amygdala, and nucleus accumbens, as well as their corresponding subregions.
WMH segmentation and lesion quantification
White matter hyperintensities (WMH) were segmented using the Lesion Growth Algorithm (LGA) implemented in the Lesion Segmentation Toolbox (LST) for SPM (https://www.applied-statistics.de/lst.html). LGA integrates T1-weighted MPRAGE and T2-weighted FLAIR images to generate an initial lesion belief map, which is subsequently refined through an iterative growth model to obtain a WMH probability map. For each subject, a κ-threshold of 0.3 was applied to convert the probability map into a binary WMH mask. All automatically generated WMH masks were then visually inspected and manually corrected when necessary by an experienced neurologist to remove false positives and optimize lesion boundary accuracy. The WMH volume was finally calculated from the manually corrected binary masks.
Statistical analysis
All statistical analyses were performed using IBM SPSS Statistics 26.0. Data visualization was carried out using GraphPad Prism 9.0 and Origin software. A two-sided p < 0.05 was considered statistically significant. For demographic and clinical characteristics, all continuous variables were expressed as median (interquartile range (IQR)), given their non-normal distribution. Categorical variables were presented as frequencies (percentages). Group comparisons were conducted using the Kruskal–Wallis H test for continuous variables. Categorical variables were compared using the chi-square test. All significant group differences were further investigated with Bonferroni-corrected post-hoc pairwise comparisons. For statistically significant pairwise comparisons, the Hodges–Lehmann (HL) estimate and its 95% confidence interval (CI) were reported as non-parametric effect-size measures.
Associations between clinical variables and various imaging metrics, including paramagnetic, diamagnetic, and QSM values, were assessed using Spearman’s rank correlation analysis. Correlation coefficients (r) and p values are reported. To account for multiple comparisons, the false discovery rate (FDR) method was applied to correct the p values, and adjusted p < 0.05 was considered statistically significant. Finally, to evaluate the exploratory discriminative performance of the imaging metric that showed the most significant between-group differences in discriminating between various stages of CSVD, a receiver operating characteristic (ROC) curve analysis was further performed for this specific metric. The area under the curve (AUC), standard error (SE), 95% confidence interval (CI), and p value were calculated.
Results
Baseline characteristics
A total of 76 participants were enrolled: 28 with NC, 24 with pCSVD, and 24 with sCSVD. Demographic and clinical characteristics are summarized in Table 1. No significant differences were found among the three groups in age (p = 0.651), sex (p = 0.488), or education (p = 0.232).
Demographic and clinical characteristics of study participants.

NC: normal controls; pCSVD: preclinical cerebral small vessel disease; sCSVD: symptomatic cerebral small vessel disease; MoCA: Montreal Cognitive Assessment; HAMA: Hamilton Anxiety Rating Scale; HAMD: Hamilton Depression Rating Scale; WMH: white matter hyperintensities.
Data are presented as median (interquartile range) for continuous variables and n (%) for categorical variables. Group comparisons were performed using the Kruskal–Wallis H test for continuous variables and the chi-square test for categorical variables.
p < 0.05 was considered statistically significant.
Significant group differences were observed in cognitive and neuropsychiatric measures. MoCA scores differed significantly across groups (p < 0.001), with median scores of 27.00 (IQR: 2.75), 22.00 (IQR: 7.25), and 19.00 (IQR: 13.50) in the NC, pCSVD, and sCSVD groups, respectively. Scores on both the anxiety (HAMA, p = 0.029) and depressive (HAMD, p = 0.048) scales were significantly elevated in the CSVD groups than in NC. WMH volume differed significantly across groups (p < 0.001), with median values of 1.53 ml (IQR: 1.77), 5.63 ml (IQR: 3.61), and 13.43 ml (IQR: 34.61) in the NC, pCSVD, and sCSVD groups, respectively.
Regional QSM alterations in subcortical nuclei
Region-of-interest (ROI) analysis revealed significant alterations in QSM values across bilateral subcortical nuclei, particularly in the putamen, globus pallidus (GP), and thalamus regions (Table S1 and Figure 2).

Comparison of regional QSM values among groups in the right and left hemispheres: (a) ROI-averaged QSM values of subcortical nuclei in the right hemisphere among the NC, pCSVD, and sCSVD groups and (b) ROI-averaged QSM values of corresponding regions in the left hemisphere among the NC, pCSVD, and sCSVD groups. Group comparisons were performed using the Kruskal–Wallis H test, followed by Dunn’s post-hoc test with Bonferroni correction.
Bilateral dorsal anterior putamen (PUT-DA), ventral posterior putamen (PUT-VP), and dorsal posterior putamen (PUT-DP) subregions showed significant differences compared to the NC group in either the pCSVD or sCSVD groups (all p < 0.05). The largest difference between the NC and pCSVD groups was observed in the right PUT-VP (HL = +25.459 ppb, 95% CI: 10.837–42.348 ppb, p = 0.003). Compared with the NC group, the sCSVD group exhibited significantly elevated QSM values in the bilateral anterior GP (aGP), including the right aGP (HL =+46.557 ppb, 95% CI: 22.882–89.581 ppb, p < 0.001) and left aGP (HL = +32.463 ppb, 95% CI: 11.715–61.524 ppb, p = 0.007).
Small-magnitude but statistically lower QSM values were observed in selected thalamic and amygdalar subregions. The right ventral anterior intralaminar posterior thalamus (THA-VAip) showed lower QSM values in the sCSVD group than in the NC group (HL = −7.288 ppb, 95% CI: −12.770 to −1.742 ppb, p = 0.030). The left ventral posterolateral thalamus (THA-VPl) also showed lower QSM values in both the pCSVD group (HL = −5.959 ppb, 95% CI: −10.511 to −2.163 ppb, p = 0.026) and the sCSVD group (HL = −8.586 ppb, 95% CI: −15.019 to −3.154 ppb, p = 0.004) compared with the NC group. Similarly, the right lateral amygdala (lAMY) and right medial amygdala (mAMY) showed lower QSM values in the sCSVD group (right lAMY: HL = −7.897 ppb, 95% CI: −15.371 to −1.721 ppb, p = 0.037; right mAMY: HL = −11.018 ppb, 95% CI: −19.988 to −3.007 ppb, p = 0.016).
Regional alterations in paramagnetic and diamagnetic susceptibility source values
Analysis of the separated susceptibility sources, hereafter referred to as paramagnetic and diamagnetic source values, showed group-level differences in multiple subcortical regions.
Compared with the NC group, regions with increased paramagnetic source values in the sCSVD group included the bilateral aGP (right: HL = +49.835 ppb, 95% CI: 23.912–98.420 ppb, p < 0.001; left: HL = +33.071 ppb, 95% CI: 11.437–69.197 ppb, p = 0.007), bilateral pGP (right: HL = +31.284 ppb, 95% CI: 15.508–50.866 ppb, p < 0.001; left: HL = +19.704 ppb, 95% CI: 3.919–35.029 ppb, p = 0.032), and the bilateral caudate body (CAU-body; right: HL = +12.788 ppb, 95% CI: 1.674–30.437 ppb, p = 0.049; left: HL = +12.860 ppb, 95% CI: 3.369–25.090 ppb, p = 0.020) and caudate tail (CAU-tail; right: HL = +12.712 ppb, 95% CI: 4.923–21.070 ppb, p = 0.006; left: HL = +11.604 ppb, 95% CI: 3.419–20.868 ppb, p = 0.012). Compared with the NC group, regions with increased paramagnetic source values in the pCSVD group included the right CAU-body (HL = +13.301 ppb, 95% CI: 3.181–24.698 ppb, p = 0.026), right CAU-tail (HL = +9.116 ppb, 95% CI: 1.806–16.917 ppb, p = 0.044), and the right nucleus accumbens core (NAc-core; HL = +8.803 ppb, 95% CI: 2.211–16.043 ppb, p = 0.030). Direct comparisons between the pCSVD and sCSVD groups showed differences in the bilateral dorsal anterior lateral thalamus (THA-DAl; right: HL =+5.404 ppb, 95% CI: 0.975–10.664 ppb, p = 0.043; left: HL = +4.938 ppb, 95% CI: 1.070–9.696 ppb, p = 0.039) and the left ventral posteromedial thalamus (THA-VPm; HL = +3.452 ppb, 95% CI: 1.205–6.164 ppb, p = 0.021; Table S2 and Figure 3(a) and (b)).

Comparisons of paramagnetic and diamagnetic susceptibility source values among groups in the right and left hemispheres: (a) ROI-averaged paramagnetic susceptibility source values in the right hemisphere among the NC, pCSVD, and sCSVD groups, (b) ROI-averaged paramagnetic susceptibility source values in the left hemisphere among the NC, pCSVD, and sCSVD groups, (c) ROI-averaged diamagnetic susceptibility source values in the right hemisphere among the NC, pCSVD, and sCSVD groups, and (d) ROI-averaged diamagnetic susceptibility source values in the left hemisphere among the NC, pCSVD, and sCSVD groups. Absolute values are shown in the figures. Group comparisons were performed using the Kruskal–Wallis H test, followed by Dunn’s post-hoc test with Bonferroni correction.
Diamagnetic source values were higher in the sCSVD group compared to the NC group across multiple thalamic nuclei (right THA-VAip, bilateral THA-Vaia, bilateral THA-VPl, bilateral THA-Dam, and left THA-Vas), bilateral putaminal subregions (PUT-VA, PUT-DA, PUT-VP, and PUT-DP), the right mAMY, and the bilateral nucleus accumbens core (Nac-core; all p < 0.05). In the right PUT-VP (HL = +4.232 ppb, 95% CI: 1.281–7.546 ppb, p = 0.021) and PUT-DP (HL = +2.993 ppb, 95% CI: 0.589–6.204 ppb, p = 0.033) subregions, diamagnetic source values in the sCSVD group were higher than those in the pCSVD group. Compared with the NC group, no brain regions showed statistically significant differences in diamagnetic source values in the pCSVD group (Table S3 and Figure 3(c) and (d)).
Correlation analysis
Spearman correlation analyses revealed significant associations between clinical variables and susceptibility-based neuroimaging metrics across multiple subcortical brain regions after FDR correction (Table 2).
Correlation matrices between clinical variables and susceptibility metrics in both hemispheres.

FDR: false discovery rate; rh: right hemisphere; lh: left hemisphere.
Spearman’s rank correlation coefficients (r) are shown. p values were corrected using the FDR method.
FDR-adjusted p < 0.05. **FDR-adjusted p < 0.01.
MoCA scores were correlated with susceptibility metrics in several brain regions. Lower MoCA scores were associated with higher QSM values in the right aGP (r = −0.317, p < 0.05) and higher paramagnetic values in the right aGP (r = −0.313, p < 0.05). For diamagnetic sources, lower MoCA scores were associated with higher values in the right THA-DAm (r = −0.348, p < 0.05), right PUT-DA (r = −0.324, p < 0.05), right NAc-core (r = −0.376, p < 0.05), left THA-DAm (r = −0.319, p < 0.05), left PUT-VA (r = −0.331, p < 0.01), left NAc-shell (r = −0.303, p < 0.05), and left NAc-core (r = −0.332, p < 0.05).
Higher HAMA scores were associated with higher QSM values in the bilateral putamen (right PUT-DA: r = 0.319, p < 0.05; right PUT-VP: r = 0.298, p < 0.05; right PUT-DP: r = 0.339, p < 0.05; left PUT-DA: r = 0.334, p < 0.05; left PUT-VP: r = 0.367, p < 0.05; left PUT-DP: r = 0.318, p < 0.05), caudate nucleus (right CAU-body: r = 0.343, p < 0.05; left CAU-tail: r = 0.333, p < 0.05), and globus pallidus (right pGP: r = 0.350, p < 0.05; right aGP: r = 0.293, p < 0.05). For paramagnetic sources, higher HAMA scores were associated with higher values in the putamen (right PUT-DA: r = 0.321, p < 0.05; right PUT-VP: r = 0.317, p < 0.05; right PUT-DP: r = 0.349, p < 0.05; left PUT-DA: r = 0.300, p < 0.05; left PUT-VP: r = 0.359, p < 0.05; left PUT-DP: r = 0.320, p < 0.05), caudate nucleus (right CAU-body: r = 0.363, p < 0.05; right CAU-tail: r = 0.372, p < 0.05; left CAU-body: r = 0.384, p < 0.05; left CAU-tail: r = 0.299, p < 0.05), and globus pallidus (right pGP: r = 0.367, p < 0.05; left pGP: r = 0.361, p < 0.05). For diamagnetic sources, higher HAMA scores were associated with higher values in the left THA-VAia (r = 0.316, p < 0.05). HAMD scores showed no significant correlations with QSM or paramagnetic susceptibility metrics.
Higher WMH volume was associated with higher QSM values in the right aGP (r = 0.332, p < 0.05), left HIP-body (r = 0.441, p < 0.01), and left aGP (r = 0.361, p < 0.05), and with lower QSM values in the left THA-VPl (r = −0.302, p < 0.05). For paramagnetic sources, higher WMH volume was associated with higher values in the right PUT-DA (r = 0.308, p < 0.05), right PUT-VP (r = 0.293, p < 0.05), right PUT-DP (r = 0.300, p < 0.05), right aGP (r = 0.300, p < 0.05), left HIP-body (r = 0.415, p < 0.05), left PUT-DP (r = 0.297, p < 0.05), and left aGP (r = 0.334, p < 0.05). For diamagnetic sources, higher WMH volume was associated with higher values in the right THA-VAia (r = 0.306, p < 0.05), right THA-VPl (r = 0.357, p < 0.05), right PUT-VA (r = 0.305, p < 0.05), right PUT-VP (r = 0.297, p < 0.05), right NAc-core (r = 0.320, p < 0.05), left THA-DAm (r = 0.324, p < 0.05), left PUT-VA (r = 0.292, p < 0.05), left NAc-shell (r = 0.448, p < 0.01), and left NAc-core (r = 0.339, p < 0.05).
ROC analysis
ROC curve analysis was performed to evaluate the performance of QSM and separated susceptibility source metrics in distinguishing among the NC, pCSVD, and sCSVD groups. For discriminating NC from pCSVD (Figure 4(a)), the paramagnetic source-based PUT-VP yielded the highest AUC (AUC = 0.775, SE = 0.065, p = 0.001, 95% CI: 0.648–0.902). For discriminating NC from sCSVD (Figure 4(b)), the QSM-based aGP yielded the highest AUC (AUC = 0.818, SE = 0.060, p < 0.001, 95% CI: 0.700–0.937). For discriminating pCSVD from sCSVD (Figure 4(c)), the paramagnetic source-based THA-VPm yielded the highest AUC (AUC = 0.736, SE = 0.074, p = 0.005, 95% CI: 0.590–0.882).

ROC analysis: (a) ROC curve for discriminating NC from pCSVD, (b) ROC curve for discriminating NC from sCSVD, and (c) ROC curve for discriminating pCSVD from sCSVD.
Discussion
This study used 7 T ultra-high-field MRI to evaluate QSM and separated susceptibility source metrics in subcortical nuclei across different stages of CSVD. We observed region-specific susceptibility alterations across the subcortical nuclei, with QSM increases mainly observed in subregions such as the putamen and globus pallidus, whereas QSM decreases were identified in selected thalamic and amygdalar subregions. It should be noted that QSM-derived susceptibility signals reflects the combined effect of multiple susceptibility sources rather than serving as a direct marker of a single tissue component. Brain tissue susceptibility is jointly influenced by paramagnetic components, such as ferritin, hemosiderin, and deoxyhemoglobin, and diamagnetic components, such as myelin, and calcium. 11 Therefore, net QSM alone is insufficient to determine the dominant source of susceptibility alterations across different brain regions. In this study, we further separated paramagnetic and diamagnetic sources to provide a more detailed interpretation of the potential biophysical basis underlying net QSM changes in DGM nuclei.
Consistent with increased QSM, paramagnetic source values were elevated in multiple putaminal subregions (PUT-DA, PUT-VP, and PUT-DP) in both pCSVD and sCSVD. In sCSVD, increased paramagnetic sources further extended to the globus pallidus (aGP and pGP) and the body and tail of the caudate nucleus. The concordant increases in QSM and paramagnetic sources indicate that susceptibility elevation in the basal ganglia is mainly driven by paramagnetic components. Previous studies have shown that iron is the major source of susceptibility in deep gray matter regions. 31 However, in the context of CSVD, this iron-dominated paramagnetic alteration should not be simply interpreted as pure tissue iron deposition, but may instead reflect the combined effects of multiple pathological processes. CSVD is characterized by microvascular endothelial dysfunction, blood–brain barrier disruption, chronic hypoperfusion, impaired cerebrovascular reactivity and autoregulation, and neuroinflammatory responses.6,7,32,33 These alterations may collectively enhance paramagnetic susceptibility signals through several mechanisms, including cerebral microbleeds and deposition of hemoglobin degradation products,9,34 blood–brain barrier-related iron leakage or impaired iron clearance,35–37 and CSVD-related hemodynamic disturbances that may influence local deoxyhemoglobin concentration through altered oxygen extraction and tissue oxygenation.38,39 Therefore, the increased paramagnetic sources observed in this study should be regarded as an integrated imaging phenotype reflecting iron-related components, blood degradation products, blood–brain barrier-associated iron dysregulation, and CSVD-related hemodynamic abnormalities.
While QSM increased in multiple basal ganglia subregions, net QSM decreases were observed in several thalamic and amygdalar subregions. Small but statistically significant changes were detected in the right THA-VAip, left THA-VPl, and the right lAMY and mAMY. Based on net QSM alone, such decreases could easily be interpreted as a reduction in paramagnetic burden. However, source separation provided more detailed information for interpreting the origin of net QSM changes: in patients with sCSVD, diamagnetic source values were increased in these regions. Thus, decreased net QSM does not necessarily indicate a reduction in paramagnetic substances, but may also be driven by increased diamagnetic components. Calcification is an important diamagnetic source and usually appears as a negative susceptibility signal on QSM. 40 Previous studies have reported age-related calcification in the basal ganglia, with its prevalence increasing with age. 41 Kumar et al. used 9.4 T ultra-high-field QSM to perform fine nucleus-level susceptibility quantification of the thalamus and found that diamagnetic contributions in the thalamus were significantly higher than those in the caudate nucleus, putamen, and globus pallidus. This diamagnetic signal was mainly attributed to the abundance of calcium-binding proteins in the thalamus, such as parvalbumin and calretinin, as well as the large number of myelinated fibers within and around thalamic nuclei. 42 In the context of the core pathological mechanisms of CSVD, including endothelial dysfunction, blood–brain barrier leakage, and chronic hypoperfusion, 43 blood–brain barrier disruption may lead to extravasation of plasma components and disturbance of local calcium homeostasis, theoretically promoting calcium salt microdeposition around microvessels or within the interstitial space.44,45 Therefore, the increased diamagnetic source values in these thalamic and amygdalar subregions suggest that CSVD-related involvement of subcortical nuclei may not be limited to iron-related changes in the basal ganglia, but may also involve abnormal diamagnetic signals in the thalamo-limbic system associated with calcium-related components, myelinated fiber structures, blood–brain barrier injury, and alterations in the local tissue microenvironment.
In addition, susceptibility source separation revealed effects that were partly masked in net QSM. In sCSVD, net QSM alterations were confined to a limited number of thalamic subregions, whereas diamagnetic source values showed significant differences across a broader thalamic extent. Meanwhile, increased paramagnetic source values were observed in certain nuclei, such as the right THA-DAl and left THA-VPm. These findings may suggest region-specific and heterogeneous remodeling of paramagnetic and diamagnetic components. Because these two components contribute to net QSM in opposite directions, their synchronous or asynchronous changes may counterbalance each other in net QSM, thereby obscuring underlying pathological alterations. Susceptibility source separation may help identify such component-cancellation effects and reveal abnormalities that are difficult to detect using net QSM alone. 24 Nevertheless, susceptibility source separation techniques, such as χ-separation and APART–QSM, are still under active development. Previous studies have validated these methods using simulations, phantom experiments, ex vivo animal brains, and in vivo human brains, supporting their ability to separate paramagnetic and diamagnetic susceptibility sources mainly related to iron and myelin.13,24 Recent applications in multiple sclerosis further suggest their potential for characterizing lesion iron accumulation, myelin loss, and remyelination-related changes,46,47 and normative χ-separation atlases have been established in healthy human brains. 48 Susceptibility separation has also been explored for estimating cerebral oxygenation by isolating paramagnetic components related to deoxyhemoglobin. 49 However, despite these advances, the in vivo specificity of these techniques for distinguishing broader microstructural components such as calcification, protein deposition, and microvascular oxygenation changes remains incompletely established.
Importantly, the magnitude of the observed susceptibility differences should be interpreted in relation to the known precision limits of susceptibility source separation. A recent test–retest study of susceptibility source separation methods reported region- and pipeline-dependent repeatability for APART-based separation, with repeatability coefficients of approximately 4 ppb on average and approximately 7 ppb for paramagnetic maps in iron-rich regions. 50 Therefore, small-magnitude differences of only a few ppb, particularly some diamagnetic or thalamic source-separated findings, should be interpreted cautiously and regarded as exploratory group-level observations rather than definitive tissue-level changes.
Further analysis revealed systematic associations between DGM magnetic susceptibility abnormalities and clinical manifestations, including cognitive symptoms, emotional disturbances, and WMH burden. First, MoCA scores showed significant negative correlations with elevated QSM values and paramagnetic sources in the globus pallidus, particularly in the right anterior and posterior segments. This suggests that basal ganglia abnormalities characterized by increased paramagnetic components may contribute to the cognitive phenotype of CSVD. Recent QSM studies in CSVD have similarly reported associations between basal ganglia iron deposition and cognitive decline, and have proposed a partial mediating role of iron between vascular risk factors and cognitive outcomes. These findings support the view that microstructural abnormalities within the basal ganglia are closely associated with CSVD severity and cognitive impairment. 51 In addition, MoCA scores were negatively correlated with diamagnetic source values across multiple subcortical regions, including the thalamus, putamen, and nucleus accumbens in both hemispheres. This indicates that widespread abnormalities in diamagnetic-related components may co-occur with cognitive impairment.
CSVD is also associated with diverse neuropsychiatric symptoms (depression, anxiety, apathy, affective lability, fatigue) that relate to WMH burden and overall CSVD severity, despite substantial heterogeneity across symptom domains. 52 In this study, HAMA scores showed widespread positive correlations with QSM and paramagnetic source values in the basal ganglia-caudate system, including the putamen, caudate nucleus, and globus pallidus. This pattern is consistent with neurocircuit models implicating cortico-basal ganglia–thalamic loops in emotional and anxiety regulation. 53 It provides neurobiological support for a pathway linking iron-related paramagnetic abnormalities, circuit dysfunction, and anxiety symptoms.
ROC analysis indicated that susceptibility-related metrics in subcortical nuclei may provide complementary information for CSVD staging and reveal stage-specific patterns of regional involvement. It should be emphasized that QSM is not intended to replace WMH assessment, but rather to provide an additional dimension for characterizing CSVD severity by capturing susceptibility-related abnormalities in deep gray matter. Although this study was cross-sectional, regions showing significant between-group differences or relatively good discriminatory performance, such as the putamen, globus pallidus, and selected thalamic nuclei, may serve as candidate targets for future longitudinal QSM and susceptibility source separation studies. Further studies should evaluate whether baseline susceptibility metrics and their follow-up changes in these regions are associated with WMH progression, cognitive decline, neuropsychiatric symptom evolution, or conversion from pCSVD to sCSVD. The test-retest reliability, annualized change rates, minimal detectable changes, and prognostic value of these metrics should also be systematically established to determine their feasibility as longitudinal imaging biomarkers of CSVD.
Limitations
Several limitations should be acknowledged. First, the sample size was modest, and subgroup sizes were relatively small, which may have reduced statistical power. Second, the cross-sectional design precludes conclusions regarding longitudinal susceptibility changes or causal relationships between susceptibility alterations and clinical manifestations. Third, the lack of histopathological confirmation or peripheral iron-related biomarkers limited the pathophysiological interpretation of the findings. Fourth, the APART–QSM calibration relied on only two healthy controls, which may limit its robustness and generalizability. Fifth, susceptibility quantification was performed using atlas-based ROI definitions in MNI space rather than subject-specific segmentation. Although a high-dimensional nonlinear registration framework was applied and all registration results were visually inspected to ensure satisfactory anatomical alignment, CSVD is frequently accompanied by brain atrophy and structural alterations that may affect spatial normalization. Therefore, subtle registration inaccuracies and partial volume effects, particularly at the boundaries of small deep gray matter nuclei, cannot be completely excluded. Finally, cortical regions and whole-brain voxel-wise susceptibility patterns were not assessed. Given the diffuse nature of CSVD, extending QSM analyses beyond predefined subcortical regions to cortical and whole-brain levels may help capture more widespread susceptibility alterations and provide insight into the broader network-level impact of CSVD.
Future studies should validate these findings in larger multicenter longitudinal cohorts incorporating individualized and multimodal segmentation strategies, multi-atlas validation, broader cortical and whole-brain susceptibility analyses, and complementary imaging or biomarker approaches. Such investigations will be important for improving the reproducibility, biological interpretation of susceptibility measurements, clarifying their longitudinal trajectories, and determining clinical relevance of CSVD-related susceptibility alterations.
Conclusions
Using 7 T MRI-based QSM and susceptibility source separation, this study revealed region-specific susceptibility alterations in subcortical nuclei across the NC, pCSVD, and sCSVD groups. Net QSM results showed that increased QSM values were mainly observed in subregions such as the the putamen and globus pallidus, whereas small-magnitude decreases in QSM values were observed in selected thalamic and amygdalar subregions. Susceptibility source separation further suggested that QSM increases in the basal ganglia were primarily associated with increased paramagnetic sources, while QSM decreases in the thalamic and amygdalar regions may involve increased diamagnetic-related components and cancellation effects between different susceptibility sources. These findings highlight the complementary value of susceptibility source separation in interpreting bidirectional net QSM changes and their potential biophysical basis. In addition, susceptibility metrics were associated with WMH burden, cognitive performance, and anxiety symptoms, and showed exploratory potential for distinguishing different CSVD groups. Overall, 7 T QSM combined with susceptibility source separation may provide valuable imaging markers for assessing CSVD-related subcortical nuclei involvement. Future longitudinal studies are needed to determine whether these metrics can reflect intra-individual disease dynamics and predict clinical progression.
Supplemental Material
sj-docx-1-jcb-10.1177_0271678X261473382 – Supplemental material for Stage-dependent deep gray matter alterations in cerebral small vessel disease revealed by 7 T quantitative susceptibility mapping
Supplemental material, sj-docx-1-jcb-10.1177_0271678X261473382 for Stage-dependent deep gray matter alterations in cerebral small vessel disease revealed by 7 T quantitative susceptibility mapping by Yue Yuan, Shuai Jiang, Youjie Wang, Huilou Liang, Marta Lancione, Michela Tosetti, Boyan Xu, Yuying Yan, Mangmang Xu, Siyi Li, Jiaxin Zeng, Lu Tang, Pengfei Peng, Su Lui, Jiayu Sun and Bo Wu in Journal of Cerebral Blood Flow & Metabolism
Footnotes
Acknowledgements
The authors sincerely thank all the subjects for their active cooperation.
Author contributions
Yue Yuan: writing—original draft, writing—review and editing, conceptualization, formal analysis. Shuai Jiang: writing—original draft, writing—review and editing, conceptualization, formal analysis. Youjie Wang: writing—review and editing, data curation, investigation. Huilou Liang: writing—review and editing, formal analysis. Marta Lancione: writing—review and editing, formal analysis. Michela Tosetti: writing—review and editing, formal analysis. Boyan Xu: writing—review and editing, formal analysis. Yuying Yan: writing—review and editing, formal analysis. Mangmang Xu: writing—review and editing, data curation, investigation. Siyi Li: writing—review and editing, data curation, investigation. Jiaxin Zeng: writing—review and editing, formal analysis. Lu Tang: writing—review and editing, formal analysis. Pengfei Peng: writing—review and editing, formal analysis. Su Lui: writing—review and editing, conceptualization. Jiayu Sun: writing—review and editing, conceptualization, formal analysis. Bo Wu: writing—review and editing, conceptualization, formal analysis.
Funding
The authors disclosed receipt of the following financial support for the research, authorship, and/or publication of this article: This work was supported in part by the Joint Funds of the National Natural Science Foundation of China (U24A20690); the National Key R&D Program of China (2023YFC2506603); the National Natural Science Foundation of China (82271328, 82371322, and 82301661); the Noncommunicable Chronic Diseases–National Science and Technology Major Project (2023ZD0504900 and 2023ZD0504903); and the Science and Technology Projects of Xizang Autonomous Region, China (XZ202501ZY0120), Sichuan Science and Technology Program (No.2024YFFK0314), Post Doctor Research Project, West China Hospital, Sichuan University (2023HXBH007 and 2024HXBH041). This study was also partially supported by the Italian Ministry of Health by Ricerca Corrente RC2025 to IRCCS Fondazione Stella Maris.
Declaration of conflicting interests
The authors declared no potential conflicts of interest with respect to the research, authorship, and/or publication of this article.
Consent for publication
Not applicable.
Data availability statement
Due to ethical restrictions imposed by the Ethics Committee of West China Hospital, Sichuan University, the raw data supporting this study cannot be publicly shared. De-identified data and the custom code used in this study are available from the corresponding author upon reasonable request. Please contact the corresponding author for access.

Supplemental material
Supplemental material for this article is available online.
References
Supplementary Material
Please find the following supplemental material available below.
For Open Access articles published under a Creative Commons License, all supplemental material carries the same license as the article it is associated with.
For non-Open Access articles published, all supplemental material carries a non-exclusive license, and permission requests for re-use of supplemental material or any part of supplemental material shall be sent directly to the copyright owner as specified in the copyright notice associated with the article.
