
Abstract
The purpose of this study was to identify and validate subtypes of peer status by integrating preference and popularity into a single framework. Person-oriented analyses were performed among 3,630 children and adolescents of different cohorts in primary and secondary education. In the young age groups (Grade 3/4 to Grade 7), three clusters were found: popular-liked, average, and unpopular-disliked. In the older age group (Grade 8), four clusters were found: popular, liked, average, and unpopular-disliked. Thus, participants differentiated liked peers from popular peers at the age of 14, but not earlier. Distinct behavioral profiles were found for each subtype. Cohort-sequential analyses demonstrated high stability of cluster membership, especially among the high-status groups. Developmental implications and the importance of school transitions are discussed.
By late adolescence, peer status consists of two distinct aspects of social standing in the peer group: preference and popularity. Preference is predominantly linked to positive behaviors, whereas popularity is linked to positive and negative behaviors throughout childhood and adolescence (Mayeux, Houser, & Dyches, 2011). This distinct pattern of behavioral correlates is well defined in mid- to late adolescence, yet it remains unclear at what age youth begin to distinguish between who they like and who they think is popular, and what behaviors coincide with this distinction. This study addresses this issue by examining (a) when high-status youth become differentiated based on preference and popularity, (b) what behavioral characteristics distinguish status subgroups, and (c) how stable subtypes of peer status are from 1 school year to the next.
Subtypes of Social Preference
Peer status is typically measured using peer nominations, and was initially derived from the number of nominations each child received for “like most” and “like least” (Coie, Dodge, & Coppotelli, 1982), yielding a measure of social preference (sometimes called sociometric popularity). A continuous score of social preference is calculated for each individual child in the reference group as the difference between liked most and liked least nominations received. This form of status in the peer group was thus conceptualized in terms of peer preference or likeability (Bukowski & Hoza, 1989; Coie et al., 1982; Newcomb & Bukowski, 1983). Numerous studies have shown that high levels of social preference are associated with positive behaviors, such as sociability, and the absence of negative behaviors, such as aggression (e.g., Asher & McDonald, 2009; Parkhurst & Hopmeyer, 1998).
Traditionally, the continuous measure of preference has been used, together with social impact, to classify children and adolescents into sociometric status groups (Coie et al., 1982). Based on continuous scores for social preference and social impact, children are categorized into five sociometric status groups originally labeled popular (later described as accepted), rejected, neglected, controversial, and average. Since Coie and colleagues (1982) introduced this classification strategy, numerous studies have examined the behavioral correlates of the sociometric status groups (for a review, see Newcomb, Bukowski, & Pattee, 1993; Rubin, Bukowski, & Parker, 2006). Accepted children generally score high on positive traits, such as friendship, sociability, and cognitive abilities, and low on negative traits, such as aggression, disruptive behavior, or withdrawal. In contrast, rejected children score high on withdrawal and aggression, and low on sociability and cognitive skills. Neglected children often do not differ from average children in terms of adjustment difficulties, positive social actions, and friendship relations. Yet, they differ from the other groups in terms of their low levels of sociability and aggression. Finally, controversial children score high on aggression, sociability, and cognitive abilities.
In spite of these clear group differences, some researchers observed that accepted children were not necessarily the ones with the most power or influence in the classroom (Parkhurst & Hopmeyer, 1998). As a result, researchers started to ask children directly who were most and least popular in their classroom. A score for popularity (also called perceived popularity) was then derived from the difference between numbers of most popular and least popular nominations received by each participating student (Cillessen & Marks, 2011; Parkhurst & Hopmeyer, 1998). This measure of popularity has been found to more clearly describe impact, visibility, and social dominance in a group, than a measure of likeability or personal preference (Cillessen & Marks, 2011; LaFontana & Cillessen, 2002). In terms of behaviors, a mixed pattern of positive and negative correlates has been found for popularity. As with preference, high levels of popularity are associated with leadership, prosocial behavior, attractiveness, being trustworthy, and having a good sense of humor (LaFontana & Cillessen, 1998, 2002; Lease, Kennedy, & Axelrod, 2002; Vaillancourt & Hymel, 2006). Unlike highly preferred students, those perceived as popular were more likely to also be perceived as relationally and physically aggressive and exhibiting risk behaviors (Mayeux et al., 2011; Mayeux, Sandstrom, & Cillessen, 2008; Rose, Swenson, & Waller, 2004; Schwartz & Hopmeyer Gorman, 2011). Thus, preference and popularity share certain characteristics, but are also unique and distinct forms of social status. Sociometric classification of children and early adolescents has exclusively used preference to categorize adolescents in different status groups. This raises the question if, and if so, at what age popular students become distinguished within the peer group from students who are well accepted (liked) within the peer group. Our first goal was therefore to build on Coie et al.’s (1982) work by classifying adolescents of varying ages into status groups using continuous measures of both preference and popularity.
Subtypes of Peer Status
Three prior studies have categorized children and early adolescents into groups based on measures of status and behavioral characteristics. Rodkin, Farmer, Pearl, and Van Acker (2000) identified six groups of fourth- to sixth-grade boys (9-13 years of age) by means of teacher, self, and peer measures of interpersonal competence. Six subtypes were identified: models, toughs, low academic, passive, bright antisocial, and troubled. Model boys were seen as popular, athletic, prosocial, and academically competent. Tough boys were also seen as popular and physically competent, but also as aggressive. Bright antisocial and troubled boys were also seen as aggressive, but were unpopular. They differed from each other in academic achievement. Passive and low academic boys scored average on popularity. They differed from each other in academic achievement and shyness. With regard to peer status, this study was one of the first attempts to identify subtypes of high-status boys who differed in terms of antisocial and prosocial behavior.
The second study on subtypes of peer status also examined fourth to sixth graders, but included both boys and girls (Lease, Musgrove, & Axelrod, 2002). In this study, subgroups were identified based on students’ preference, popularity, and a measure of social dominance that was based on levels of influence and power. These researchers identified seven subtypes labeled high status, perceived popular/dominant, well-liked/dominant, average, low dominant/unpopular, disliked, and low status. The first three clusters where characterized by high levels of status or social dominance; the last three clusters by low levels. Each cluster demonstrated a unique behavioral profile. In general, high-status children differed from lower status children in terms of social influence, admiration, and leadership. The high-status subtypes were distinguished by aggression, with the popular/dominant group exhibiting the most and the well-liked/dominant displaying the least. The low-status subtypes were distinguished by the amount of aggression and withdrawn behavior, with the disliked groups exhibiting more aggression and disruptiveness and low dominant/unpopular group displaying the largest amount of withdrawn behavior.
The third study utilized an older sample to examine heterogeneity of popular girls in secondary school (de Bruyn & Cillessen, 2006a). These researchers identified five subgroups based on preference, popularity, and academic behaviors, labeled popular studious, popular disengaged, average popular, unpopular disengaged, and unpopular studious. As in the previous two studies, unique behavioral profiles were found for each group. The two popular subgroups (studious and disengaged) were highly popular, preferred, and seen as fashionable. Yet, they differed in terms of competencies, with popular studious adolescents displaying positive academic engagement and attentiveness and popular disengaged adolescents displaying avoidance and a lack of engagement or attentiveness.
All three studies demonstrated that different subtypes of peer status can be identified at different ages in different school contexts. Especially at the upper end of status, different subgroups were found; the toughs and models, the high status, perceived popular/dominant, and well-liked/dominant groups, and the prosocial and populistic adolescents. However, all three studies included one or more (behavioral) variables in their classification of adolescents into subgroups in addition to the two measures of peer status (popularity and preference). Thus, these authors made the priori assumption that the clusters were not only based on status but also on either interpersonal competence (Rodkin et al., 2000), social dominance (Lease, Musgrove, & Axelrod, 2002), or academic performance (de Bruyn & Cillessen, 2006a). In the current study, we did not make such assumptions. We based the classifications only on measures of preference and popularity, and did not include any other traits or characteristics. By doing so, we build on the original idea of Coie et al. (1982) by exclusively using measures of preference and popularity to classify adolescents in status groups. Behavioral characteristics are then used to profile the status groups. Thus, the second goal of this study was to identify the behavioral profiles associated with groups based on measures of peer status.
Developmental Changes in Popularity and Preference
As preference and popularity are both measures of peer status, it is not surprising that they are moderately correlated. Yet, the association between preference and popularity varies as a function of age and gender. Cillessen and Mayeux (2004) demonstrated that preference and popularity become less associated across childhood and adolescence. More specifically, the correlation declined from .77 in Grade 5 to .63 in Grade 9 for boys. For girls, the correlation between preference and popularity was moderate at Grade 5 (.63), yet became unrelated by Grade 9 (.04). In a follow-up study, the association between preference and popularity further declined over time to the point of being significantly negative in Grades 9 to 12 (Cillessen & Borch, 2006). These studies provide evidence suggesting that preference and popularity become more distinct measures of peer status throughout adolescence, especially for girls. The fact that the association differs over time could also mean that different subtypes of peer status will be found in different age groups. Therefore, the identification of subtypes of peer status was conducted separately in different age cohorts in this study.
Finally, the stability of peer group status classifications is relatively low. In a meta-analysis (Cillessen, Bukowski, & Haselager, 2000), the overall stability was found to be modest for status groups based on preference. Moreover, stability differed between status groups, with accepted and rejected status found to be the most stable. Stability is higher for popularity than for preference (Cillessen & Borch, 2006; Cillessen & Mayeux, 2004). To date, little is known about age and developmental changes in status subtypes based on measures of preference and popularity.
Current Study
This study used longitudinal data from several cohorts of children and young adolescents to address three questions. First, we identified subtypes of peer status in Grades 3 to 8, in order to determine at what age preference and popularity become distinct forms of peer status. Because the association between preference and popularity has been shown to decrease after Grade 5, we hypothesized that two distinct subgroups of high status will be initially identified in early adolescence (after Grade 5) but not in late childhood (before Grade 5). Moreover, the distinction between two subgroups of status was expected to be stronger among girls than among boys (Cillessen & Borch, 2006; Cillessen & Mayeux, 2004).
Next, we examined what behavioral characteristics distinguished the status subtypes. High-status clusters were expected to differ from low-status clusters in terms of leadership and prosocial behavior (Lease, Musgrove, & Axelrod, 2002; Rodkin et al., 2000). Among high-status adolescents, subgroups were expected to vary in terms of aggression and antisocial behavior (de Bruyn & Cillessen, 2006a; Lease, Musgrove, & Axelrod, 2002; Rodkin et al., 2000). Among low-status adolescents, subgroups were expected to vary in terms of aggression and withdrawn behavior (Lease, Musgrove, & Axelrod, 2002).
Finally, we tested the inter-individual stability of peer status group membership from childhood to early adolescence. Research suggests that popularity is more stable over time than preference (Cillessen & Borch, 2006). Moreover, the stability of sociometric categories tends to be low (Cillessen et al., 2000). Therefore, we expected a relatively low degree of stability in group membership over time, especially for subtypes characterized by high or low levels of preference instead of popularity.
Method
Recruitment and Procedure
Participants came from Waves 5, 6, and 7 of the Nijmegen Longitudinal Study on Infant and Child Development in The Netherlands, an ongoing longitudinal study that examines childhood development and adjustment among a community sample of 129 children since 1998 (van Bakel & Riksen-Walraven, 2002). For this study, the 129 adolescents of the Nijmegen Longitudinal Study and all of their classroom peers were asked to complete sociometric and self-report questions during a 45- to 60-minute classroom session. Teachers gave active consent for participation. Parents and guardians of all students received a letter, in which the study was fully explained, and in which they could indicate if they did not want their child to participate. Five teachers decided not to participate and 15 parents did not consent to their child’s participation.
At Wave 5 (2006-2007), data were collected in Grades 3/4 of primary education. At Wave 6 (2009-2010), data were collected in Grades 5/6 of primary education and Grade 7 of secondary education. At Wave 7 (2010-2011), data were collected in Grades 7 and 8 of secondary education.
Participants
Cohorts
In The Netherlands, primary education classrooms often consist of children from two grade levels, whereas secondary education classrooms consist of adolescents from a single grade level. Therefore, we pooled together the children from Grades 3 and 4 into one cohort called Grade 3/4. The early adolescents from Grades 5 and 6 were pooled together into the cohort called Grade 5/6. This resulted in four cohorts: Grade 3/4 and Grade 5/6 in primary education, and Grade 7 and Grade 8 (first and second year) in secondary education. Classrooms in special education schools were not included in the current analyses.
Participants from the Grade 3/4 cohort were 1,559 children (
Longitudinal samples
To analyze the stability of the clusters over time, we selected the adolescents (N = 1,027) who participated in two consecutive waves of the Nijmegen Longitudinal Study on Infant and Child Development. Longitudinal participants included the participants of the Nijmegen Longitudinal Study or adolescents who happened to be a classmate of one of the targeted adolescents during two consecutive waves of data collection. These children and adolescents were divided into three longitudinal samples: one sample of children who participated in Grade 3/4 and again in Grade 5/6, one sample of early adolescents who participated in Grade 5/6 and again in Grade 7, and one sample of adolescents who participated in Grade 7 and again in Grade 8. The first longitudinal sample consisted of 535 children (53.8% boys) with a mean age of 9.11 years (SD = 0.60) in Grade 3/4 and 12.17 years (SD = 0.46) in Grade 5/6. The second longitudinal sample consisted of 104 adolescents (45.2% boys) with a mean age of 12.09 years (SD = 0.43) in Grade 5/6 and 13.05 years (SD = 0.42) in Grade 7. The third longitudinal sample consisted of 388 adolescents (41% boys) with a mean age of 13.08 years (SD = 0.44) in Grade 7 and 14.02 years (SD = 0.44) in Grade 8.
Sociometric Assessment
A total of 13 sociometric questions were used. The instructions, questions, and computations of sociometric scores were identical in all waves. For each question, the classroom was the reference group. Unlimited nominations were used, allowing both same-sex and other-sex choices. Participants were instructed not to name themselves.
In Grade 3/4, children completed the questions on paper. Each child received a list containing the first names of all classmates in alphabetic order, preceded by a code number. Children were instructed to nominate classmates who best fitted each description by filling in the code numbers preceding the names of the classmates. In Grades 5/6, 7, and 8, participants completed the questionnaire on a netbook computer. Each sociometric question was presented on a separate screen at the top of the page, followed by a roster with the names of all classmates. The order of names was randomized for each participant, but kept constant across questions for each participant. The participants named classmates for each question by clicking on the names. If a participant clicked on a name, the color of the name changed from black to gray. In this way, the student could see whom he or she had nominated, while others could not easily detect a choice if they happened to see the screen. Participants had to nominate at least one classmate for each question, before they could go to the next question. They could not name themselves, because their names were not presented on the screens (for more details, see van den Berg & Cillessen, 2013).
Popularity and preference
Participants were asked to nominate classmates whom they liked most, whom they liked least, who were most popular, and who were least popular. In line with previous studies on peer nomination methods (Cillessen & Marks, 2011; Coie et al., 1982), nominations received were counted for each item and standardized within classrooms. A score for preference was computed as the difference between the standardized liked most and liked least scores, again standardized within classrooms (Coie et al., 1982). A score for popularity was computed as the difference between the standardized most popular and least popular scores, and again standardizing the resulting scores within classrooms (Parkhurst & Hopmeyer, 1998). Individual scores for preference and popularity less than −3 or larger than +3 were truncated to −3 and +3, respectively.
Friendship and behavioral characteristics
Participants also completed peer nominations for friendship (“Who are your best friends?”), prosocial behavior (“Who cooperates with others?” and “Who helps others often?”; r = .62-.76), bossy behavior (“Who plays the boss?”), aggression (“Who argues a lot with others”), bullying (“Who bullies others?”), victimization (“Who is bullied?” and “Who is excluded by others?”; r = .50-.90), and withdrawn behavior (“Who plays alone or keeps to themselves?”). Nominations received were again counted and standardized within classrooms. Individual scores less than −3 and greater than +3 were set to −3 and +3, respectively.
Analysis Strategy
The analyses consisted of three parts: (a) identifying the optimal cluster solution (status subtypes) for each cohort, (b) validating the subtypes using behavioral correlates, and (c) determining the inter-individual stability of the clusters over time.
To identify the optimal cluster solution for each cohort, a two-step Balanced Iterative Reducing and Clustering Using Hierarchies (BIRCH) cluster analysis was conducted. The BIRCH method is designed for large datasets. Data were reduced first in pre-clusters using tree structures and a log-likelihood distance measure. Pre-clusters are then treated as single cases and clustered into a range of solutions using an agglomerative clustering algorithm (Zhang, Ramakrishnan, & Livny, 1996). The optimal number of clusters is then identified as the solution with the largest change in Bayesian Inference Criteria (BIC), ratio of BIC change, and ratio of log-likelihood distance. After identifying the most optimal solution within each cohort in this way, the cluster analysis was repeated with a random sample of 500 from each grade and with the adolescents in the longitudinal samples to ensure the replicability of the optimal solutions. Initially, the four separate nominations for liked most, liked least, most popular, and least popular were used as clustering variables. However, as these nominations are often used as a composite score for preference and popularity, the cluster analyses were repeated using the composite scores as clustering variables. Both sets of clustering analyses yielded similar results, yet the patterns of results involving the composite scores were more straightforward. Therefore, the clustering solutions involving the composite scores are reported here. The clustering solutions using the four separate nomination items are available from the first author.
Cluster validation was accomplished by performing a series of MANOVAs to examine mean differences between the clusters on measures of unilateral friendship and social behaviors. To examine longitudinal stability of the clusters, we conducted Configural Frequency Analyses (CFA) with the EXACON module of the Sleipner program (Bergman & El-Khouri, 2002). These analyses provide one-tailed hypergeometric probabilities of types and antitypes. Types describe cells with observed frequencies greater than expected by chance; antitypes describe cells with observed frequencies less than expected by chance (von Eye, 2002; von Eye, Mair, & Mun, 2010). These analyses were performed separately for each longitudinal sample to examine the inter-individual stability of status within primary school (Grade 3/4 to Grade 5/6), during the transition from primary to secondary school (Grade 5/6 to Grade 7), and within secondary school (Grade 7 to Grade 8).
Results
Preliminary Analyses
Table 1 presents the means and standard deviations for all study variables by cohort and gender. Independent-sample t tests were performed to examine gender differences. There was a consistent pattern of differences across cohorts for preference, prosocial behaviors, and aggression. Girls were more preferred, more prosocial, and less aggressive than boys at each age. In the older age groups (Grades 7 and 8), boys were seen as more bossy than girls. Boys and girls also differed in peer-reported victimization, but the pattern varied across age. Boys were less bullied than girls in Grade 3/4, but more bullied than girls in the older three cohorts. Boys were also more excluded than girls in Grades 5/6 and 8.
Descriptive Statistics for Peer Status and Profiling Variables by Grade.
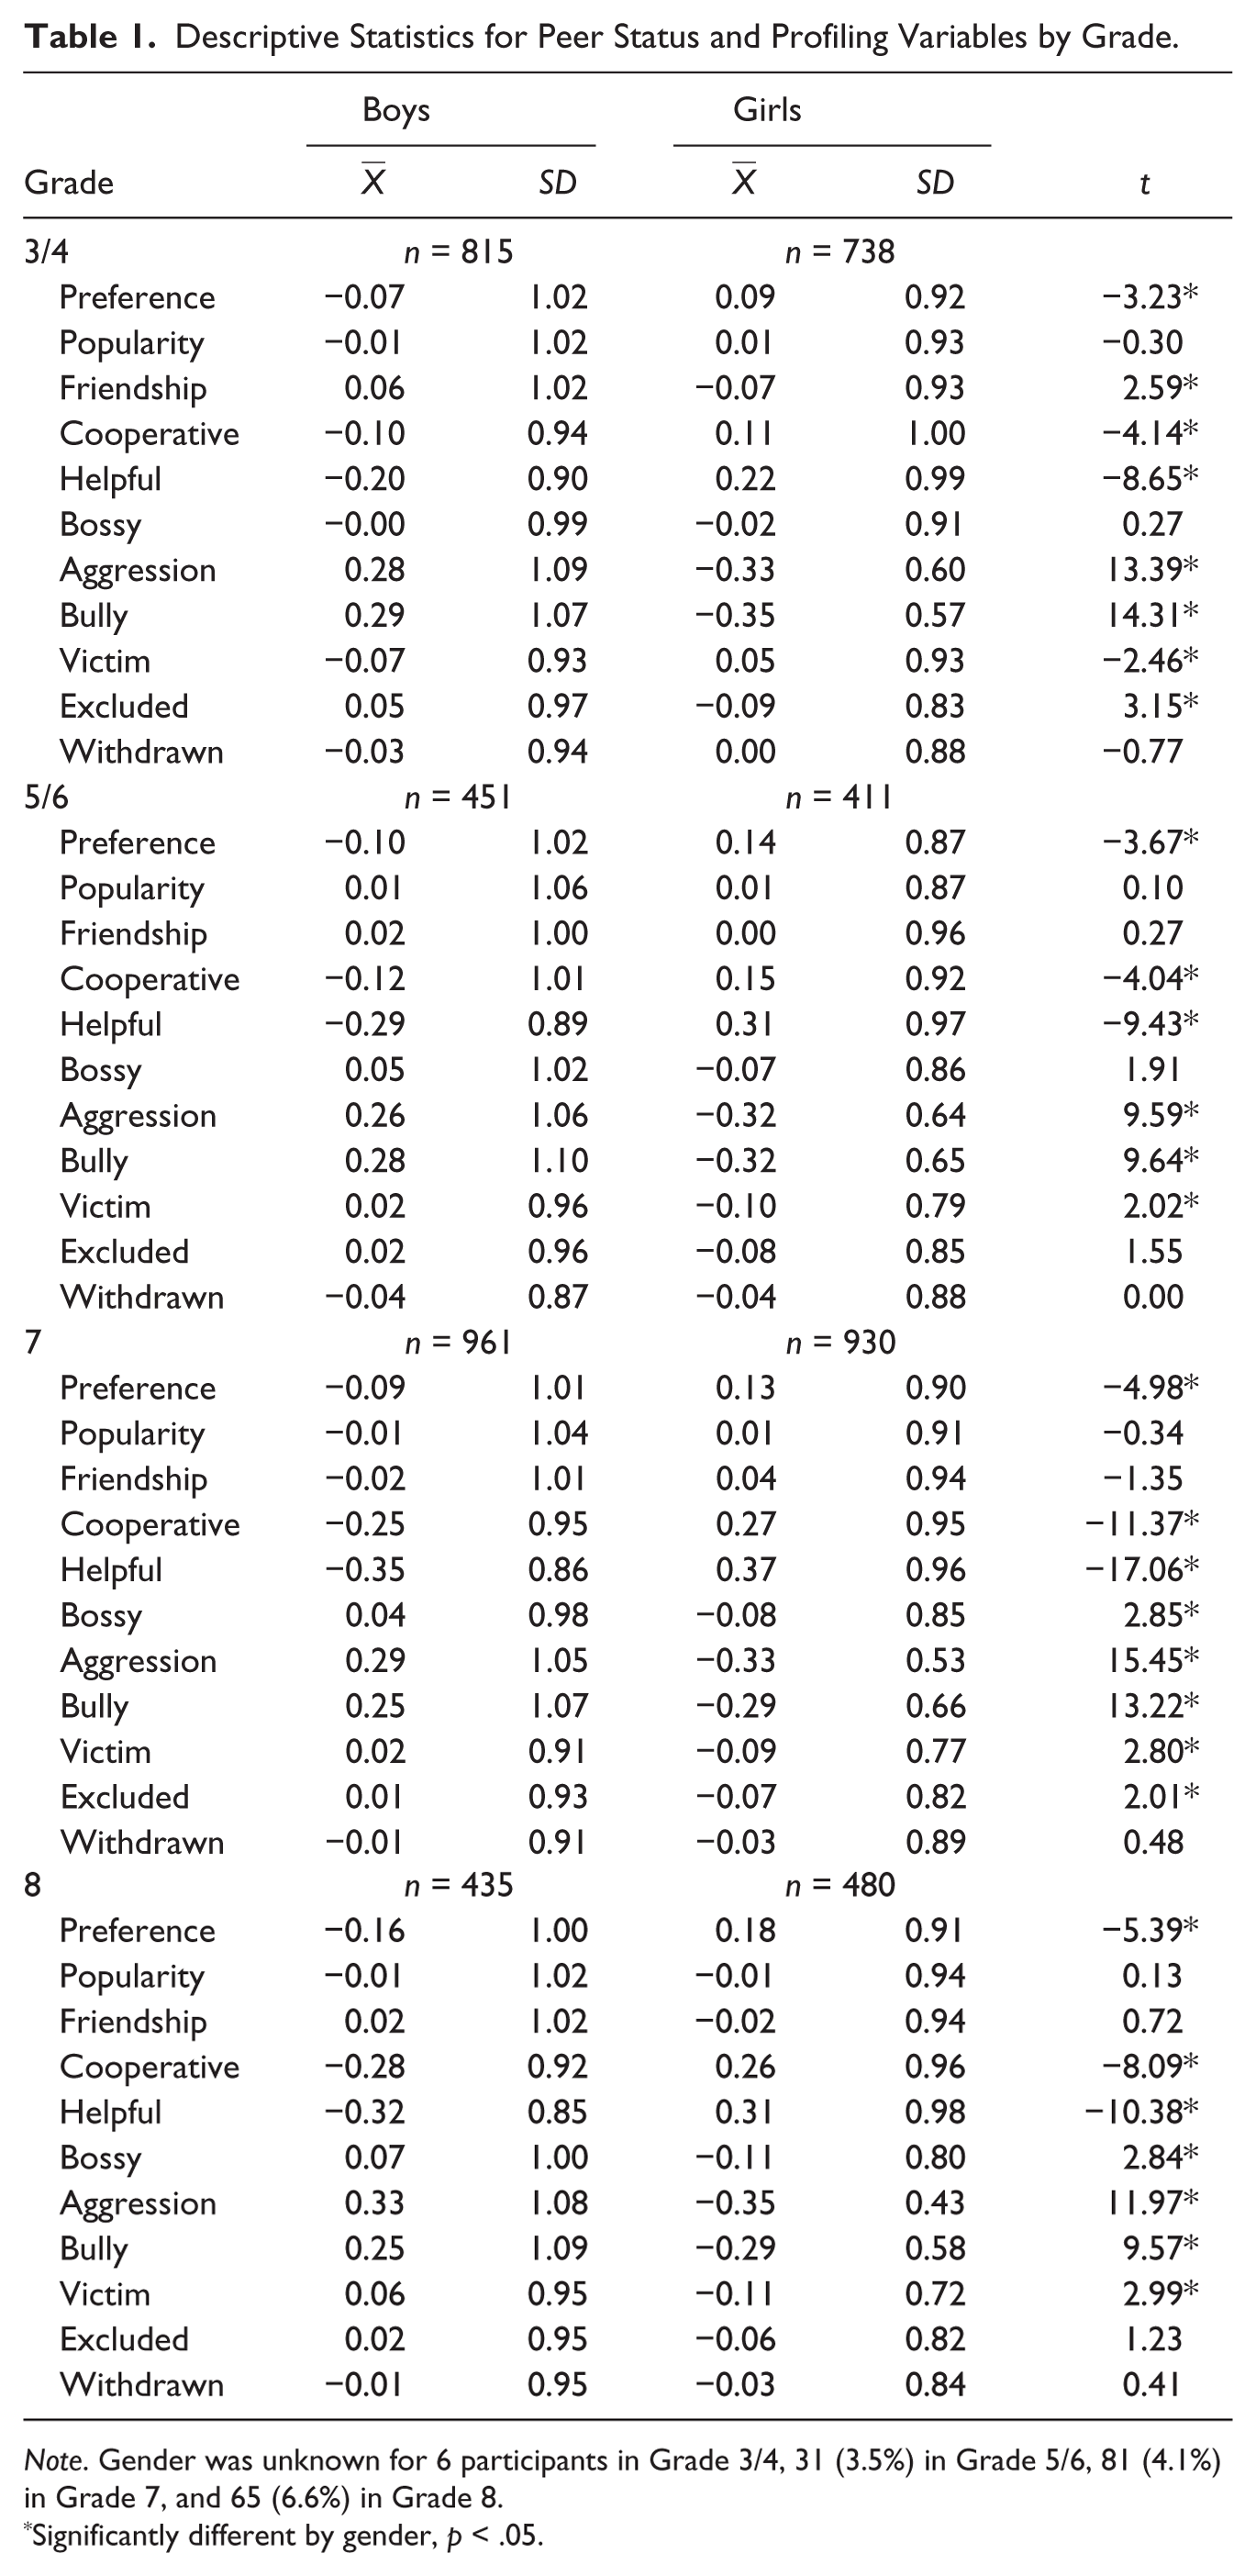
Note. Gender was unknown for 6 participants in Grade 3/4, 31 (3.5%) in Grade 5/6, 81 (4.1%) in Grade 7, and 65 (6.6%) in Grade 8.
Significantly different by gender, p < .05.
Preference and popularity were positively correlated, although the correlation was somewhat smaller in the older age groups; the correlation was .60 in Grade 3/4 and decreased to .40 in Grade 8. Across grades, a consistent pattern of correlations between preference and the behavioral characteristics was found; preference was positively correlated with friendship (r = .69 to .77) and prosocial behavior (r = .49 to .67), but negatively correlated with being bossy (r = −.15 to −.30), aggression (r = −.32 to −.45), bullying (r = −.23 to −.42), victimization (r = −.43 to −.66), and withdrawn behavior (r = −.41 to −.51). With regard to popularity, we found significant negative correlations with victimization (r = −.41 to −.74) and withdrawn behavior (r = −.51 to −.71) across grades. Moreover, popularity was positively correlated with friendship (r = .50 to .61), being bossy (r = .14 to .53), bullying (r = .06 to .38), and aggression (r = .02 to .27). Popularity was positively correlated with prosocial behavior from Grade 3/4 to Grade 7 (r = .14 to .50), but was not significantly associated with prosocial behavior in Grade 8.
A series of one-way ANOVAs were performed within each cohort to examine whether adolescents who participated in a single cohort differed from those in the longitudinal sample on all study measures. No statistically significant differences were found, except for helping in Grade 5/6 (
Identification of Peer Status Clusters
The BIRCH procedure identified distinct peer status clusters using popularity and preference as clustering variables. For children and adolescents in primary school (Grade 3/4 and Grade 5/6) and the first year of secondary school (Grade 7), a three-cluster solution was the most optimal. For each of these cohorts, a MANCOVA was conducted on popularity and preference, with age as a covariate. Table 2 presents the omnibus F ratios, means, and standard deviations for each cluster. Cluster 1 included early adolescents with low scores (standardized scores < 0.5) on popularity and preference and was labeled “unpopular-disliked.” This was the least prevalent cluster in each cohort. Cluster 2 included adolescents with average scores (standardized scores between −0.5 and 0.5) on both popularity and preference and was labeled “average.” Cluster 3 included adolescents with high scores (standardized scores > 0.5) on popularity and preference and was labeled “popular-liked.” The same three clusters were found in the random samples of 500 adolescents from the three cohorts, in the longitudinal samples of adolescents who participated in two consecutive waves, and when running the analysis separately for boys and girls.
Comparisons of Status Types on Clustering Variables by Grade and Gender.
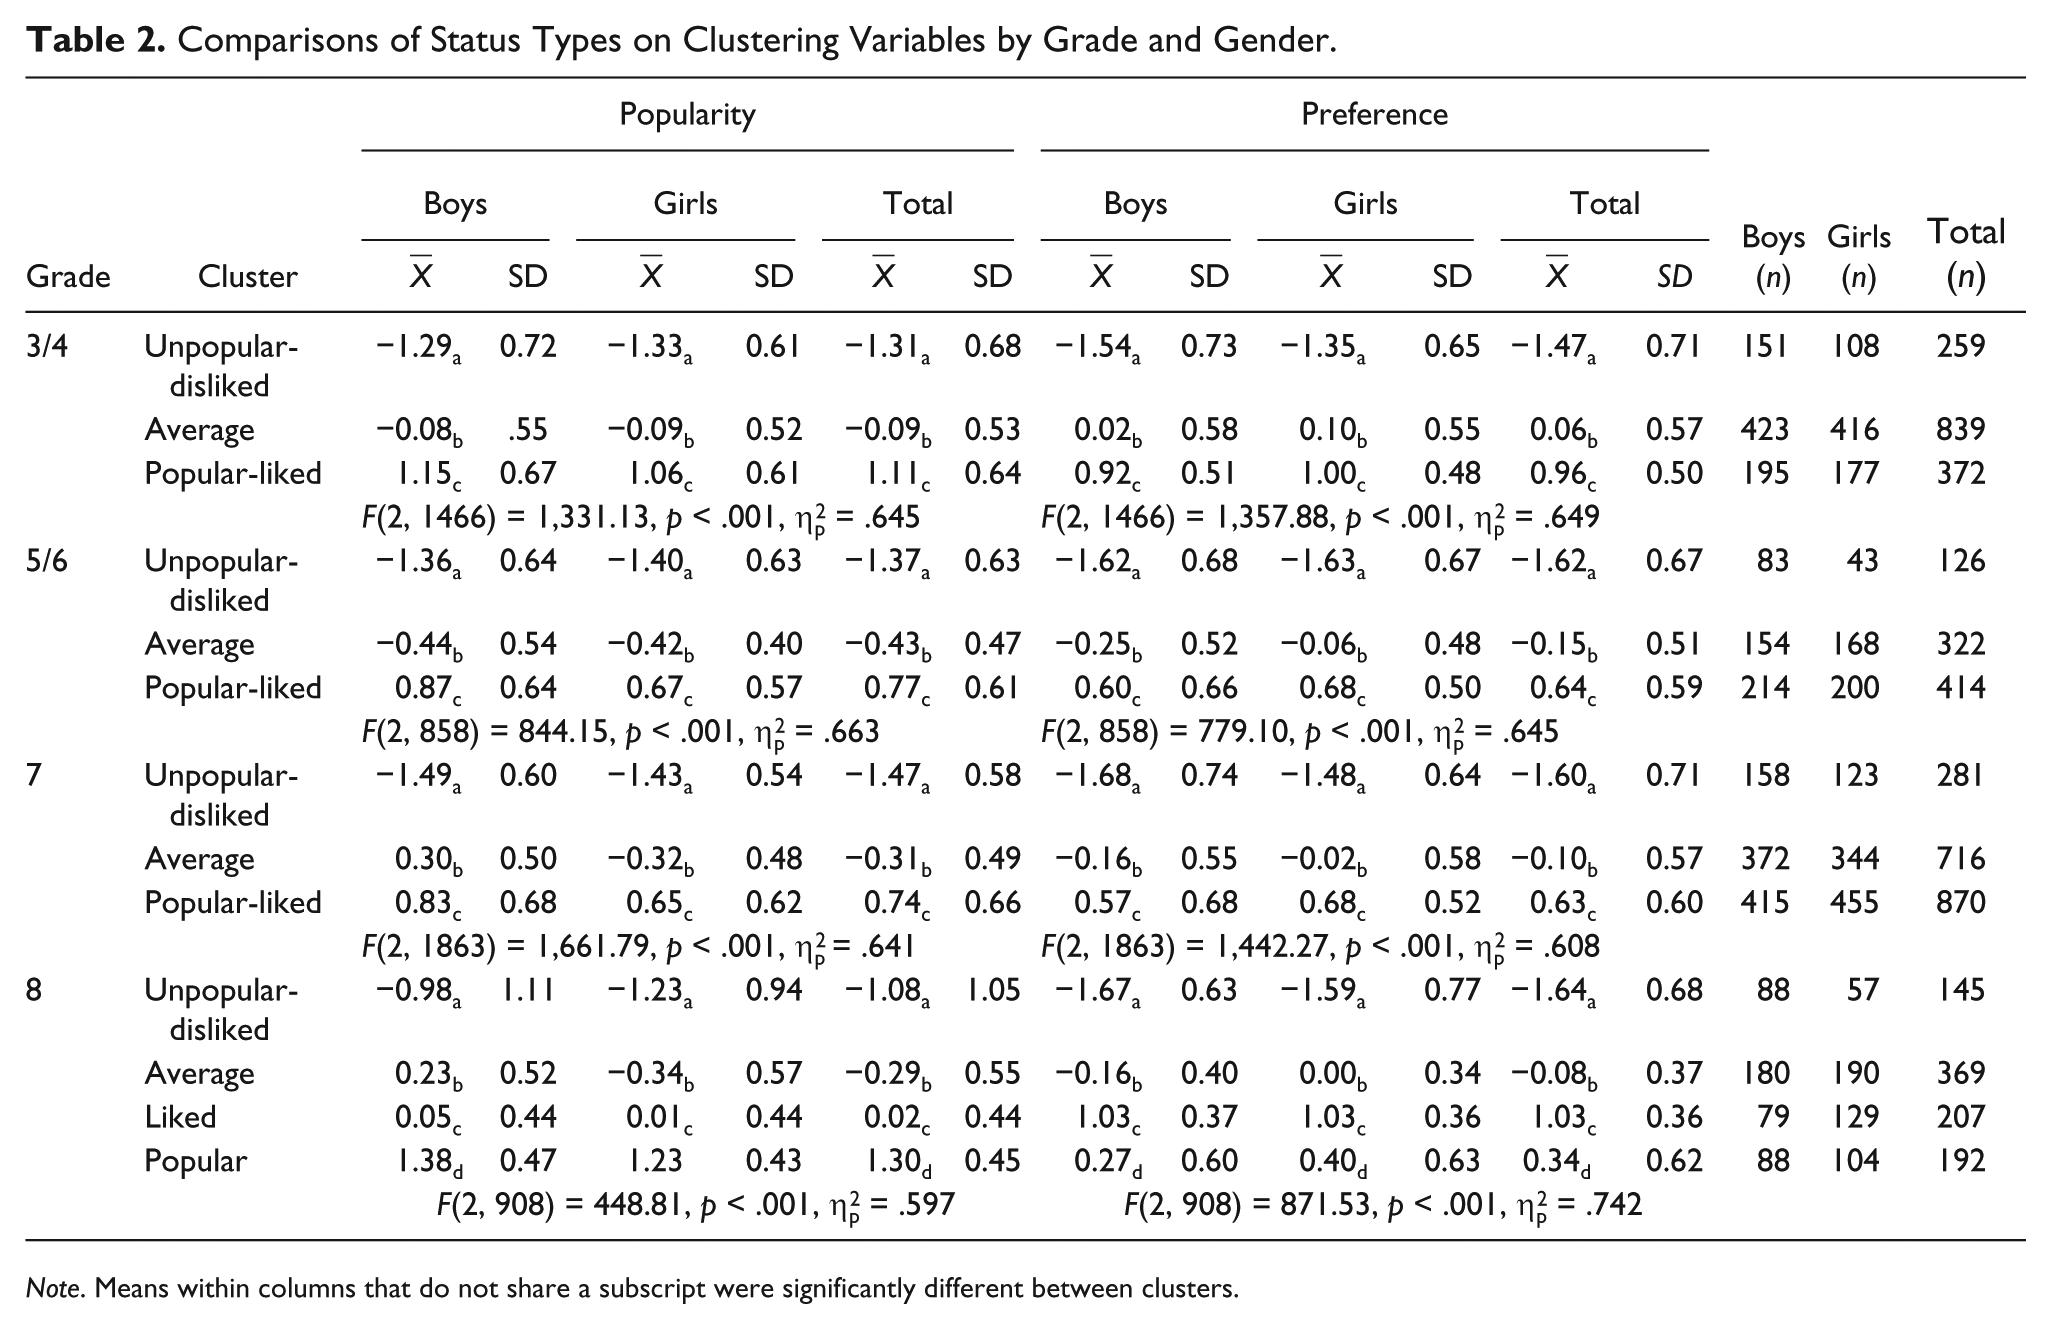
Note. Means within columns that do not share a subscript were significantly different between clusters.
For adolescents in the second year of secondary school (Grade 8), a four-cluster solution was most optimal. For this cohort, a MANCOVA was conducted on popularity and preference, with age as a covariate (see Table 2). Cluster 1 included adolescents who scored low on popularity and preference and was labeled “unpopular-disliked.” Cluster 2 included adolescents with average scores on popularity and preference and was labeled “average.” Cluster 3 included adolescents with high scores on preference and average scores on popularity and was labeled “liked.” Cluster 4 included adolescents who were seen as popular but were only moderately preferred by their classmates and was labeled “popular.” The same four clusters were found in the random sample of 500, in the longitudinal sample of adolescents, and when running the analysis separately by gender.
Gender differences in cluster membership were examined with chi-square test statistics. In Grade 3/4, boys and girls were equally likely to be in the three clusters. In Grade 5/6, boys were more likely than girls to be classified as unpopular-disliked, χ2(2) = 11.95, p = .003. In Grade 7, boys were more likely to be classified as unpopular-disliked and girls were more likely to be classified as popular-liked, χ2(2) = 7.68, p = .021. In Grade 8, boys were more often unpopular-disliked and girls were more often liked, χ2(3) = 18.08, p < .001. Thus, boys were overrepresented in the unpopular-disliked cluster in each cohort, and girls were overrepresented in the popular-liked and liked clusters in Grades 7 and 8, respectively.
Behavioral Characteristics of Peer Status Clusters
To validate the clusters, a MANCOVA was performed for each cohort. In each analysis, status subtypes and gender were included as between-subjects factors, age was included as a covariate, and the friendship and social behavior variables were the dependent variables.
Grade 3/4
There were significant multivariate effects of age, Λ = .98, F(9, 1455) = 2.68, p = .02; cluster, Λ = .35, F(18, 2912) = 94.01, p < .01; gender, Λ = .79, F(9, 1455) = 43.56, p < .01; and cluster by gender, Λ = .97, F(18, 2912) = 2.69, p < .01. Pairwise comparisons using Tukey adjustments showed significant differences between the clusters on all sociometric nominations (see Table 3). Popular-liked adolescents scored higher on friendship and cooperation than average adolescents, who in turn scored higher than unpopular-disliked adolescents. Unpopular-disliked adolescents scored higher on victimization and withdrawal than average adolescents, while popular-liked adolescents scored lowest. Unpopular-disliked adolescents scored higher on bullying and bossy behavior than average and popular-liked adolescents who did not differ from each other.
Comparison of Status Types on Profiling Variables by Grade.
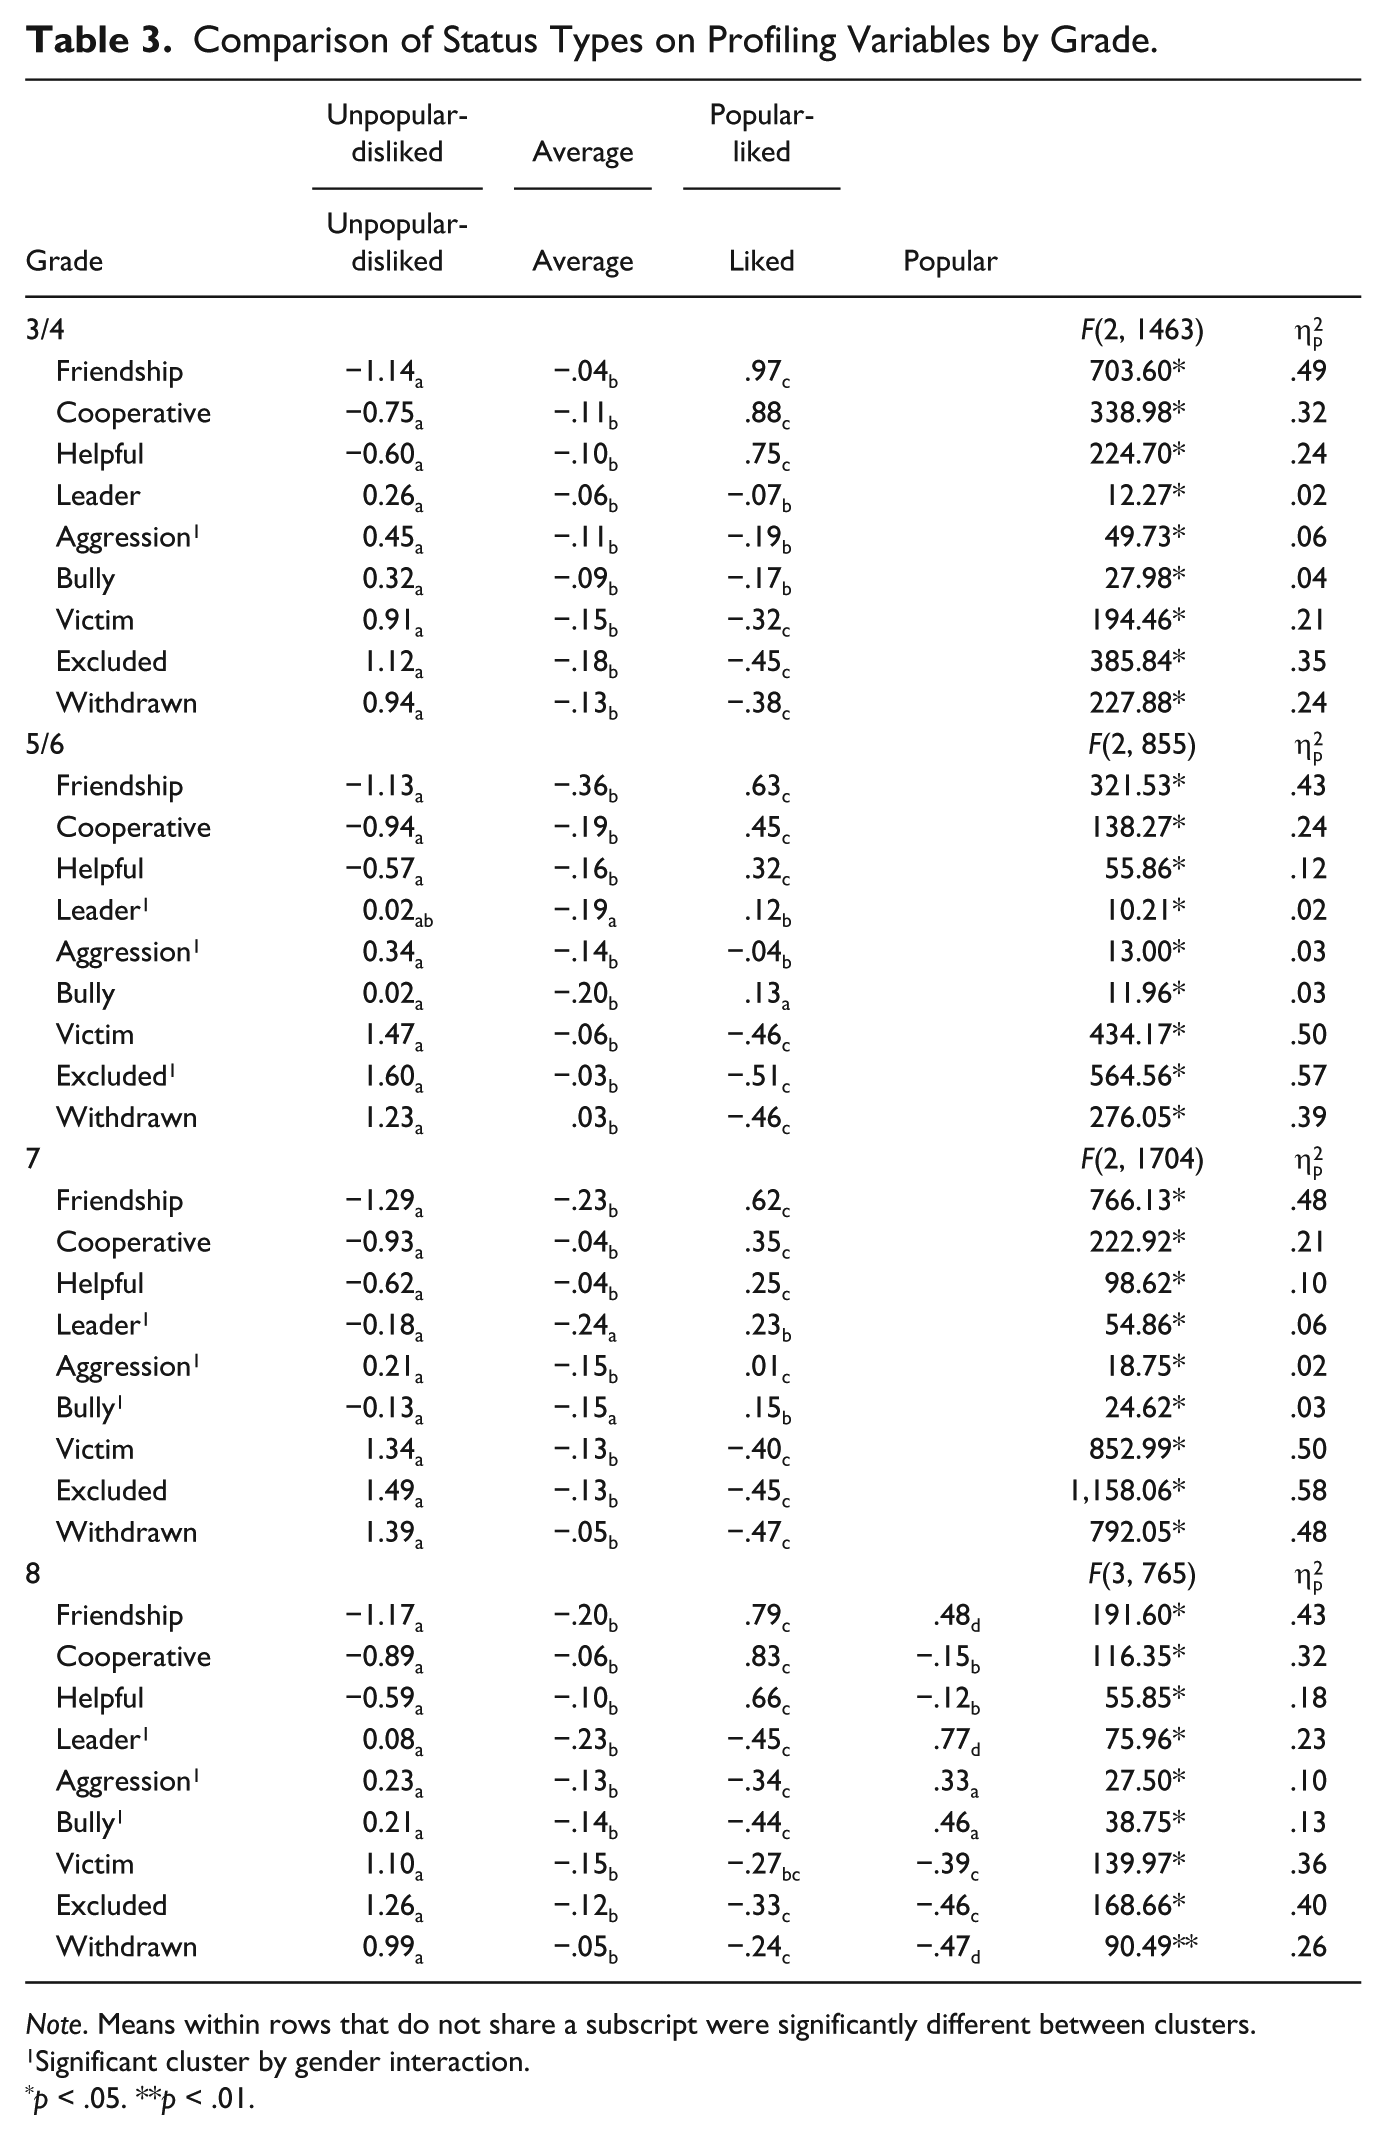
Note. Means within rows that do not share a subscript were significantly different between clusters.
Significant cluster by gender interaction.
p < .05. **p < .01.
A significant univariate cluster by gender effect was found for aggression, F(2, 1463) = 3.27, p = .038,
Significant univariate effects of age were also found for bossy behavior, F(1, 1463) = 9.00, p < .01,
Grade 5/6
There were significant multivariate effects of age, Λ = .03, F(9, 847) = 2.59, p < .01; cluster, Λ = .82, F(18, 1696) = 65.85, p < .01; gender, Λ = .15, F(9, 847) = 16.23, p < .01; and cluster by gender, Λ = .05, F(18, 1696) = 2.24, p < .01. Significant univariate effects of cluster emerged for all sociometric nominations (see Table 3). As in Grade 3/4, popular-liked adolescents scored higher on friendship and prosocial behavior than average adolescents, who scored higher than unpopular-disliked adolescents. Unpopular-disliked adolescents scored higher on withdrawn behavior than average adolescents, while popular-liked adolescents scored the lowest. Unpopular-disliked adolescents were more aggressive than average and popular-liked adolescents, who did not differ from each other.
Significant univariate clusters by gender effects were found for bossy behavior, F(2, 855) = 5.18, p < .01,
Significant univariate effects of age were also found for friendship, F(1, 855) = 7.07, p < .01,
Grade 7
There were significant multivariate effects of age, Λ = .01, F(9, 1696) = 1.97, p = .04; cluster, Λ = .81, F(18, 3394) = 127.50, p < .01; gender, Λ = .20, F(9, 1696) = 46.88, p < .01; and cluster by gender, Λ = .05, F(18, 3394) = 4.63, p < .01. Significant univariate effects of cluster emerged for all sociometric nominations (see Table 3). Popular-liked adolescents scored higher on friendship and cooperation than average adolescents, who scored higher than unpopular-disliked adolescents. Unpopular-disliked adolescents scored higher on exclusion and withdrawal than average adolescents, while popular-liked adolescents scored the lowest.
Significant univariate clusters by gender effects were found for bossy behavior, F(2, 1704) = 5.54, p < .01,
Significant univariate effects of age were also found for bossy behavior, F(1, 1704) = 7.24, p < .01,
Grade 8
There were significant multivariate effects of cluster, Λ = .94, F(27, 2277) = 38.63, p < .01; gender, Λ = .24, F(9, 757) = 26.72, p < .01; and cluster by gender, Λ = .09, F(27, 2277) = 2.71, p < .01. Significant univariate effects of cluster emerged for all sociometric nominations (see Table 3). Unpopular-disliked adolescents scored lower on friendship than average adolescents, who scored lower than popular adolescents. Preferred adolescents scored highest on friendship.
Unpopular-disliked adolescents scored lower on prosocial behavior than average and popular adolescents, who in turn scored lower than the preferred group. For being excluded, unpopular-disliked adolescents scored higher than adolescents, while preferred and popular adolescents scored the lowest. Finally, unpopular-disliked adolescents scored highest on withdrawn behavior, followed by average, preferred, and popular adolescents.
A significant univariate cluster by gender effects was found for bossy behavior, F(3, 765) = 2.81, p = .04,
Inter-Individual Stability in Peer Status Subgroups
CFAs examined the patterns of stability and change of cluster membership in the longitudinal samples. Patterns that were statistically more likely to occur than chance are called “types.” Patterns that were less likely to occur than chance are called “antitypes” (von Eye, 2002; von Eye et al., 2010). Table 4 presents observed and expected frequencies, chi-square statistics, and hypergeometric probabilities. Based on the observed frequencies, the percentage of adolescents who changed in classification was calculated. From Grades 3/4 to 5/6, 45% of the early adolescents changed in classification, 37.5% of the adolescents changed from Grades 5/6 to 7, and 36.3% of the adolescents changed from Grades 7 to 8. Figure 1 presents the typical and antitypical patterns of change within each cohort as well as the percentages of adolescents with a certain status in each grade.
Configural Frequency Analysis of Change in Cluster Assignment Over Time.
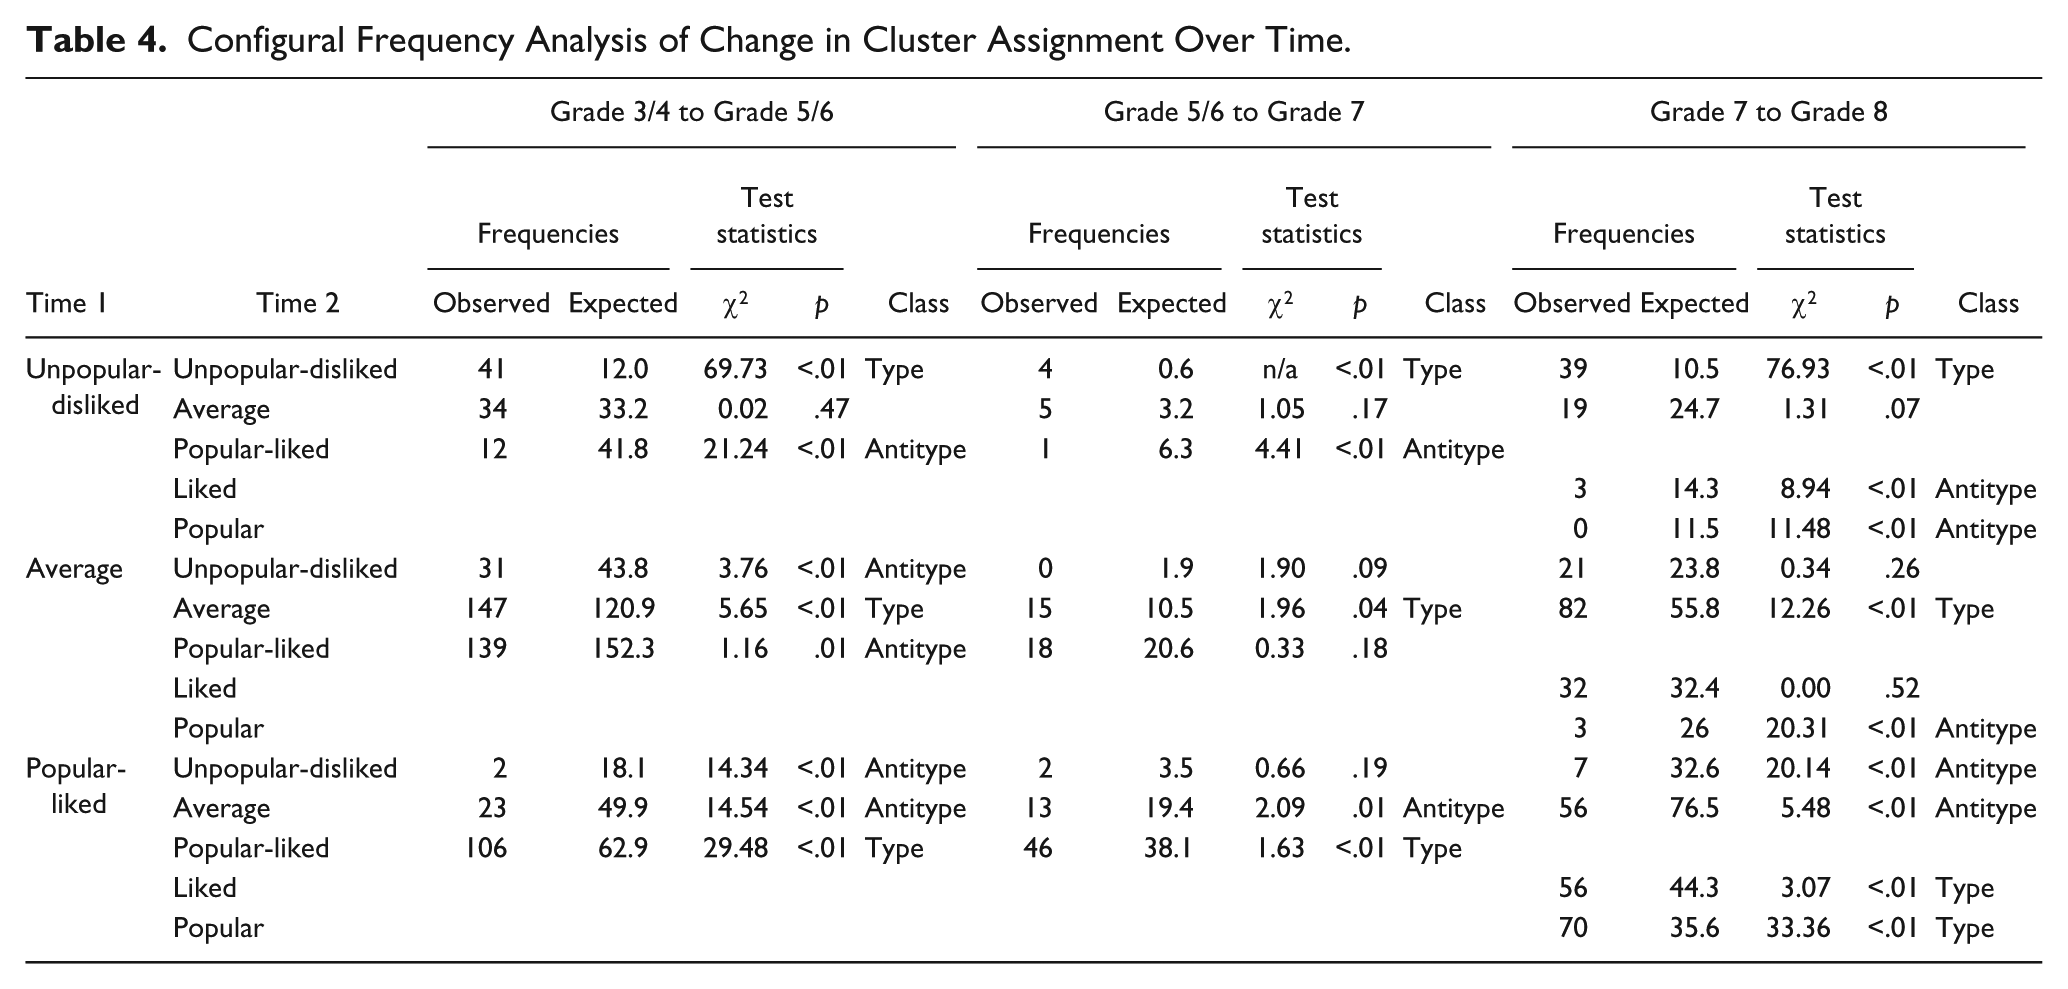
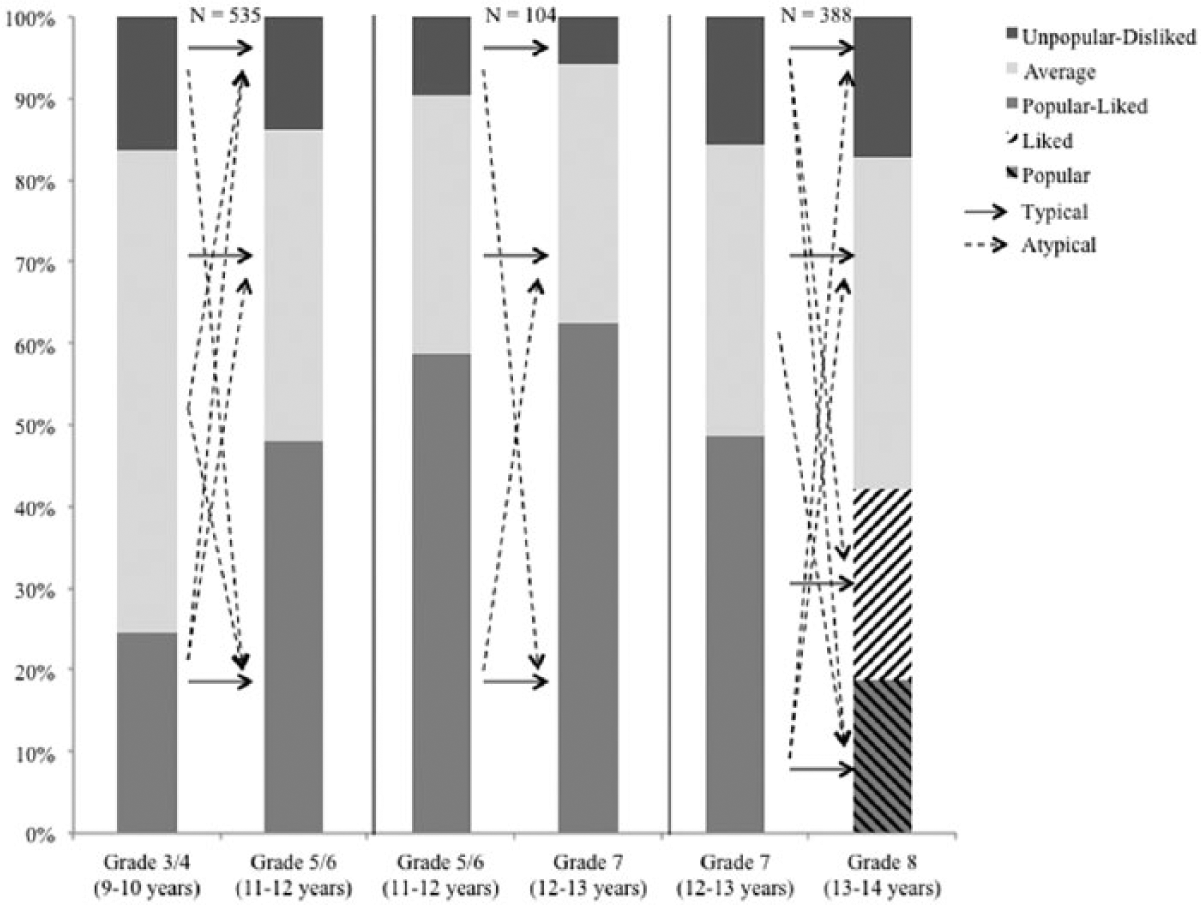
Typical and atypical change over time.
Ten typical patterns were identified, with most representing the stability of cluster membership over time. Adolescents who were initially classified as unpopular-disliked were likely to maintain this status over time. The same was true for the average classification; adolescents who were initially classified as average typically kept this status over time. Adolescents who were initially classified as popular-liked generally remained popular-liked in primary school and also after the transition to secondary school (Grade 7). However, if they were popular-liked in their first year of secondary school, there were two typical patterns of change; one group maintained their highly preferred status and was classified as liked, the other group maintained their highly popular status and was classified as popular.
A total of 11 antitypes were found, which represent the changes that were unlikely to occur. Four antitypes indicated that it is very unlikely that adolescents who are initially unpopular-disliked will have a high status in the future (popular-liked, liked, or popular). Two antitypical patterns were found for change in average status, one within primary education and the other within secondary education. Average adolescents in Grade 3/4 were unlikely to decline in status and become unpopular-disliked in Grade 5/6. Average adolescents in Grade 7 were unlikely to increase in status and become popular 1 year later in Grade 8.
There were no antitypes for the change in average status across the transition to secondary school. When looking at unlikely patterns of change for adolescents with high status, a general pattern was found between high and average status. Adolescents who had initially high status and were popular-liked were unlikely to decline in status and become average. Finally, it was very unlikely that popular-liked adolescents became unpopular-disliked, either within primary education or within secondary education. However, this antitypical pattern was not found for the transition from primary to secondary school (Grades 5/6 to 7).
Discussion
The aim of the current study was to identify when distinct forms of social status emerge in adolescents’ peer groups. We first identified subtypes of peer status from Grades 3 to 8 to determine when preference and popularity became distinct forms of peer status. These subtypes were then cross-validated using a variety of behavioral correlates. Inter-individual stability of status group membership in primary school, during the transition from primary to secondary school, and in secondary school was also investigated.
In elementary school (Grades 3-6) and the first year of secondary school (Grade 7), three clusters were found: unpopular-disliked, popular-liked, and average. The unpopular-disliked cluster consisted of adolescents who scored low on both preference and popularity. They were more often perceived as withdrawn and victims of bullying, and they received few nominations for friendship and prosocial behavior. The popular-liked cluster included adolescents who scored high on both preference and popularity. They received the most nominations for friendship, bossy behavior, and prosocial behavior and the fewest for victimization and withdrawn behavior. Finally, the average cluster included adolescents who scored average on both preference and popularity and were best described as being average on all relational and behavioral characteristics. Although older adolescents tended to be more aggressive and involved in bullying within each cohort, the behavioral profiles within each cluster did not differ by age.
In Grade 8, the unpopular-disliked and average clusters were also found. However, instead of the popular-liked cluster, two clusters for high status were found. Liked adolescents were those who scored high on preference, but average on popularity. They were characterized best as having many friends, being prosocial, and being low on aggression and bullying as well as on victimization. Popular adolescents, on the other hand, scored high on popularity, but average on preference. Popular adolescents were characterized as average on prosocial behavior, but high on aggression and bullying. No significant effects of age were found.
This study was one of the first to examine both boys and girls when identifying subtypes of peer status. There was a gender difference for preference; girls were more preferred than boys at all ages. There was no gender difference for popularity. Although the correlation between preference and popularity is stronger for boys than for girls especially at older ages (Cillessen & Mayeux, 2004), there were no gender differences when clustering was performed for boys and girls separately, nor when looking at the cluster means of preference and popularity. Yet, boys were more likely to be assigned to the “unpopular-disliked” groups, whereas girls were more likely to be classified as “popular-liked” or “preferred.” The same clusters were found for boys and girls, but the likelihood to be assigned to each cluster varied by gender. Furthermore, high-status boys displayed more aggression and bossy behavior than high-status girls. Moreover, unpopular-disliked boys were seen as most aggressive in Grade 3/4, whereas girls were seen as least aggressive.
Together, the findings indicate that on average, early adolescents do not distinguish between peers whom they like and peers whom they think are popular until Grade 8 (roughly 14 years of age). However, when examining the correlations of both measures of status with behaviors, distinct patterns already emerged in Grade 3/4 that were in line with previous studies (e.g., Mayeux et al., 2011; Rubin et al., 2006). Preference was positively associated with prosocial behavior and negatively with aggression, bullying, and victimization. Popularity was positively associated with aggression and bullying at all ages. Moreover, popularity correlated positively with prosocial behavior, but only until Grade 7. Thus, while the correlations already showed somewhat unique patterns of association, the cluster analyses did not discriminate unique groups at the younger ages.
One explanation for this discrepancy is that the correlations assume that associations between status and behaviors are similar for all participants (a homogeneous population); whereas the cluster analyses assume that associations between status and behaviors differ for distinct subgroups of participants (a heterogeneous population). Thus, the correlations and cluster analyses provide complementary, not contradictory information. Additional longitudinal studies from childhood through adolescence are needed to unravel the unique developmental pathways of preference and popularity, and to build a developmental theory of peer status (Cillessen, 2011).
The distinction between preferred and popular adolescents in Grade 8 was according to our hypotheses and is in line with previous studies that classified adolescents on the basis of both peer status measures (de Bruyn & Cillessen, 2006a; Lease, Musgrove, & Axelrod, 2002; Rodkin et al., 2000). However, the distinct subgroups of high-status youth did not emerge until Grade 8, even though Lease, Musgrove, and Axelrod (2002) and Rodkin et al. (2000) already found two groups of high-status adolescents in Grades 4 to 6. An explanation for this discrepancy may lie in the key variables on which the categorization was based. The current study based group categorization solely on peer preference and popularity, because of the current consensus that likeability and popularity are two distinct forms of peer status (Mayeux et al., 2011). The other studies included other behavioral variables to identify subtypes of peer status (e.g., academic performance, social dominance, interpersonal competence). While the inclusion of such additional measures allowed these researchers to identify up to seven groups, it seems that the heterogeneity among high-status adolescents was partly due to these additional variables. For instance, in the study of de Bruyn and Cillessen (2006a), the mean levels of popularity and preference among the two high-status groups (“Popular studious” and “Popular disengaged”) did not significantly differ from each other. The two high-status groups did, however, significantly differ in terms of academic performance. Thus, the previously found heterogeneity among younger age groups may not be a reflection of adolescents being distinct in their levels of preference and popularity, but rather be a reflection of differences in certain behaviors they display.
The heterogeneity among high-status adolescents in Grade 8 in the current study is in line with another study of de Bruyn and Cillessen (2006b) among eighth-grade adolescents. In that study, adolescents were asked to describe popular peers. The descriptions yielded two groups of popular peers: the “populistic” group and the “prosocial popular” group. The behavioral descriptions of these groups match the “popular” and “liked” groups of our study. For instance, “populistic” adolescents were best described as popular, but not necessarily liked. Moreover, they were often perceived as aggressive and a bully. The “prosocial popular” adolescents were best described as well-liked, social, and prosocial. Both descriptions are similar to the behavioral profiles of “popular” and “liked” clusters of the current study.
In addition, this heterogeneity of high status in adolescence fits with a broader view on popularity (Cillessen, 2011). According to this view, likeability and popularity reflect two different forms of social competence. The first form refers to the ability to be prosocial and cooperative, perceive others accurately, take their perspective, and read and understand their emotions. Prosocial behavior, social perception accuracy, perspective taking, and emotion understanding enable individuals to be empathic, understanding, supportive, and responsive to others’ needs. Adolescents who possess these skills behave in ways that make them well-liked. The second form of social competence refers to the ability to be interpersonally effective, achieve goals in social situations for oneself or the group, in principle through playing by the rules, but if needed through convincing argumentation, coercion, assertiveness, or intelligent manipulation. Individuals with these skills may not be the most interpersonally sensitive, but are well-connected leaders who can achieve goals in effective ways that may be seen as aggressive by some, but assertive by others. Those who possess these skills behave in ways that make them visible, prestigious, and central in the peer group, but not necessarily well-liked. The current study shows that this distinction reveals itself in the emergence of different groups of high-status peers in adolescence.
Still, it is notable that the subgroup of highly popular adolescents is not necessarily well-liked but also not necessarily disliked. In one of the first studies by Parkhurst and Hopmeyer (1998) on the distinct dimensions of peer status, it was shown that the most popular adolescents were not liked but rather rejected by their peers. They also found a significant positive association between popularity and disliked nomination. Based on these results, one could have expected a subgroup of popular and disliked adolescents. The fact that this subgroup was not found in the current study could be explained by the differences in analytic approaches. Previous studies used variable-oriented approaches to label children in different subgroups. Correlational studies utilizing variable-oriented analyses assume that the relationship between variables is similar across all individuals in the sample (population). However, in the current study we used clustering analyses. Cluster analysis is a person-oriented technique that emphasizes that the relationship between variables differs for subgroups within the sample (population).
When looking at the inter-individual stability of status group membership, the results suggest that adolescents in the unpopular-disliked and average clusters were very likely to remain in these categories 1 to 2 years later. The popular-liked adolescents were also likely to maintain their high status over time by transitioning into either popular or liked clusters in Grade 8. In addition, it was unlikely for adolescents to go from a low status to a high status or vice versa. Interestingly, changes in group membership were more likely during the transition from elementary to secondary school than during elementary school or during secondary school. Taken together, these findings suggest that the status groups identified in this study were quite stable over time and changes in status were unlikely to happen.
The stability of peer status across school contexts may be explained by the stability of the underlying child characteristics (Cillessen et al., 2000). The behavioral characteristics related to each status group were similar in elementary and secondary education. Thus, if adolescents have not changed their behaviors and peers’ stereotypical ideas about status are the same as before, it is likely that adolescents will keep the same status even when they change schools. Due to the relatively small number of adolescents who changed status groups and the heterogeneity of these groups (e.g., some changed from low to high status and vice versa, whereas others changed from average to high or low), it was not possible to examine the behavioral characteristics that predict the stability or change in status groups. However, it would be interesting to examine to what extent the stability of underlying behavioral characteristics predicts the stability of status.
The high stability among popular-liked adolescents could also be explained by the “cycle of popularity” (Eder, 1985). This means that popular adolescents strive to maintain high status and do not allow unpopular adolescents to become part of their friendship group as it might decrease their own popularity. They select friends who also have a high status by which they maintain or even enhance their own high status in time (Dijkstra, Cillessen, & Borch, 2013). Future studies should therefore examine the effects of selection and influence on the stability of peer status.
Together, the results suggest that toward the end of early adolescence, students start to make a distinction between peers they like and peers they admire. Yet, it is still unclear whether the division of one general form of high status (popular-liked status) into two separate forms of high status (popular vs. liked) is an effect of age or an adjustment effect when entering secondary school. On the one hand, it could be an effect of age, because adolescents value popularity more around the age of 14 and start to distinguish between peers they like and peers whom they admire (LaFontana & Cillessen, 2010). On the other hand, it might be a deferred effect of the school transition. It could be that adolescents in their first year of secondary education will have a frame of reference of peer status that is based on their experiences in primary education. After the transition, they gradually see how older adolescents distinguish peers they like and peers who are popular. It might take some time to adjust these initial frameworks to the new experiences and standards in secondary school. It could therefore be that the division of high status in Grade 8 is a delayed effect of the adjustments adolescents make and new experiences they have during their first year of secondary school. Future research should replicate the current study by analyzing a sample that makes the transition to secondary school at an earlier or later age. One could then examine whether a similar delayed effect occurs or whether it has to do with the age of the participants.
Several limitations of this study should be acknowledged. First, the sample that participated in their final year of elementary school and the first year of secondary school (from Grade 5/6 to Grade 7) was smaller than the other cohorts. As a result, some of the cells in the cross-tabulation had expected frequencies below 5, which affected statistical power (Von Eye, 2002). It is possible that some of the antitypical patterns found in the other samples could not be detected in this smaller sample, due to the lower expected frequencies. However, it is also possible that peer status at the beginning of secondary school cannot be accurately predicted by peer status at the end of primary school. In future research, the consequences of the school transition for change and stability of peer status should be examined more closely.
Second, our measures were all derived from peer nominations. While peer nominations have clear advantages over self-reports (Bukowski, Cillessen, & Velásquez, 2011), the fact that all measures were obtained with the same method may have led to a more robust pattern of differences than would have been observed from measures obtained by self, parent, or teacher reports. Third, the current study used a homogeneous sample of Dutch youth in a country-specific educational context. In The Netherlands, youth go to elementary school until age 12 (Grade 6). In elementary education, they are in a single classroom with a single teacher and the same peers throughout the day. By age 12, youth go to secondary education until graduation between the ages of 16 and 18. There, they are in multiple classrooms with different teachers and often with different peers. Moreover, they come into contact with peers from different ages. As explained before, the distinction between preferred and popular status groups may have been influenced by this unique educational system. Therefore, it is important to replicate our findings in other samples (ethnically and economically) and educational contexts.
Finally, data were collected using pencil-and-paper questionnaires in Grade 3/4, whereas computerized nomination methods were used in Grades 5/6, 7, and 8. In both types of assessments, children were instructed to nominate at least one classmate for each question. In the computerized assessments, the script was even programmed in such a way that children had to name at least one classmate in order to proceed to the next question. As a result, the mandatory one-choice procedure in the computerized assessments can inflate the nominations given compared with the paper assessment, making the data less comparable. van den Berg and Cillessen (2013) have described the same procedure, and they systematically compared the reliability and validity of computerized assessments with the traditional paper-and-pencil assessments. They showed that participants indeed gave slightly more nominations when using computerized sociometry. However, they also found that the internal consistency, the agreement among voters, the pattern of correlations among measures, and their predictive validity were not affected or were even slightly better than when measured with paper questionnaire. Thus, even though the nominations given were slightly inflated when using computerized assessments, data were reliable and valid across both methods when measuring peer status and social behavior.
In summary, unique subtypes of peer status were identified using cluster analyses among large samples of children and adolescents in primary and secondary education. It appeared that youth do not clearly categorize liked and popular peers until secondary education around the age of 14. Still, in all age groups distinct subtypes of peer status were identified when preference and popularity were incorporated into a single framework. The subtypes not only differed in peer status, but also demonstrated distinct patterns of behavioral correlates. Moreover, the cohort-sequential analyses showed high stability in group membership, especially among high-status youth. A high status at a young age appeared to have the most positive prospects; it was very stable over time and a drop in status was unlikely to happen. Together, the findings of this study show that preference and popularity become distinct forms of peer status in middle adolescence, emphasizing the importance of a developmental perspective when examining peer status.
Footnotes
Acknowledgements
The authors are grateful to the children, parents, teachers, and school administrators who made this research possible.
Declaration of Conflicting Interests
The author(s) declared no potential conflicts of interest with respect to the research, authorship, and/or publication of this article.
Funding
The author(s) disclosed receipt of the following financial support for the research, authorship, and/or publication of this article: The data collection at Wave 5 was supported by a grant from the Netherlands Organization.