
Abstract
This study examined the relations between the schoolwide prevalence of teasing and bullying (PTB) and schoolwide academic performance in a sample of 271 Virginia middle schools. In addition, the study examined the mediating effects of student engagement. A three-step sequence of path models investigated associations between schoolwide PTB and state-mandated Standards of Learning test pass rates, with effects examined both directly and indirectly through student engagement while controlling for important school-level characteristics. Separate models were examined for two 7th-grade and four 8th-grade tests. Results indicated that higher levels of both teacher and student perceptions of schoolwide teasing and bullying were significantly associated with lower achievement pass rates and student engagement. The relationship between perceptions of schoolwide teasing and bullying and achievement was partially mediated by student engagement. These findings bring new support for the need for schoolwide interventions to reduce teasing and bullying among middle school students.
In the course of middle school, many students experience a decline in academic performance and social-emotional well-being (Kim, Schwartz, Cappella, & Seidman, 2014). Bullying, generally defined as repeated acts of verbal or physical aggression that are intended to inflict harm on a weaker or less powerful victim (Gladden, Vivolo-Kantor, Hamburger, & Lumpkin, 2014; Olweus, 1993), is of special concern in middle schools (Espelage, Hong, Rao, & Low, 2013). Students and staff express more concerns regarding bullying in middle schools than in other grade levels (Bradshaw, Sawyer, & O’Brennan, 2007). A national survey found that approximately 32% to 37% of students in Grades 6 to 8 report being bullied while at school (National Center for Education Statistics, 2012). A longitudinal study found that 51% of students reported a period of bully victimization during 3 years of middle school (Baly, Cornell, & Lovegrove, 2014), and another investigation revealed that as many as 71% of middle school students experienced occasional bullying and 15% reported frequent experiences with bullying (Guerra, Williams, & Sadek, 2011).
There is a substantial body of research indicating that peer victimization negatively affects academic performance (Espelage, Hong, Rao, & Low, 2013). A meta-analysis of 33 studies found that victims of peer aggression have lower academic functioning across measures such as grade point average (GPA) and standardized testing (Nakamoto & Schwartz, 2010). In a secondary school sample, students who reported personal bully victimization were more likely to have a lower GPA than students who were bystanders (Glew, Fan, Katon, & Rivara, 2008). A study of sixth-grade students found that both self-reported bully victimization and peer reports of victimization were negatively associated with GPA (Juvonen, Wang, & Espinoza, 2011).
Bullying has also been found to affect student bystanders not directly involved as victims (Pepler & Craig, 1995; Swearer, Espelage, Vaillancourt, & Hymel, 2010). Research estimates that about 63% of students have witnessed some form of peer victimization while at school (Rivers, Poteat, Noret, & Ashurst, 2009). Witnessing peer victimization has been linked to mental health risks such as anxiety and hostility (Rivers et al., 2009). Furthermore, student perceptions of the prevalence of teasing and bullying (PTB) at school have been negatively associated with student commitment to education (Mehta, Cornell, Fan, & Gregory, 2013).
Schoolwide Effects
Although most studies have examined individual-level effects of bullying victimization on academic outcomes, only a few studies have investigated school-level effects. Individual-level effects are found in analyses that use individual survey data (individual-level variables), whereas school-level effects are found in analyses using the aggregate of all individual survey data for one school (school-level variables). As opposed to individual-level variables, school-level variables represent the collective perceptions of students and teachers at a school and are considered to be an important indicator of the school’s functioning (Cohen, McCabe, Michelli, & Pickeral, 2009). Therefore, school-level effects represent how overall perceptions of a school affect a school’s students, staff, and the school as an educational institution.
School-level findings are important from a theoretical and policy perspective because they imply that peer victimization is not limited to individual effects requiring individual intervention with the students who have been bullied but requires a broader consideration of the school climate and potential impact across the student body. The social-ecological model of bullying emphasizes that bullying occurs in a contextual system that must consider the effects of peers and the social environment on individual students (Swearer et al., 2010). From a policy perspective, school authorities are under considerable pressure to attain high levels of school academic performance, and a demonstration of school-level effects of bullying could increase the priority of antibullying efforts (Lacey & Cornell, 2013). As Hanson, Austin, and Zheng (2011) concluded, “efforts to turn around low-performing schools and increase student achievement will be improved if they include learning supports that make these schools more safe, caring, challenging, participatory, and engaging for the youth they serve” (p. 1).
Regarding school-level effects, a California study found that schools with higher school-level scores on the state’s Academic Performance Index had lower rates of peer victimization, even after controlling for student demographics (Hanson et al., 2011). A Canadian study found that school principal ratings of the extent of bullying in the school were associated with school performance on achievement testing (Konishi, Hymel, Zumbo, & Li, 2010), and a study of Virginia high schools found that student reports of the PTB in their school were negatively associated with schoolwide passing rates on state-mandated achievement tests (Lacey & Cornell, 2013). Notably, an association was found between student reports of how much teasing and bullying they observed at school and schoolwide passing rates on state-mandated achievement tests even after controlling for student reports of personal bullying victimization (Lacey & Cornell, 2013). This finding suggested that lower school-level academic performance was not simply related to the higher proportion of students who reported being bullied but reflected a general school effect of teasing and bullying.
Measurement Concerns
Research on bullying is embedded in a broader body of research on peer victimization, which is a more general concept that encompasses being a target of aggression perpetrated by other children (Espelage, Hong, Rao, & Low, 2013). Peer victimization does not carry the more narrow restrictions that bullying must be intentional, repetitive, and characterized by a power imbalance favoring the aggressor (Gladden et al., 2014; Olweus, 1993). However, there is considerable inconsistency across studies of bullying (Furlong, Sharkey, Felix, Tanigawa, & Green, 2010). Some studies of bullying either do not use the term bullying or do not provide a definition of bullying, and as a result may include peer aggression that is not technically bullying (e.g., DeVoe & Bauer, 2011; Kann et al., 2014). Moreover, there is evidence that providing students with the standard definition of bullying (Olweus, 1993) does not limit reports to cases involving a power imbalance (Baly & Cornell, 2011; Green, Felix, Sharkey, Furlong, & Kras, 2013). A further complication is that some studies have concluded that students are adverse to using the term “bully” in describing their personal involvement in bullying (Kert, Codding, Tryon, & Shiyko, 2010; Sawyer, Bradshaw, & O’Brennan, 2008). Not surprisingly, critics have questioned the value of a distinction between bullying and peer victimization and urged a broader focus on peer victimization as a more flexible and inclusive concept (Finkelhor, Turner, & Hamby, 2012).
One approach to these measurement concerns was the development of the Prevalence of Teasing and Bullying scale, which asks students about observations of their peers rather than their personal victimization experiences (Bandyopadhyay, Cornell, & Konold, 2009). The scale also broadens the scope of questions from bullying to include more general verbal aggression such as teasing about clothing and physical appearance, race/ethnicity, and sexual topics. A series of studies with the Prevalence of Teasing and Bullying scale have supported its factor structure and criterion-related validity across four independent samples of middle and high school students (Bandyopadhyay et al., 2009; Klein, Cornell, & Konold, 2012; Konold et al., 2014). The most recent study conducted a multilevel structural analysis that supported the factor structure of the Prevalence of Teasing and Bullying scale at individual and school levels (Konold et al., 2014).
At the individual level, the Prevalence of Teasing and Bullying scale has been associated with student mental health problems including substance use, sadness, and thoughts of suicide (Klein et al., 2012). At the school level, schools with higher scores on the Prevalence of Teasing and Bullying scale had higher suspension rates (Bandyopadhyay et al., 2009), lower student engagement (Mehta et al., 2013), and higher drop-out rates (Cornell, Gregory, Huang, & Fan, 2013a). In two studies, schools with more positive school climates characterized by high disciplinary structure and student support had lower scores on the Prevalence of Teasing and Bullying scale (Cornell, Shukla, & Konold, 2015; Gregory et al., 2010).
The use of multiple informants remains prevalent in contemporary research despite the well-known low associations between different informants that may be solicited to rate the same construct (Konold & Pianta, 2007; Phillips & Lonigan, 2010). These low to moderate associations have been attributed to a variety of factors including the possibility that differences arise as a result of perspective. PTB is typically measured through informant-based reports obtained by students, teachers, or administrators. These examples illustrate what can be conceptualized as structurally different informants because their perspectives may vary as a result of their role within the school and their access to different sources of information (Carretero-Dios, Eid, & Ruch, 2011; Nussbeck, Eid, Geiser, Courvoisier, & Lischetzke, 2009). At the same time, more reliable estimates of school characteristics like the PTB could be obtained by soliciting multiple raters of the same type (i.e., interchangeable raters) that might include multiple student ratings or multiple teacher ratings. Research designs that involve informant-based systems of assessment are said to provide “the most comprehensive insights into validity” (Eid et al., 2008) when both structurally different and interchangeable raters are employed.
Student Engagement
Few studies have investigated how peer victimization might lead to lower academic performance at the school level. At the individual student level, two studies have investigated the mediating role of school engagement (Buhs, 2005; Hoglund, 2007). Hoglund (2007) posited that peer victimization resulted in adjustment problems such as anxiety and depression, which in turn reduced the student’s enjoyment of school and commitment to learning, and that this disengagement from school resulted in decreased academic performance. At the school level, one possible mechanism is that a climate of teasing and bullying discourages student engagement in school more generally for the student body. Students in schools with more teasing and bullying may feel less connected to school and less invested in learning than students in schools with more positive school climates. Poor student engagement in school, in turn, may decrease schoolwide academic performance.
Student engagement has long been recognized as a major factor in academic success (DiPerna, 2006; Finn & Rock, 1997). Engagement has been conceptualized as having both cognitive and affective components (Appleton, Christenson, & Furlong, 2008). Cognitive engagement is defined as motivation and investment in the process of learning, whereas affective engagement is having feelings of pride and attachment to school. Several studies have found that peer victimization is associated with lower school engagement (Juvonen, Graham, & Schuster, 2003; Juvonen et al., 2011; Mehta et al., 2013). Notably, Juvonen, Wang, and Espinoza conducted a 3-year longitudinal study that linked victimization to both student grades and teacher ratings of academic engagement in 11 middle schools.
The Current Study
The present study extends prior research by measuring the PTB with a middle school sample of structurally different (i.e., teachers and students) and interchangeable (i.e., multiple teachers and students from each school) raters. We hypothesized that both student and teacher perceptions of the PTB would be associated with schoolwide passing rates on standardized exams as has previously been found in high schools (Lacey & Cornell, 2013).
Prior research at the individual level has established that classroom engagement may be involved in the relation between peer victimization and academic achievement (Buhs, 2005; Hoglund, 2007). However, research has yet to establish the potential mechanism by which the PTB is associated with school standardized exam passing rates. In order to further our understanding of the relation between the Prevalence of Teasing and Bullying scale and standardized exam passing rates at the school level, we examined whether student engagement in school mediates the relation between the two. We hypothesized that higher scores on the Prevalence of Teasing and Bullying scale will be associated with lower student engagement which, in turn, will predict lower standardized exam passing rates. See Figure 1 for a graphic illustration of our model.
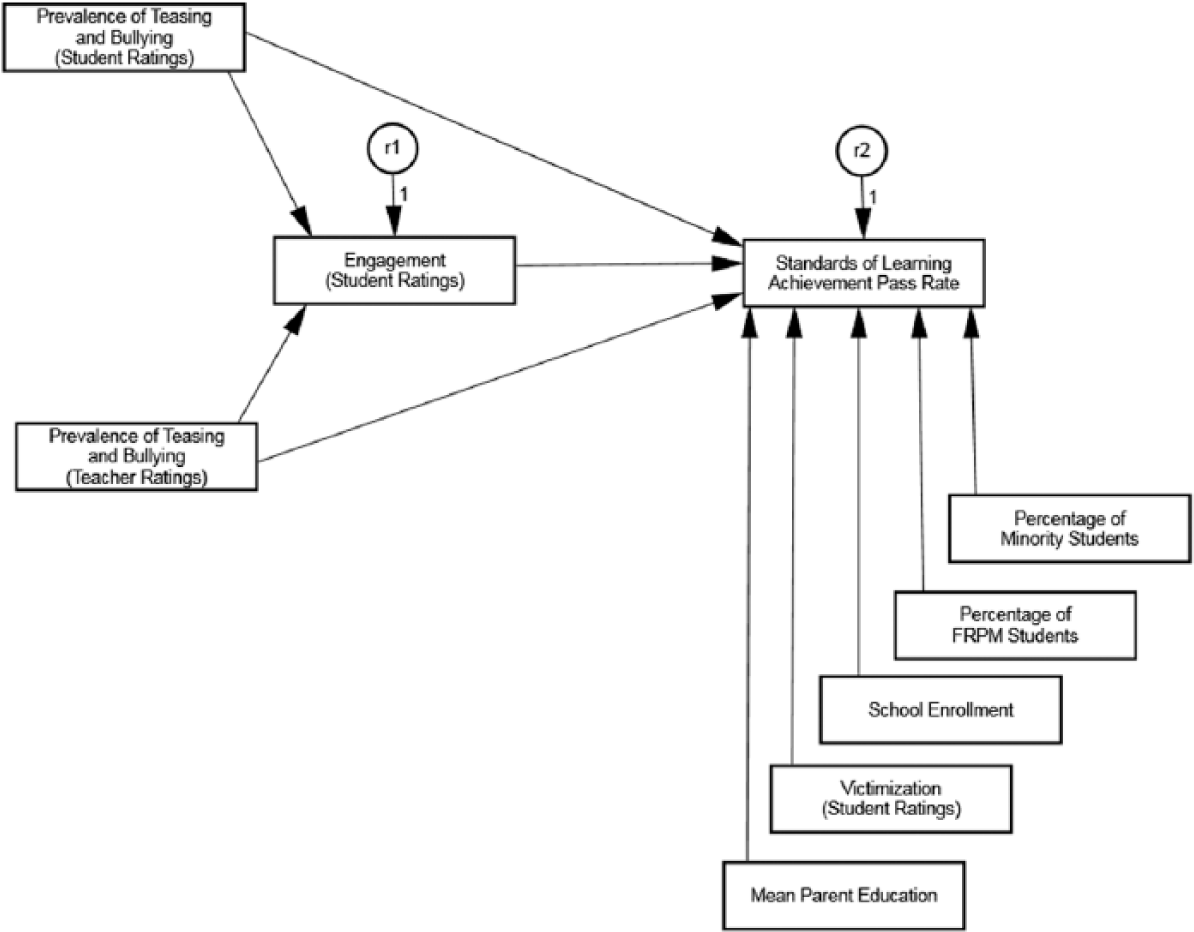
Illustrative path model.
School demographics have been found to be important factors in studies of school functioning (Gottfredson, Gottfredson, Payne, & Gottfredson, 2005; Juvonen & Graham, 2014; Leithwood & Jantzi, 2009). Larger school size, higher enrollment of disadvantaged minority students, and lower student socioeconomic status are associated with lower levels of student engagement and weaker academic performance (Gottfredson et al., 2005; Leithwood & Jantzi, 2009). However, there is mixed evidence regarding whether there is more bullying and peer aggression in schools with higher enrollment and greater numbers of minority and economically disadvantaged students (Juvonen & Graham, 2014; Klein & Cornell, 2010). Some evidence shows that greater racial/ethnic diversity is associated with less peer victimization (Juvonen, Nishina, & Graham, 2006). Therefore, four school demographic variables were used as control variables: percentage of students eligible for free or reduced price meals, parent education level, percentage of minority students, and school size. In addition, individual student victimization was included as a control variable in order to show that the overall PTB relates to academic achievement after accounting for individual student experiences of peer victimization.
Method
School Sample
The sample of schools was drawn from the Virginia Secondary School Climate Survey (VSSCS), a statewide study designed to assess school climate and safety conditions in Virginia secondary schools. The survey was conducted as part of the state’s mandatory school safety audit program. Schools that were eligible to participate in the survey offered seventh- or eighth-grade classes, excluding alternative schools that offered part-time classes or exclusively served a special population such as students with disabilities and juvenile corrections residents.
The sample used in this report consisted of the 271 schools with only Grades 6 to 8. The sample represents 62.4% of the 423 eligible schools, excluding schools in which seventh- or eighth-grade students were grouped with elementary or high school grades. Only schools offering Grades 6 to 8 were included because this was the most common grade configuration found in the participating schools, and there is evidence that middle school grade configuration has a confounding effect on student achievement (Schwartz, Stiefel, Rubenstein, & Zabel, 2011). Schools in the study have sixth-grade students, but the state survey was limited to seventh- and eighth-grade students.
The total school enrollment for Grades 6 to 8 varied between 161 and 1,620 students (
Student and Teacher Samples
Schools were provided with two options to sample students: (a) invite all seventh- and eighth-grade students to take the survey, with a goal of surveying at least 70% of all eligible students (whole grade option); (b) use a random number list to select at least 25 seventh- and 25 eighth-grade students (random sample option). These options were designed to give school administrators the flexibility to choose a more or less comprehensive assessment of their students.
Schools choosing the random sample option were provided with a random number list along with instructions for selecting students. Principals were advised to invite up to 50 students in each grade in order to have a pool of alternates in the event that any of the first 25 selected students were unable or unwilling to participate. A target sample of 25 students is comparable with the samples obtained in several national studies of student performance, including the National Educational Longitudinal Study of 1988 (NELS:88; Ingels, Abraham, Karr, Spencer, Frankel, & Owings, 1990) and the National Assessment of Educational Progress (NAEP) program (Chromy, 1998).
As described in detail elsewhere (Cornell et al., 2013b), 35% of the schools used the whole grade sampling option and 65% used the random sampling option. The two groups were compared across all survey items. As would be expected in analyses with this sample size, there are some statistically significant group differences, but the differences were consistently very small (the largest was d = 0.14) and essentially negligible. Student participation rates were calculated separately for the two groups of schools. The participation rate for schools using the whole grade option was 85.3% (28,582 of 33,494 students) and for schools using the random sample option it was 83.9% (15,223 of 18,144 students). According to principal reports, the reasons for nonparticipation were as follows: student was absent due to illness (41%), parent declined (28%), schedule conflict (8%), student declined (5%), student was unable to complete the survey due to a disability (5%), student suspended from school (3%), or some other reason such as computer problem, language barrier, or the student moved (10%).
The student sample consisted of 29,203 seventh- and eighth-grade students. On average, 108 students participated in each school (range = 8-748, SD = 125). The students were 51.6% female. Approximately 51% of the students self-identified as White, 20% as African American, 16% as two or more races, 8% as some Other race, 3% as Asian American, 2% as American Indian, and less than 1% as Native Hawaiian or Pacific Islander. In addition, 13% of students identified as Hispanic or Latino.
Schools were instructed to ask all seventh- and eighth-grade teachers to complete the survey. Approximately 9,099 seventh- and eighth-grade teachers participated in the study. The teacher participation rate was approximately 84%. Approximately 75% of the teachers were female and more than half (53%) had more than 10 years of experience, 24% had 6 to 10 years of experience, 13% had 3 to 5 years, and 10% had less than 3 years of experience. Other teacher demographic information was not collected in order to protect teacher anonymity.
Procedure
Student and teacher surveys were completed online in the spring of 2013. Student surveys were completed anonymously during school hours, supervised by teachers or other school personnel. Teachers completed surveys independently. All participants read standard instructions prior to completing the survey.
Previous research found that the use of validity screening items can identify students who tend to have extreme responses to questions regarding bullying and more negative perceptions of the school environment than other students (Cornell, Klein, Konold, & Huang, 2012; Cornell, Lovegrove, & Baly, 2014). Two validity screening items were included on the student survey. First was “I am telling the truth on this survey” with response options strongly disagree, disagree, agree, and strongly agree. Students who responded strongly disagree or disagree were omitted from the sample. Second was “How many of the questions on this survey did you answer truthfully?” with response options all of them, all but 1 or 2 of them, most of them, some of them, and only a few or none of them. Students who responded some of them or only a few or none of them were omitted from the sample. Of the 32,074 student participants, 2,871 (9%) of the sample were classified as invalid responders. Invalid responders were removed from the data prior to all analyses.
Measures
Measures of bullying and teasing were included in a survey that measured perceptions of school climate and safety conditions, as well as student engagement in school. More detailed survey and project information is available elsewhere (Cornell et al., 2013b).
Prevalence of teasing and bullying
Both teachers and students completed the Prevalence of Teasing and Bullying scale as a measure of the pervasiveness of teasing and bullying in the school. In accordance with prior research (e.g., Felix, Sharkey, Green, Furlong, & Tanigawa, 2011; Juvonen, Nishina, & Graham, 2001; Kert et al., 2010; Sawyer et al., 2008), the Prevalence of Teasing and Bullying scale consisted of five items asking general questions about teasing and bullying that may occur in a school. Response options included strongly disagree, disagree, agree, or strongly agree with response codings ranging from 1 to 4, respectively. The items were as follows: (a) Bullying is a problem at this school, (b) Students here often get teased about their clothing or physical appearance, (c) Students here often get put down because of their race or ethnicity, (d) There is a lot of teasing about sexual topics at this school, and (e) Students here get teased or put down about their sexual orientation. The Prevalence of Teasing and Bullying scale was analyzed at the school level using two scores: the average student score and the average teacher score aggregated for each school. Multiple studies have confirmed a single factor structure of the scale for use with students (Bandyopadhyay et al., 2009; Klein et al., 2012; Konold et al., 2014). Studies have also supported the validity of the teacher version of the Prevalence of Teasing and Bullying scale (Cornell, Gregory, Huang, & Fan, 2013a; Huang et al., 2015; Lacey & Cornell, 2013). In the current study, the Cronbach’s alpha for the student Prevalence of Teasing and Bullying scale was .90 for Grade 7 and .87 for Grade 8. For the teacher Prevalence of Teasing and Bullying scale, the Cronbach’s alpha was .88.
Student engagement
Students completed the Engagement scale as a measure of their cognitive and affective engagement in school activities. Items for this scale were derived from the Commitment to School scale (Thornberry, Lizotte, Krohn, Farnworth, & Jang, 1991). The scale consisted of six items with response options of strongly disagree, disagree, agree, or strongly agree with response codings ranging from 1 to 4, respectively. The items were as follows: (a) I like this school, (b) I am proud to be a student at this school, (c) I feel like I belong at this school, (d) I usually finish my homework, (e) Getting good grades is very important to me, and (f) I want to learn as much as I can at school. Engagement was analyzed at the school level using the average student score aggregated separately for seventh- and eighth-grade students in each school.
Multilevel exploratory and confirmatory factor analyses supported a two-factor solution for the Engagement scale with two correlated factors labeled “cognitive engagement” and “affective engagement” (root mean square error of approximation [RMSEA] = .05, Comparative Fit Index [CFI] = .99, Tucker-Lewis Index [TLI] = .99) that could be combined to form an overall assessment of student engagement (Konold et al., 2014). In the current sample, the cognitive engagement and affective engagement subscales had a moderately strong association (r = .42, p < .01). Therefore, the six-item Engagement scale was used as a general measure of school engagement. Cronbach’s alpha was .83 for Grade 7 and .84 for Grade 8.
Bullying victimization
The Bullying Victimization scale measured personal experiences with bullying victimization. The following definition was presented:
Bullying is the repeated use of one’s strength or popularity to injure, threaten, or embarrass another person on purpose. Bullying can be physical, verbal, or social. It is not bullying when two students who are about the same in strength or popularity have a fight or argument.
The Bully Victimization scale consisted of five items, with response options of never, once or twice, about once per week, or more than once per week with response codings ranging from 1 to 4, respectively. Students first reported whether they had been bullied at school in the past year. Students were then asked if they had been physically, verbally, socially, and cyber bullied at school in the past year. This measure of personal bully victimization is consistent with other measures of bullying (e.g., Olweus, 2007).
Prior research has shown that this self-report of bullying victimization corresponded with peer and teacher nominations of victims of bullying (Baly et al., 2014; Branson & Cornell, 2009; Cornell & Brockenbrough, 2004). Furthermore, a 3-year longitudinal study found that bullying victimization scores had good stability over time (Baly et al., 2014). In addition, self-reported bullying victimization has been related to poor student outcomes including depression, feelings of sadness, thoughts of suicide, and lower GPA as well as negative perceptions of the safety and supportiveness of school climate (Baly et al., 2014; Branson & Cornell, 2009). In the present study, an overall bullying victimization score was calculated by summing the five personal bullying victimization questions for each participant and averaging the scores for participants in each school to create school-level scores for Grades 7 and 8. The Cronbach’s alpha was .86 for Grade 7 and .87 for Grade 8.
Academic achievement
Passing rates for the 2013 Virginia Standards of Learning exams were used as the measure of school-level academic achievement. Passing rates indicate the percentage of students in a school who performed at or above the minimum level on Standards of Learning exams. School passing rates for Standards of Learning exams were obtained from the Virginia Department of Education; individual results for the students in this study were not available. Standards of Learning exams are state-mandated tests intended to measure student learning and achievement (Virginia Department of Education, 2007). Students typically complete these exams at the end of the school year in correspondence with related courses. First administered in 1998, school performance on the Standards of Learning exams has been a criterion for school accreditation and funding since 2006 (Virginia Department of Education, 2010).
The Standards of Learning tests were developed using test blueprints, item development specifications, review committees, field testing, and item banking. These procedures were used to limit item bias and ensure appropriate item difficulty and content coverage. As a whole, the Standards of Learning exams have been found to have acceptable reliability across race and gender (α > .70; Virginia Department of Education, 2007). Six Standards of Learning subject exams completed in middle school were analyzed: Grade 7 English Reading, Grade 7 Mathematics, Grade 8 English Reading, Grade 8 Writing, Grade 8 Mathematics, and Grade 8 Science.
School demographics
Four school demographic variables were used as control variables: parent education, school size, percentage of minority students, and the percentage of students eligible for free or reduced price meals. All school demographic variables were acquired from state records with the exception of parent education. During the survey, students reported the highest level of education that their parent or guardian attained. Responses were as follows: did not graduate from high school (1), graduated from high school (2), graduated from 2-year college or technical school (3), graduated from 4-year college (4), and completed post graduate studies (5).
Analytic Plan
All analyses were conducted with the Analysis of Moment Structures 18.0 (AMOS) program. The direct and indirect effects of the PTB on student achievement were investigated through a series of path models. These models considered the full network of relations among these variables while controlling for important school-level characteristics. School-level PTB was measured through ratings obtained by both structurally different (i.e., students and teachers) and interchangeable raters (i.e., ratings obtained by multiple students and multiple teachers; Eid, Lischetzke, Nussbeck, & Trierweiler, 2003) to allow for differential relations that may result between informant types that have different roles in the school and to provide for more reliable measures of assessments of school PTB, respectively. A graphic representation of the full path model that included the direct effects of PTB on student achievement, and the indirect effects of PTB through engagement, is presented in Figure 1. Also shown in Figure 1 are the school-level control variables. All exogenous variable correlations were freely estimated in all models but are not depicted in Figure 1 to facilitate clarity of presentation.
Separate models were examined for achievement measures in reading, mathematics, writing, and science. The first two achievement measures were available for students in Grade 7, and all four achievement measures were available for students in Grade 8, resulting in a total of six path models. Grade-specific PTB, engagement, and bully victimization ratings obtained by students were aligned with the grade-specific achievement outcome in each model.
Each path model was investigated in three steps in order to assess the incremental outcome change in R2 (ΔR2). The first step included only the covariates of percentage of students who identify as minority, percentage of free or reduced price meal students, school enrollment, victimization, and parent education, shown at the bottom of Figure 1. Step 2 added the school Prevalence of Teasing and Bullying scale ratings obtained by the structurally different informants of students and teachers in order to assess the incremental change in R2 that could be attributed to these variables above that which was accounted for by the school covariates. The third step evaluated the full model shown in Figure 1 that further added Engagement and the indirect effects of Prevalence of Teasing and Bullying scale ratings on achievement pass rates as mediated through Engagement scale ratings.
All effects were evaluated through bias-corrected, percentile-based bootstrapping with 2,000 replications and 95% confidence interval specifications. This approach is widely recognized as being superior to other commonly employed methods for assessing the presence of indirect effects (e.g., Baron & Kenny’s, 1986, causal steps approach, Sobel’s, 1982, test). It incorporates a model-building strategy that places less importance on the need for obtaining statistically significant direct effects as a precondition for establishing the importance of mediating variables through direct tests of indirect effects (Hayes, 2009).
Results
Data were inspected for outliers, extreme values, missing values, and multicollinearity. Boxplot examination revealed between 18 and 28 univariate outliers across Standards of Learning tests, but all cases were within the range of possible values. Furthermore, results of supplementary analysis excluding univariate outliers did not differ markedly from the results presented in this article. Between 4 and 7 multivariate outliers were indicated by Mahalanobis Distance analyses across Standards of Learning tests (cutoff of D2 = 22.45). As recommended by Tabachnick and Fidell (2007), multivariate outliers were removed from the data. Tolerance statistics were interpreted in order to identify multicollinearity between variables. Tolerance statistics for all variables fell above the standard cutoff of .10 and histograms suggested that residuals were randomly distributed for all variables.
Descriptive statistics of study variables are presented in Table 1. The six subject exam scores indicate the average percentage of students who received a passing score in each school, ranging from 56.7% for Grade 7 Mathematics to 75.2% for Grade 8 Science. On average, the schools had an enrollment of 773 students with 43.5% identifying as minority and 43% receiving free or reduced price meals. The mean parent education of 3.3 was between the level of a 2-year college or technical school and a 4-year college degree. The average report of bullying victimization (1.5 for seventh grade and 1.4 for eighth grade) fell between the levels of never being bullied and being bullied once or twice during the last year. The average score for PTB by both teachers (2.3) and students (2.6) fell between the levels of disagree and agree. However, paired t tests indicated that the school average PTB score for teachers was significantly lower than the average for seventh-grade students, tGrade 7 students = 18.39, p < .01, and eighth-grade students, tGrade 8 students = 19.72, p < .01. The average level of engagement reported by seventh-grade students (3.1) and eighth-grade students (3.0) fell close to the level of the “agree” category.
Descriptive Statistics for Study Variables.
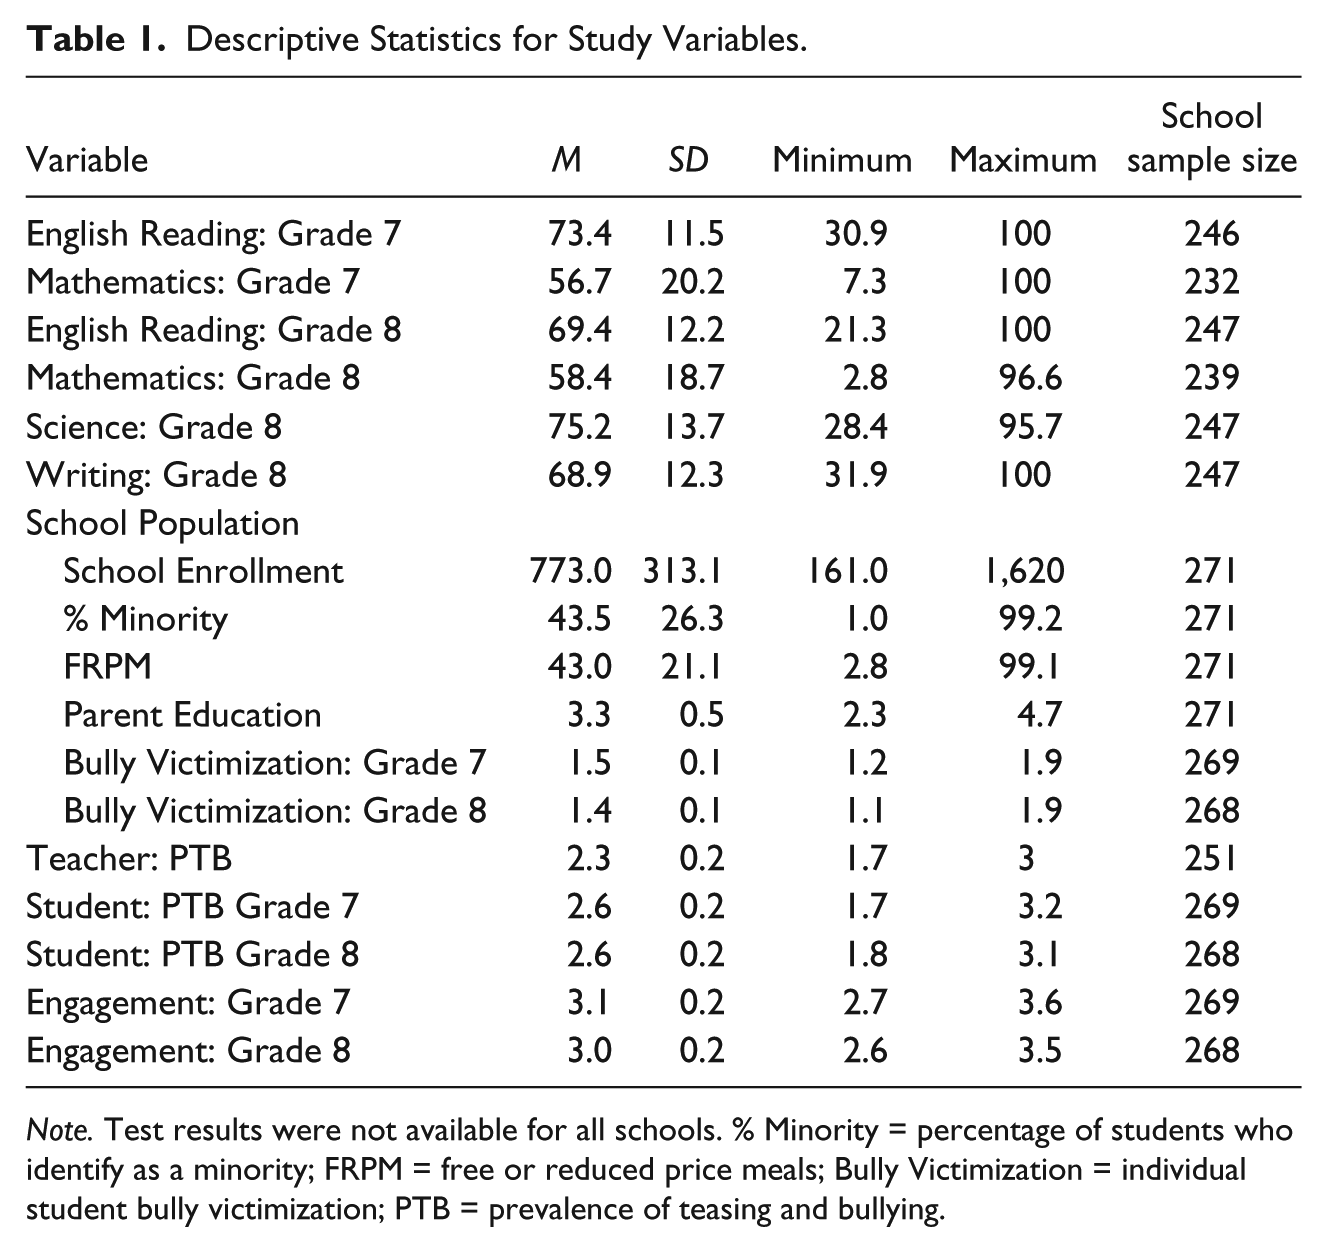
Note. Test results were not available for all schools. % Minority = percentage of students who identify as a minority; FRPM = free or reduced price meals; Bully Victimization = individual student bully victimization; PTB = prevalence of teasing and bullying.
Intercorrelations among study variables are presented in Table 2. Percentage of students receiving free or reduced price meals and the percentage of minority students were significantly negatively correlated with the passing rates of all six exams whereas parent education was significantly positively correlated with the passing rates of all six exams. School size was significantly negatively correlated with all passing rates with the exception of Science. Grade 7 and Grade 8 student reports of victimization were found to be significantly negatively correlated with Grade 7 English Reading.
Correlations Among Study Variables.
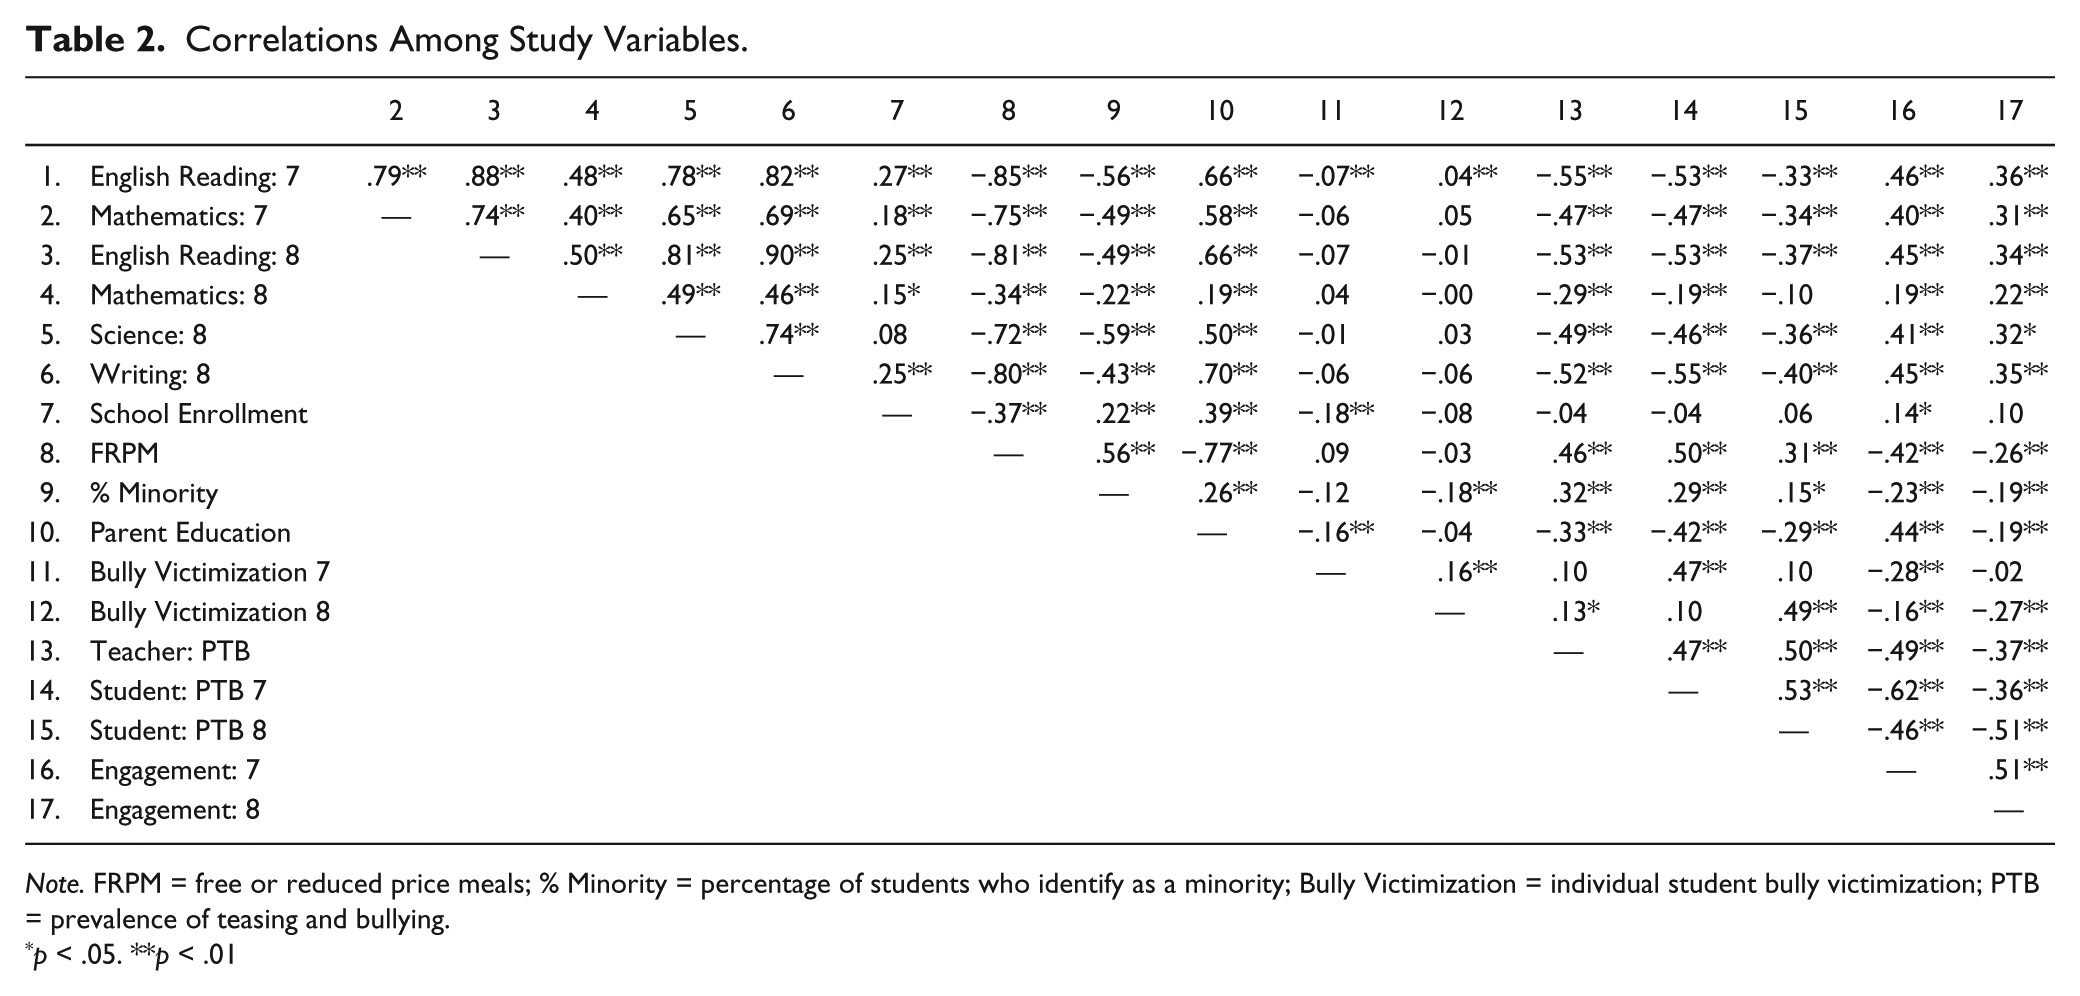
Note. FRPM = free or reduced price meals; % Minority = percentage of students who identify as a minority; Bully Victimization = individual student bully victimization; PTB = prevalence of teasing and bullying.
p < .05. **p < .01
Grades 7 (r = .47, p = .000) and 8 (r = .50, p = .000) student Prevalence of Teasing and Bullying scale ratings were positively associated with teacher Prevalence of Teasing and Bullying scale ratings. Likewise, teacher Prevalence of Teasing and Bullying scale ratings were negatively correlated with Engagement scale ratings obtained from students in Grades 7 (r = −.49, p = .000) and 8 (r = −.37, p = .000). The negative association between Prevalence of Teasing and Bullying scale ratings and Engagement scale ratings was high for both seventh grade (r = −.62, p = .000) and for eighth grade (r = −.51, p = .000).
Results from each of the six path models are shown in Table 3. The first step only examined the effects of school control variables. Higher percentages of students receiving free or reduced price meals significantly predicted lower pass rates on all exams and both grade levels. Higher percentages of minority students in the schools significantly predicted lower school pass rates in eighth-grade science and seventh-grade reading, and higher parent education was significantly associated with higher pass rates in eighth-grade reading and eighth-grade writing.
Standardized Regression Coefficients.
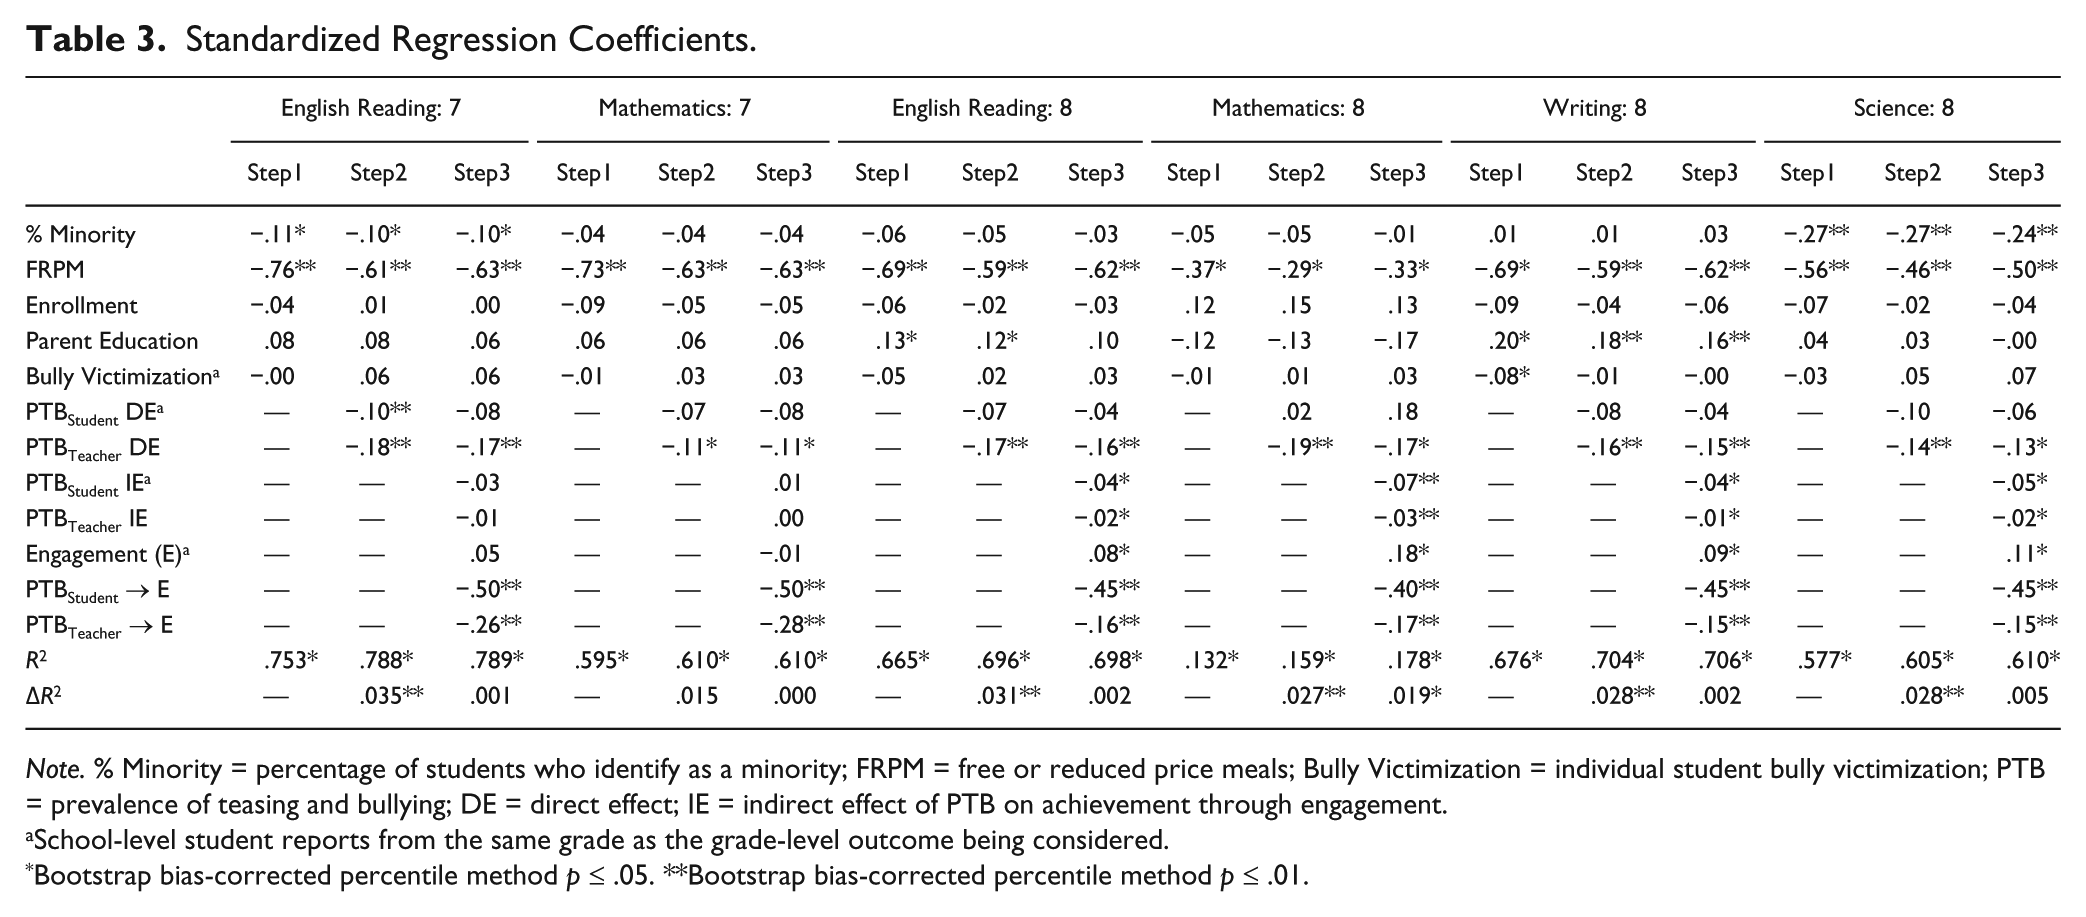
Note. % Minority = percentage of students who identify as a minority; FRPM = free or reduced price meals; Bully Victimization = individual student bully victimization; PTB = prevalence of teasing and bullying; DE = direct effect; IE = indirect effect of PTB on achievement through engagement.
School-level student reports from the same grade as the grade-level outcome being considered.
Bootstrap bias-corrected percentile method p ≤ .05. **Bootstrap bias-corrected percentile method p ≤ .01.
Student and teacher scores on the Prevalence of Teasing and Bullying scale were added at Step 2 of each model. In five of the six models, results indicated a significant increase in the amount of variance accounted for in school passing rates over and above that which could be explained by the school-level controls with the change in R2 ranging from .027 to .035. Moreover, teacher Prevalence of Teasing and Bullying scale ratings were related to passing rates in all six models, whereas student Prevalence of Teasing and Bullying scale ratings were related to passing rates in one of the six models. Step 3 added the predictor of Engagement and estimated the indirect paths linking PTB to school passing rates through Engagement. In all investigated models, Prevalence of Teasing and Bullying scale ratings from both students and teachers were related to Engagement scale ratings (all ps < .01), and all indirect effects for both student and teacher Prevalence of Teasing and Bullying scale ratings (through Engagement scale ratings) on eighth-grade pass rates were significant, ps < .05.
The final model (i.e., Step 3) revealed that student and teacher Prevalence of Teasing and Bullying scale ratings were significantly related to school engagement for all Standards of Learning exams (βstudent PTB direct range = −.40 to −.50; βteacher PTB direct range = −.15 to −.28). Teacher Prevalence of Teasing and Bullying scale ratings were directly associated with school passing rates for all of the Standards of Learning exams (βteacher PTB direct range = −.11 to −.17). Engagement scale ratings had a direct association with passing rates for all Grade 8 passing rates (βStudent engagement direct range = .08 to .18). The indirect effect of Prevalence of Teasing and Bullying scale ratings through Engagement scale ratings on passing rates was significant for students and teachers for Grade 8 English Reading, Grade 8 Mathematics, Grade 8 Writing, and Grade 8 Science (βstudent PTB indirect range = −.04 to −.07; βteacher PTB indirect range = −.01 to −.03). In general, this pattern of results suggest that the association between student Prevalence of Teasing and Bullying scale ratings and Standards of Learning passing rates is fully mediated by Engagement scale ratings, and that this association is partially mediated by Engagement scale ratings for teacher Prevalence of Teasing and Bullying scale ratings.
Discussion
In recent decades, there has been increasing focus in schools on student performance on standardized exams, which has made it more difficult for school administrators to attend to nonacademic matters such as school climate or bullying (Spillane & Kenney, 2012). Nevertheless, research suggests that student academic performance may benefit from improving school climate (e.g., Bandyopadhyay et al., 2009; Cornell et al., 2013a; Konishi et al., 2010; Lacey & Cornell, 2013). The present study found that student and teacher perceptions of greater PTB were associated with lower school passing rates on six Virginia Standards of Learning exams administered in middle school. These results are consistent with prior studies linking reports of the PTB with school performance on similar exams in high schools (Lacey & Cornell, 2013, 2016). Prior research showed this negative relation in high schools using student, teacher, and principal reporters. The present findings add to the body of research by demonstrating this association in a middle school sample.
In addition, this study offers new evidence of one mechanism by which teasing and bullying may be related to test passing rates. For all Grade 8 Standards of Learning exams, student Engagement mediated the relation between student and teacher perceptions of teasing and bullying and test passing rates. The relations were partially mediated for teachers, and fully mediated for students across these Standards of Learning exams. These results suggest that, at the school level, the link between the teasing and bullying and academic achievement may be partially attributed to the role of student engagement. It might be that more prevalent teasing and bullying leads to lower student engagement in school which, in turn, may decrease student capacity to learn and perform academically. These results reflect findings from prior research using individual-level data that demonstrated links among bullying, engagement, and academic achievement (Bandyopadhyay et al., 2009; Buhs, 2005; Hoglund, 2007; Juvonen et al., 2011; Konishi et al., 2010; Mehta et al., 2013; Ripski & Gregory, 2009).
Teacher and student Prevalence of Teasing and Bullying scale ratings were moderately correlated (rGrade 7 students = .47 and rGrade 8 students = .50), but both contributed significantly to the prediction of passing rates. Teacher perceptions had a direct effect on more (all six tests) of the Standards of Learning passing rates than student perceptions, which failed to demonstrate a direct effect on any of the Standards of Learning passing rates. At the same time, the indirect effect of both teacher and student Prevalence of Teasing and Bullying scale ratings on Standards of Learning passing rates were similar in that these effects were observed for both structurally different informant types on four of the tests. When the analyses were repeated with Bully Victimization omitted, there was little change in the pattern of findings. The PTB is a factor that can be improved with appropriate intervention. Therefore, these findings suggest that teasing and bullying may be an important, and potentially modifiable, component in student success.
The three demographic variables accounted for approximately 57% of the variance on average (range = 13.2%-75%) in school passing rates. Demographic variables explained considerably less of the variance in Grade 8 Mathematics (13.2%) than for the other five exams (range = 57.7%-75.3%). The majority of the variance in passing rates was accounted for by the percentage of students eligible for free or reduced price meals. These findings indicate that school demographics, which are not easily modified, are related to school performance on measures of academic achievement.
These results are consistent with prior research demonstrating that academic achievement is associated with school demographics including the minority composition of the student body, school size, and measures of socioeconomic status (Klein & Cornell, 2010; Leithwood & Jantzi, 2009; Sirin, 2005; Sutton & Soderstrom, 1999). Furthermore, the particular importance of the percentage of students eligible for free or reduced price meals to academic achievement is consistent with prior research showing that there is a large degree of association between measures of socioeconomic status and academic achievement at the school level (Sirin, 2005).
In the current study, personal bullying victimization was used as a covariate to control for the potential effects of personal bullying experiences on student ratings on the Prevalence of Teasing and Bullying scale. Personal bullying victimization did not predict passing rates for five out of the six Standards of Learning exams. These results are consistent with prior research on the relation between school-level measures of self-reported bullying victimization and Standards of Learning exam pass rates (Lacey & Cornell, 2013). Given that this is an aggregated school-level measure, the lack of a relation between measures of personal bully victimization and academic achievement may be a reflection of low levels of individual bullying for most student survey participants. If the majority of students who are surveyed are not direct victims of bullying, higher scores on the bullying victimization measure that are typically associated with lower academic achievement at the individual level become restricted when aggregated at the school level. However, student perceptions of the PTB in a school is negatively related to school achievement even though surveyed students may not be direct victims of bullying.
Limitations and Directions for Future Research
One limitation of this study is that it was correlational and cannot establish a causal relation or determine the direction of effects. The association between teasing and bullying and academic achievement may be bidirectional; teasing and bullying may affect academic achievement or academic achievement conceivably could affect the PTB. However, the findings of this study are consistent with prior research on the relations between student perceptions of teasing and bullying and academic performance (Lacey & Cornell, 2013, 2016). Future research would benefit from an experimental design that could demonstrate a causal relation.
In addition, the association between the PTB and academic achievement may be explained by other variables not included in these analyses such as teacher classroom management skills, school rules, and instructional practices as well as numerous other potential school and community variables. Although student engagement was found to mediate this association, other variables may also act as mediators in the relation or may have direct effects on any or all variables included in these analyses. For example, high levels of bullying have been linked with underdeveloped classroom management skills and low staff consensus on rules and instructional practices (Roland & Galloway, 2002, 2004). Schools with poorer classroom management and institutional policies may fail to support teachers and students in efforts to improve learning. Furthermore, such schools also may not encourage staff to attend to peer conflict such as teasing and bullying. Teachers in such schools may spend a disproportionate amount of time on discipline and less time on instruction leading to lower achievement. Future research could include additional variables that might mediate or better account for the relations between teasing and bullying and academic achievement.
Another limitation is the use of the six-item Engagement scale. A longer and more comprehensive scale might identify additional aspects of student engagement, such as behavioral engagement in the classroom, that were not considered in this study (Fredricks, Blumenfeld, & Paris, 2004). Although prior research supported the use of this scale (Mehta et al., 2013), a multilevel analysis with the current sample obtained mixed results, with more support for the scale at the individual student level than the school level (Konold et al., 2014). These results suggested that it may be difficult to conceptualize student engagement as a school-level construct. However, the mediation analyses are consistent with the view that lowered engagement may be one of the mechanisms through which bullying in a school is related to lower achievement (Ripski & Gregory, 2009).
The analyses were based on school-level passing rates; individual student test scores were unavailable. Individual student test scores that could be linked to the survey data would permit the use of hierarchical linear modeling techniques to determine the potential multilevel relations between school climate and standardized test performance.
Finally, it should be acknowledged that the magnitude of the associations between the PTB and schoolwide exam performance were not large. After controlling for school and student demographic variables, the teacher and student perceptions of the extent of teasing and bullying in the school accounted for about 2% to 3% of the variance in test passing rates. However, the majority (61%) of Virginia public schools did not meet the Annual Yearly Progress goals for Standards of Learning passing rates (Virginia Department of Education, 2011). Even a small improvement in passing rates would be sufficient for most of these schools to meet state standards. Furthermore, there is evidence for a cumulative effect of teasing and bullying on students that is associated with higher drop-out rates (Cornell et al., 2013a).
Implications for Practice and Conclusion
Given the increased focus on test performance in schools, time and resources are heavily allocated to prepare students for standardized exams (Spillane & Kenney, 2012). To bolster student performance, schools tend to focus on test taking skills and academic instruction (Spillane & Kenney, 2012). The findings of the current study suggest that attention to school climate, and in particular the PTB in a school is warranted. Schools may benefit from schoolwide interventions aimed to reduce bullying and improve civility among students (Card & Hodges, 2008). A schoolwide emphasis is merited because the impact of bullying and teasing does not appear to be limited to direct victims, but could affect the student body as a whole and the quality of student engagement in school.
Schoolwide interventions may be successful, in part, by targeting school personnel, parents, and student perceptions and behaviors related to bullying and setting firm rules and sanctions for bullying behaviors. Meta-analyses have found that school-based antibullying programs effectively reduced victimization and bullying (Ttofi & Farrington, 2011). Several program components have been associated with a decrease in bullying including parent training, counseling with parents, improved supervision, and teacher consultation regarding classroom management (Ttofi & Farrington, 2009, 2011). For example, teachers and other staff may benefit from training to improve staff recognition of bullying and intervention skills. Bullying prevention programs have also been shown effective by increasing bystander intervention when bullying occurs (Polanin, Espelage, & Pigott, 2012). When schoolwide interventions are not possible, Card and Hodges (2008) suggested including individual interventions for both victims and aggressors. Individual interventions may focus on improving social skills, decreasing risk factors, and minimizing the long-term impact of bullying on the victim (e.g., depression). There are several established schoolwide antibullying programs available such as the Olweus Bullying Prevention Program (Limber, 2004) and Second Step Bullying Prevention Unit (Committee for Children, 2012; Espelage, Low, Polanin, & Brown, 2013).
Footnotes
Acknowledgements
We thank Donna Michaelis and Jessica Smith of the Virginia Department of Criminal Justice Services and Cynthia Cave of the Virginia Department of Education for their support of the Virginia Secondary School Climate Study.
Authors’ Note
Declaration of Conflicting Interests
The author(s) declared no potential conflicts of interest with respect to the research, authorship, and/or publication of this article.
Funding
The author(s) disclosed receipt of the following financial support for the research, authorship, and/or publication of this article: This project was supported by Grant 2012-JF-FX-0062 awarded by the Office of Juvenile Justice and Delinquency Prevention, Office of Justice Programs, U.S. Department of Justice. The opinions, findings, and conclusions or recommendations expressed in this report are those of the authors and do not necessarily reflect those of the Department of Justice.