
Abstract
This study evaluates the effect of attending a U.S. public middle or junior high school as compared with a K-8 school on eighth graders’ academic and psychosocial outcomes. In a national sample, we conducted propensity score weighted regression analysis. Initial findings indicated that for eighth-grade students, attending a middle or junior high school negatively affected teacher- and self-reported reading/writing competence. After applying population weights, only reading self-concept remained negatively affected by middle school enrollment. Exploratory analysis revealed the negative effects of attending a middle grade school may be present only for the students who enter kindergarten not at risk as measured by socioeconomic status (SES) or academic performance. Taken together, results suggest that negative impacts of middle grade schooling may be limited to teacher- and self-reported reading/writing competence, more pronounced in middle versus junior high school, and more salient for less disadvantaged students. Implications for theory, policy, and practice are discussed.
Keywords
Early adolescence is a time of biological, psychosocial, and ecological changes. These changes provide both challenges to and opportunities for development (Steinberg, 2008). One early adolescent experience that has garnered interest among policy professionals and educators, and has a rich foundation in theory and research, is the experience of middle grade schooling.
During early adolescence, 90% of U.S. public school students attend a school that primarily serves students in the middle grades (Keaton, 2012). Although these schools were initially developed to “suit the needs of the early adolescent” (Seidman, Aber, & French, 2004, p. 235) and to better prepare young adolescents for high school (Cuban, 1992), evidence suggests that middle schools (Grades 6-8) and junior high schools (Grades 7-9) may not, in fact, meet the needs of the early adolescent learner. Indeed, extant literature, which is theory-rich and methodologically varied, identifies academic and psychosocial risks associated with attending a middle grade school in early adolescence (Eccles et al., 1993; Seidman, Allen, Aber, Mitchell, & Feinman, 1994). The corpus of research aligns with developmental mismatch hypothesis (Eccles & Midgley, 1989, 1990), suggesting that students experience personal and academic difficulties when their environment does not match their developmental needs.
Yet, weaknesses in design, analysis, and sampling in the extant literature preclude causal inference or broad generalization. Only a handful of studies use strong causal methods (e.g., Schwartz, Stiefel, Rubenstein, & Zabel, 2011; Schwerdt & West, 2013) or national samples (Kieffer, 2013), and most do not examine the relative impact of middle or junior high school as compared with K-8 enrollment on academic and psychosocial competence. Given federal, state, and local concerns about school success in the middle years (e.g., Balfanz, 2009), we need information that yields causal estimates and is generalizable beyond a specific population.
Toward that end, the current study uses a propensity score weighted regression approach and a national sample to estimate the effect of attending a middle school or a junior high school as compared with a K-8 school on eighth-grade students’ academic and psychosocial outcomes. Under the assumption that all potential confounders are observed, this provides a causal estimate of effects. The aim is to provide policy-relevant information on the impact of school type on the range of early adolescent outcomes that matter for success in high school and beyond.
School Type and Early Adolescence: Associations With Academic Competence
In the 19th century, elementary schools (Grades 1-8) and high schools (Grades 9-12) were prevalent. In the early 20th century, concerns about the need for academic and vocational enrichment programs in early adolescence led to the junior high school movement (Grades 7-9), with the aim to prepare young people for college and work and to meet their “unique social, personal, and academic needs” (Manning, 2000, p. 192). In 1950, middle schools (Grades 6-8) were developed to better address this goal of creating academically rigorous, personally responsive, and socially promotive schools for early adolescents (Williamson & Johnston, 1999). Junior high schools remained and middle schools proliferated; the vast majority of public school students now attend a middle grade school in early adolescence (Keaton, 2012), with a smaller proportion attending K-8 schools. In the early days of the middle school movement, the organization of schooling and pedagogy were theoretically attuned to the developmental needs of early adolescents, but with the rapid expansion of middle schools, what resulted was mainly a change in grade span. As a result, in both middle schools and junior high schools, the alignment of pedagogy and practice with the developmental needs of the early adolescent learner diminished (Cuban, 1992; Williamson & Johnston, 1999).
In accordance with this idea, a rich set of studies beginning with the classic Milwaukee study (Blyth, Simmons, & Busch, 1978) suggests students who attend a middle or junior high school in early adolescence experience declines in academic competence (test scores, grades; Kieffer, 2013; Rockoff & Lockwood, 2010; Schwerdt & West, 2013). Findings from early studies led to the developmental mismatch hypothesis (Eccles & Midgley, 1989; Eccles et al., 1993), which may be restated from a school ecological perspective as the organizational-developmental mismatch hypothesis. This suggests that, regardless of the initial aims of the middle and junior high school movements, the social and instructional contexts of middle grade schools are not well aligned with early adolescents’ developmental needs for autonomy, relatedness, and competence (see self-determination theory; Ryan & Deci, 2000). In fact, compared with elementary schools, middle grade schools often have more students per grade, lower levels of student autonomy, more competition and less cooperation, and more behavioral disruption (Eccles, Lord, & Midgley, 1991; Kim, Schwartz, Cappella, & Seidman, 2014). Teachers may differ as well. Because teachers move between grades in schools (Chingos & West, 2011), K-8 teachers may be more likely than middle or junior high school teachers to have knowledge of child development across stages (e.g., middle childhood, early adolescence) and domains (e.g., social, emotional, and cognitive). In addition, teachers in middle grade schools often report lower levels of efficacy, agency, and support, and higher teacher burden, than do teachers in elementary schools (Eccles et al., 1993; Kim et al., 2014; Midgley, Anderman, & Hicks, 1995; Wolters & Daugherty, 2007). Taken together, these differences may lead teachers and schools that serve only the middle grades to be less responsive to student needs for close relationships with peers and adults, appropriate autonomy in academic and social activities, and opportunities to develop and demonstrate mastery.
This organizational-developmental mismatch is hypothesized to affect academic development. Alspaugh (1998) studied 16 rural and small-town districts, and found a higher dropout rate in high schools that received students from Grades 6 to 8 schools as compared with K-8 schools. Philadelphia students in public K-8 schools outgained peers in Grades 6 to 8 schools in value-added standardized test scores (Byrnes & Ruby, 2007). Research in New York City schools revealed that students in K-8 and Grades 5 to 8 schools outperformed students in Grades 6 to 8 and Grades 7 to 9 schools on eighth-grade tests (Rockoff & Lockwood, 2010; Schwartz et al., 2011). Drops in achievement in middle grade schools have emerged in analyses of statewide data sets (Cook, MacCoun, Muschkin, & Vigdor, 2008; Schwerdt & West, 2013), and in both test scores (e.g., Kieffer, 2013) and grades (e.g., Simmons & Blyth, 1987).
Some studies find no effects of school grade span on academic skills or report variation by student demographic characteristics, such as socioeconomic status (SES) and prior achievement. For example, in a rigorous study of the academic grades of Philadelphia students, Weiss and Kipnes (2006) found no effect of enrollment in middle school versus a K-8 school after controlling for school characteristics. A recent national study demonstrated a K-8 benefit for low-income but not middle- or high-income students (Carolan, Weiss, & Matthews, 2012). Relatedly, Rockoff and Lockwood (2010) found middle grade schools to have a larger, negative impact on achievement for students who start with lower test scores. Variation by student characteristics such as SES and prior achievement may be expected given that students with more resources and fewer vulnerabilities may navigate difficult transitions and contexts with greater success.
Yet, though the literature is rich and varied, rarely do researchers examine academic competence (test scores, grades) in different school types using methods that facilitate causal inference and samples that enable generalization. One exception is a recent analysis of a national data set (Kieffer, 2013), which found a positive effect of K-8 compared with middle grade schools on eighth-grade students’ scores on a standardized test of reading but not math. Yet, this analysis does not answer whether being in a middle school has differential effects than being in a junior high school, as prior studies have suggested (Schwartz et al., 2011), or whether nonachievement test measures of academic and psychosocial competence are affected.
School Grade Span and Early Adolescents’ Psychosocial Development
Academic achievement is not the only important outcome for young adolescents; psychosocial development is also critical to subsequent school and health outcomes (e.g., Bond et al., 2007). Early adolescence is a period of vulnerability to emotional and behavioral problems, disengagement from school, and declines in positive peer influence (Steinberg, 2008). Scholars suggest the organizational-developmental mismatch hypothesis may be applicable to disruptions in early adolescents’ psychosocial development (Seidman et al., 1994). For example, a decrease in teacher-student relationship closeness or school safety, an increase in academic competition and social comparison among peers, and/or the indirect effects of a poor professional climate for teachers in middle grade schools may lead to decreased self-esteem and school connectedness, and increased anxiety and loneliness.
However, rigorous examination of the psychosocial impact of attending a middle or junior high school compared with a K-8 school has been limited, and focused mainly on global self-concept or self-esteem (Cantin & Boivin, 2004; Seidman et al., 1994; Simmons & Blyth, 1987; Weiss & Kipnes, 2006). One well-designed study found that, as compared with students in K-8 schools, students in middle schools have lower self-esteem on average (Weiss & Kipnes, 2006). Other studies with correlational designs report varied findings of school type or transition on self-esteem (Seidman et al., 2004; Wigfield, Eccles, Mac Iver, Reuman, & Midgley, 1991), including differences related to student characteristics. Drops in self-esteem have been linked to developmental shifts (Thornburg & Jones, 1982) and to the school transition experience (Chung, Elias, & Schneider, 1998). Research using a national sample and causal methods is needed to more confidently determine the effect of middle grade schools on eighth-grade self-concept.
Beyond global self-concept, students’ self-perceptions of academic competence are critical in early adolescence, as they contribute to early adolescents’ identity and engagement (Wigfield & Wagner, 2005). In a series of longitudinal studies, Eccles and colleagues find drops in students’ perceptions of their math and English ability in junior high school (1989), overall declines in academic motivation in middle school (1993), and higher academic self-concept in K-8 compared with middle grade schools (1991). Other researchers report waning self-perceptions of academic competence between elementary and middle or junior high school (Cantin & Boivin, 2004; Cole et al., 2001). Yet, each of these studies is correlational in nature and focuses on the role of development or context in academic self-perceptions rather than the causal effect of school transition or type. In addition, none of these differentiates math self-concept from reading/writing self-concept, which could begin to diverge in the middle years (Grimm, 2008).
Research on other psychosocial outcomes is less common but emerging. In one national sample, Anderman (2002) found higher school belonging among students in schools with no middle grade transition. In Philadelphia, students in Grades 6 to 8 schools did not differ from those in K-8 schools in perceived school safety but did have higher perceptions of school threat (Weiss & Kipnes, 2006). A cross-sectional study of a national sample found middle and junior high schools to have lower staff-reported school climate than K-8 schools, which, in turn, related to eighth graders’ school connectedness, peer academic values, and peer support (Kim et al., 2014). The causal effect of attending a middle or junior high school on these relevant psychosocial outcomes, however, remains unclear.
Gaps in the Literature
In sum, although middle and junior high schools originated, in part, to support early adolescent development or prepare youth for high school, much of the research suggests that these school structures, or the transition they require, do more harm than good. However, the current literature’s methodological limitations hinder our ability to inform education policy. One limitation is the tendency of the early literature to focus either on school transition (e.g., examining trajectories as one group of students moves to a new school) or school type (e.g., comparing students enrolled in middle grade schools with different grade configurations) without considering differences in student characteristics and school experiences prior to the middle grades. It may be that prior individual or school experience drives eighth-grade outcomes more than current experience. In addition, much of the extant research uses descriptive, correlational methods or samples of convenience, and studies that employ causal methods rarely use national data sets that enable broad generalization. The current study extends two prior studies, one that tested impacts of K-8 schools on eighth-grade test scores (Kieffer, 2013) and another that found links between middle grade school type, social context, and student experience (Kim et al., 2014).
Current Study
The current study uses a propensity score weighted regression approach and a national sample (Early Childhood Longitudinal Study, Kindergarten Class of 1998-99 [ECLS-K]) to evaluate the effect of attending a middle (Grades 6-8) or a junior high school (Grades 7-9) as compared with a K-8 school on eighth-grade students’ academic competence (mathematics, reading) and psychosocial outcomes (self-concept, school attachment, peer values, and support). Given prior theory and research, we expect small negative impacts of middle and junior high schools on these academic and psychosocial outcomes. In addition, the current approach is viewed as more rigorous than the prior work. We use numerous school- and student-level covariates from kindergarten through fifth grade to generate propensity weights such that the eighth graders at K-8 schools (control group) are similar to those at middle or junior high schools (treatment groups). This analytic approach allows us to estimate causal impacts under the assumption that all potential confounders are observed. In other words, it accounts for differential student selection into school type based on pretreatment observable characteristics. In examining a sample of eighth graders, as opposed to sixth or seventh graders, we focus on the middle grade school context in early adolescence rather than the school transition experience, and ask whether it is beneficial or harmful, on average, to have early adolescents in middle grade–only schools. The eighth-grade sample also advances understanding of the impact of school type on student adjustment prior to the critical transition to high school.
We use the same national data set as Kieffer (2013) and Kim et al. (2014) to facilitate comparison, and our study extends this work in several ways. First, we have a different analytic sample from Kieffer (2013), who uses a longitudinal sample of youth who continuously attend a K-8 school and comparison peers who never do. Like Kim et al. (2014), we focus on a national sample of eighth-grade students in different school types: middle, junior high, and K-8. Second, we define the treatment in question as attending a middle or junior high school, not a K-8 school. From a policy perspective, we are interested in the average effect of the middle and junior high school experience, which is what the vast majority of public school students experience. The middle grade school experience—the treatment in this study—involves both the school grade span and other systematic differences between school types, such as those identified by Kim et al. (2014). Third, we include the full range of K-5 contextual and individual covariates in our propensity score models to better satisfy the assumptions required to estimate a causal effect. Fourth, we separately compare middle and junior high schools with K-8 schools to test how these two different school types, with different origins and grade spans, differentially affect students. Fifth, we run our analyses using raw data, an approach that approximates past work conducted with convenience and/or local samples, and population weights that reweight our sample to be nationally representative. In doing so, we hope to shed light on possible explanations underlying potential differences between our findings and prior work. Finally, we test effects on academic and psychosocial outcomes as a means toward understanding organizational-developmental match as it relates to whole student development prior to the key transition to high school.
Method
Sample
Data were drawn from the ECLS-K. The ECLS-K followed a nationally representative sample of 21,260 kindergarteners from the 1998-1999 school year through the 2006-2007 school year, at which time the majority of participants were enrolled in eighth grade. While this study focuses on the impact of eighth-grade school type on eighth-grade student outcomes, it includes data from five prior waves of the ECLS-K (fall of kindergarten and spring of kindergarten, first, third, fifth grade) to achieve balance between the comparison and the treatment groups such that eighth-grade students in K-8 grade schools (control students) look similar to their peers in middle and junior high schools (treatment students). The data from Wave 3 (fall of first grade) were not included because only a subsample was assessed in Wave 3. The ECLS-K is a multimethod, multisource study that captures longitudinal data on a wide range of child outcomes and developmental contexts through interviews with parents, school administrator and teacher surveys, as well as student self-reports, student records, and direct student assessments.
This study sample consists of the 5,754 students from 1,712 schools who participated in Wave 7 (spring 2007) and were enrolled in (a) eighth grade; (b) a K-8, middle, or junior high school; and (c) a regular public school. Despite the national representativeness of the sample in fall kindergarten, student attrition, school transitions, and sample selection criteria make it unlikely that the eighth-grade data continue to be nationally representative. To address this bias, we run our analyses both unweighted and with population-adjusted weights to maintain representativeness. Using population weights reduces our analytic sample by 38 students, all of whom have a zero spring eighth-grade cross-sectional weight in the ECLS-K.
In 2007, the eighth graders in the current study were evenly split by gender (51% female) with an average age of 14 years. They are predominately White (62%), followed by Hispanic (18%), African American (9%), Asian (6%), and Other (5%). Weighting this sample using eighth-grade population weights yields a sample that is less female (49%), less White (59%), more Hispanic (20%), more African American (15%), less Asian (3%), and less Other (4%). Students were evenly distributed within our sample with regard to SES, with the exception of an underrepresentation of the lowest quintile at 15% (22% are in the top quintile followed by 20%, 21%, and 20%). Nesting of students within schools by eighth grade is minimal: 75% of schools have fewer than four participants and the majority have only one participant. Given this, we do not take a multilevel modeling approach and instead include a range of school covariates to account for differences across schools in key attributes such as student composition.
Measures
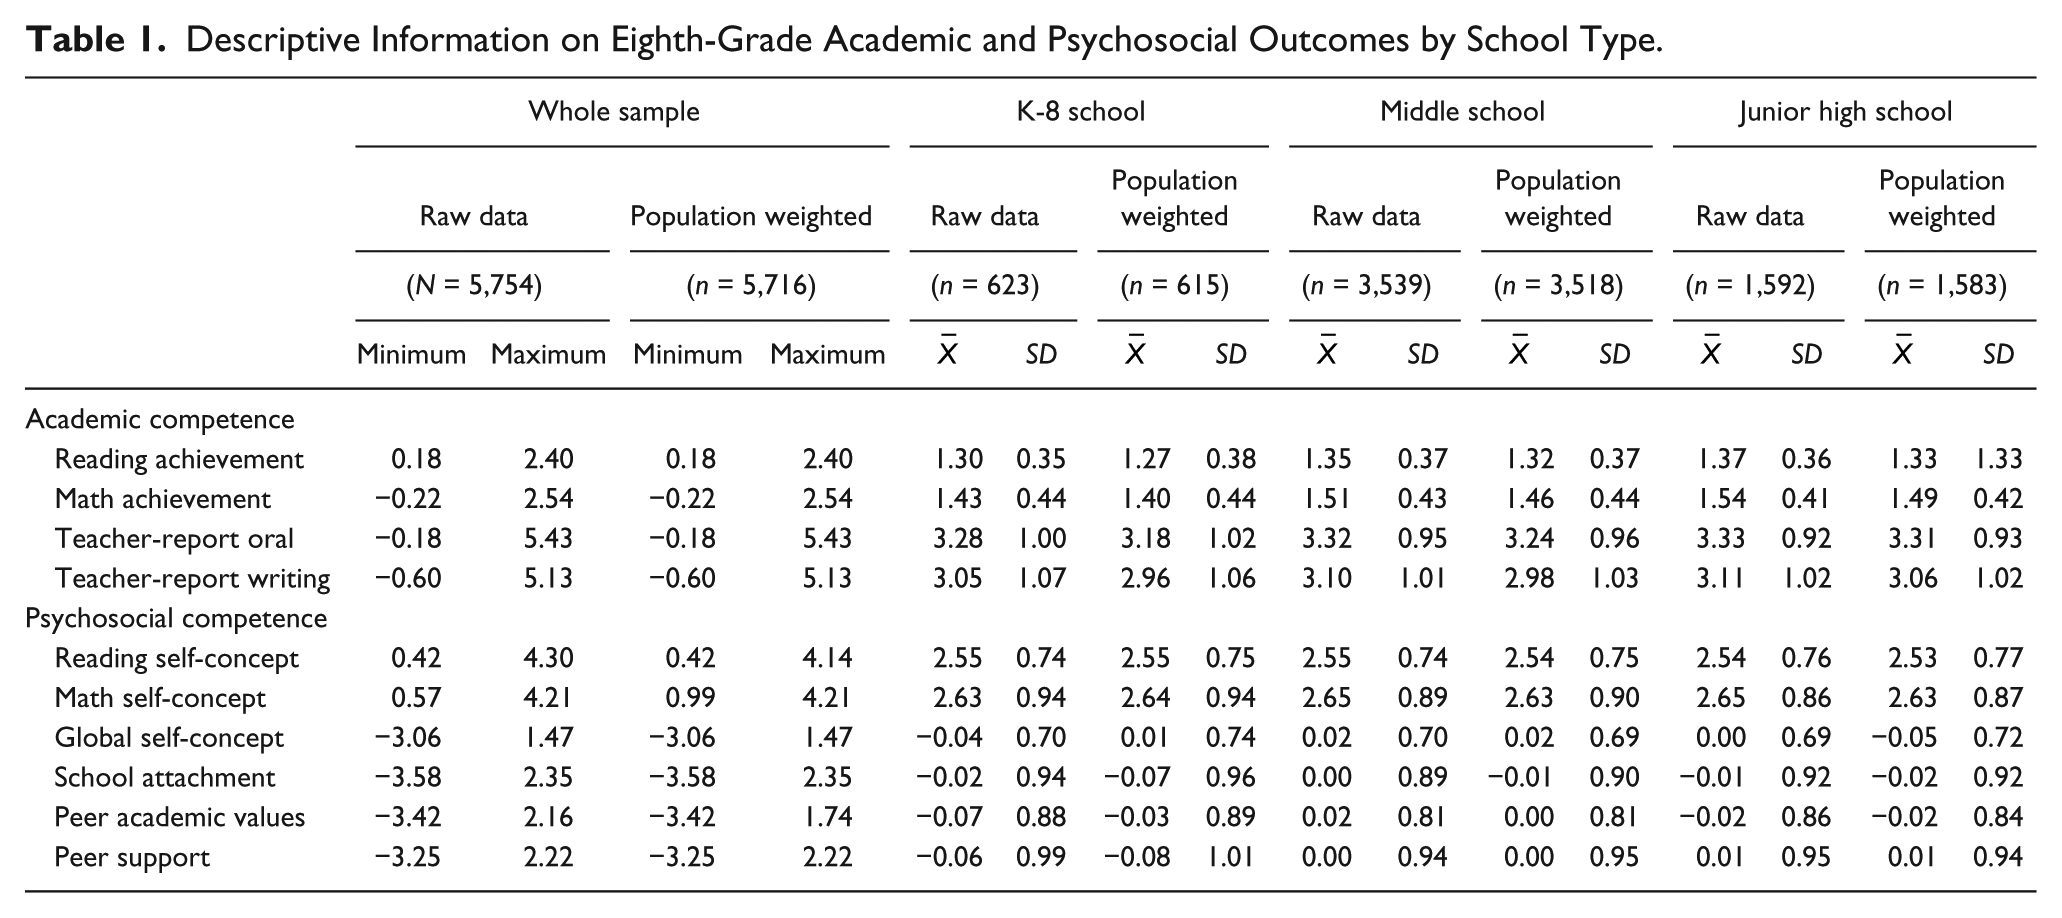
For this study, we used multireporter data on students’ academic and psychosocial competence, as well as on student developmental contexts, collected via direct assessment in addition to teacher-, parent-, and self-report. Eighth-grade data on students’ academic and psychosocial competence are the outcomes of interest. For the range, means, and standard deviations of outcome variables, see Table 1. Data from prior waves on these outcomes as well as student, home, and school characteristics from before sixth grade were highly predictive of these outcomes and, thus, were used to balance across our treatment groups and control group.
Descriptive Information on Eighth-Grade Academic and Psychosocial Outcomes by School Type.
Academic competence
For all academic competence measures, eighth-grade scores were the outcomes of focus, with all available scores from earlier waves used as covariates. Our academic competence outcomes include two types of competence: direct assessment of student achievement and teacher-report of student competence.
Reading achievement and mathematics achievement were assessed directly at every wave of ECLS-K data collection, using a two-staged testing approach based on item response theory (IRT). The IRT estimates of reliability were high, ranging from .87 to .96 by wave (for details, see Tourangeau, Groves, Kennedy, & Yan, 2009). The current study used the IRT-derived theta scores, which are vertically scaled so they are comparable across all waves (see Najarian, Pollack, & Sorongon, 2009), in compliance with recent National Center for Education Statistics advisories. The possible range of scores is approximately −3 to 3, with students scoring higher in the later grades on average. In our sample in eighth grade, scores range from 0.18 to 2.40 for reading and −0.22 to 2.54 for math (see Table 1).
Teacher-report of oral/writing competence was assessed using English teachers’ ratings of students’ oral (three items: for example, “expresses creative thinking”) and written (five items: for example, “Ability to organize ideas logically and coherently”) expression skills on a 5-point scale (1 = poor to 5 = outstanding). From these ratings, the ECLS-K calculated student sum scores using a generalized partial credit model that accounted for item difficulty through IRT analyses (Tourangeau et al., 2009). The reliability of the estimates of student competence was high (0.96 for written and 0.93 for oral expression). As teacher-reports of math competence were available for only half the sample, this variable is not included as an outcome.
Psychosocial competence
For all psychosocial competence measures, eighth-grade scores were the outcomes of focus, with all available scores from earlier waves used as covariates. Our psychosocial competence outcomes include global self-competence and social adjustment in school (school attachment, academic values, and peer support).
Student reports of their global self-concept are available only in eighth grade. This seven-item measure was adapted from the National Education Longitudinal Study of 1988 (NELS: 88) and derived from the Rosenberg Self-Esteem Scale (Rosenberg, 1965). Sample items include “I feel I am a person of worth, the equal of other people” and “I certainly feel useless at times.” All responses are coded such that higher values equal greater self-concept. Students’ responses (4-point scale) were standardized and averaged (Cronbach’s α = .81).
Reading self-concept and math self-concept were measured via student reports of perceived competence and interest in the subject (four items in each scale) and administered in every wave beginning in third grade. The items in the eighth-grade data collection were drawn from the Self-Description Questionnaire (SDQ II; Marsh, 1992), designed for students in middle and high school. Sample reading items are “I get good grades in English” and “I enjoy doing work in English” (eighth-grade Cronbach’s α = .76). Sample math items are “Math is one of my best subjects” and “I like math,” rated on a 4-point scale (eighth-grade Cronbach’s α = .89).
School attachment, peers’ academic values, and peer support—or students’ school social experience—were measured by 13 items in the eighth-grade student survey that underwent a confirmatory factor analysis (CFA) described in Kim et al. (2014) to reduce measurement error. Three factor scores based on the regression scores were used as outcomes. Five items tapped school attachment: how often students feel like they fit in, enjoy being at school, feel close to classmates, feel close to teachers, and feel safe at school. Responses were on a 4-point scale from 1 (never) to 4 (always). Three items captured students’ perception of peers’ academic values: how important is it to their close friends to attend classes regularly, get good grades, continue their education past high school (3-point scale: 1 = not important to 3 = very important). Five items measured students’ perception of peer support: whether classmates think it is important to be their friend, like them the way they are, care about their feelings, like them as much as they like others, and really care about them (5-point scale: 1 = never to 5 = always). The alphas of the items of school attachment (α = .72), academic values (α =.68), and peer support (α =.89) are acceptable, and the factor determinacies of the factor scores are high (school attachment = .90, academic value = 83, peer support = .95). We also conducted a test of configural, metric, and scalar invariance of these measures across our three treatment groups: K-8, middle, and junior high school. Results (available upon request) suggest that the use of factor scores for mean comparison of these outcomes across these three groups is a valid approach.
Treatment variable: School grade configuration
Schools included in the ECLS-K data set have various school grade spans. School grade span was coded in three categories. Students who, in the eighth grade, attended schools without a transition between kindergarten and eighth grade (pre-K-8, n = 66; K-8, n = 93; pre-K-12, n = 16; and K-12, n = 19) were coded as enrolled in K-8 schools (11%) and viewed as the control condition. Students in schools beginning in sixth grade and extending through at least eighth grade (Grades 6-8, n = 1,063; Grades 6-12, n = 24) were coded as enrolled in middle schools (62%). Students in schools beginning in seventh grade and extending through at least eighth grade (Grades 7 and 8, n = 310; Grades 7-9, n = 65; Grades 7-12, n = 56) were coded as enrolled in junior high schools (28%). Sensitivity analyses that excluded any student attending a school that extended beyond the eighth grade yielded similar results. Students in schools serving other variations of grade span (e.g., fifth- to eighth-grade schools) are excluded due to small sample size. Dummy variables for middle school enrollment (0 = K-8, 1 = middle) and junior high school enrollment (0 = K-8, 1 = junior high) were created based on this categorization and included in the models described below.
Confounding covariates
To identify the causal effect of school type on eighth-grade outcomes, we need to appropriately control for all variables that predict both the treatment (school type) and the outcome. A total of 150 variables, including composite scores and single item variables, drawn from student, parent, teacher, and school administrator surveys and direct assessments were included as potential confounding covariates in the propensity score models to justify this assumption of selection on observables. These variables included prior trajectories of academic and psychosocial competence in kindergarten, first, third, and fifth grades (e.g., test scores, teacher-report academic self-concept, internalizing and externalizing problems, social skills); child and family characteristics (e.g., gender, age, race, region, urbanicity, immigrant status, SES, student health); home environment in fifth grade (e.g., discipline practice, media use, parent involvement); and school context in fifth grade (e.g., school size, % students at grade level, % free lunch, student composition, school problems, school social climate). In fifth grade, all students in our sample were still in elementary school (K-5, K-6, or K-8 school). For composite covariates, we used scores in the ECLS-K data set (e.g., internalizing problem scores) or calculated scores using a procedure previously established with these data (e.g., Parent Discipline Scale; Gershoff, Aber, Raver, & Lennon, 2007). For descriptive information for select covariates, see Table 2. For a full list of covariates, see Online Appendix B. Detailed descriptions of how each covariate was measured can be found in the ECLS-K User’s Manual (Tourangeau et al., 2009).
Selected Fifth-Grade Student and School Characteristics (by School Type in Eighth Grade).
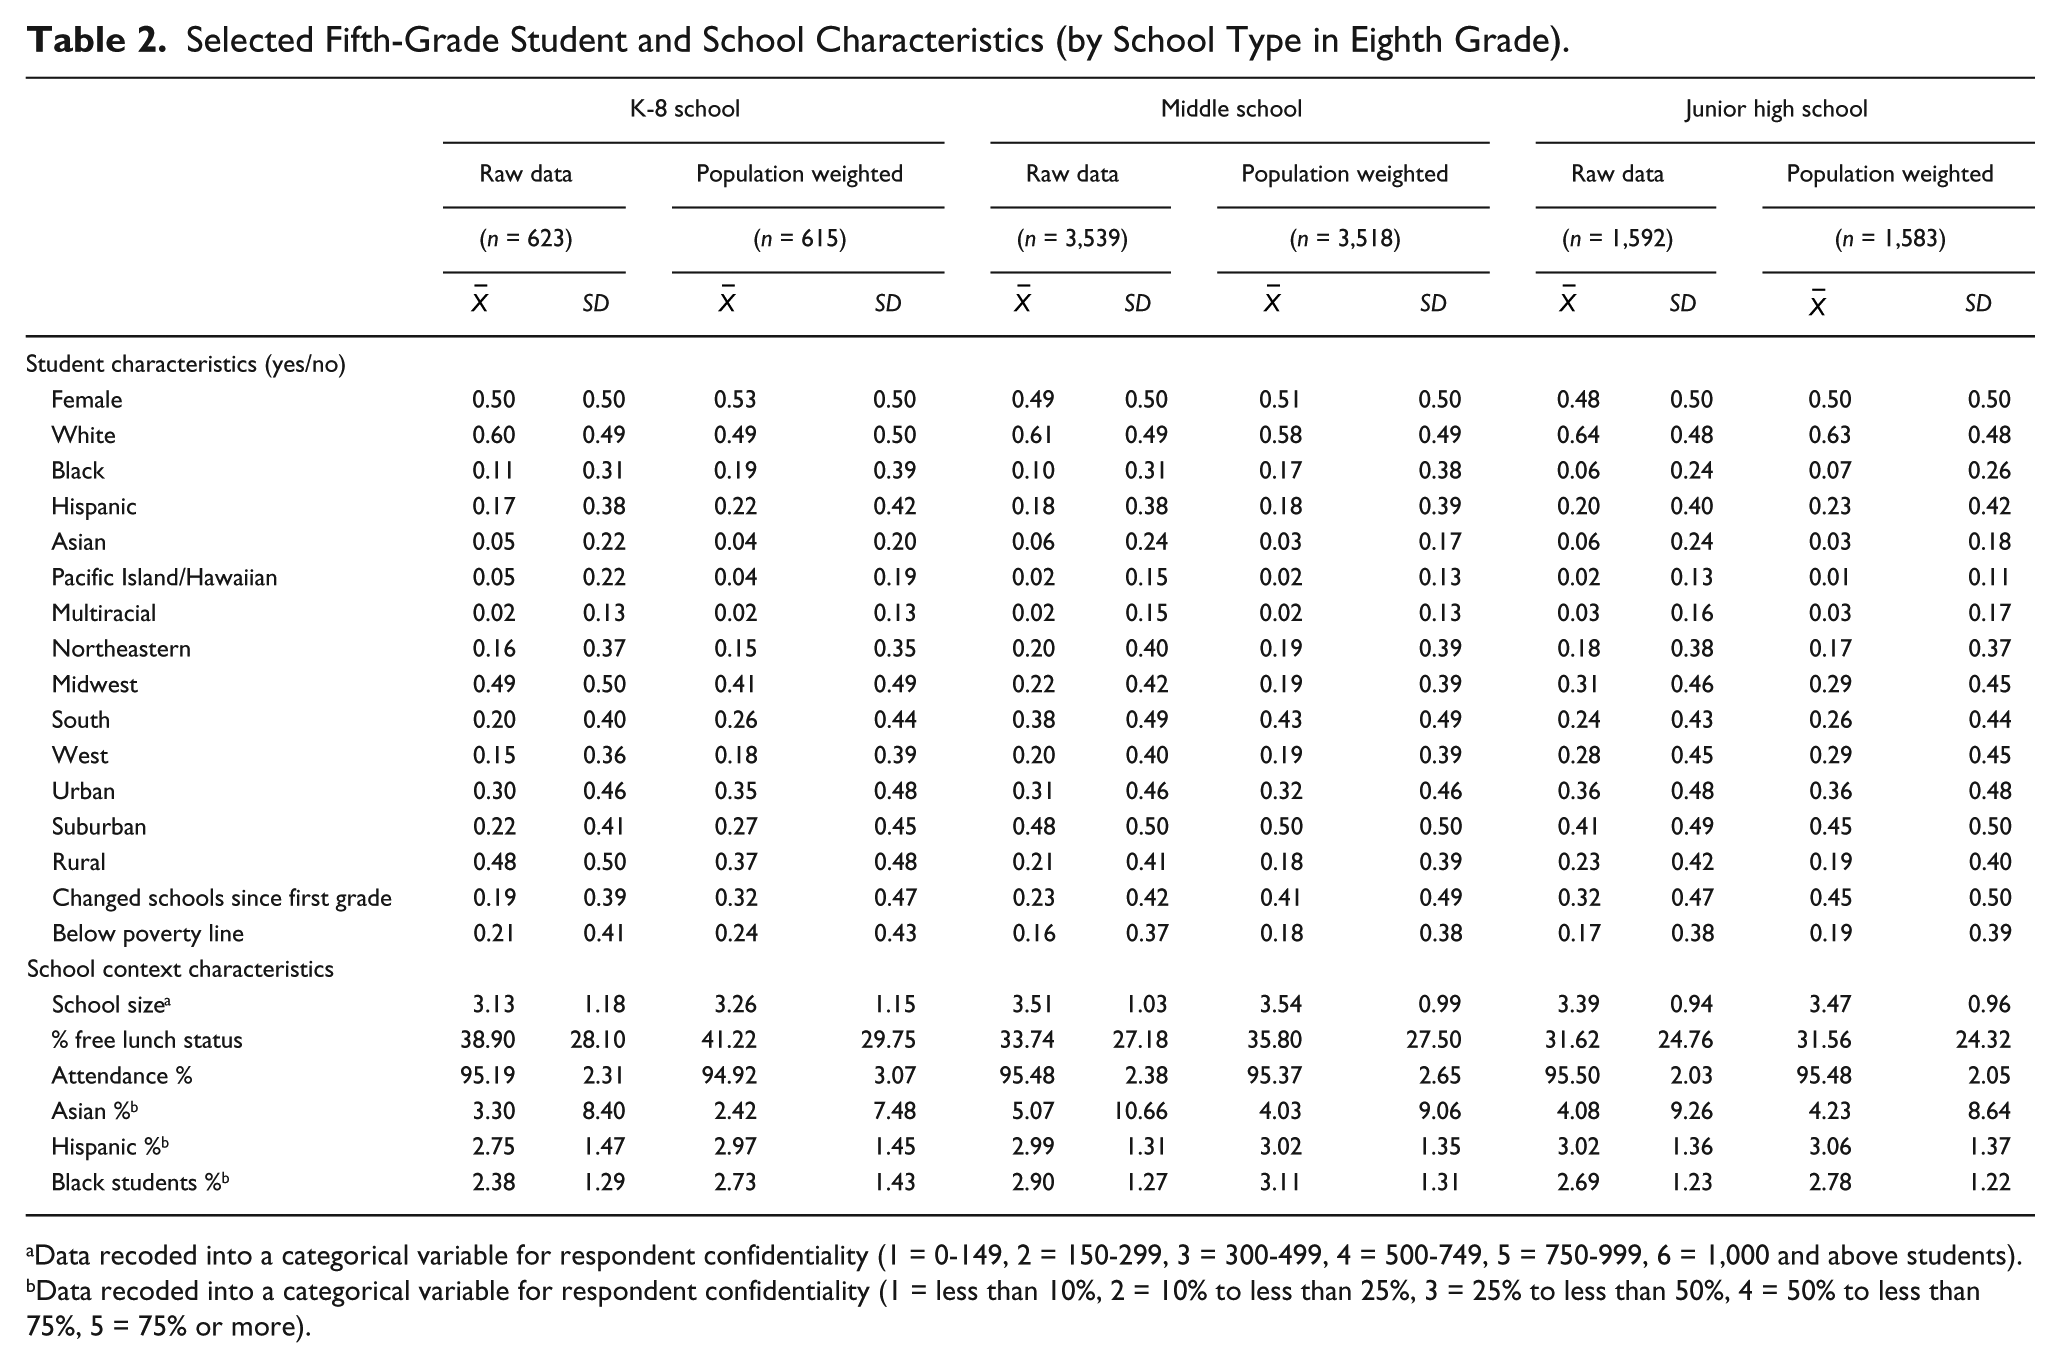
Data recoded into a categorical variable for respondent confidentiality (1 = 0-149, 2 = 150-299, 3 = 300-499, 4 = 500-749, 5 = 750-999, 6 = 1,000 and above students).
Data recoded into a categorical variable for respondent confidentiality (1 = less than 10%, 2 = 10% to less than 25%, 3 = 25% to less than 50%, 4 = 50% to less than 75%, 5 = 75% or more).
Analysis
In order to examine the causal role of attending a middle school (Grades 6-8) or junior high school (Grades 7-9) as compared with a K-8 school on students’ academic and psychosocial competence, we first explore the impact of attending a middle or junior high school for the students in our analytic sample. This approximates prior work conducted at local or regional levels. We then reran analyses weighting our eighth-grade sample to be nationally representative of youth who entered kindergarten in the fall of 1998.
Missing information
Variables in this study had low rates of missing data overall. The small proportion of variables with more missing data were from repeated measures where the student had valid data for the same measure in other waves. Across variables, the median number of missing data were 5%, the range was 0% to 30.8%, and the interquartile range was 4% and 9.8%. To retain all participants who met eligibility criteria for inclusion in this study, the missing values were multiply imputed using an imputation procedure in STATA involving chained equations (ICE; Little & Rubin, 2002) in order to create five completed data sets. ICE is a flexible technique that allows for variable-by-variable specification of imputation models to accommodate different types of distributions for each variable. Imputations are also performed stochastically to reflect natural sampling variability in the data. The imputation model included all confounding covariates, the treatment variable, and the outcomes. We compared the distribution of the imputed values with the observed values and confirmed that the shape of the distribution was similar. Although we might expect that the location of the distribution to be different (for instance, the average household income of imputed participants might be lower than for observed participants), we would not expect that the shape of the distribution would be radically different.
Subsequently, we performed ordinary least squares (OLS) regression analyses in each of five imputed data sets prior to calculating propensity scores, and confirmed that the treatment effect estimates varied little across imputed data sets. This provided us with some assurance that the variability across imputed data sets is minimal and, thus, that reperforming propensity score analyses across imputed data sets and combining the results would be unlikely to lead to substantially different estimates. Given this, and that propensity score approaches require tuning of the propensity score model through a time-consuming, iterative process of model fitting, checking balance, and model adjustment, we then randomly selected one of the imputed data sets for our analyses.
Differences across groups
Table 2 displays the means and standard deviations of selected raw student demographics and school characteristics in fifth grade by treatment group (K-8, middle, and junior high schools). Substantial differences between groups were found. For example, more African American participants were attending K-8 and middle schools than junior high schools, c2(2) = 25.26, p < .001; and participants attending K-8 schools in eighth grade were more likely to, in fifth grade, live in the Midwest, c2(2) = 197.98, p < .001, and rural areas, c2(2) = 203.62, p < .001, and were more likely to be from low-income families, c2(2) = 8.04, p < .05. We also found a significant difference between treatment groups in the fifth-grade school context. For instance, in fifth grade, compared with students in the middle and junior high school treatment groups, more students in the K-8 group attended smaller schools, c2(8) = 195.56, p < .001, and schools that served more students eligible for free lunch, F(2, 5,753) = 16.72, p < .001.
Estimands and assumptions
Our goal is to estimate the causal effect of attending a middle or junior high school versus a K-8 school on eighth-grade outcomes. Specifically, this study focuses on the average treatment effect on the treated (ATT). For the analyses when the treatment is defined as attending middle school, the ATT estimand reflects an average comparison between the outcomes for those students observed attending middle schools as compared with the outcomes they would have experienced had they attended a K-8 school. Similarly, when the treatment is defined as junior high school, the ATT estimand reflects a comparison between the average outcome for the students observed to attend junior high school as compared with the average outcome they would have experienced had they attended a K-8 school. This stands in contrast to the ATE, which reflects a comparison between these potential outcomes averaged over everyone in the sample.
To identify the ATT effects of attending middle or junior high school as compared with a K-8 school, we need to first assume we have measured all confounding covariates. This assumption is called “selection on observables” (Heckman & Robb, 1985) or “ignorability” (Rubin, 1978). This set of covariates cannot include posttreatment characteristics (e.g., characteristics of the student or school that could be influenced by the transition to middle school or junior high) as this can induce bias. Although it is impossible to empirically verify this assumption, by including a wide range of covariates in our model, we may reduce the potential bias due to unobserved variables.
It is also necessary to appropriately control for these characteristics. As described above, students in K-8 and middle or junior high schools were significantly different from one another prior to sixth grade, which may have affected the type of school they were attending in eighth grade. This makes linear regression a poor choice for adjusting for the covariates because the model is prone to extrapolation beyond the support of the data. In this situation, propensity scores can be used to adjust for these variables in a way that does not require such strong parametric assumptions because they help us to reconfigure our data so that the groups being compared are more similar with regard to these covariates. Once we can confirm that the treatment and control groups are observationally similar to pretreatment, we can make much more confident claims as to the treatment effect (see Gelman & Hill, 2007; Winship & Morgan, 1999).
It is also worth noting that, as with all causal approaches, our analyses rest on the Stable Unit Treatment Value Assumption (SUTVA; Rubin, 1978). We must assume that the treatment status of any unit does not affect the potential outcomes of other units and that the treatments for all units are comparable. Although the SUTVA assumption is not testable, the national distribution of data in this sample combined with the low rate of participants attending the same schools by eighth grade suggests that the treatment status of any one student in our sample is unlikely to have influenced the outcomes of other students. Given that it is unlikely that all middle grade school experiences are the same, we will have to conceive of these experiences (the “treatments”) quite broadly to satisfy the SUTVA assumption that all units are receiving the same treatment.
Propensity score model specifications and weight calculation
We used an inverse probability of treatment weighing (IPTW) approach to semiparametrically adjust for our confounding covariates when estimating the impact of middle and junior high school attendance. This approach also allows us to calculate estimands beyond the average treatment effect; in this case, we use it to target a specific ATT in each analysis. The approach is similar in spirit to a propensity score matching approach in that the goal is to construct a comparison group for the treatment group that is as similar as possible on average to the group we want to make inferences about with respect to observed covariates. Compared with most propensity score matching approaches, however, IPTW has the advantage of allowing use of all available data from the sample. This is particularly important when estimating treatment effects on the treated using a small control group (Imbens, 2004) as is the case here: 11% of participants attend K-8 schools.
To implement this approach, we first estimated the propensity score for each person (Rosenbaum & Rubin, 1983). The propensity score is the probability of being treated conditional on all observed pretreatment covariates and, conceptually, acts as a one-number summary of these covariates. In analyses where middle school was the treatment, we estimated the propensity score by fitting a logistic regression model to a sample comprising the middle school and K-8 students. Similarly, when junior high school was the treatment, we estimated the propensity score by fitting a logistic regression model to a sample comprising the junior high school and K-8 students. Multiple iterations of each model were run to improve balance (see below). Predictions from the final models are our estimated propensity scores.
Based on these estimated propensity scores, we then calculated weights for regression models using IPTW. All students in the treatment group (middle or junior high school, depending on the analysis) received a weight of 1. Control group students’ weights were calculated as e(X) / (1 − e(X)), where e(X) represents the estimated propensity score. These weights in effect create a “pseudo-population” of controls that look like the treatment group prior to the treatment itself (i.e., prior to sixth grade) based on their observed covariates. To use population weights in combination with propensity weights, students in the treatment are additionally weighted to be nationally representative of youth (in their observed treatment group) who started kindergarten in fall 1998. Similarly, students in the control group receive a weight of e(X) / (1 − e(X)) multiplied by their population weight.
With each set of weights (propensity only and propensity plus population weights), we first used the weighted samples to assess the balance of the means and standard deviations of each observed covariate between the treatment group (middle or junior high school) and the reweighted control group (K-8 school). This procedure is necessary to ensure that the calculated weights provide good balance across groups to reduce the bias in the estimated treatment effects. Multiple iterations of models estimating propensity scores with different interactions and covariates were run to improve model specification until the groups were sufficiently balanced (standardized
Weighted regression models
To determine the causal effect of a middle or junior high school versus a K-8 school, we examined the ATT on eighth-grade outcomes. In other words, we estimated the effect of attending middle and junior high school for students who actually attended middle and junior high schools. Regression models included a dummy variable indicating middle or junior high school enrollment status and the 41 (of 150) key covariates theorized to be the most potent predictors of students’ outcomes for greater precision in estimating the treatment effect. In addition, selection variables that did not fully meet the balance criteria were included as covariates in the models.
Adjustments given multiple outcomes
Because we test multiple outcomes for each treatment, we adjust p values by controlling for the false discovery rate (FDR; see Anderson, 2008). FDR is more appropriate than a standard Bonferroni approach to addressing concerns around multiple comparisons because it does not require the unsupported assumption that these tests are independent. Both naive p values and FDR q values, interpreted in the same way as traditional p values, are provided in the “Results” section tables. Only findings robust to this adjustment (q < .05) are discussed. We also, as a further sensitivity check, reran analyses as four large multivariate regressions (one for each combination of middle vs. junior high school and raw vs. population weighted data) in order to allow the outcomes to covary within each model. The results from these analyses (available upon request) were nearly identical to those using univariate methods (see below).
Results
Below are results from analyses using a national sample that examined the causal role of attending a middle school or junior high school as compared with a K-8 school on students’ academic and psychosocial competences. Based on differential findings for analyses conducted with and without population weights, we also present additional post hoc analyses to clarify impacts for specific student subgroups and better inform the policy debate.
Middle School Effects
The first set of propensity score weighted regression models tested the ATT of middle school enrollment compared with K-8 school enrollment (see Table 3, Figures 1a and 1b). Using weights calculated from the estimated propensity score of middle school assignment, and controlling for key covariates in a linear model, we estimate that middle school had small negative and statistically significant effects for those in middle school on eighth-grade teacher-report oral competence (b = −.17, p < .001, q = .005, Effect Size (ES) = −.18) and reading self-concept (b = −.15, p < .001, q = .001, ES = −.21) as compared with K-8 schools. Small effects on reading achievement and teacher-report writing competence did not hold up to the FDR multiple inference adjustment; that is, these effects were not robust. We found no significant effects of middle school on other psychosocial outcomes. We next reran analyses incorporating both propensity and population weights. In these analyses, we estimate that middle school had a small negative and statistically significant effect for those in middle school on reading self-concept (b = −.14, p = .003, q = .030, ES = −.18) and no significant effect on other outcomes.
Middle and Junior High School Effects: Propensity Weighted Regression Coefficients.
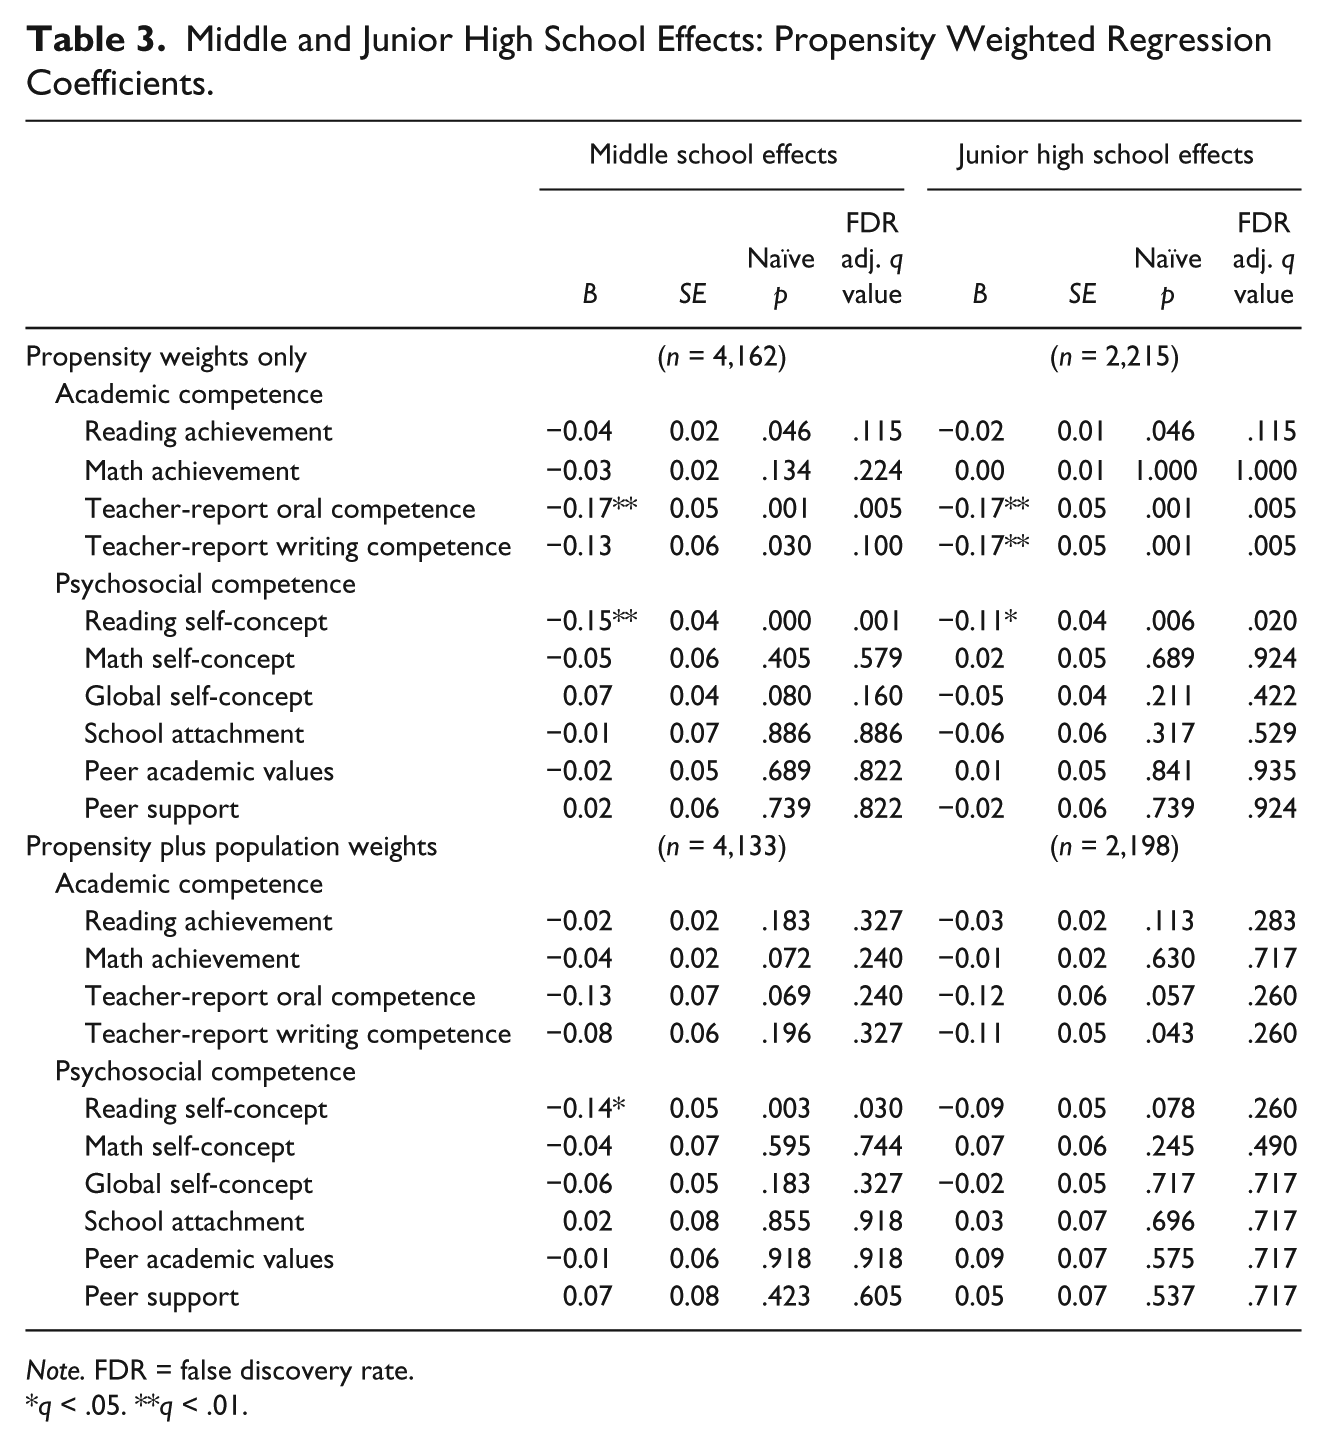
Note. FDR = false discovery rate.
q < .05. **q < .01.
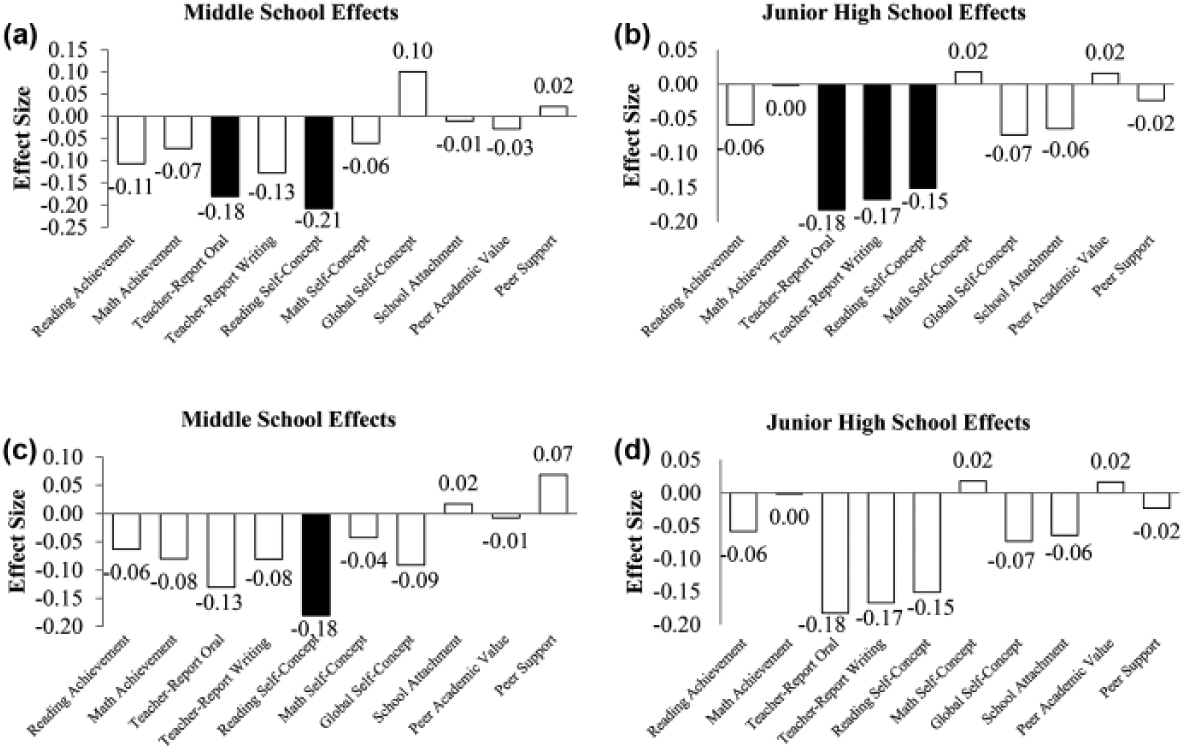
Effect sizes of attending middle and junior high schools, compared with K-8 schools. (a and b) Propensity weights only. (c and d) Propensity plus population weights.
Junior High School Effects
The second set of propensity score weighted regression models tested the ATT effects of junior high school enrollment compared with K-8 school enrollment for those in junior high (see Table 3, Figures 1c and 1d). Using propensity weights only, junior high school had small and negative effects, for those in junior high, on teacher-report of oral competence (b = −.17, p < .001, q = .005, ES = −.18) and writing competence (b = −.17, p < .001, q = .005, ES = −.17) and self-report of reading self-concept (b = −.11, p = .006, q = .020, ES = −.15). We found no statistically significant effects of junior high school on reading or math achievement or psychosocial outcomes for those enrolled in junior high. Rerunning these analyses incorporating both propensity and population weights yielded no significant findings.
Exploratory Post Hoc Analyses
Given results indicating that all but one significant finding (the negative impact of middle school on reading self-concept) weaken when adjusting the sample to appear nationally representative of youth who entered kindergarten in fall of 1998 (FK, hereafter), we ran follow-up analyses to better understand our findings. First, we descriptively compared our unweighted samples of middle and junior high school students (those for whom we are estimating treatment effects) with our population weighted samples. We find that our unweighted samples have higher achievement scores and are socioeconomically more advantaged (see Online Appendix C). In other words, the most disadvantaged youth were more likely to leave the sample prior to eighth grade. Adding population weights, then, increases the weight given to the disadvantaged youth who remain. Doing so decreases the negative impact of attending a middle or junior high school and this difference suggests that the impact of middle grade schools may be less negative for those most disadvantaged.
To explore this further, we ran subgroup analysis, calculating separate propensity models within our middle and junior high school samples for youth who entered FK at academic risk, youth who entered not at academic risk, youth who entered FK in the lowest quintile of SES, and youth who entered not in the lowest quintile of SES (14% of our raw middle and junior high school samples and 19% of the raw K-8 grade sample). As school entry SES was not in our original model, it was not imputed; 206 students were dropped from the SES exploratory analyses (117 middle school, 60 junior high, and 29 K-8 students) due to missing information about their SES at school entry. Academic risk was defined as performing in the lowest 40% of students in math, reading, and general knowledge assessments in fall kindergarten (21% of the middle school, 19% of the junior high, and 25% of the K-8 sample meet these criteria).
These results should be interpreted as exploratory. They are post hoc and have adequate but not ideal balance due to small subsamples. As with our main analyses, we ran multiple iterations of models estimating propensity scores with different interactions and transformed covariates to improve the model specification. The final logit models achieved a standardized mean difference less than or equal to 0.12 for continuous variables and mean difference and 0.06 for categorical variables for 70% to 89% of the covariates depending on specific subgroup (e.g., low SES middle school vs. K-8 data) and a standardized mean difference less than or equal to .15 for continuous variables and mean difference and .075 for categorical variables for 79% to 96% of the covariates. As with our main analyses, all variables not balanced at less than or equal to 0.1 and 0.05 were included in our treatment effect models to further control for any remaining difference. Full balance results for our subgroup analyses are available upon request.
The pattern of results from these subgroup analyses (see Table 4) suggests that negative impacts found on teacher- and self-report reading measures may not hold for the most disadvantaged youth. For youth not identified as at academic risk, we found negative and statistically significant effects for eighth graders in middle schools on eighth-grade reading achievement (b = −.05, p = .015, q = .031, ES = −.15), teacher-report oral competence (b = −.18, p = .004, q = .02, ES = −.20), teacher-report writing competence (b = −.15, p = .011, q = .031, ES = −.16), and self-report reading competence (b = −.14, p = .004, q = .021, ES = −.19). No significant effects were found as to the impact of junior high for youth not at academic risk. In addition, we found no significant effects for youth identified as at academic risk for any outcomes for either treatment. For youth in the top four quintiles of SES at school entry, we found negative and statistically significant effects for eighth graders in middle schools on eighth-grade teacher-report oral competence (b = −.23, p < .001, q = .001, ES = −.24), teacher-report writing competence (b = −.23, p < .001, q = .001, ES = −.22), and self-report reading competence (b = −.15, p = .008, q = .022, ES = −.22). Similarly, we found negative and statistically significant effects for eighth graders in junior high schools on eighth-grade teacher-report oral competence (b = −.17, p = .003, q = .015, ES = −.18) and teacher-report writing competence (b = −.17, p = .003, q = .015, ES = −.17). We found no significant effects for youth in the bottom quintile of SES for any outcomes for either treatment.
Propensity Weighted Regression Coefficients by Subgroup (Propensity Plus Population Weights).
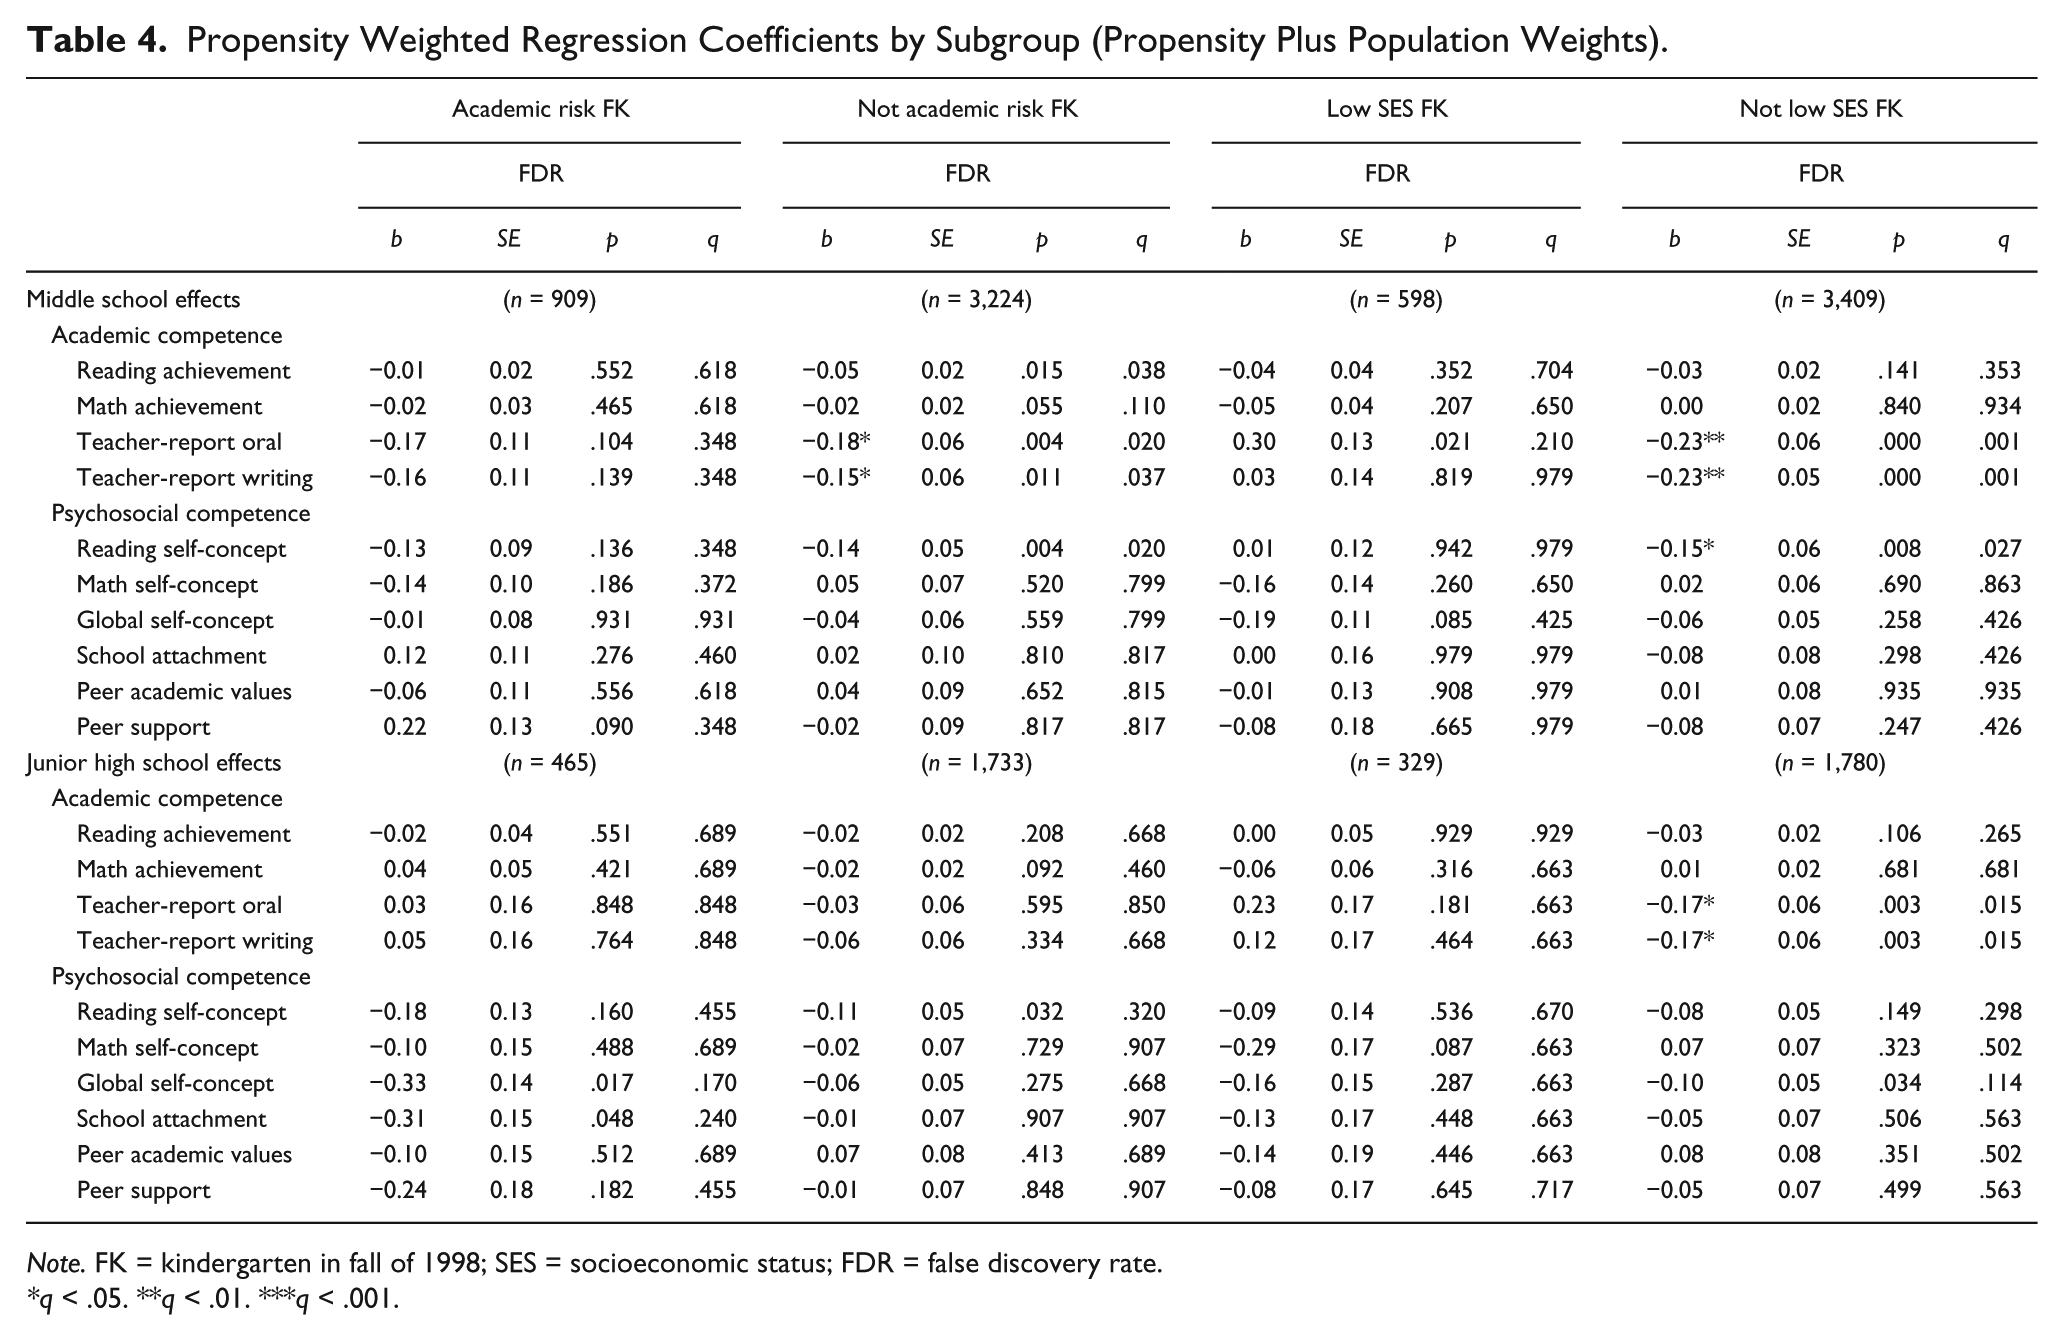
Note. FK = kindergarten in fall of 1998; SES = socioeconomic status; FDR = false discovery rate.
*q < .05. **q < .01. ***q < .001.
Discussion
The current study builds on a rich theoretical and empirical literature and methodological advances to evaluate the effect of attending a middle or junior high school as compared with a K-8 school on eighth-grade students’ academic and psychosocial outcomes. Initial analyses, mirroring rigorous studies with convenience samples, suggest that middle grade schools negatively affected eighth-grade reading/writing competence (teacher- and self-report) for those in middle grade schools. Weighting the eighth-grade student data to mirror the nation reduced the significant negative impact of middle grade schools to impacts on reading self-concept only for middle school students. Further exploration found that negative impacts did not hold for the most socioeconomically or academically disadvantaged youth; in fact, negative impacts on reading appeared stronger for less disadvantaged students. Below, we frame these findings in the context of prior research and discuss implications for schools serving students in the middle years.
Academic and Psychosocial Competence
Our initial findings, in part, echo previous research on the impact of middle and junior high school on academic competence (Kieffer, 2013; Rockoff & Lockwood, 2010; Schwartz et al., 2011; Schwerdt & West, 2013). On average, students who attend a middle grade school do less well in eighth-grade reading/writing competence (teacher- and self-report) than students who remain in a K-8 school, a finding that holds true for junior high schools (Schwartz et al., 2011) but appears to be stronger and more robust for middle schools. Effect sizes of these negative impacts are small (−0.15 to −0.21), and represent 15% to 21% of one standard deviation difference between students attending K-8 schools and middle grade schools. Because the findings were present in self- and teacher-report measures rather than achievement test scores, effect size comparisons across studies are difficult. Yet, given similar effect sizes to the annual gain in standardized tests of achievement in eighth grade (0.26; Hill, Bloom, Black, & Lipsey, 2008), these differences may be notable.
Where the current findings vary from past work is that (a) all but one of the above findings become nonsignificant upon population weighting the sample and (b) significant findings are measures of teacher- and self-reported academic competence not test scores. The first suggests that the impacts of middle grade schools are not the same for all students. By running the analysis both ways, we were positioned to explore in what ways these effects might vary by student characteristics (see below). The second is striking in that little prior research causally assessed the effect of middle grade schools on teacher- and self-reported academic competence. While teacher- and self-report measures are comparative (Marsh & Hau, 2003) and, thus, not as simple to interpret as standardized test scores, they likely have important consequences for students as they proceed to high school. Teachers’ views of students’ oral and written competence may reflect students’ grades and determine access to advanced courses. Students’ perceived competence in a given subject strongly relates to their engagement and motivation in that subject (Green et al., 2012; Guay, Ratelle, Roy, & Litalien, 2010).
It is worth highlighting that no negative impacts were found for self-reported math competence. Math and reading/writing instruction look different in middle grade schools, with teachers engaged in procedural and conceptual instruction in math (see Hiebert, 2013) and primarily conceptual instruction in reading/writing (Langer, 2001). Procedural instruction involves more didactic teaching and concrete assessment, and may be less susceptible to variation in teacher expectations or peer comparison. Math classes also become more tracked in the middle grades; smaller schools, such as K-8 schools, may not have the resources to offer advanced math courses to accelerated students. This could erase any benefit students may have experienced in their math abilities from the more positive social climate of K-8 schools (see Kim et al., 2014). Alternatively, the idea of “fit” between school environment and early adolescent needs may vary by subject. Future research should examine whether math courses, instructional methods, or teachers differ in schools with different grade spans to better understand the role school context plays in math competence in the middle years.
There were also no significant effects for reading or math test scores. It is important to note that lack of statistical significance means there is simply not enough evidence to reject the null hypothesis in the current study. Yet, these results remain surprising given prior work that shows effects on reading test scores (e.g., Kieffer, 2013). The difference may be methodological. For example, we estimate the effect of attending a middle or junior high school for students likely to attend middle grade schools as opposed to students who consistently attend a K-8 grade school. We also adjust for a comprehensive list of individual, home, and school covariates prior to middle grade school entry. Accounting for student characteristics and experiences that could affect selection into schools across years and settings allows us to plausibly isolate the effect of eighth-grade school type on student outcomes. Other studies that have found negative effects on test scores have examined scores immediately after the school transition (in sixth or seventh grade; see Schwerdt & West, 2013). These declines may be more a result of a challenging school transition than the overall school context. In the current study, we assess outcomes in spring of eighth grade when students have been in a middle or junior high school for 2 or 3 years. Future work should disentangle transition and school effects for eighth-grade students nationwide.
Finally, no significant effects were detected for psychosocial outcomes beyond reading self-concept. The effect size for reading self-concept was small but equivalent to 18% of one standard deviation difference between K-8 and middle school enrollment. This is potentially important, as it is almost the effect size of gender (0.21; Kling, Hyde, Showers, & Buswell, 1999), one of the most commonly studied predictors of self-concept in childhood and adolescence. Although studies vary, some prior work has found that self-concept or self-esteem declines after the school transition in the middle grades, particularly for specific subgroups (e.g., Simmons, Burgeson, & Reef, 1988) and samples (e.g., Weiss & Kipnes, 2006). Other studies report that the negative effects of school transitions on self-esteem weaken over time (Chung et al., 1998) or “bounce back” (Robins, Trzesniewski, Tracy, Gosling, & Potter, 2002). Perhaps shifts in these psychosocial outcomes are related more strongly to developmental changes than school ecological changes (see Lerner & Steinberg, 2004). If so, the stage-environment fit hypothesis may be less relevant when considering the role of schools in these psychosocial outcomes during early adolescence. Further work is needed to better elicit if and when declines in psychosocial outcomes occur, for whom, and whether they last. This study suggests that, on average, such declines are not apparent in eighth grade.
Subgroup Analysis by Socioeconomic and Academic Disadvantage
Analysis with population weights to address the disproportional attrition of low-income and low-achieving students yielded one significant finding: Middle school negatively affects eighth-grade reading self-concept. The negative impact of middle school on reading self-concept is robust. But the difference in findings between analysis with and without population weights suggests that middle grade schools may have a more negative impact on the students who are overrepresented in the unweighted sample, that is, less disadvantaged students. In fact, post hoc exploratory analysis revealed that for students who were not at academic risk, there were negative effects of middle school on eighth graders’ reading/writing competence (test scores, teacher-reports, and self-reports). No significant effects were found for junior high school. Similarly, for youth who were not at the lowest level of socioeconomic risk, we found negative effects for eighth graders in middle schools across measures of reading/writing competence, and for eighth graders in junior high schools on teacher-reports of reading/writing competence.
Given that these findings were exploratory, we interpret them with caution. Yet, after considering all pretreatment observable differences between student subgroups in different school types, the less disadvantaged students appear to be more negatively affected by enrollment in middle or junior high school as compared with K-8 schools. It is possible that low-income students may not experience the middle or junior high school climate as relatively less supportive to the same degree that other students do. Due to myriad challenges, elementary schools in low-income neighborhoods have been shown to have less supportive climates (McCoy, Roy, & Sirkman, 2013). This may mean that students from less poor families experience a larger downshift in school climate after the school transition. One implication for the organizational-developmental mismatch hypothesis (Eccles & Midgley, 1989; Seidman et al., 2004) is that the match may be experienced by the student in relation to what they received in prior school contexts.
Alternatively, the effects of school type on reading competence may relate to differential teacher expectations for low-performing/low-income versus average- or high-performing/average- or high-income students in different school types (McKown & Weinstein, 2002). Continuing in a K-8 school may benefit students who are achieving at an average or higher rate due to positive teacher expectations of performance and student internalization of those expectations. By the same token, moving to a new school in the middle grades may give struggling students a chance to start fresh with a new set of teachers. Again, we need to interpret these findings with caution and use them to generate hypotheses.
Strengths, Limitations, and Implications
The current study uses propensity score analyses and a national sample to determine the effect of enrollment in a middle or junior high school compared with a K-8 school on early adolescents’ academic and psychosocial competence. We account for student selection into school types based on observable characteristics and consider prior school context as a factor in students’ ability to navigate middle grade schools. Examining effects in eighth grade enables understanding of outcomes beyond the immediate transition; using a national sample allows us to generalize to U.S. public schools. This study is rare in its depth and breadth: testing middle and junior high school effects on students likely to attend those schools, examining academic and psychosocial competence, and exploring subgroup findings for students at risk.
Several limitations must be noted. First, the sample of students in K-8 schools and the number of eighth graders per school is small. Given this, we should take care when interpreting and generalizing findings. Second, despite balancing on 150 covariates, we cannot be certain we have satisfied the selection on observables assumption. Propensity score models can only account for observed confounders—not unobserved ones. It is possible there were aspects of the students and schools not included in the models that account for some of the results. Third, in the current analysis, we cannot distinguish whether the significant results are related to transition timing or school type. Fourth, our middle, junior high, and K-8 schools all include some schools that extend beyond eighth grade. Sensitivity analyses excluding these schools do not suggest this is a concern; yet, school climate may differ with the inclusion of older youth. Fifth, many of our outcome measures were created by the National Center for Education Statistics (NCES) in the ECLS-K data set. While we advocate use of these scores for consistency and replicability, without item-level data we have limited ability to determine measurement invariance across the groups we compare in the study or to update these measures to reflect new research (e.g., work suggesting that the Rosenberg Self-Esteem Scale might be best measured using a bifactor model; Marsh, Scalas, & Nagengast, 2010). Finally, our main analysis examines average effects of middle or junior high school enrollment for all students who attended those schools. Although our post hoc analysis examines variation in effects by student socioeconomic risk and underachievement, these findings must be interpreted with caution given small cell sizes and imperfect balance. Future work should examine additional differences by other student characteristics (e.g., gender) and regional and neighborhood factors (e.g., rural, urban).
Finally, without an assessment between fifth and eighth grades, we cannot determine the immediate effects of the school transition on student outcomes. Some outcomes may have rebounded by eighth grade. A change in student functioning after a transition—even followed by a rebound—could have consequences for subsequent development. Without this additional assessment, we also cannot test whether differences between middle and junior high school types relate to the number of years of treatment. And, given the analytic method, we are unable to examine the role of school climate. Prior research has demonstrated differences between middle grade and K-8 schools in their structures, social climates, teacher characteristics, and classroom environments (Kim et al., 2014; Midgley et al., 1995; Wolters & Daugherty, 2007). Future studies are needed with strong measures of school social and instructional contexts to better understand which aspects of middle and junior high school contexts influence student outcomes.
Taken together, findings from this study enhance understanding of the impact of schooling in the middle grades on early adolescent outcomes. We found a robust negative effect of middle schools on students’ reading self-concept, and negative effects of middle and junior high schools on teacher views of oral and writing competence for less disadvantaged students in the year prior to the transition to high school. These findings, along with theory and research on school climate in middle grade schools (Eccles & Midgley, 1989; Kim et al., 2014), suggest a need to strengthen these school settings. This may involve paying attention to the instructional and social environment, teachers’ expectations of student achievement, and students’ self-perceptions as they progress to, and through, middle and junior high school. This may also involve increasing our understanding of what kinds of schools enhance growth across domains (psychosocial, academic) and subjects (mathematics, reading) as well as how schools can be leveraged to support optimal development and enhance the odds that youth will approach high school with the academic and psychosocial competence to succeed.
Footnotes
Authors’ Note
The opinions expressed are those of the authors and do not represent the views of the Spencer Foundation, Institute of Education Sciences (IES), or the Department of Education.
Declaration of Conflicting Interests
The author(s) declared no potential conflicts of interest with respect to the research, authorship, and/or publication of this article.
Funding
The author(s) disclosed receipt of the following financial support for the research, authorship, and/or publication of this article: This research was supported, in part, by a grant from the Spencer Foundation awarded in 2013 to the first and fifth authors (#201300077), and a training grant from the Institute of Education Sciences (IES) U.S. Department of Education (R305B080019 to New York University). The opinions expressed are those of the authors and do not represent the views of the funding agencies.
Author Biographies
References
Supplementary Material
Please find the following supplemental material available below.
For Open Access articles published under a Creative Commons License, all supplemental material carries the same license as the article it is associated with.
For non-Open Access articles published, all supplemental material carries a non-exclusive license, and permission requests for re-use of supplemental material or any part of supplemental material shall be sent directly to the copyright owner as specified in the copyright notice associated with the article.