
Abstract
Health literacy continues to be an important research topic as part of population-based assessments for overall health issues. The objective of this continuation study was to examine the health literacy rates and health outcomes as measured by the Kansas Behavioral Risk Factor Surveillance System (BRFSS) survey. A cross-sectional research design was used. Health literacy data were extracted from the state-specific module of the BRFSS telephone survey. Demographic and health status variables were extracted from the core BRFSS dataset. The association between demographic and health status characteristics with health literacy was obtained using weighted samples in multivariable logistic regression models. As in the previous study, most respondents had moderate health literacy (61.1%), followed by high health literacy (31.4%) and low health literacy (7.5%). The demographic variables of interest included race, marital status, home ownership, insurance status, metropolitan status code, survey language, veteran status, education, employment, income, sex, and age. The health status variables included general health rating, presence of chronic conditions, and length of time since last check-up. Findings include individuals with low levels of health literacy were nearly 7 times as likely to be unsure of at least one health condition than those with high health literacy and demonstrate a broad gap in people’s ability to communicate accurate information to health-care providers. Results can inform future efforts to build programs that address health disparities issues including low health literacy to provide equitable health-care services. There is a continued need for support for the creation of health literate programs.
Introduction
Health literacy continues to be an important research topic impacting overall health.1–5 Health literacy has been defined as by Ratzan and Parker as “the degree to which individuals have the capacity to obtain, process, and understand basic health information and services needed to make appropriate health decisions.” 6 Recent studies have confirmed that socioeconomic status, age, race, cognition, and education level are contributing factors of health literacy levels.7,8
Health disparities are differences in health that occur due to social, economic, or environmental disadvantages. Health literacy has been found to be associated with many of the similar factors as health disparities. Health literacy rates may explain some of the variation in health disparities that would be otherwise linked to other socioeconomic factors, such as education or income. 9 Some literature suggests that the individuals who are likely to fall victim to social disparities, which in turn lead to worse health outcomes, are also more likely to have lower levels of health literacy. 10 Incorporating health literacy as part of adult education may be a promising method to addressing health equity issues.11,12
Historically, there has been an absence of discussion in the literature of what a health literate population looks like, or how it is to be assessed. 13 Recent studies have shown success using the Behavioral Risk Factor Surveillance System (BRFSS) and a three-item screening tool to measure health literacy at the population level.8,14 The objective of this continuation study was to examine the health literacy rates and health outcomes as measured by the Kansas BRFSS survey.
Methods
Study Population
Analyzed data included the responses of Kansas residents who participated in the 2014 Kansas BRFSS and completed the health literacy assessment portion of the survey. The study was reviewed and approved by a university institutional review board.
Measures
The demographic variables of interest included race, marital status, home ownership, insurance status, metropolitan status code, survey language, veteran status, education, employment, income, sex, and age. The health status variables included general health rating, presence of chronic conditions, and length of time since last check-up.
Cumulative scores were calculated for responders who answered all three health literacy questions. We categorized respondents in the following manner: low health literacy (scores 3–8), moderate health literacy (scores 9–14), and high health literacy (score = 15). Therefore, all analyses utilized this trichotomized health literacy variable.
To assess each respondent’s ability to answer chronic health questions, any “yes” or “no” answer was considered as “able to answer the question.” Answers of “I don’t know/not sure” were categorized as “unable to answer the question.” Missing values or unasked questions were excluded from analyses.
Statistical Analysis
All data were analyzed using IBM SPSS Statistics version 24 for complex samples. The specific weighting methodology conformed to that prescribed by the Centers for Disease Control and Prevention for the version of the survey that contained health literacy questions. Chi-square tests were used to evaluate the significance of bivariate associations for each demographic variable, health status variable, and health literacy with the respondent’s ability to answer all the questions regarding chronic health conditions. For continuity with previous work, we include bivariate associations of demographic variables, health status variables, and the ability to answer each chronic health question with respondent’s health literacy.
To obtain the adjusted multivariable model for the association between the demographic, health status, and health literacy variables and the ability to answer questions about chronic health conditions, variables with an associated p value of ≤.20 were selected for inclusion in the initial multivariable model for complex samples. 15 All predictors selected were assessed for their associations with other predictor variables. Variables with significant associations (Spearman’s rho ≥0.3) were assessed in separate models to avoid issues of multicollinearity.
Results
Compared with previously published studies on health literacy,8,16 differences in respondents’ sex, age, race, education level, marital status, home ownership, income, insurance coverage, rurality of residence, general health rating, and the time since their last check-up were associated with differences in health literacy (Table 1). Germane to our study’s purpose is the proportion of individuals with low health literacy who were unable to answer questions regarding their history of chronic health conditions. Low levels of health literacy were found in a greater proportion of individuals who could not answer questions regarding their history of heart attack (17.3% vs. 7.0%, p < .001), coronary disease (12.3% vs. 7.1%, p < .001), stroke (20.5% vs. 7.1%, p < .001), cancer (33.9% vs. 7.5%, p = .042), chronic obstructive pulmonary disease (15.0% vs. 7.0%, p < .001), depressive disorder (12.9% vs. 6.2%, p < .001), kidney disease (8.2% vs. 7.5%, p = .001), and diabetes (14.1% vs. 6.7%, p < .001).
Weighted Demographic and Health Status Characteristics of Kansas BRFSS Sample in Relation to Their Health Literacy (N = 1,944,274).
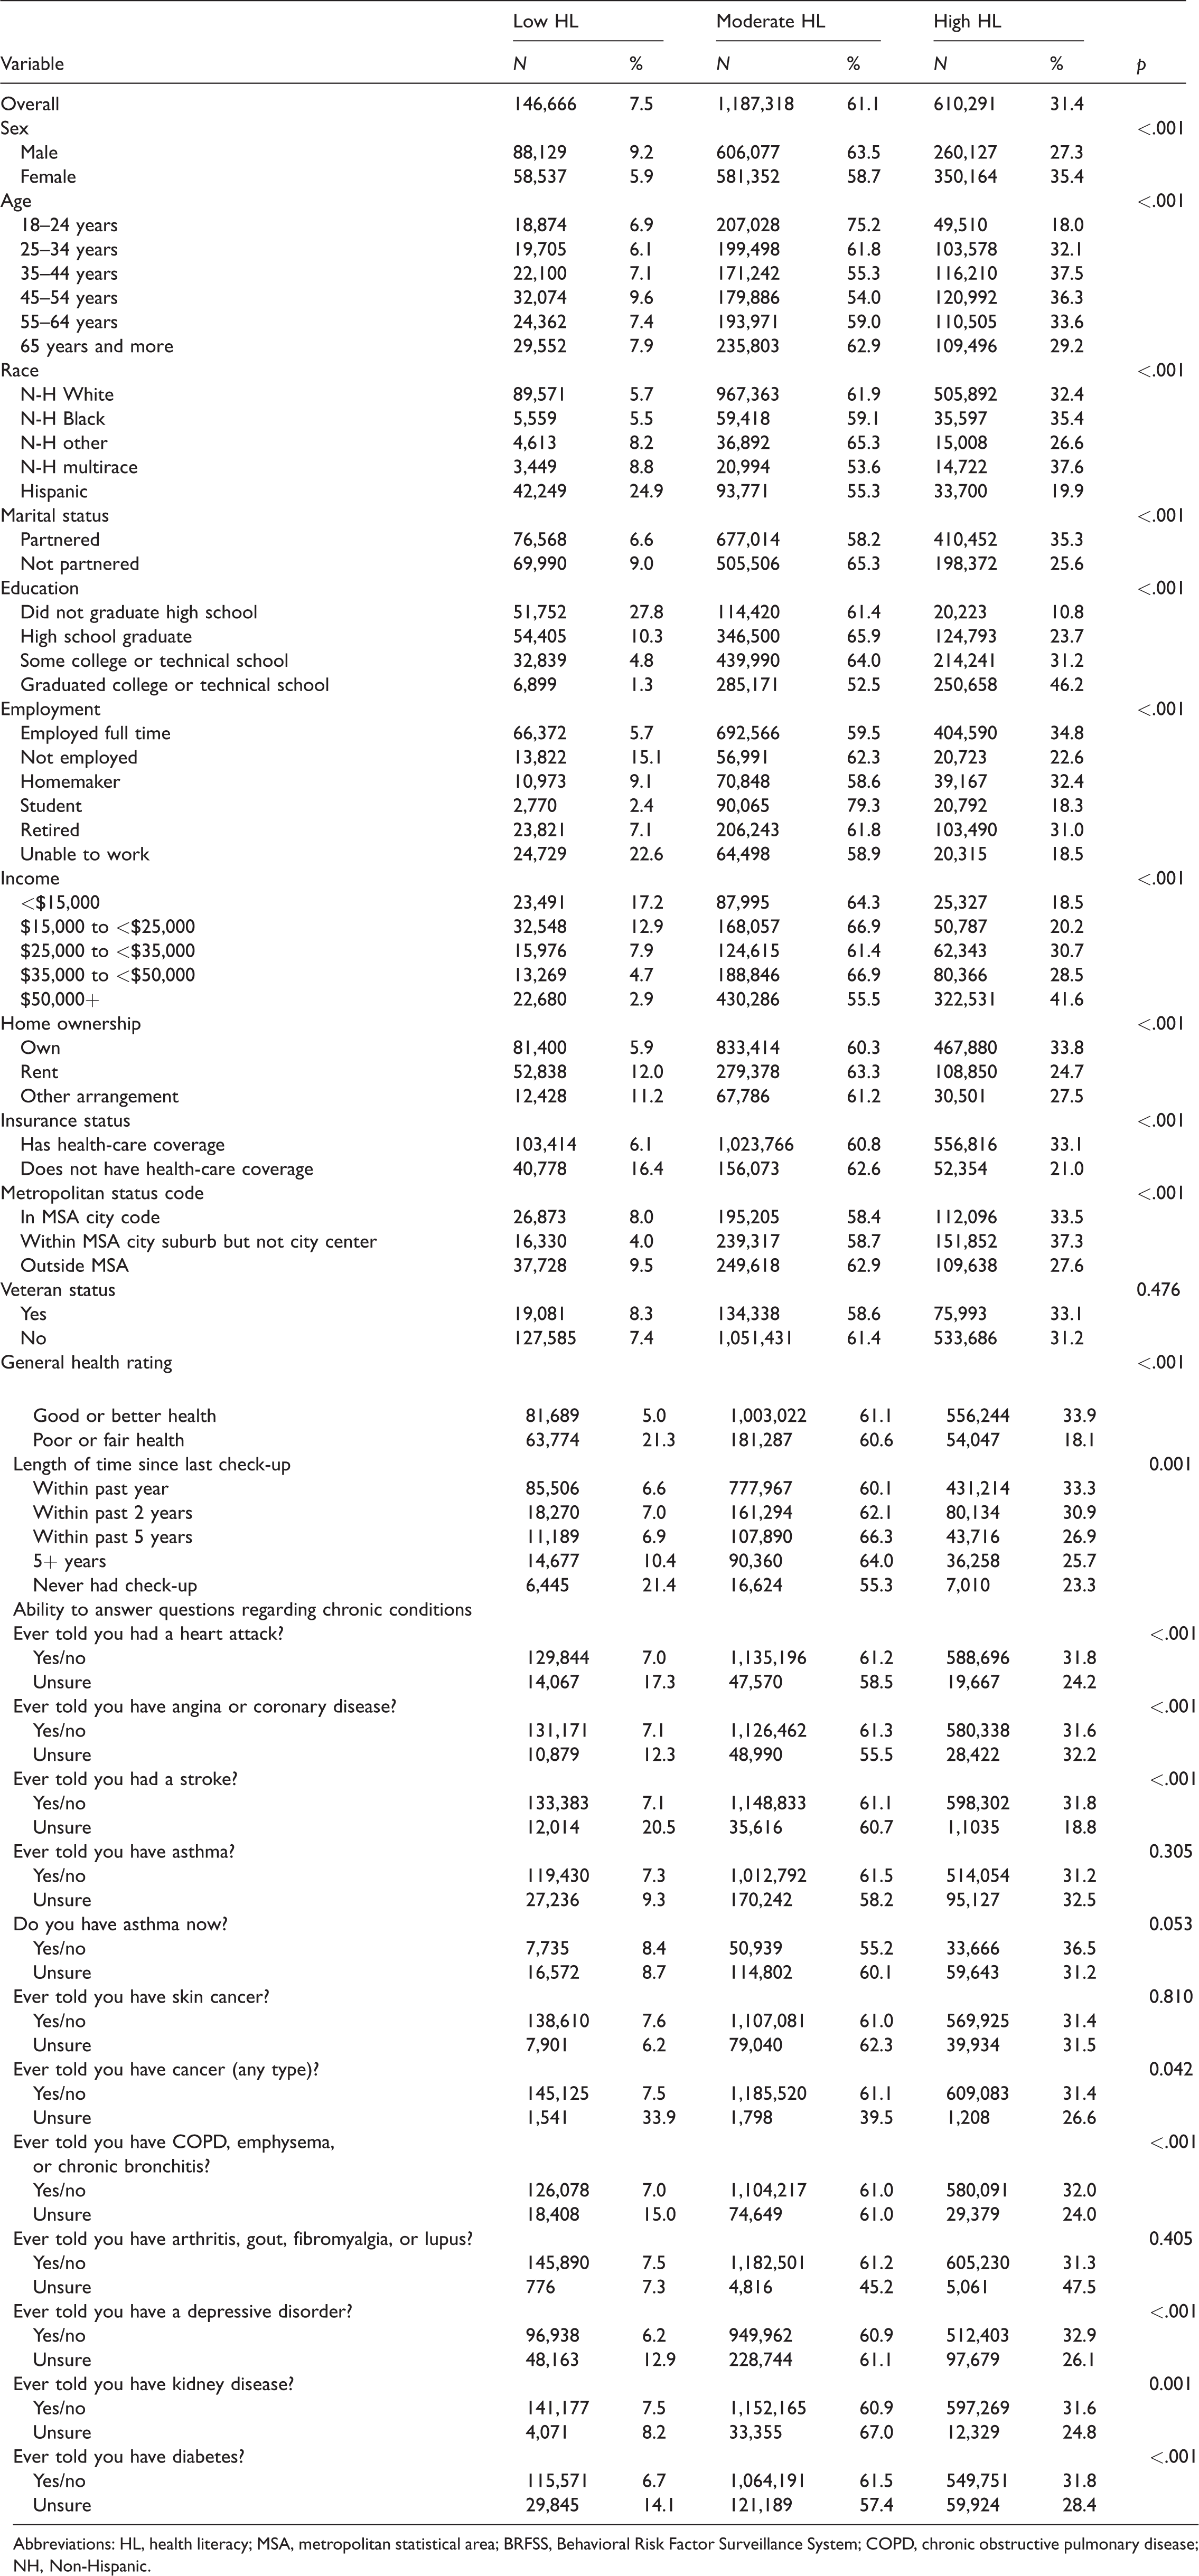
Abbreviations: HL, health literacy; MSA, metropolitan statistical area; BRFSS, Behavioral Risk Factor Surveillance System; COPD, chronic obstructive pulmonary disease; NH, Non-Hispanic.
The ability to answer all the BRFSS questions on chronic health conditions was significantly associated with the respondent’s marital status, income, and health literacy level (Table 2). When compared with the highest earning group ($50,000+), a reported income of $15,000 to $25,000 was associated with greater than threefold (12.9% vs. 3.5%) the proportion of respondents who could not answer all questions regarding chronic health conditions. For respondents earning $25,000 to $35,000, this increased to a nearly fourfold difference (13.2% vs. 3.5%). Partnered respondents were better able to answer all the questions than nonpartnered respondents (94.7% vs. 88.5%, p = .004). Individuals with low levels of health literacy were nearly 7 times as likely to be unsure of at least one health condition than those with high health literacy (22.0% vs. 3.3%) and almost 3 times as likely as those with moderate health literacy (22.0% vs. 7.4%).
Weighted Demographic and Health Status Characteristics of Kansas BRFSS Sample in Relation to Their Ability to Answer All Questions Regarding Chronic Health Conditions (N = 326,972).
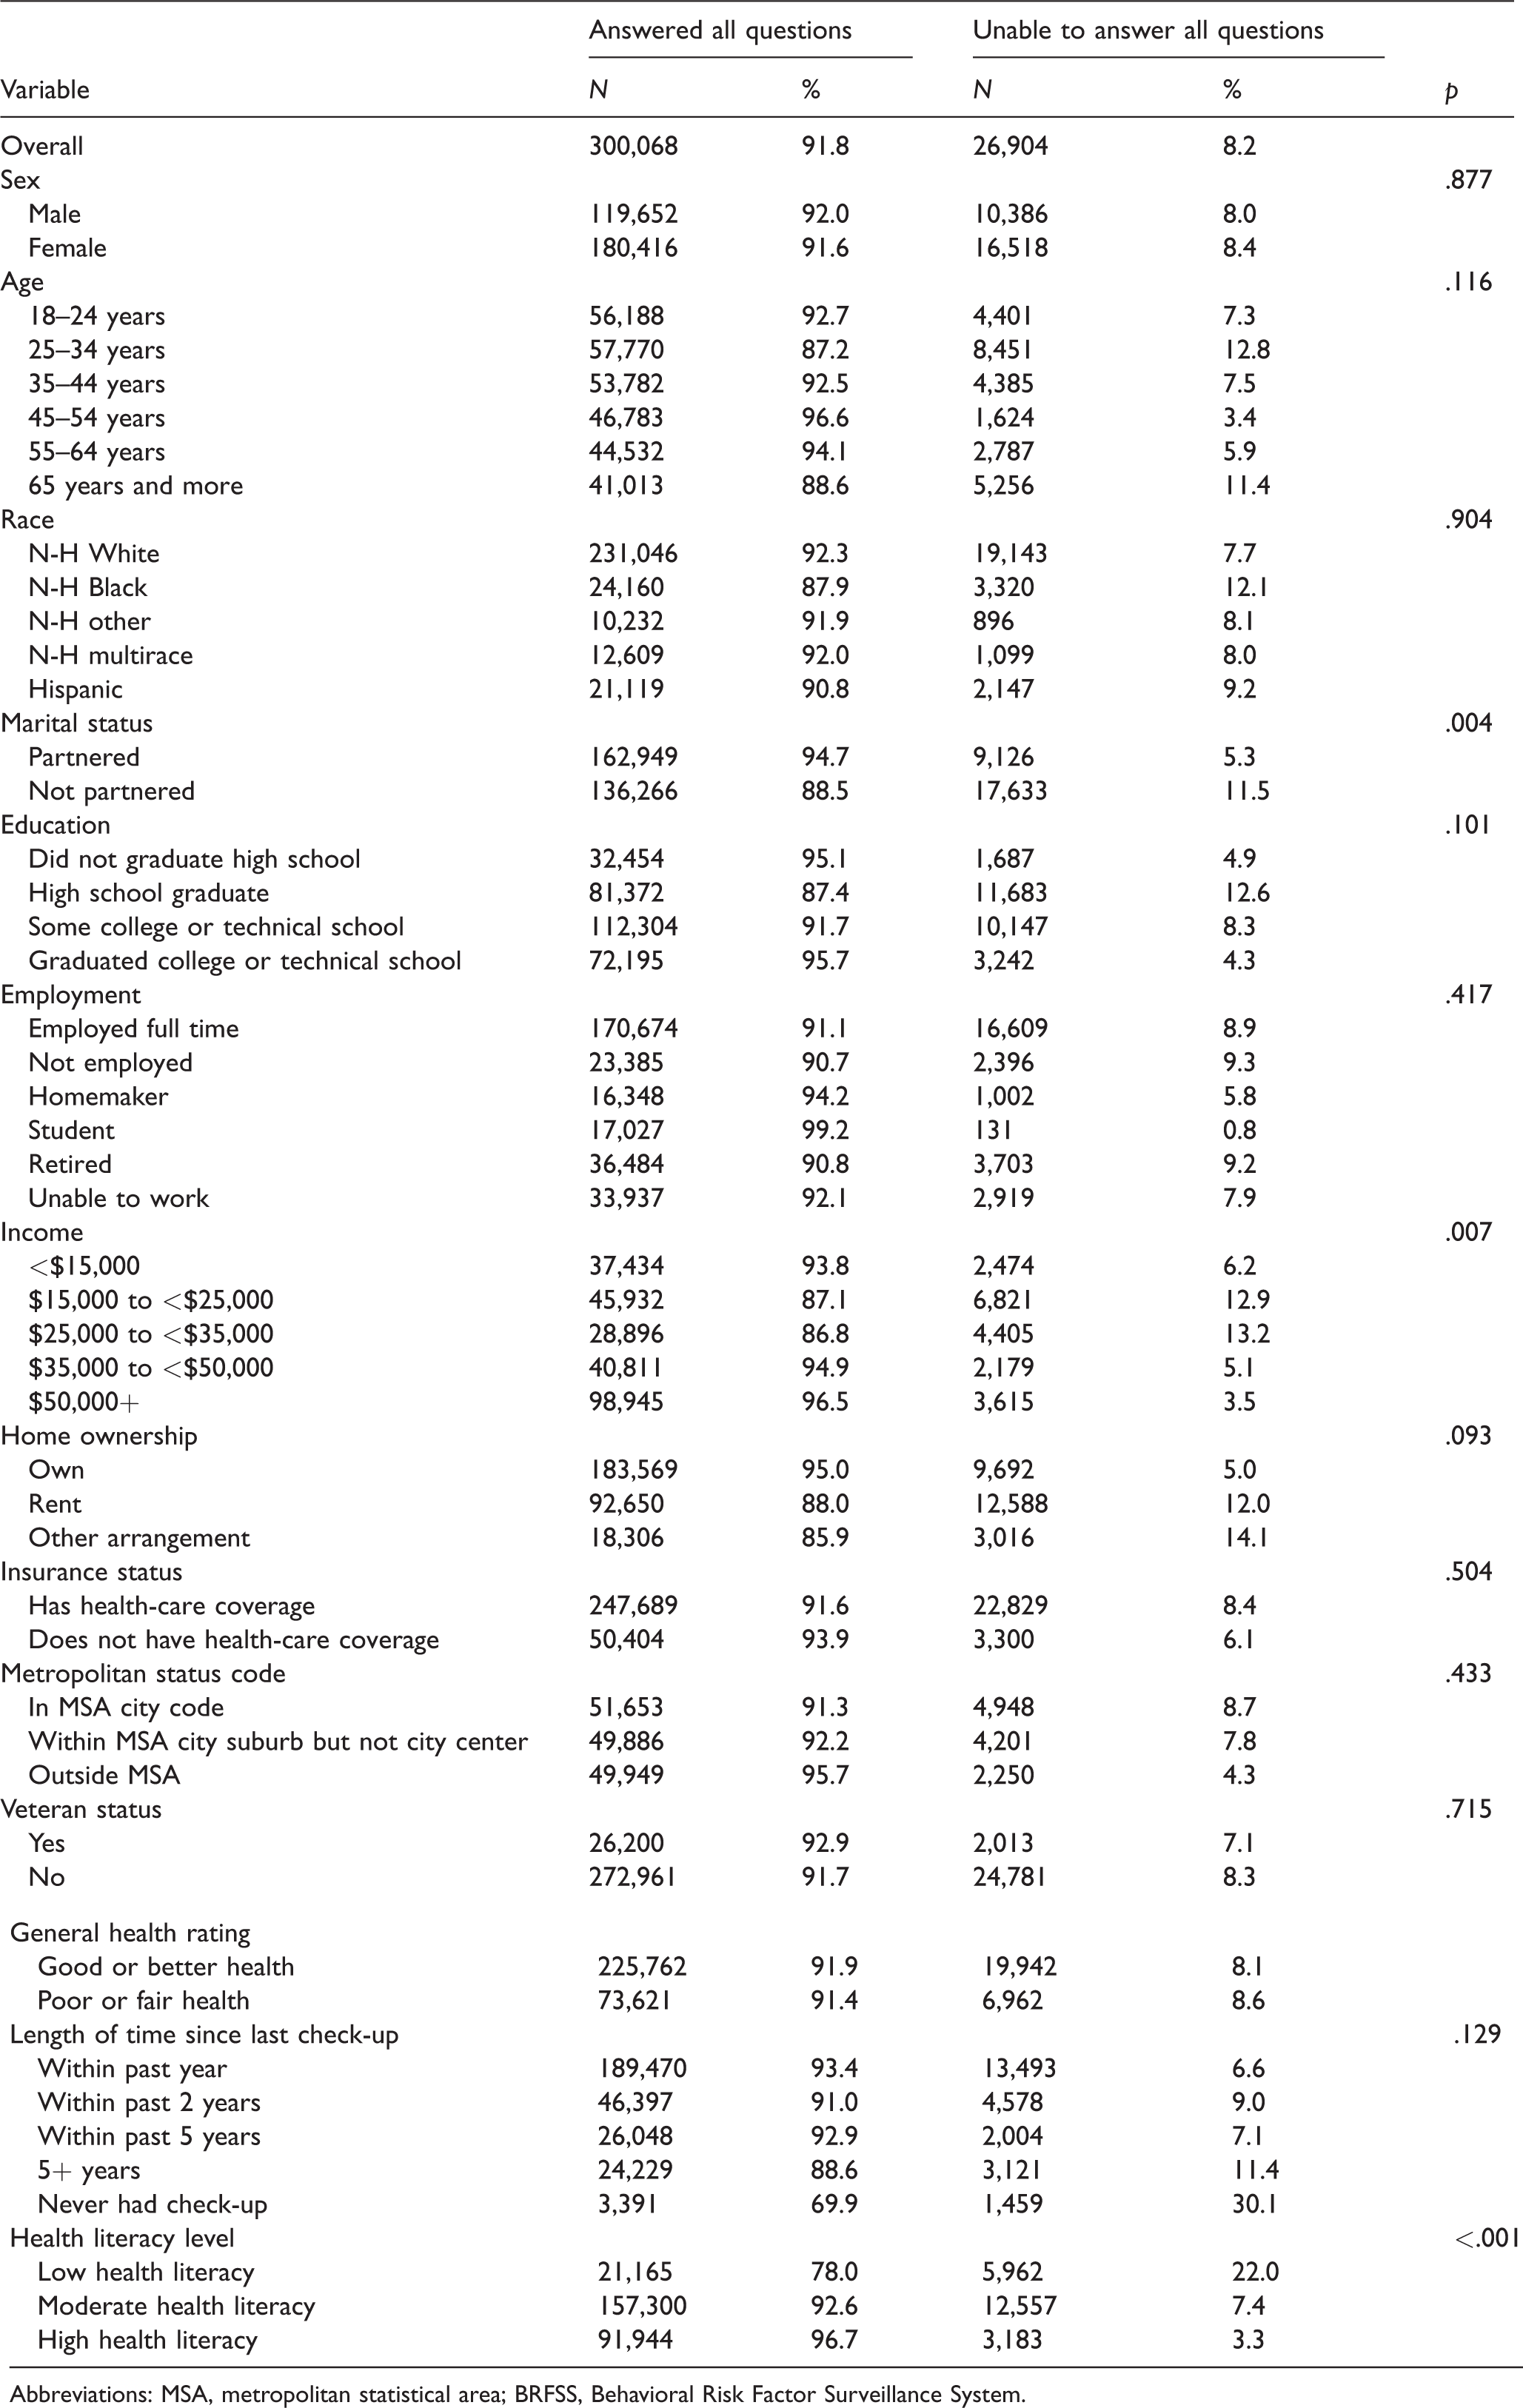
Abbreviations: MSA, metropolitan statistical area; BRFSS, Behavioral Risk Factor Surveillance System.
Due to their association (p≤0.20) with the ability to answer questions regarding chronic health conditions, age, income, marital status, home ownership, education, time from last check-up, and health literacy were selected for inclusion in a multivariable model. However, significant bivariate associations between education, income, marital status, and home ownership required us to enter each in a separate model with health literacy, time since last check-up, and age as covariates. Tables 3 to 5 summarize the results for each model that could converge on a final solution. The model containing age, time since last check-up, health literacy, and home ownership was unable to converge on a solution and is not represented in these tables.
Adjusted Associations Between Age, Income, Time Since Last Check-up, Health Literacy Level, and Ability to Answer All Chronic Health Condition Questions on the BRFSS. a
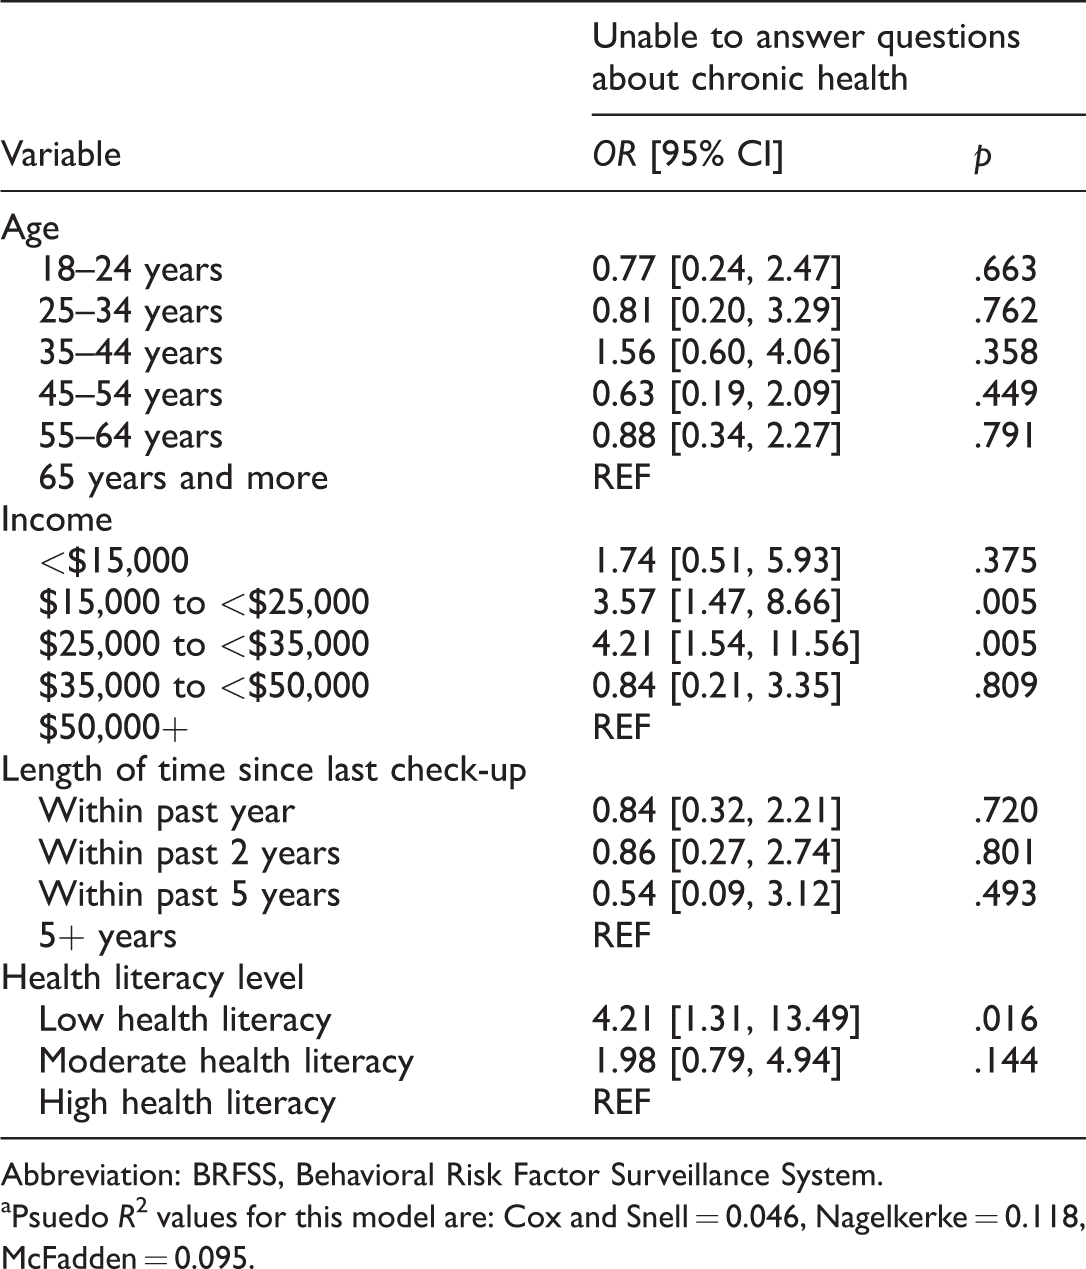
Abbreviation: BRFSS, Behavioral Risk Factor Surveillance System.
Psuedo R2 values for this model are: Cox and Snell = 0.046, Nagelkerke = 0.118, McFadden = 0.095.
Adjusted Associations Between Age, Education, Time Since Last Check-up, Health Literacy Level, and Ability to Answer All Chronic Health Condition Questions on the BRFSS. a
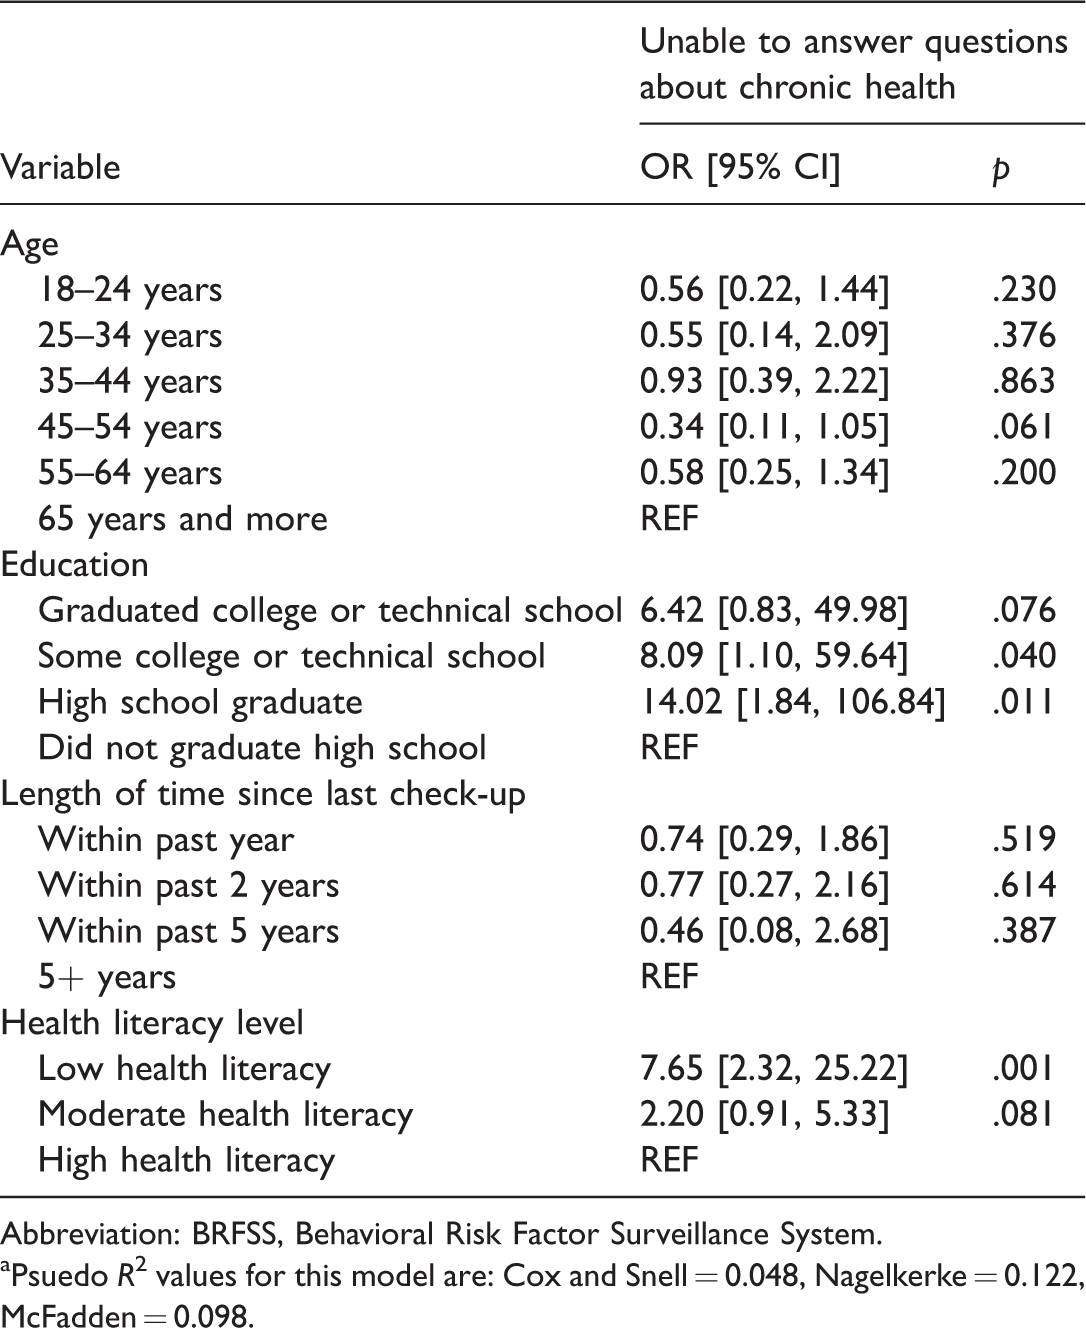
Abbreviation: BRFSS, Behavioral Risk Factor Surveillance System.
Psuedo R2 values for this model are: Cox and Snell = 0.048, Nagelkerke = 0.122, McFadden = 0.098.
Adjusted Associations Between Age, Marital Status, Time Since Last Check-up, Health Literacy Level, and Ability to Answer All Chronic Health Condition Questions on the BRFSS.a
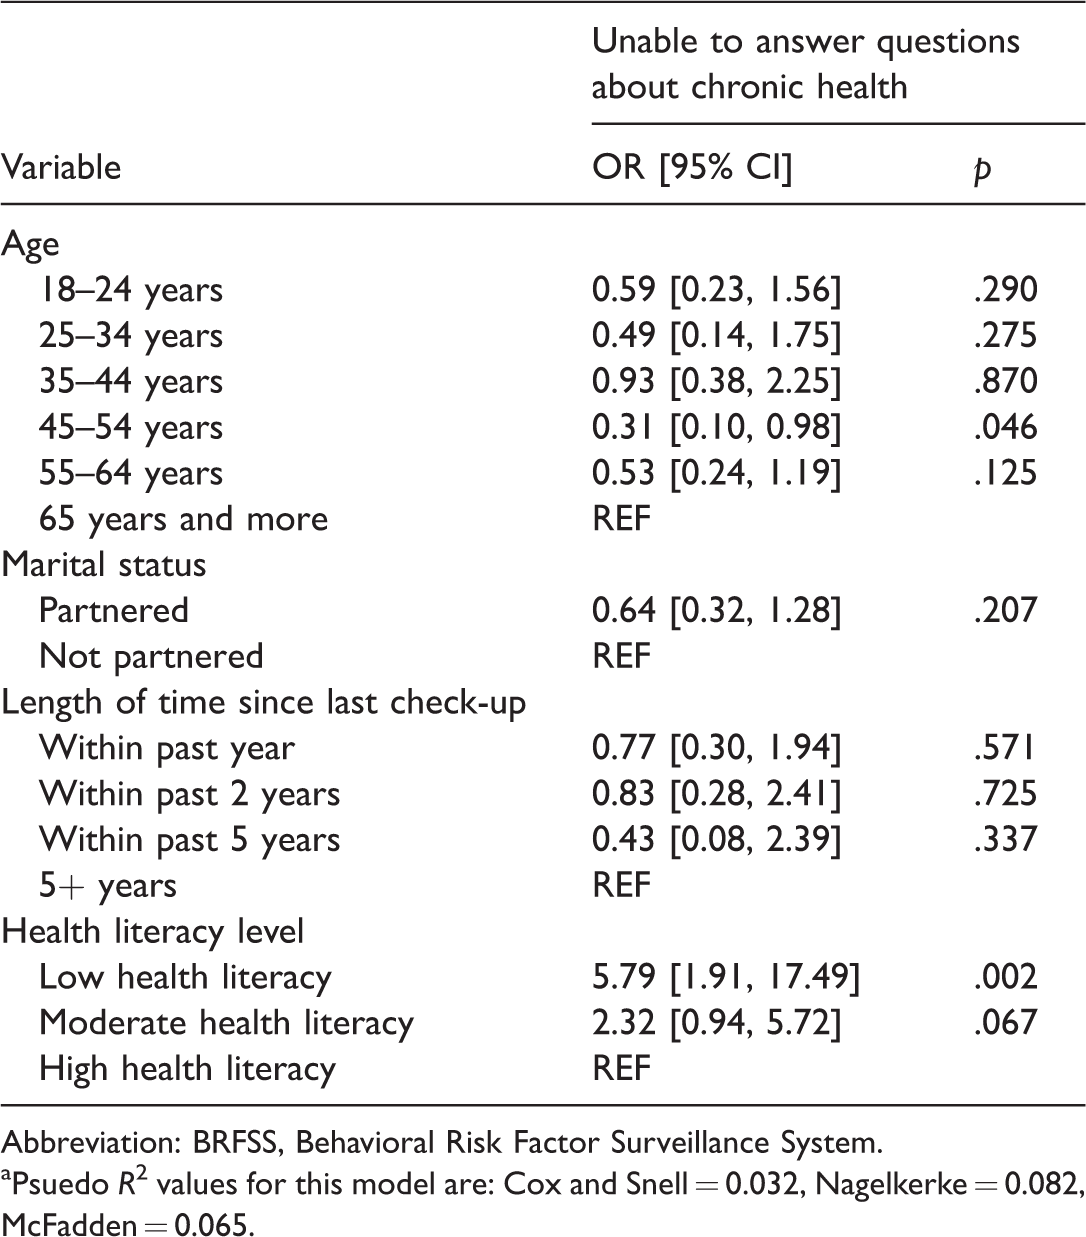
Abbreviation: BRFSS, Behavioral Risk Factor Surveillance System.
Psuedo R2 values for this model are: Cox and Snell = 0.032, Nagelkerke = 0.082, McFadden = 0.065.
Discussion
This study confirms the use of the BRFSS survey to measure variables associated with health disparities.17–19 This study also reinforces the findings that race, education, employment, income, sex, age, and health status are related to health literacy. Although other studies have used BRFSS state data, 20 as of this publication, no states have measured health literacy using the BRFSS survey as a multiyear study. This study confirms many of the previous findings from 2012 BRFSS data and extends the results by examining the proportion of individuals with low health literacy who were unable to answer questions regarding their history of chronic health conditions.
Findings included individuals with low levels of health literacy were nearly 7 times as likely to be unsure of at least one health condition than those with high health literacy (22.0% vs. 3.3%) and almost 3 times as likely as those with moderate health literacy (22.0% vs. 7.4%). These findings highlight a broad gap in people’s ability to communicate accurate information to health-care providers. The implication of this study’s findings is a key to the development of health literacy initiatives and communication programs that target people with low health literacy.
Limitations
This study utilized cross-sectional data from one Midwestern state with validated methodology.8,14,21,22 Several limitations should be considered. Self-reported survey data are subject to possible response bias. However, other research has found that self-reported health literacy rates have been demonstrated as reliable. 23 Respondents may have encountered survey fatigue which may have affected their response to the telephone questions. Furthermore, the health literacy questions are used as a screening tool and do not access particular gaps in skill or knowledge. The data for this study were limited to questions constructed for the supplemental arm of the survey. Casual judgments and study results are limited due to the cross-sectional nature of the data. Finally, this study included results from one Midwestern state which may not be generalizable to other states with differing populations.
Conclusions
This study has demonstrated the importance of assessing health literacy by incorporating a three-item health literacy assessment into an optional state-specific module of the BRFSS. In addition, health literacy rates for the state have been identified and associations with variables typically collected through the BRFSS survey are confirmed. These findings highlight the need for programs to assist individual comprehend, communicate, and manage health issues. There is currently a dearth of evidence-based programs for rural, Midwestern populations to provide appropriate knowledge and skills to address health literacy and health disparities. Interventions and programs could be designed to model the behaviors of people with high health literacy. Certainly, educational initiatives directed at multiple levels are necessary to continue to address health disparities, improve health outcomes, and provide equitably health services to all people.
Footnotes
Declaration of Conflicting Interests
The author(s) declared no potential conflicts of interest with respect to the research, authorship, and/or publication of this article.
Funding
The author(s) disclosed receipt of the following financial support for the research, authorship, and/or publication of this article: Funding for this study was provided by the Aging Institute, Wichita State University, Kansas Department of Health and Environment, and the Kansas BRFSS.