
Abstract
Background
Icon arrays, which visually depict frequencies, are commonly recommended for communicating risk information such as survival rates. However, they have been found to be ineffective at buffering against motivated reasoning that can lead to undue optimism. To determine whether the impersonal frequency format of icon arrays (reporting a number affected out of a reference class) makes them vulnerable to motivated reasoning, a novel intervention is tested as a means for reducing undue optimism.
Methods
Female US participants from Amazon’s MTurk (N = 399) imagined a scenario in which their infant would be born extremely preterm. They were presented with icon array information about the survival chances (15-in-100 or 45-in-100) of prematurely born infants with intensive care. For the key intervention, some participants were asked a reflection question immediately after seeing the icon array, which prompted them to indicate what the information meant for their own infant’s percent-chance of survival (i.e., they converted a frequency about a reference class to a probability value about the personal outcome of interest). For other participants, the reflection question merely asked about frequency. The main dependent measure came next and assessed gut-level optimism.
Results
People’s gut-level beliefs about their infant’s chances of survival were optimistically biased; the intervention did not reduce this. These gut-level beliefs, rather than the objective survival rate information conveyed through icon arrays, were predictive of subsequent treatment choices.
Conclusions
The results suggest that the inability of icon arrays to buffer against motivated reasoning is not due to their frequency format. Moreover, the findings highlight the usefulness of measuring gut-level interpretations of likelihood, which can reveal significant insights into the psychological mechanisms driving patient-treatment choices.
Highlights
Icon arrays, which visually depict frequencies, are commonly recommended as best-practice for communicating risk information in health contexts.
However, recent work has found that they are ineffective at reducing the extent to which people engage in motivated reasoning when processing likelihood information.
We find that the frequency format of icon arrays—depicting a rate for outcomes in a group of people rather than a case-specific probability—is not a primary reason why they are ineffective at reducing optimism bias
We also find that measures of gut-level beliefs of likelihood are particularly well suited for detecting optimism bias, yet also predict subsequent treatment decisions.
Keywords
For some healthcare decisions, people face possible outcomes that range from miraculous to devastating. Naturally, people hope for the best and to avoid the worst, but research also suggests that such directional motives can lead people to engage in various forms of motivated reasoning.1–3 One possible consequence of motivated reasoning is optimistically biased beliefs. People often hold a likelihood belief about a preferred health outcome that is unjustifiably high or about an unpreferred health outcome that is unjustifiably low.4–7 In some cases, people appear to comprehend the sobering risk information but falsely conclude that the risk information does not apply to their own case.8–13
An important context in which motivated reasoning and optimistic bias could be especially prevalent is an extremely premature birth. For infants born at a gestational age of 22 to 24 weeks, survival is substantially uncertain. Given this prognostic gray zone, doctors commonly seek parental input about whether to implement intensive care or palliative care. i With intensive care, survival is possible, but the procedure is invasive, and surviving infants have a risk of lifelong disabilities. Conversely, a key goal of palliative care is to minimize discomfort, and there is no chance of survival. In these situations, parents must consider survival rate information—among other factors—when making a treatment decision for their infant. Prior work shows that parents in these situations tend to interpret survival rate information in a biased manner. For example, Nayak et al. 17 demonstrated that parents tended to misinterpret unfavorable diagnoses for their hypothetical infant by consistently overstating their infant’s chances of survival relative to the objective likelihood information provided by the doctor. Similarly, parents’ treatment decisions have been found to be somewhat insensitive to survival rate information, suggesting that parents may discount relevant likelihood information when under the influence of strong directional motives.15,18
From a researcher’s perspective, optimistically biased interpretations of survival rate information may undermine efforts to facilitate informed parental decision making. A goal of preparing people for shared decision making is to provide them with information about the risks and benefits of treatment options as clearly as possible. 19 This is especially true for parental treatment decisions regarding their premature infants. However, efforts to transparently present survival rate information may be negated when motivated reasoning distorts how parents interpret or otherwise react to the survival rate information. It is thus crucial to find ways to buffer against the influence of motivated reasoning when presenting parents with important survival rate information.
Do Icon Arrays Prevent Motivated Interpretations of Survival Rates?
Icon arrays may seem like a useful tool in mitigating motivated bias. Icon arrays are graphical representations of likelihoods that present outcomes in terms of icon frequencies (see Figure 1). Studies reveal that icon arrays can reduce certain forms of confusion about risk information, such as base-rate neglect.20–25 However, reducing confusion is distinct from whether icon arrays buffer beliefs from the effect of motivated reasoning; this point was made salient by findings in a recent study by McDonnell et al. 15
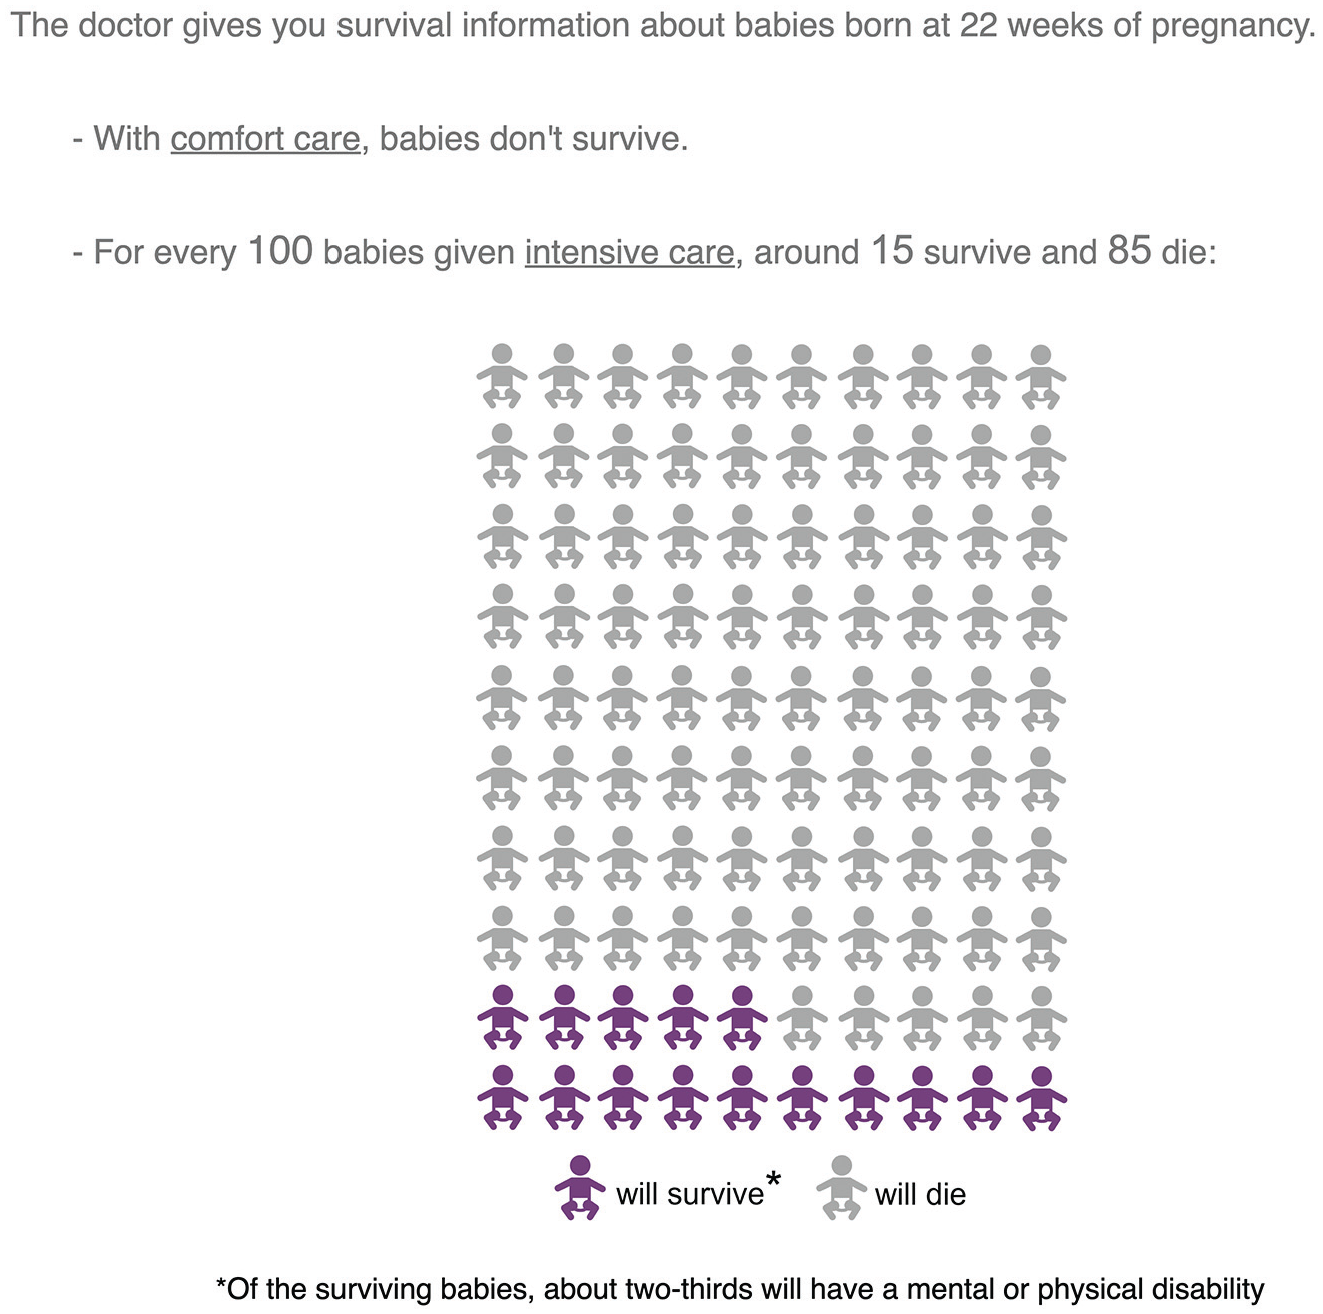
Text and icon array presenting the survival information about babies born at 22 wk of pregnancy. For half of the participants, the survival rate shown in the array was 45-in-100, as opposed to 15-in-100.
In McDonnell et al., 15 women were presented with a hypothetical scenario in which their infant was born extremely preterm (adapted from Kidzsun et al. 18 and Haward et al. 26 ). As in Kidzsun et al., 18 the stated rate of survival with intensive care was manipulated (3-in-10 or 6-in-10 babies would survive). This survival rate was presented either via numeric statement only or with a visual aid—either a static or iterative icon array. Next, participants were asked to make a choice of palliative care or intensive care for their hypothetical baby. Several questions later, they were also asked about their gut-level beliefs about their baby’s chances of survival (i.e., At a gut level, what would you believe is your baby’s chance of survival?)—a measure adapted from Windschitl 27 meant to tap people’s intuitive beliefs about the likelihood of an event. Results were not significantly affected by whether participants learned the survival rate information via icon arrays versus via numbers only. As in Kidzsun et al., 18 choices between palliative and intensive care were not different in the 3-in-10 versus 6-in-10 conditions—irrespective of the display format. Notably, responses on the measure assessing gut-level beliefs about their own baby’s chances revealed substantial levels of optimism even in the 3-in-10 condition and regardless of whether this rate was learned from numbers only or icon arrays. In short, one might have expected that icon arrays would reduce the impact of motivated reasoning and keep participants from being highly optimistic when the survival rate indicated a low likelihood of success, but icon arrays did not appear to have this prophylactic effect.
The Present Study: Testing a Novel Intervention and Further Probing Gut-Level Beliefs
The present study used a premature birth scenario similar to McDonnell et al. 15 as an important context for examining the impact of optimistic bias in interpreting survival rates. However, our goals were new in 2 ways. First, we wanted to test a new intervention aimed at reducing optimistic bias—an intervention inspired by novel theorizing about why icon arrays were unsuccessful in buffering people’s reactions against motivated reasoning. Second, we wanted to more strenuously test the optimistic gut-level beliefs revealed by McDonnell et al. 15 and learn more about what might underlie those beliefs. We discuss those 2 goals in turn next.
Testing a Novel Intervention/Hypothesis
The failure of icon arrays to reduce the inflated levels of optimism in McDonnell et al. 15 led us to speculate about a property of both numeric rates like 3-in-10 and the icon arrays that communicate that rate. Namely, both use a frequency format. For health communications, they typically indicate how many people in a reference class will experience a given outcome, rather than directly specifying a person’s individual risk level. In this regard, they are impersonal. In contrast, single-event probability representations indicate a given person’s percentage chance/probability of experiencing the outcome.28–30 Using frequencies in risk communication has been argued to be helpful in reducing people’s comprehension confusions as well as error-prone computations of posterior probabilities.21,31,32 Notably, in the debate over how useful frequency representations are in eliminating errors, we do not know of any prior test of whether they are useful for reducing the impact of motivated forms of bias. In fact, we began to take seriously the possibility that impersonal frequency formats—including icon arrays—are particularly ill-suited for protecting against motivated bias.
The logic behind this concern was as follows. Various lines of research suggest that when motivational pressures—such as a strong desire for a safe/successful outcome or to view oneself as highly skilled—are activated, the impact of motivated reasoning will be greatest when there is ambiguity or leeway in how one can interpret available information in forming beliefs.2,33–37 Motivated reasoning, in this case, involves exploiting that ambiguity/leeway to arrive at a more favorable (or less unfavorable) belief. If, for example, risk information can be somehow pegged as more relevant to other community members than to the self, the result could be undue optimism. 36
In the case of icon arrays and frequency formats, there may be leeway in interpreting the implications of the communicated risk information. Past work has suggested that people often view frequency information as more applicable to others than to themselves.38,39 This has been posited to explain patterns of comparative optimism biases observed in the literature.38,39 The overall degree to which people view frequency information as self-relevant might be somewhat flexible; when a person is motivated to do so, they may construe icon array information, which is inherently frequency-based, as being primarily about other people, not the self. Consider an example in which an icon array communicates that 5 out of 100 people will survive a disease—a value that would typically be viewed as bleak. When strongly motivated to have an optimistic conclusion about survival, a person might actively or implicitly discount the 5-in-100 information as being primarily about other people. Instead of using the bleak, 5-in-100 information to inform their sense of personal vulnerability, the person could rely on other, less bleak, and perhaps even selectively positive thoughts about self-based characteristics to inform their sense of personal vulnerability. In sum, the frequency format used in icon arrays may leave people some latitude in interpreting the information they have been given, thereby making room for influences from motivated biases.
To test this hypothesis in the present study, we used an intervention that prompted people to convert an icon array’s frequency information into a probability about their own particular case. Specifically, the intervention happened as people viewed an icon array showing an X-in-100 babies survival rate, and it required participants to convert the survival rate shown in the icon array into what this meant about their own baby’s percentage chance (0%–100%) of surviving. Because we asked for this conversion immediately and because the conversion would presumably be a very simple one (requiring a simple mapping from X-in-100 to X% chance for own baby), we assumed that their answer for the conversion would reflect a relatively accurate understanding of what the survival rate implied for their specific case in probability terms. This self-generated and largely accurate probabilistic understanding would—even if personally threatening—be hard for a person to discount. When gut-level beliefs of their baby’s chance of survival are subsequently queried, the person’s option of interpreting the icon-array information as merely about other babies would therefore be closed off (in the intervention condition). In other words, the interpretational leeway that people would otherwise exploit to arrive at more favorable gut-level beliefs of their own baby’s chance of survival would be unavailable. In addition, as a secondary issue, we thought it possible that the intervention would increase people’s sensitivity to the survival-rate manipulation (either 15-in-100 or 45-in-100, depending on the between-subject condition ii ).
Testing More about Optimistic Bias and the Gut-Level Measure
In addition to testing the hypothesis that icon arrays might be particularly vulnerable to motivational bias because they present risk information in a frequency format, we wanted to further investigate the foundations for and correlates of the optimistic gut-level beliefs revealed by McDonnell et al. 15 Unlike in the McDonnell et al. 15 study, in which the gut-level measure was positioned late in the procedures (after decisions were made), we placed the gut-level measure immediately after the icon array and before the decision measure. This allowed us to test whether 2 key findings from McDonnell et al. 15 would hold. First, we could test whether participants again exhibited gut-level beliefs of their own baby’s likelihood of survival that were overly optimistic relative to what the objective chances communicated by the icon array would suggest. Second, we could test whether the gut-level optimism responses again predicted participants’ decisions. If they did, this would be confirmation that the variability seen in gut-level responses—even when solicited immediately after participants saw and reported on the icon-array information—reflects meaningful subjective differences in optimism.
Lastly, in exploring why people would exhibit such robust optimism after seeing generally poor survival rates, we included a series of measures to assess potential correlates or rationales for optimistic orientations. Moreover, we added a control item that allowed us to rule out the possibility that the high level of optimism detected on gut-level belief scales reflects a superficial scaling issue. All told, these inclusions offer the potential for learning more about whether gut-level beliefs are well-suited for detecting the influence of motivational factors on interpretations of likelihood.40,41
Methods
Participants and Design
This study was approved by the University of Iowa Institutional Review Board, and all participants provided informed consent. Prior to providing their informed consent, participants were informed that the study would ask them to envision a scenario in which they were pregnant and anticipating a premature birth. To allow for more direct comparisons with prior work, our sample consisted of adult women, as was the case in the recent studies on which our scenario was based.15,18 The participants were US based and recruited from Amazon Mechanical Turk using CloudResearch. As described in our preregistration, we collected data until 400 participants passed our predetermined exclusion criteria. iii The sample size provides at least 80% power to detect medium–small effects (Cohen’s d = 0.35) for the primary analyses. Each participant was paid $ 0.80, and all participants were residents of the United States. Participants were randomly assigned to 1 of 4 conditions in a 2 (survival rate: 15-in-100 v. 45-in-100) × 2 (reflection format: frequency v. probability) between-participant design. The preregistration, study materials, data, and analysis code are available at: https://researchbox.org/2631.
Premature Birth Vignette
We used a slightly modified version of the hypothetical case vignette used by McDonnell et al., 15 which was originally adapted from Haward et al.26,iv As part of the vignette, participants learned about the risks associated with extremely premature birth and the treatment options that are available in the event of premature delivery: intensive care or comfort care. Intensive care offers some chance of survival by placing the infant on a breathing machine and supplying it with nutrients. In contrast, comfort care does not offer any chance of survival but instead avoids painful/invasive medical procedures with low probabilities of success and keeps the infant comfortable and out of pain until death.
After learning about the risks and choices associated with premature birth, participants were asked 3 recall questions about the information that was provided (see the Supplemental Materials). Anyone who incorrectly answered 1 or more questions was excluded from participating further.
Participants were then presented with a hypothetical scenario in which they were going into premature labor and needed to think ahead about the decision between intensive care and comfort care after delivery (see the Supplemental Materials for the full vignette). Participants were then shown an icon array, which conveyed survival information about babies born at 22 wk of pregnancy who are given intensive care (Figure 1). The survival rate was manipulated to be either 15 or 45 out of 100.
Immediately upon seeing the icon array information, participants encountered 1 of 2 reflection items; this difference between the 2 reflection items was the key manipulation of the intervention (see Figure 2). In the frequency-format condition, the reflection question simply asked participants to report how many babies (out of 100) would survive given intensive care. In other words, it was in keeping with the frequency format of the icon array. Conversely, in the probability-format condition, the reflection question was specifically framed in terms of a single-event probability, asking participants to consider what the icon-array information meant for their own baby’s chances of survival. In keeping with the single-event framing, participants reported their own baby’s probability of survival, rather than a general frequency of survival.
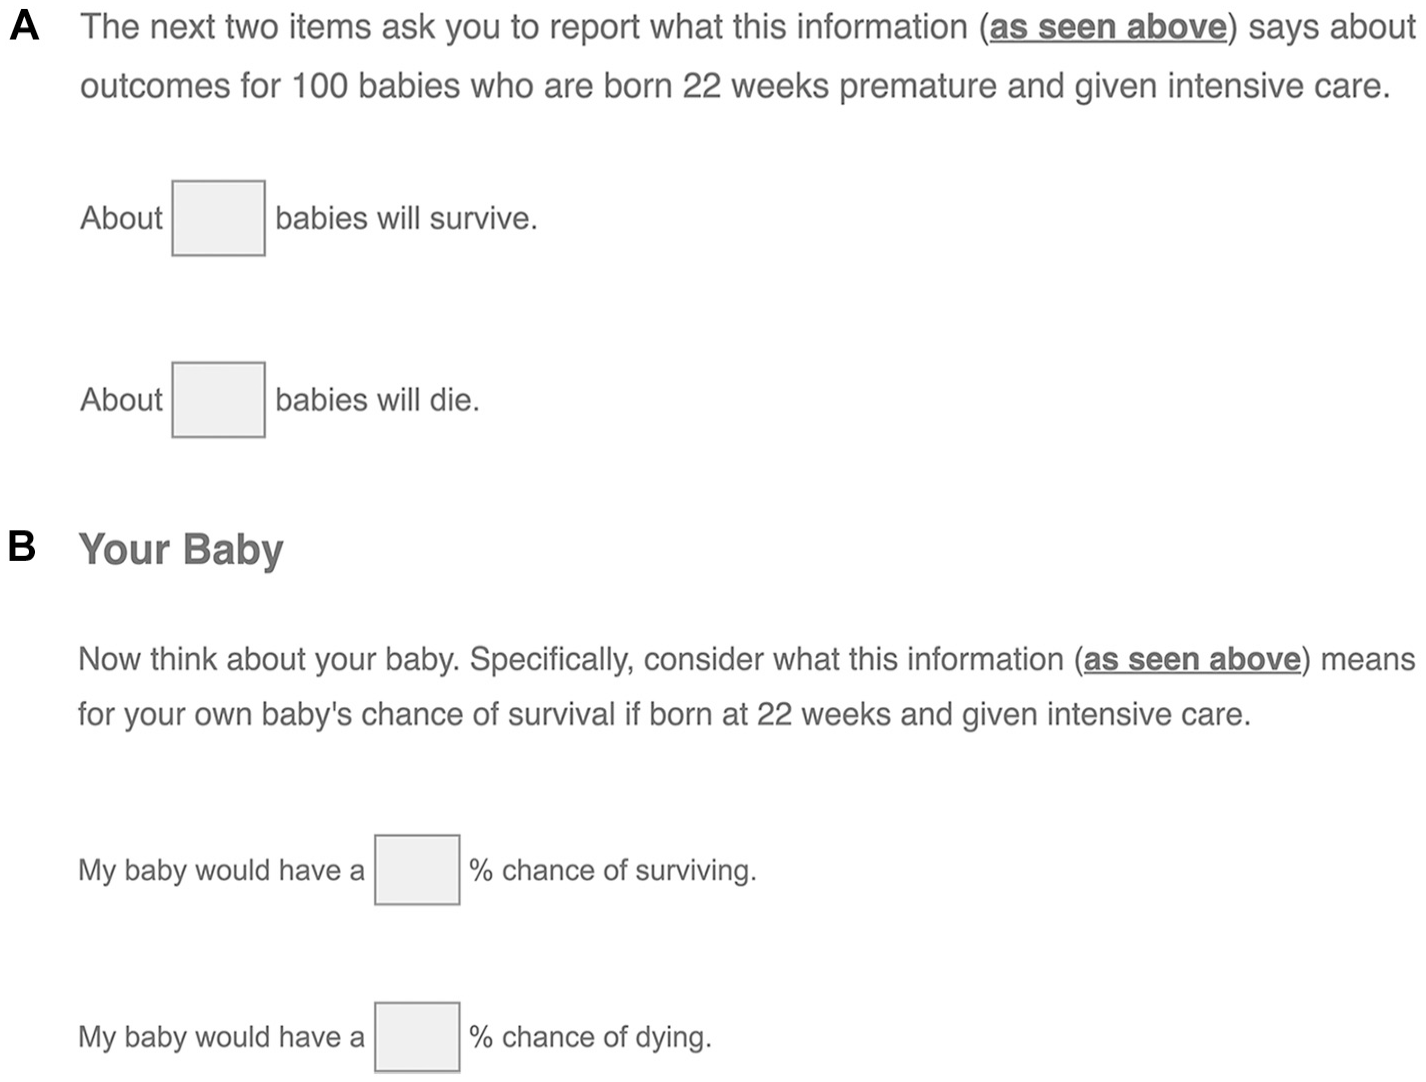
Icon arrays were accompanied by reflection questions that were either in a frequency format (A) or a probability format (B).
After the icon array and reflection question, participants were asked to assume that their infant was born shortly after the conversation they had with their doctor, 22 weeks into the pregnancy. They then answered the following measures.
Measures (Answered after the Reflection Questions)
Gut-level beliefs
Participants were asked, “At a gut level, what would you believe is your premature baby’s actual chance of survival if given intensive care?” They responded on a slider scale that contained no numbers but had endpoints of “No chance of survival” and “Definitely will survive.” Responses were coded from 0% to 100% depending on where they were located relative to the endpoints (e.g., the leftmost position under no chance would be coded 0%; the rightmost position would be coded 100%).
Treatment decision measure
Participants then indicated which treatment option they would choose for their infant (1 = comfort care; 2 = intensive care).
Measures of potential correlates or rationales for optimistic orientations
Participants were asked, “Regarding your own baby’s chances of survival (given intensive care), would you be more optimistic or less optimistic than what the doctor’s numbers suggest?” (less optimistic; same level; more optimistic). They were also asked what kind of estimates doctors in these situations tend to give to parents (realistic; leaning toward pessimistic/cautious; leaning toward optimistic/hopeful) and they were asked to prescribe how other parents should estimate their infant’s chances of survival given intensive care (1 = greatly underestimate; 5 = greatly overestimate). 42
Baseline gut-level belief measure
We also included a second gut-level belief measure about a topic unrelated to the premature-birth context and for which participants had no directional motives. Specifically, participants were asked about their gut-level beliefs regarding a person’s chances of drawing a blue marble from a jar containing 15 (or 45) blue marbles and 85 (or 55) white marbles (1 = No chance of drawing a blue marble; 100 = Definitely will draw a blue marble).
Remaining measures
Participants were asked a series of decision consistency items (see Supplemental Materials Section A), a question about whether they prioritized preservation of life versus quality of life, and a set of demographic questions (race, gender, education, age, number of children). See Table 1 for a report on the preservation/quality item and on the demographics.
Sociodemographic Characteristics. a
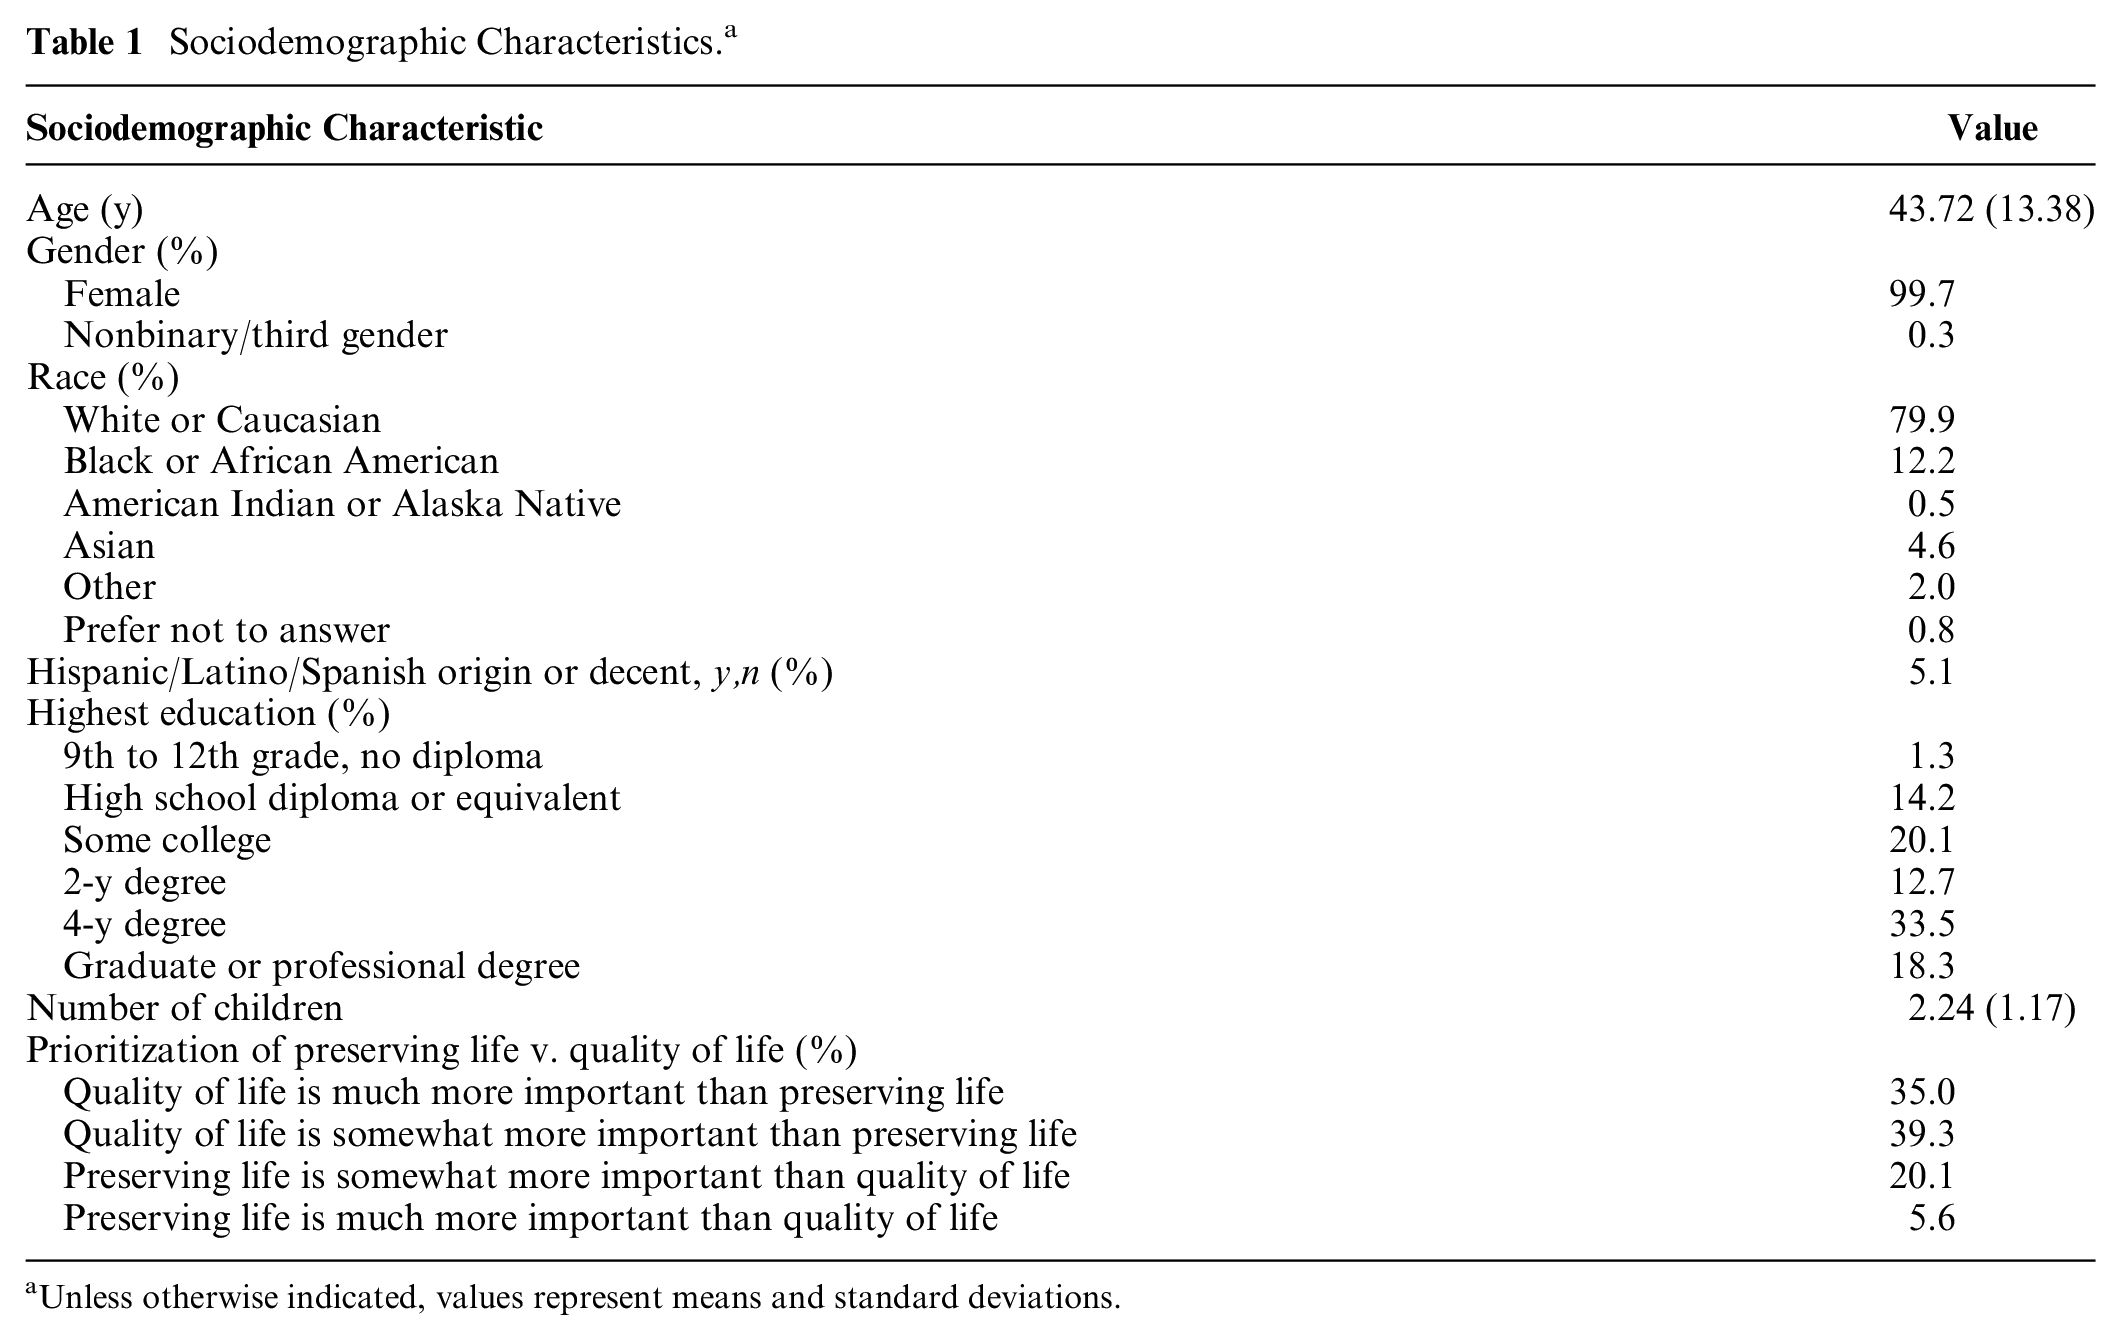
Unless otherwise indicated, values represent means and standard deviations.
Analysis Plan
As preregistered, one-sample t tests and repeated-measures analysis of variance were used to assess the impact of survival rate and reflection type on gut-level beliefs and motivated bias. Chi-square tests were used to determine whether rates of choosing the intensive care treatment differed as a function of survival rate and reflection type. We also computed Pearson correlations to assess whether treatment decisions and gut-level beliefs were associated with various measures of optimism, as well as participants’ prioritization of preservation of life versus quality of life.
Results
Exclusion Criteria and Data Quality Checks
Consistent with our preregistration, we used the exclusion criteria and data quality checks as follows. A series of Qualtrics CAPTCHAs (see preregistration) barred 117 suspected bots from proceeding beyond the first screens of the survey. Of 511 potential participants who passed the CAPTCHAs, 91 failed at least 1 of the 3 recall questions on introductory screens; they were excluded from participation. Also, as preregistered, we excluded data from 20 participants who failed a consistency check at the end of the experiment (see Supplemental Materials Section A). Finally, 1 participant who passed the preregistered exclusion criteria only partially completed the survey and was therefore excluded from our analysis, resulting in a final sample size of 399. Table 1 contains a summary of the sample characteristics.
Accuracy of Reflection Responses
The first question after the icon array was a reflection question that was also the key manipulation of the intervention; it came in either a frequency format or probability format. If the intervention under investigation had any chance of quelling overoptimism on subsequent measures, participants’ responses to these reflection questions needed to be relatively accurate. Correct rates were reported by 99.0% of participants in the frequency condition and 92.0% of participants in the probability condition. Although this difference in reflection accuracy was statistically significant, χ2(1) = 11.33, P = 0.001, both accuracy rates are quite high, leaving good potential for the intervention to buffer against motivated reasoning on the subsequently encountered gut-level measure. v
Gut-Level Optimism
As a preliminary prediction, we expected that in the condition without the probability-format intervention, we would observe the same overoptimism on the gut-level measure that McDonnell et al. 15 observed. Indeed, in our frequency condition, gut-level estimates reflected elevated levels of optimism. When participants had learned that the rate of survival with intensive care was 15-in-100, their average gut-level estimate about their own baby’s chances was at the 41.17% point, which is approaching the midpoint of the scale and is significantly greater than the 15% benchmark, t(100) = 9.73, P < 0.001, d = 0.97, 95% confidence interval [CI] [0.73; 1.20]. When participants had learned that the rate of survival with intensive care was 45-in-100, their average gut-level estimate about their own baby’s chances fell at the 55.92% point, which is significantly greater than both the 45% benchmark, t(97) = 4.74, P < 0.001, d = 0.48, 95% CI [0.27; 0.69] and the midpoint of the scale, t(100) = 2.57, P = 0.012, d = 0.26, 95% CI [0.06; 0.46].
For our key prediction about the impact of the intervention, we expected participants to exhibit less gut-level (over)optimism in the condition that included the intervention. To test this, we submitted participants’ gut-level responses to a 2 (survival rate: 15-in-100 vs. 45-in-100) × 2 (reflection format: frequency v. probability) between-subjects analysis of variance. Figure 3 displays the main pattern of the results. Participants’ gut-level beliefs regarding their infant’s chance of survival with intensive care were higher when the stated survival rate was 45% (
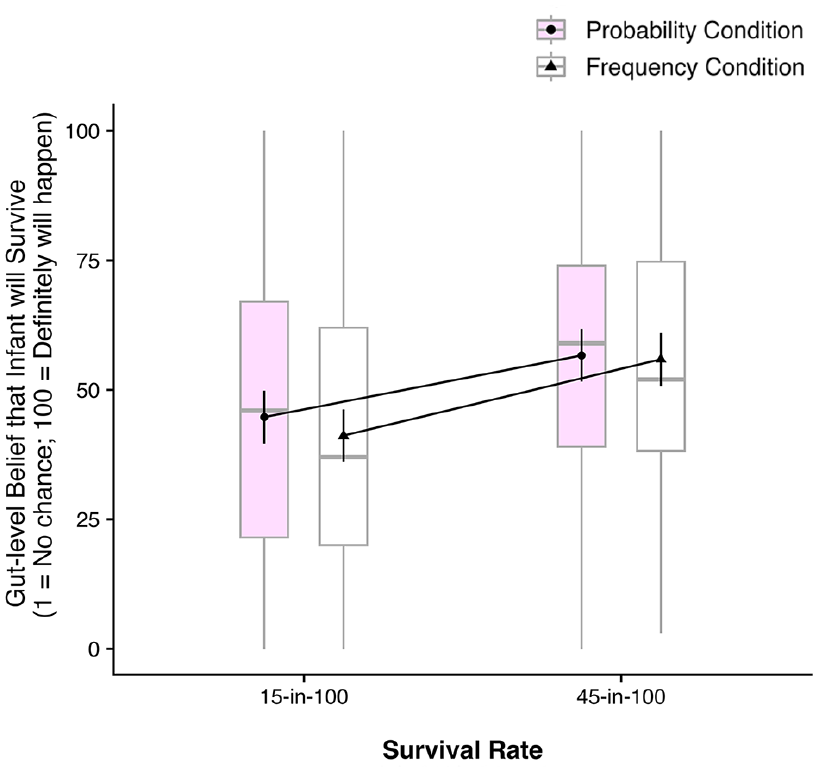
Participants’ gut-level beliefs about the survival chances (15-in-100 v. 45-in-100) of their infant in the frequency and probability conditions (N = 399). The gray horizontal lines indicate median values, boxes represent the interquartile range, vertical gray lines denote the range of adjacent values. Error bars represent 95% confidence intervals.
To rule out the possibility that the high level of optimism detected on the gut-level belief scales merely reflected a superficial scaling issue (e.g., participants did not directly map the 15%/45% survival probabilities onto the 15/45-point marks of the gut-belief scale, falsely leading us to conclude that they were overly optimistic), we also directly compared participants’ gut-level beliefs regarding their infant’s chance of survival against their baseline gut-level beliefs in a nonmotivated context (likelihood of drawing a marble from an urn). As shown in Figure 4, across reflection conditions, participants’ average gut-level beliefs about their infant’s chance of survival (
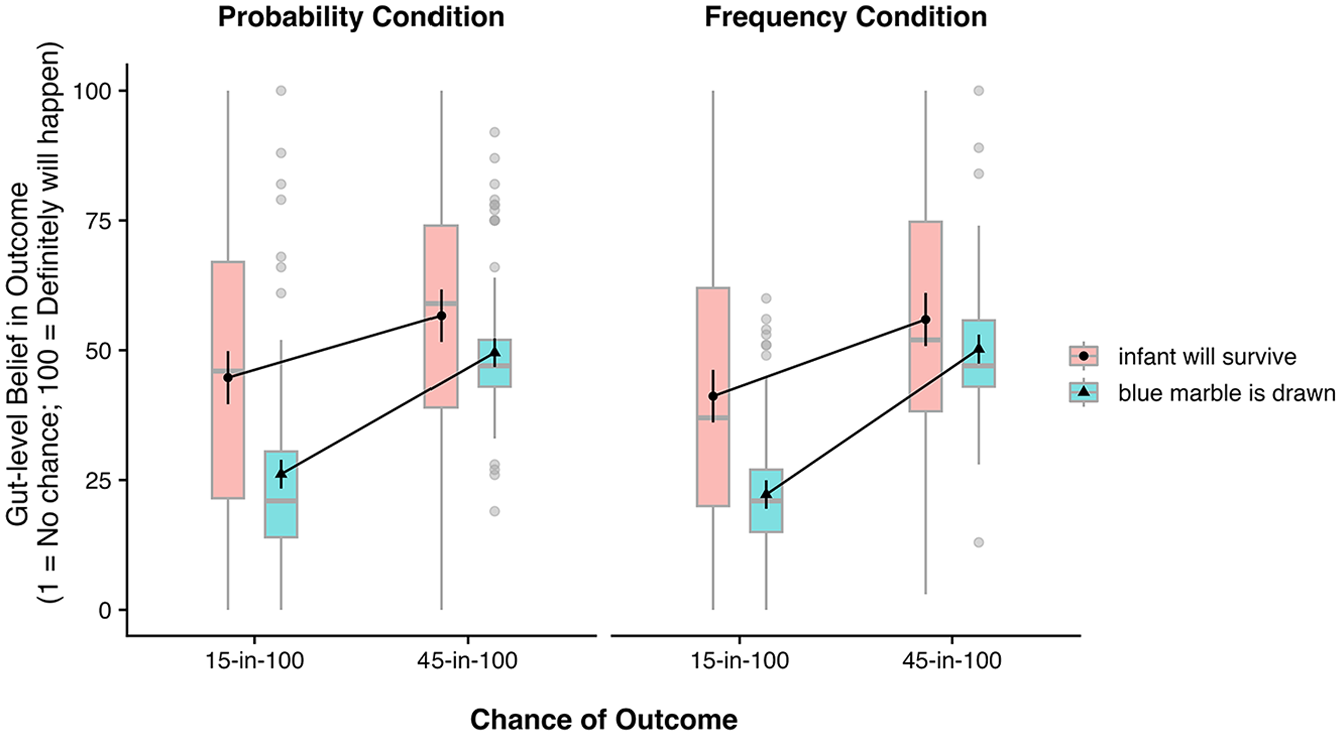
Participants’ gut-level beliefs about the survival chances (15-in-100 v. 45-in-100) of their infant compared against their gut-level beliefs about similar probabilities in a nonmotivated context—plotted separately for the probability condition (N = 200) and frequency condition (N = 199). Gray horizontal lines indicate median values; boxes represent the interquartile range; vertical gray lines denote the range of adjacent values; individual data points signify outliers. Error bars represent 95% confidence intervals.
Treatment Decisions
Most participants (65.7%) chose intensive care for their hypothetical child. Similar to McDonnell et al., 15 the manipulation of the infant survival rate did not significantly affect treatment choice, χ2(1) = 0.02, P = 0.89. Whether participants were assigned to the probability or frequency condition did not significantly affect treatment choices either, χ2(1) = 0.60, P = 0.44.
Although treatment decisions were not significantly influenced by the manipulated survival rates, we did find that they were strongly associated with participants’ gut-level beliefs of their baby’s chance of survival under intensive care, r = 0.579, P < 0.001; participants who reported higher gut-level beliefs were more likely to choose intensive care. In addition, whether participants valued preserving life over quality of life was also positively associated with choosing intensive care, r = 0.544, P < 0.001.
More on Optimism and Its Correlates
We included various additional measures to better understand the optimism reported by participants. But first, it is important to say a bit more about the above-mentioned correlation between gut-level beliefs and treatment decisions (r = 0.579). This relationship confirms that gut-level estimates, despite being recorded on a vague scale, capture important variability in how people think or feel about the optimism/pessimism of a given situation. To express the correlation in different terms, participants whose gut-level estimates were above the median were 91.0% likely to choose intensive care; otherwise, they were 41.0% likely. In this study, the gut-level estimates were solicited before people committed to a treatment decision, so the correlation does not seem attributable to a postdecision justification.
To gain further insights into why gut-level beliefs were optimistically biased, we examined participants’ responses to our other measures. Of the participants, 48.6% indicated that they would be more optimistic than the doctor regarding their infant’s chances of survival, while 39.6% said they would have the same level of optimism and 11.8% said they would have less optimism than the doctor. Participants’ level of optimism in relation to the doctor’s estimate was also positively associated with choosing intensive care, r = 0.598, P < 0.001. Similarly, participants also had a slight tendency to prescribe overoptimism for other parents (
Discussion
Although icon arrays are effective at improving some forms of risk communication and comprehension, recent work found that they were not effective in mitigating high levels of optimism in a motivationally charged situation. 15 Here, we tested whether icon arrays about survival rates could be particularly poor at mitigating the impact of motivational biases because they present rates as frequencies, which refer to other people (X in 100), and thereby allow leeway for the motivated discounting of the information. In our study, participants held very optimistic gut-level beliefs about their baby’s chance of survival with intensive care after viewing relevant survival rates via icon arrays. Crucially, levels of overoptimism were not significantly reduced when participants had first been asked to translate the frequency information from the icon array into their own infant’s survival probability. The null effect of our intervention suggests that the frequency format of icon arrays is not a primary reason why icon arrays do not buffer against motivated reasoning. viii
A novelty of the present study was that we elicited participants’ gut-level beliefs immediately after the icon array information and before any decision measures, rather than as a secondary measure at a later stage. 15 The fact that gut-level beliefs were higher than objectively warranted even with this ordering of the measures rules out potential concerns that gut-level beliefs are optimistically biased only when elicited after treatment decisions because people adjust their gut-level beliefs to justify their previous treatment decisions.
Our findings also ruled out the possibility that high gut-level beliefs—as measured by a 100-point slider scale—merely reflect a superficial scaling issue, not high optimism. Participants’ baseline gut-level responses about 15%/45% probabilities in a nonmotivated context were significantly lower than their gut-level responses about the 15%/45% survival chances of their infant, indicating that the gut-level measure is indeed picking up on meaningful motivated reasoning processes and not just capturing an oddity in how people map likelihood beliefs onto gut-level scales.
Via a series of exploratory measures, we looked at some of the potential mechanisms behind optimistically biased gut-level beliefs and treatment choices. One possibility could have been that optimistically biased beliefs occur because people tend to think that doctors or medical professionals give pessimistic likelihood estimates. However, while a noteworthy proportion of participants indeed thought that doctors tended to be pessimistic, opinions about doctors’ levels of optimism/pessimism were not significantly associated with gut-level beliefs, suggesting that misconceptions about doctors’ estimation tendencies are not a primary driver of optimistically biased beliefs. Another measure also revealed that participants were generally aware of their optimistic beliefs. The relative majority of participants reported that they would be more optimistic than what the icon array’s numbers suggested.
The results of the present work provide another example of personal risk perceptions being resistant to debiasing interventions. 46 Prior work suggests that people discount sobering risk information as not applying to themselves,8–13 and here, participants did the same regarding risk information applicable to their hypothetical baby (see also McDonnell et al., 15 Nayak et al. 17 ). Notably, they did this even after accurately reporting on what the icon array meant for their own baby’s low percentage chance of survival. This is in line with other work showing that, even when providing risk information leads to accurate recall of that information, it does not necessarily result in full acceptance of the risk information. 47
The present findings, like those of Fowler et al., 47 highlight the benefits of including measures of risk-related beliefs/perceptions that go beyond those that are closely tied to recall or comprehension, especially when motivated reasoning might be influential (see also Weinfurt et al. 11 ). There are many different ways of soliciting risk-related beliefs/perceptions,48–51 and our choice was a gut-level measure that did not involve numeric anchors. When assessing optimism and related constructs, choice of measure matters52,53—and measures that invoke deliberative estimates of likelihood (e.g., 100-point probability scale) often detect smaller biases than do measures that invoke more intuitive gut-level estimates.40,41 We do not believe that gut-level, nonnumeric measures are the only type that can be used to detect effects of motivated reasoning, but they are certainly relevant. Notably, unlike the objective-stated survival rate, which did not have an effect on treatment decisions, optimistically biased gut-level beliefs were strongly correlated with subsequent treatment decisions (r = 0.579). This suggests that gut-level interpretations of risk information likely play a role in the treatment decision process and adds to the existing literature showing that decisions and health behaviors are often predicted by intuitive and nonnumeric measures of perceived risk.49–51,54,55
Limitations and Future Research
One limitation of the present study was that it was conducted online and was restricted to female participants in the United States. More research is needed to determine whether these findings generalize beyond female participants as well as to populations outside of the United States. A particularly interesting area for future study could be to test whether the impact of motivated reasoning on treatment decisions and gut-level beliefs is different when the decision-making process is shared between both parents (as is often the case).
Another limitation was that the potential for lifelong disabilities among surviving infants was mentioned only in a cursory way to participants in this study. Details about rates and types of disabilities can be influential in parental decision making, and additional research could examine the role of that information and how that information is processed and interpreted.
Also, some interpretational ambiguities remain about the full set of reasons for the current results. It is possible that the process of converting to a probability estimate was a bit taxing or aversive. 56 Although it would seem as though any aversiveness of the simple conversion would pale in comparison to the threat of the life-or-death stakes represented by the scenario, it is possible that the aversiveness might have had some impact on subsequent judgments. A related issue is that our intervention manipulation was a compound manipulation: the frequency question asked about a group of cases whereas the probability question asked about just the person’s baby. This was in keeping with how the broader literature addresses the frequency-probability distinction—frequencies, which are about multiple events, are compared with single-event probabilities. 28 Nonetheless, the use of a compound manipulation means that we were not able to separately assess the impact of the 2 factors on participants’ gut-level beliefs. This somewhat limits our ability to determine exactly why the intervention failed to reduce motivated reasoning and precludes us from drawing direct conclusions about whether people perceived frequencies as more impersonal/offering greater leeway in the interpretation than probabilities. Future work should more directly examine the extent to which people view frequencies versus probabilities as self-applicable.
A final limitation is the hypothetical nature of our design. Of course, asking participants to imagine a scenario in which their infant is born extremely preterm cannot fully mirror the nuances of actual palliative treatment decisions—and online participants are likely less engaged than parents in an equivalent real-world context. With that said, participants’ response patterns were highly coherent (see section A in the Supplemental Materials for coherence-based attention check) and generally consistent with prior findings in the literature.15,17,18 Moreover, our manipulation of survival rate, which was a key component of the experimental design, made using a hypothetical scenario the only ethically viable option.
Conclusion
We tested whether icon arrays’ inability to buffer people’s perceptions of likelihood against motivational influences is due to their frequency format. We found that an intervention, which asked participants to link frequency information from an icon array to their own personal case in probabilistic terms, did not reduce the degree to which people’s gut-level beliefs were optimistically biased. Moreover, we found that these optimistically biased gut-level beliefs, rather than the objective survival rate information conveyed through the icon arrays, were indicative of treatment choices. These findings highlight the need for developing new ways to present likelihood information in a manner that protects against motivated reasoning processes, and they also support the utility of measuring gut-level beliefs in health-related decision contexts.
Supplemental Material
sj-docx-1-mdm-10.1177_0272989X251332315 – Supplemental material for Motivated Interpretations of Survival Rates in Icon Arrays: An Issue of Frequency Format?
Supplemental material, sj-docx-1-mdm-10.1177_0272989X251332315 for Motivated Interpretations of Survival Rates in Icon Arrays: An Issue of Frequency Format? by Jeremy D. Strueder, Inkyung Park, Siobhan M. McDonnell, Mir A. Basir and Paul D. Windschitl in Medical Decision Making
Footnotes
Acknowledgements
There are no acknowledgments.
The authors declared no potential conflicts of interest with respect to the research, authorship, and/or publication of this article. The authors disclosed receipt of the following financial support for the research, authorship, and/or publication of this article: This work was supported by grant SES-1851738 from the National Science Foundation. The funding agreement ensured the authors’ independence in designing the study, interpreting the data, writing, and publishing the report. All work was completed at the Psychological and Brain Sciences Department, University of Iowa, Iowa City, IA.
Ethical Considerations
This study was approved by the University of Iowa Institutional Review Board (IRB: 202101247).
Consent to Participate
All participants provided informed consent.
Patient Consent
No identifying information was recorded.
Consent for Publication
Not applicable.
Data Availability
The preregistration, study materials, data, and analysis code are available online.
Notes
References
Supplementary Material
Please find the following supplemental material available below.
For Open Access articles published under a Creative Commons License, all supplemental material carries the same license as the article it is associated with.
For non-Open Access articles published, all supplemental material carries a non-exclusive license, and permission requests for re-use of supplemental material or any part of supplemental material shall be sent directly to the copyright owner as specified in the copyright notice associated with the article.