
Abstract
Subnational U.S. governments retain the primary responsibility of constructing and preserving the public infrastructure that connects communities and businesses, enhances public service delivery, and promotes economic development in their jurisdiction. Drawing from punctuated equilibrium and social vulnerability theories for context, the present study investigates the determinants of state infrastructure spending, specifically roads and highways and transit systems. It utilizes balanced panel data on 50 U.S. states over 17 time periods and fixed-effects regressions with year dummies in its investigation. Evidence shows that state infrastructure spending is influenced by disaster events as well as social vulnerability factors. However, the effects of disasters and social vulnerability factors on state infrastructure spending depend on the infrastructure categories, suggesting that the determinants are more nuanced than extant studies indicate.
Keywords
Introduction
Subnational U.S. governments retain the primary responsibility of constructing and preserving the public infrastructure that connects communities and businesses, enhances public service delivery, and promotes economic development in their jurisdiction (Chen, 2018; Chen et al., 2019; Helmsing, 2003; Hooper et al., 2021). Although public infrastructure, such as roads and highways and transit systems, has positive effects on communities, their development could be hampered by environmental hazards such as natural disasters (Oh & Hastak, 2008; Unterberger, 2018). Social vulnerability factors, such as socioeconomic and sociodemographic factors, limit their development as well (Bates & Santerre, 2015; Chen et al., 2019; Fisher & Wassmer, 2015).
Whereas scholars have investigated the determinants of infrastructure spending, these studies are limited to determinants of aggregate spending on infrastructure, with few studies disaggregating infrastructure expenditure into two or three components (see, e.g., Buchheim & Fretz, 2020; Chen et al., 2019). For instance, Chen et al. (2019) focus on two specific types of capital investment: city roads and water utilities in 100 American cities from 1988 to 2012 to investigate the effects of economic conditions, citizens’ political orientation, and institutional elements on capital investment, and find that infrastructure spending is constrained by a city's fiscal institutions and revenue-generating capacity. Another study by Buchheim and Fretz (2020) investigates the effect of parties on state-specific infrastructure spending—transportation, education, and social services infrastructure—and finds that divided governments are likely to increase infrastructure spending for political compromise compared to governments under Democratic or Republican control.
An equally important omission in the literature is that existing studies focus on only one theory, although a synthesis of theories would better explain the multiple factors that influence infrastructure development (Besley et al., 2010; Guild, 2000). Current knowledge is, therefore, limited, and the gap in knowledge needs to be addressed. The 50 U.S. states report differential jurisdictional vulnerabilities and environmental hazards that impact them (Agranoff & McGuire, 2001; Nukpezah & Soujaa, 2018). A comprehensive study of state infrastructure spending needs to consider these factors collectively.
The present study draws from punctuated equilibrium theory (Boushey, 2012; Jones & Baumgartner, 2012; Tilcsik & Marquis, 2013; Unterberger, 2018) and social vulnerability theory (Ablah et al., 2009; Ahmadu & Nukpezah, 2022; Ahmadu et al., 2023; Cutter et al., 2003; Mallick et al., 2011) for theoretical context. It contends that high-impact natural disasters, such as earthquakes, floods, tornadoes, hurricanes, and winter storms that merit presidential disaster declarations, are punctuating events in an otherwise stable society. It further asserts that social vulnerability is endogenous and refers to the presence of socioeconomic and sociodemographic factors that affect the resilience of communities and constrain access to needed resources (Cutter et al., 2003; Nukpezah, 2020).
The study investigates these theories on state spending on public infrastructure. In particular, roads and highways and transit systems are of interest because they are the two most important infrastructure expenditure items and contribute to improving interstate commerce as well as economic growth and development (Kilanko, 2021; Zhang & Batjargal, 2022). More recently, these two infrastructure sectors have been the recipients of significant funding under Biden's Infrastructure Investment and Job Act (IIJA), making them important for study with the possibility of offering policy directions on the implementation of IIJA. Moreover, the U.S. states provide sufficient variations in environmental hazards and social vulnerability and, therefore, are likely to invest differently in infrastructure development, which is desirable for the study.
The overall research question is: what are the effects of disasters and social vulnerability factors on state infrastructure spending? More specifically, we are interested in understanding how disasters and social vulnerability factors affect state government spending on (1) total state infrastructure, (2) roads and highways, and (3) transit systems. The study utilizes balanced panel data from 50 U.S. states from 2000 to 2017 and fixed-effects regressions with year dummies to investigate the research question. The study finds evidence that changes in state infrastructure spending are influenced by disaster events and social vulnerability at the state level. However, disasters affect road and highway spending but not transit systems, which are more likely to be influenced by favorable economic conditions in the state. Fiscal and economic conditions, such as favorable median household income and sales tax revenue, influence higher infrastructure expenditure and highways and roads spending. However, the effects of state poverty levels are mixed, suggesting complexity in state infrastructure policy decisions.
The study has important policy and managerial implications and contributes to improving infrastructure planning and resilience scholarship. First, drawing from multiple theoretical perspectives in studying disasters as punctuation and social vulnerability as determinants of infrastructure spending is valuable and enlightens scholars and policymakers on the factors that affect aggregate and categories of state infrastructure spending to improve capital planning. Second, it validates the importance of strengthening state fiscal policies to improve public infrastructure investments. The recent enactment of the $1.2 trillion IIJA policy, which provides substantial funding for infrastructure rehabilitation, demonstrates the government's recognition of how endogenous and exogenous factors can impact infrastructure. As a result, prioritizing the enhancement and resilience of critical infrastructure must be of utmost importance for both state and federal authorities. Third, it contributes to scholarship on the government's role in the provision of public infrastructure, which is a vital public good that promotes economic development and regional competitiveness.
Public Infrastructure Spending
Public infrastructure is a fundamental and publicly subsidized capital good provided by the government to serve the general welfare of residents, support economic growth, and contribute to social well-being (Stupak, 2017). About 90% of nondefense capital assets are state-owned; states spend 85% of their budgets on the construction and maintenance of public infrastructure (Stupak, 2017). The 2018 Congressional Budget Report indicates that federal and subnational government investments in infrastructure totaled $440 billion in 2017, with about 75% of the funds ($324 billion) emanating from state and local governments (CBO, 2018). As direct service providers to communities, subnational governments shoulder most of the financial burden associated with public infrastructure spending.
The most important infrastructure expenditure items are roads and highways and transit systems, respectively (Urban Institute, 2022). These together comprise 60% of all state infrastructure spending (Urban Institute, 2022). Because state infrastructure spending may be capital-intensive and benefit many users, it necessitates cost-sharing with the federal government (Flyvbjerg, 2014). However, financial constraints and less predictable funding from the federal government may affect investment decisions, forcing subnational entities to postpone or cut back on capital spending (Chen, 2016).
The recently passed IIJA by the U.S. Congress and signed into law by President Biden stands as the largest federal government initiative on infrastructure development, which is estimated at $1.2 trillion (The White House, 2021). The IIJA will fund the rehabilitation and reconstruction of public works projects, including a specific allocation of $110 billion for highway programs over 5 years and billions of dollars for improving the U.S. transit systems (Goodsell, 2023; Zhang & Batjargal, 2022). While public work projects under Roosevelt, Eisenhower, and Clinton emphasized traditional and technological infrastructure developments in areas such as transportation, agriculture, and broadband, the infrastructure initiatives undertaken by Obama and Trump faced limited progress. With the IIJA, the Biden administration has the opportunity to overhaul the U.S. public infrastructure.
The passage of the IIJA comes at a time when the American Society of Civil Engineers (2021) has classified U.S. roads and highways infrastructure as “poor” with an assigned grade of D and estimated that about $125 billion would be needed to address the deteriorating road conditions. Furthermore, a comparative study among developed nations found that the U.S. investment in capital infrastructure lags those of other countries (Nyikos & Ermasova, 2022). Because political support for capital infrastructure investment is crucial in the U.S. (Nyikos & Ermasova, 2022), the bipartisan support of the bill is laudable as it tackles the problem of poor infrastructure conditions.
Improvements in deteriorated infrastructure will strengthen supply chains, enhance U.S. global competitiveness, foster economic mobility and community resilience against environmental disasters, and contribute to sustainable economic development (Zhang & Batjargal, 2022). The IIJA would also enable increased direct federal intervention in state affairs to upgrade their infrastructure and support the development of rural communities (Zhang & Batjargal, 2022) and therefore strengthen U.S. federalism. Furthermore, the Act also contributes directly to investments in human infrastructure to improve labor force participation (Kilanko, 2021).
Of course, there are concerns about the possible effects of the huge appropriation for IIJA on the U.S. debt burden. Opponents of the Act argue that it will lead to a substantial increase in the public deficit in the future and may not provide sufficient resources to address the infrastructure needs of the U.S. (Zhang & Batjargal, 2022). However, proponents assert that the funding sources for the Infrastructure Act will come from a combination of sources, including additional deficits, user fees, and other tax provisions; hence, the budget deficits will only increase on a static basis (Huntley & Ricco, 2021). Moreover, the long-term benefits to the U.S. economy more than justify such an investment.
Roads and Highways
Roads and highways facilitate resident mobility, productivity, competitiveness, and public service delivery (Flyvbjerg, 2014). Highways are the largest public capital outlay for state governments, with funding from taxes partially related to highway use, including gas taxes, motor vehicle taxes, and other fees, which vary across states (Urban Institute, 2022). Legislative actions such as the Federal-Aid Highway Act of 1956, which increased aid distribution for highway projects, influenced federal support for state highway construction and maintenance (Nguyen-Hoang & Duncombe, 2012). The Federal-Aid Highway Program and Trust Fund are disbursed to states through a series of formulae, including lump sum amounts to address infrastructure needs (CRS, 2021). State and local governments utilize 50–80% of federal highway grants to improve highway interstate systems. Federal transfers for major transportation projects are likely to increase with the passage of the Bipartisan Infrastructure Law, which makes the largest investment since the construction of the interstate highway system to increase resilience, public safety, and equity for all users (The White House, 2021).
State highway spending differs across jurisdictions due to several factors (Chen, 2016; Chen, 2018; Walden & Eryuruk, 2012). Research shows that the political ideology of both the state and the governor influences highway spending decisions (Walden & Eryuruk, 2012). States governed by the liberal party tend to have a strong proclivity toward significant government involvement in public affairs to advance social welfare programs (Grossman, 1994). However, states may allocate less funding for capital development, such as education and highways, due to the party's association with the less affluent (Witko & Newmark, 2010). States governed by both Republican governors and Republican legislative majorities tend to allocate less funding toward highways compared to states with different political compositions (Bruce et al., 2007). Also, elected political leaders, such as the governor, and appointed members of the Transportation Board may allocate more funds to specific infrastructure types and jurisdictions as a means of rewarding the governor's supporters (Walden & Eryuruk, 2012).
Other studies highlight the importance of federal transfers to the rise in state spending on roads and highways (Bruce et al., 2007; Gamkhar, 2003; Nesbit & Kreft, 2009). Moreover, studies show that specific government programs, such as the American Recovery and Reinvestment Act (ARRA) in response to the Great Recession, led to increases in state highway spending (Fisher & Wassmer, 2015; Leduc & Wilson, 2012). Fisher and Wassmer (2015) observed that the federal stimulus program resulted in a surge in state highway spending during the recession period (2008–2009). However, following the recession, state highway investment stabilized and maintained consistent levels from year to year.
Furthermore, studies find that the existing quality of roads influences government allocation, where areas with higher levels of road deterioration likely receive heightened highway investment activities (Fisher & Wassmer, 2015). Furthermore, higher levels of urbanization (Chen, 2016) and favorable employment rates (Walden & Eryuruk, 2012) increase demand for highways.
It is also worth noting that exogenous and endogenous economic conditions and resource availability have significant impacts on government capital investment decisions (Chen, 2016; Ho, 2008). States tend to reduce the growth of state highway spending during economic downturns but increase expenditures when economic conditions are favorable (Ho, 2008). Additionally, governments often adopt cutback strategies in response to fiscal stress, deferring capital project construction and reducing regular maintenance spending (Chen, 2016). Conversely, affluent states tend to allocate less economic resources toward highway construction (Chen, 2016), which may suggest that these states typically possess well-established highway systems, resulting in a reduced motivation to make additional capital investments in these areas. Furthermore, states may free-ride on the infrastructure investments of competitor states instead of making their own investments by taking advantage of the positive spillover effects without incurring the associated costs and engaging in a race-to-the-top competition (Bruce et al., 2007).
Transit Systems
Transit systems constitute the second largest group of transportation infrastructure expenditures in the United States (ASCE, 2021). Transit systems constitute bus networks, paratransit services that connect urban and rural communities, and railway systems (Zhang et al., 2018). Mass transit systems benefit large users across the United States, especially in populous metropolitan areas such as New York, Atlanta, San Francisco, Boston, and Washington, D.C., among others (Zimmerman, 2005). Communities with more racial minorities report higher dependency on public transit systems compared to other racial groups, likely because of lower incomes, which preclude the ability to own and manage personal means of transportation. Consequently, investing in transit systems has the benefit of improving access to urban areas and essential services. Transit systems are characterized by ride sharing, are environmentally friendly, contribute to fuel efficiency, ease congestion, and contribute to sustainability.
State transit systems rely on revenues directly generated from fares, which fund about 36% of transit operating expenses; additional funding comes from state and local governments, constituting about 57% of transit expenditures in 2019 (ASCE, 2021). State transit agencies struggle with budget shortfalls and growing deficits, which are expected to exceed $270 billion in 2029 (ASCE, 2021). Failure to address budget shortfalls could lead to deterioration and poor service quality in the coming years.
Several studies have examined the effects of socioeconomic and sociodemographic factors on the supply and demand of transit services (Chakraborty & Mishra, 2013; Kuby et al., 2004; Sener et al., 2020; Spears et al., 2013). Chakraborty and Mishra (2013) focused on Maryland and found a relationship between the state's transit usage and socioeconomic and sociodemographic factors, such as urbanization, employment density, income, and transit accessibility. Similarly, Spears et al. (2013) surveyed respondents from Los Angeles, California, and discovered that various sociodemographic variables, including age, employment status, income, vehicle ownership, and ethnicity, significantly influenced the use of public transit. Furthermore, existing studies suggest that improved socioeconomic conditions and lifestyles reduce individual use of public transit (Perk et al., 2008). A cross-sectional analysis of transit use in 265 urbanized areas in the United States indicated that external factors that are beyond the control of the transit system, such as regional geography, metropolitan economy, and demographic characteristics including college education, recent immigrants, and Democratic voters, influenced transit supply and consumption (Taylor et al., 2009). Taylor et al. (2009) also found that internal factors, such as service frequency and fare levels, had an impact on public transit ridership.
Theoretical Framework
Figure 1 illustrates the theoretical framework for the study, which is derived from punctuated equilibrium and social vulnerability theories to propose testable assertions. The following sections present arguments for how these theories offer explanations for state infrastructure spending.
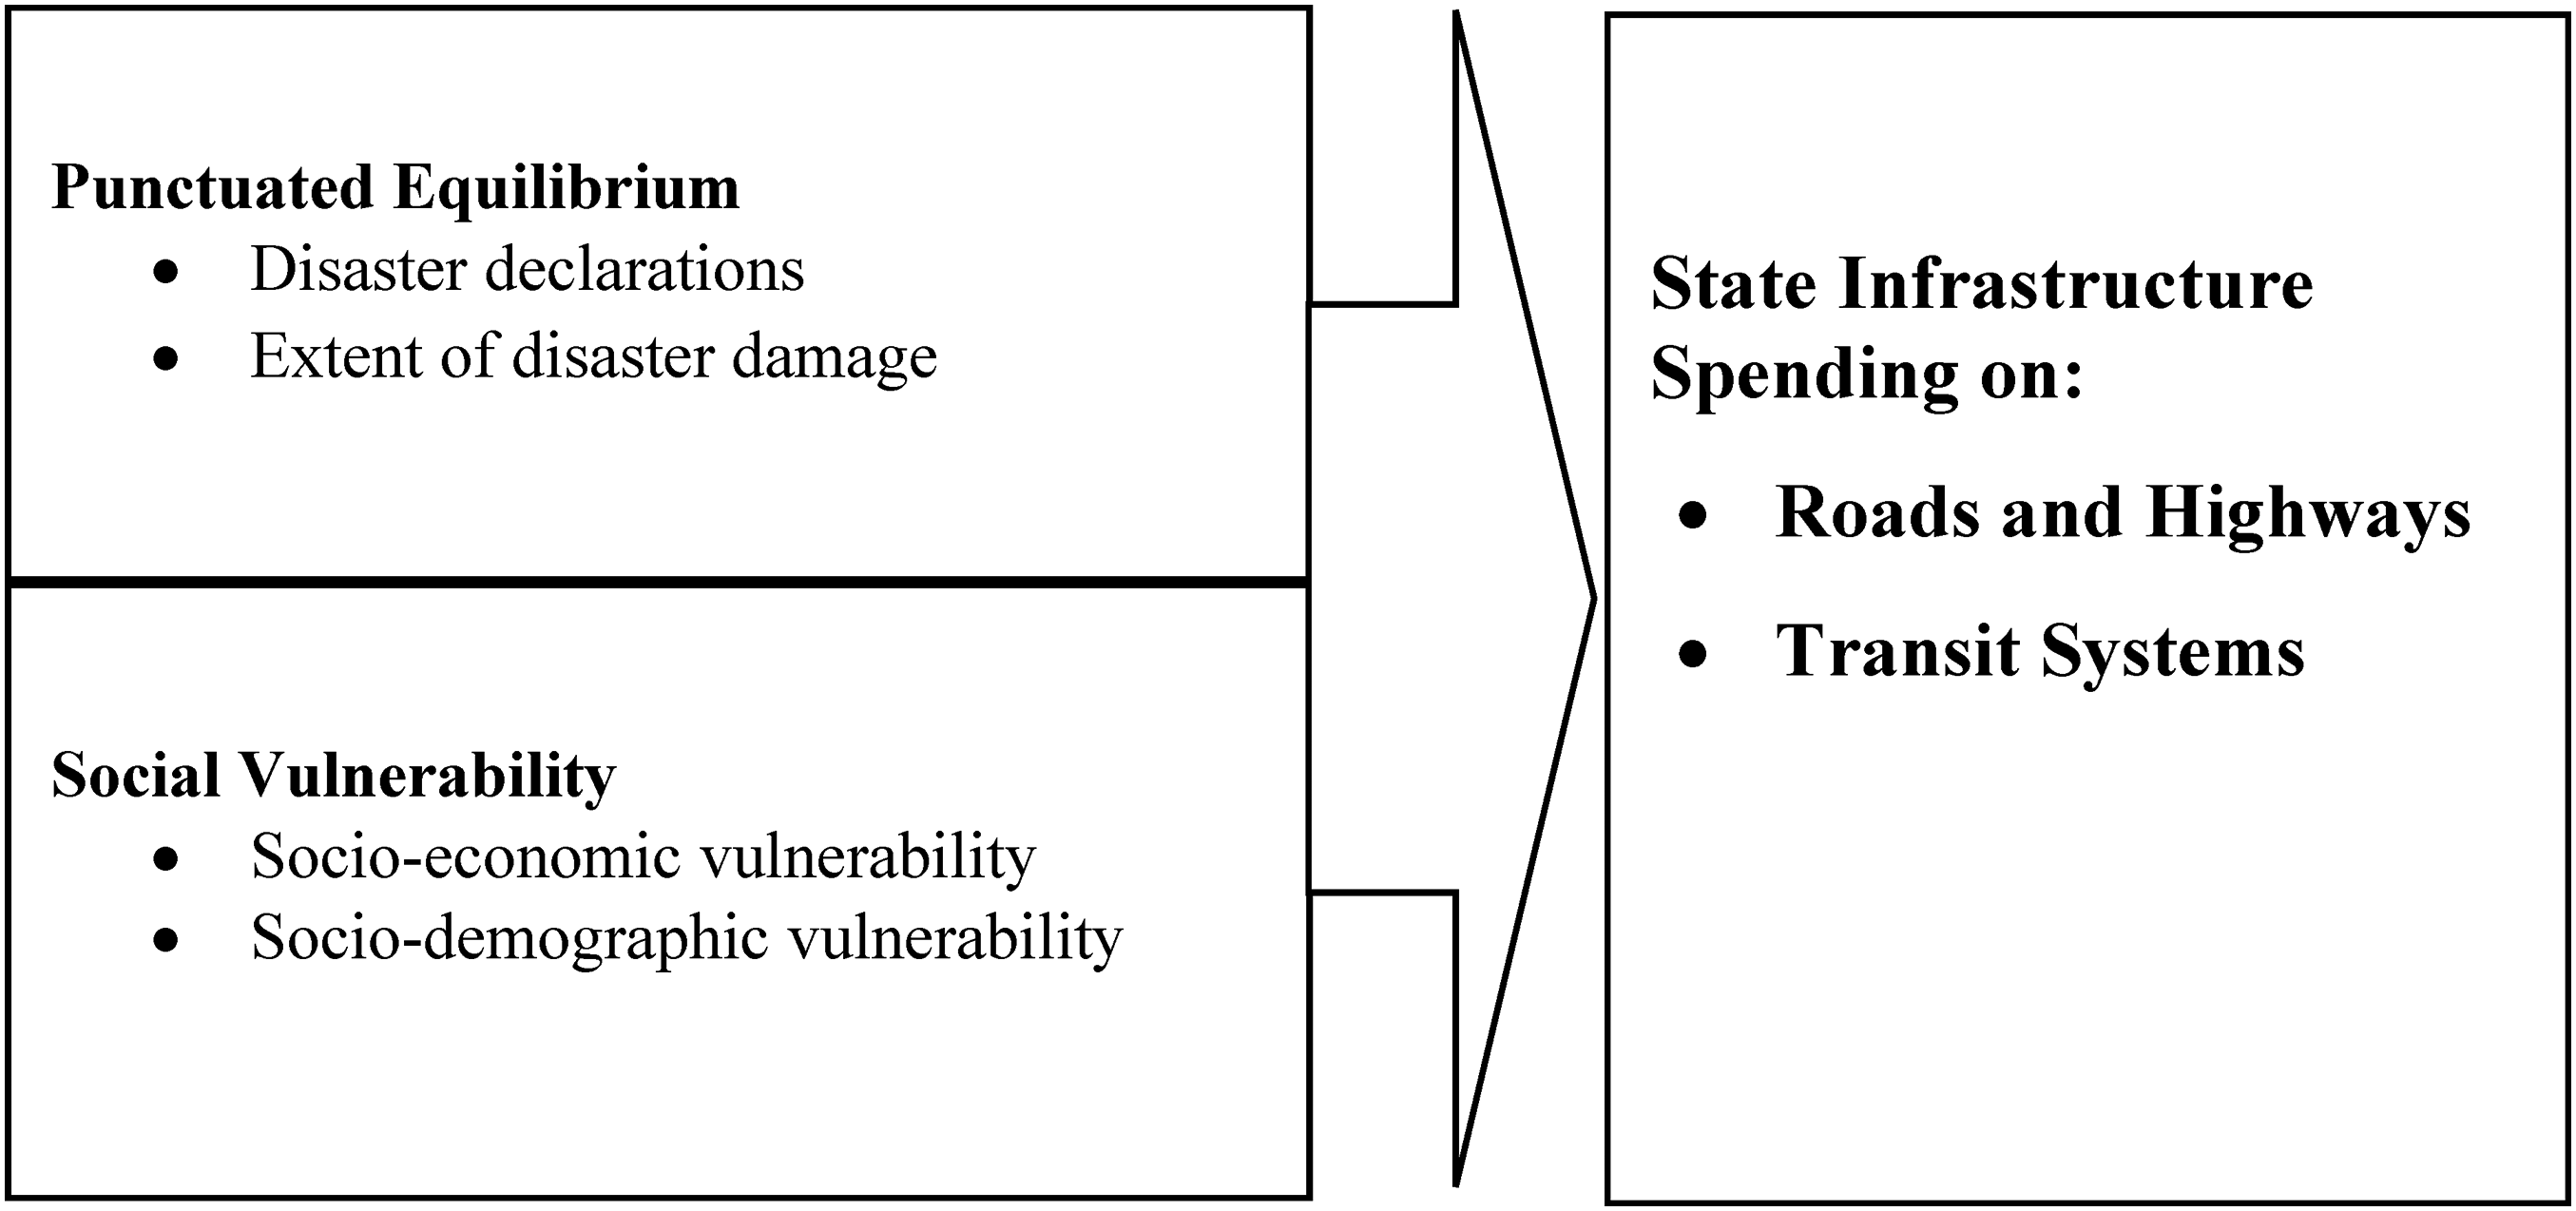
Determinants of state infrastructure spending.
Disasters as Punctuations in the Equilibrium
Disaster Declarations
The punctuated equilibrium theory posits that systems are characterized by periods of stability and continuity; however, periods of disruptions or crises (punctuations), which may be short or intense, cause rapid changes before eventually returning to a new equilibrium (Boushey, 2012; Jones & Baumgartner, 2012). During periods of equilibrium, policymaking is incremental, with future decisions only a slight variation of the present (Lindblom, 1959). The changes do not affect the status quo since they are only necessary to maintain the system's effective functioning (Gersick, 1991; Nukpezah, 2021). For example, government budgets are variations of past appropriations with only marginal increases to account for inflation and other minor policy changes. However, punctuations in the equilibrium result in policy changes and innovations beyond maintaining the status quo—creating a more resilient and novel system (Gersick, 1991; Nukpezah, 2021).
Natural disasters are punctuations in an otherwise equilibrium society that cause undesirable consequences, such as deaths, injuries, and disruption to businesses, infrastructure, social activities, and government budget streams (Miao et al., 2018; Tilcsik & Marquis, 2013; Unterberger, 2018). Disasters destroy critical infrastructure vital for supporting social and economic activities (Picou & Martin, 2006; Unterberger, 2018; Yeo et al., 2018). Roads and highways and transit systems that facilitate the movement of people and commercial goods may be destroyed, exerting a heavy financial burden on governments and communities. Disasters also burden government budgets since public facilities must be restored quickly after such events (Unterberger, 2018).
Disaster events capture the attention of policymakers and potentially trigger changes in spending priorities beyond maintaining the status quo. Reconstruction activities may focus on strengthening infrastructure designs to better prepare communities for future disaster incidences. Disasters trigger policy changes to make communities safer by investing in resilient infrastructure. A presidential disaster declaration suggests a disaster is a significant catastrophic event beyond subnational response and recovery capability and requires federal intervention (FEMA, 2021). Presidential disaster declarations are infrequent exogenous events that trigger policy responses to create stable organizations and should be associated with increased infrastructure spending.
The Extent of Disaster Damage
Disaster events vary in magnitude and can be assessed by the extent of their damage (Ahmadu et al., 2023). Disaster events measured in terms of property damage and agricultural losses adversely impact local consumption and economic activities, which lead to a slump in revenue generation (Ahmadu & Nukpezah, 2022; Xie et al., 2014). For example, the total damage to critical infrastructure and private properties during Hurricane Katrina is estimated at $96 billion (Oh & Hastak, 2008). Similarly, the 2016 Louisiana flood that damaged nearly 60,000 homes was estimated to range between $10 and $15 billion (Yeo et al., 2018). The damage caused by Hurricane Frederic to infrastructure in Alabama was worth more than $1.6 billion (Chang, 1984). Disaster damage to infrastructure may force businesses to shut down (Chang & Chamberlin, 2003).
Although disasters can adversely affect government revenues from sales, property, and income taxes, the need to build a more resilient society is paramount. The magnitude of crises necessitates government intervention to rehabilitate facilities and restore services in the built environment, even if governments must divert resources or abandon planned projects in favor of infrastructure development (Benson & Clay, 2004). Moreover, studies suggest disaster events as triggers for opportunities for modernization (Bănică et al., 2020; Benson & Clay, 2004). Therefore, the present study posits that disasters alter government spending patterns and priorities and increase state infrastructure spending.
Social Vulnerability Theory
Social vulnerability conveys the idea that the presence (or absence) of specific risk factors influences the susceptibility of groups and communities to harm and decreases access to resources (Ahmadu & Nukpezah, 2022; Ahmadu et al., 2023; Cutter et al., 2003; Mallick et al., 2011). Socioeconomic and sociodemographic factors such as educational attainment, unemployment, poverty, and income contribute to social vulnerability (Ablah et al., 2009; Cutter et al., 2003). The theoretical assumption of social vulnerability is that jurisdictions that report higher levels of social vulnerability due to the presence of risk factors are less likely to benefit from collective resources, while jurisdictions that report fewer vulnerability factors have a better chance of gaining access to resources (Ahmadu & Nukpezah, 2022; Ahmadu et al., 2023; Cutter et al., 2003; Nukpezah, 2020).
Socioeconomic Indicators
Socioeconomic vulnerability concerns the lack of capacity to have sufficient income or make expense adjustments due to unfavorable economic conditions (Arunachalam et al., 2017). Because states do not develop uniformly, socioeconomic conditions have a profound differential influence on economic development outcomes and decisions on capital spending (Chen et al., 2019). A state's level of vulnerability affects its capacity to deal with unforeseen circumstances or make changes to fiscal conditions due to limited resources such as unemployment and household income (Cutter et al., 2003; Delgado et al., 2015), which affect consumption and the government's ability to raise revenue for social and economic infrastructure development. On the other hand, states with robust economic environments are more likely to have the financial resources available for investments in infrastructure (Ho, 2008; Pagano, 2002).
States experiencing high unemployment rates report lower household incomes, which affect their ability to raise tax revenue for implementing public policies (Overton & Bland, 2017). Government tax revenue from property, income, and consumption taxes is related to their cumulative wealth, income, and consumption, respectively. States with greater fiscal resources are more likely to invest in infrastructure, while fiscally constrained jurisdictions are less likely to do so. Moreover, studies show that governments experiencing fiscal distress may cutback or postpone capital projects (Chen, 2016; Ho, 2008). The use of tax revenue for infrastructure development—pay-as-you-go—focuses on capital assets that only current revenue can address, has challenges with intergenerational equity, and does not match payment with future users (Bland, 2013). Nonetheless, tax revenues contribute more to own-source revenue and infrastructure development.
However, infrastructure development could be achieved using debt with payments spread over time (Nukpezah & Ahmadu, 2021). Consequently, debt issuance is a major source of money for infrastructure development because it has the advantage of matching users with payments and the benefit of intergenerational equity (Bland, 2013). However, debt comes with a cost in the form of interest. States with more favorable credit ratings and strong financial fundamentals can negotiate more favorable interest rates and are likely to raise more debt to invest in infrastructure. Thus, state debt issuance is positively associated with infrastructure development (Liu et al., 2017).
Sociodemographic Indicators
Sociodemographic factors such as educational attainment contribute to social vulnerability (Cutter et al., 2003; Delgado et al., 2015). Highly educated residents are more likely to have better-paying jobs, own properties, and businesses (Cutter et al., 2003), and contribute to tax revenues because of their higher incomes, wealth, and consumption, which are necessary for supporting infrastructure in affluent states. Race and ethnicity are proxies for social vulnerability (Nukpezah, 2020). Minority ethnic groups tend to suffer social exclusion and lack economic and social capital (Cutter et al., 2003), which hinder economic mobility for income growth through consumption and wealth creation. Although states with higher percentages of minorities may have a greater need for infrastructure development, they invest less due to limited economic resources. Furthermore, poverty in society, which correlates with inequality, contributes to social differences in income and access to opportunities among economic groups (Wisner et al., 2012), which impacts infrastructure spending.
Data and Methods
Panel data on 50 U.S. states over a 17-year period (2000–2017) are used to investigate the punctuating effects of disasters and social vulnerability factors on roads and highways and transit system expenditures.
Dependent Variable
The dependent variables used in the study are the per capita dollar amount a state government spends on the construction of (1) roads and highways and (2) transit systems. A third variable, aggregated state infrastructure spending, is included to compare the effects of the independent variables on the outcome variables. This approach follows existing studies (Chen et al., 2019) modeling the determinants of infrastructure spending. The variables are standardized for population differences across states and adjusted for inflation using the 2017 consumer price index as the base. The per capita expenditure is log-transformed to improve normality. The nominal, inflation-adjusted, and per capita values of the three dependent variables are reported in the Appendix.
Independent Variables
Disasters as Punctuations
Natural disaster, as the punctuating event, is operationalized in three ways. First, as a dummy variable based on whether there was a major disaster declaration in the state during the year under consideration. The variable is coded 1 if there was a major disaster declaration in the state in a specified year, and 0 otherwise. Second, a dummy variable is coded 1, and 0 otherwise, if there was an Emergency Disaster Declaration in the state. Rather than use the count of disaster declarations, the binary measures give equal weight to all disaster events and diminish the potential influence of outliers, an approach that is consistent with existing studies (see Ahmadu et al., 2023; Ahmadu & Nukpezah, 2022; Noy, 2009).
The third disaster variable is the extent of disaster damage (measured in dollars), which provides an interval-level measure of the impact of disaster events. The more damaging a disaster is and the more extensive the damage, the dollar amount of the extent of disaster damage is expected to be higher and cause severe budgetary punctuations in a state compared to states with no disaster experience. The total disaster damage for each year is calculated by aggregating the disaster damage values for each year under consideration. The variable is standardized for population differences among states and normalized as a natural log per capita. In addition, the disaster variables are lagged by one period since it is theorized that previous year disasters affect present spending levels. Data on disaster declaration is obtained from the Federal Emergency Management Agency (FEMA), which reports hazardous events as they occur. Data on the extent of disaster damage is from the Spatial Hazard Events and Losses Database for the United States (SHELDUS).
Social Vulnerability Variables
The socioeconomic factors include household income as well as state financial indicators, such as tax revenue from sales tax. States that report higher household incomes likely have higher consumption and generate more tax revenue. Such states are less vulnerable since they can meet their residents’ social and economic infrastructure needs. Other socioeconomic indicators are the proportion of a state's population that is unemployed and the percentage of the population that is in poverty. The sociodemographic factors include the percentage of the state population that is college-educated. Lastly, debt per capita measures state debt issuance adjusted for population differences.
Control Variables
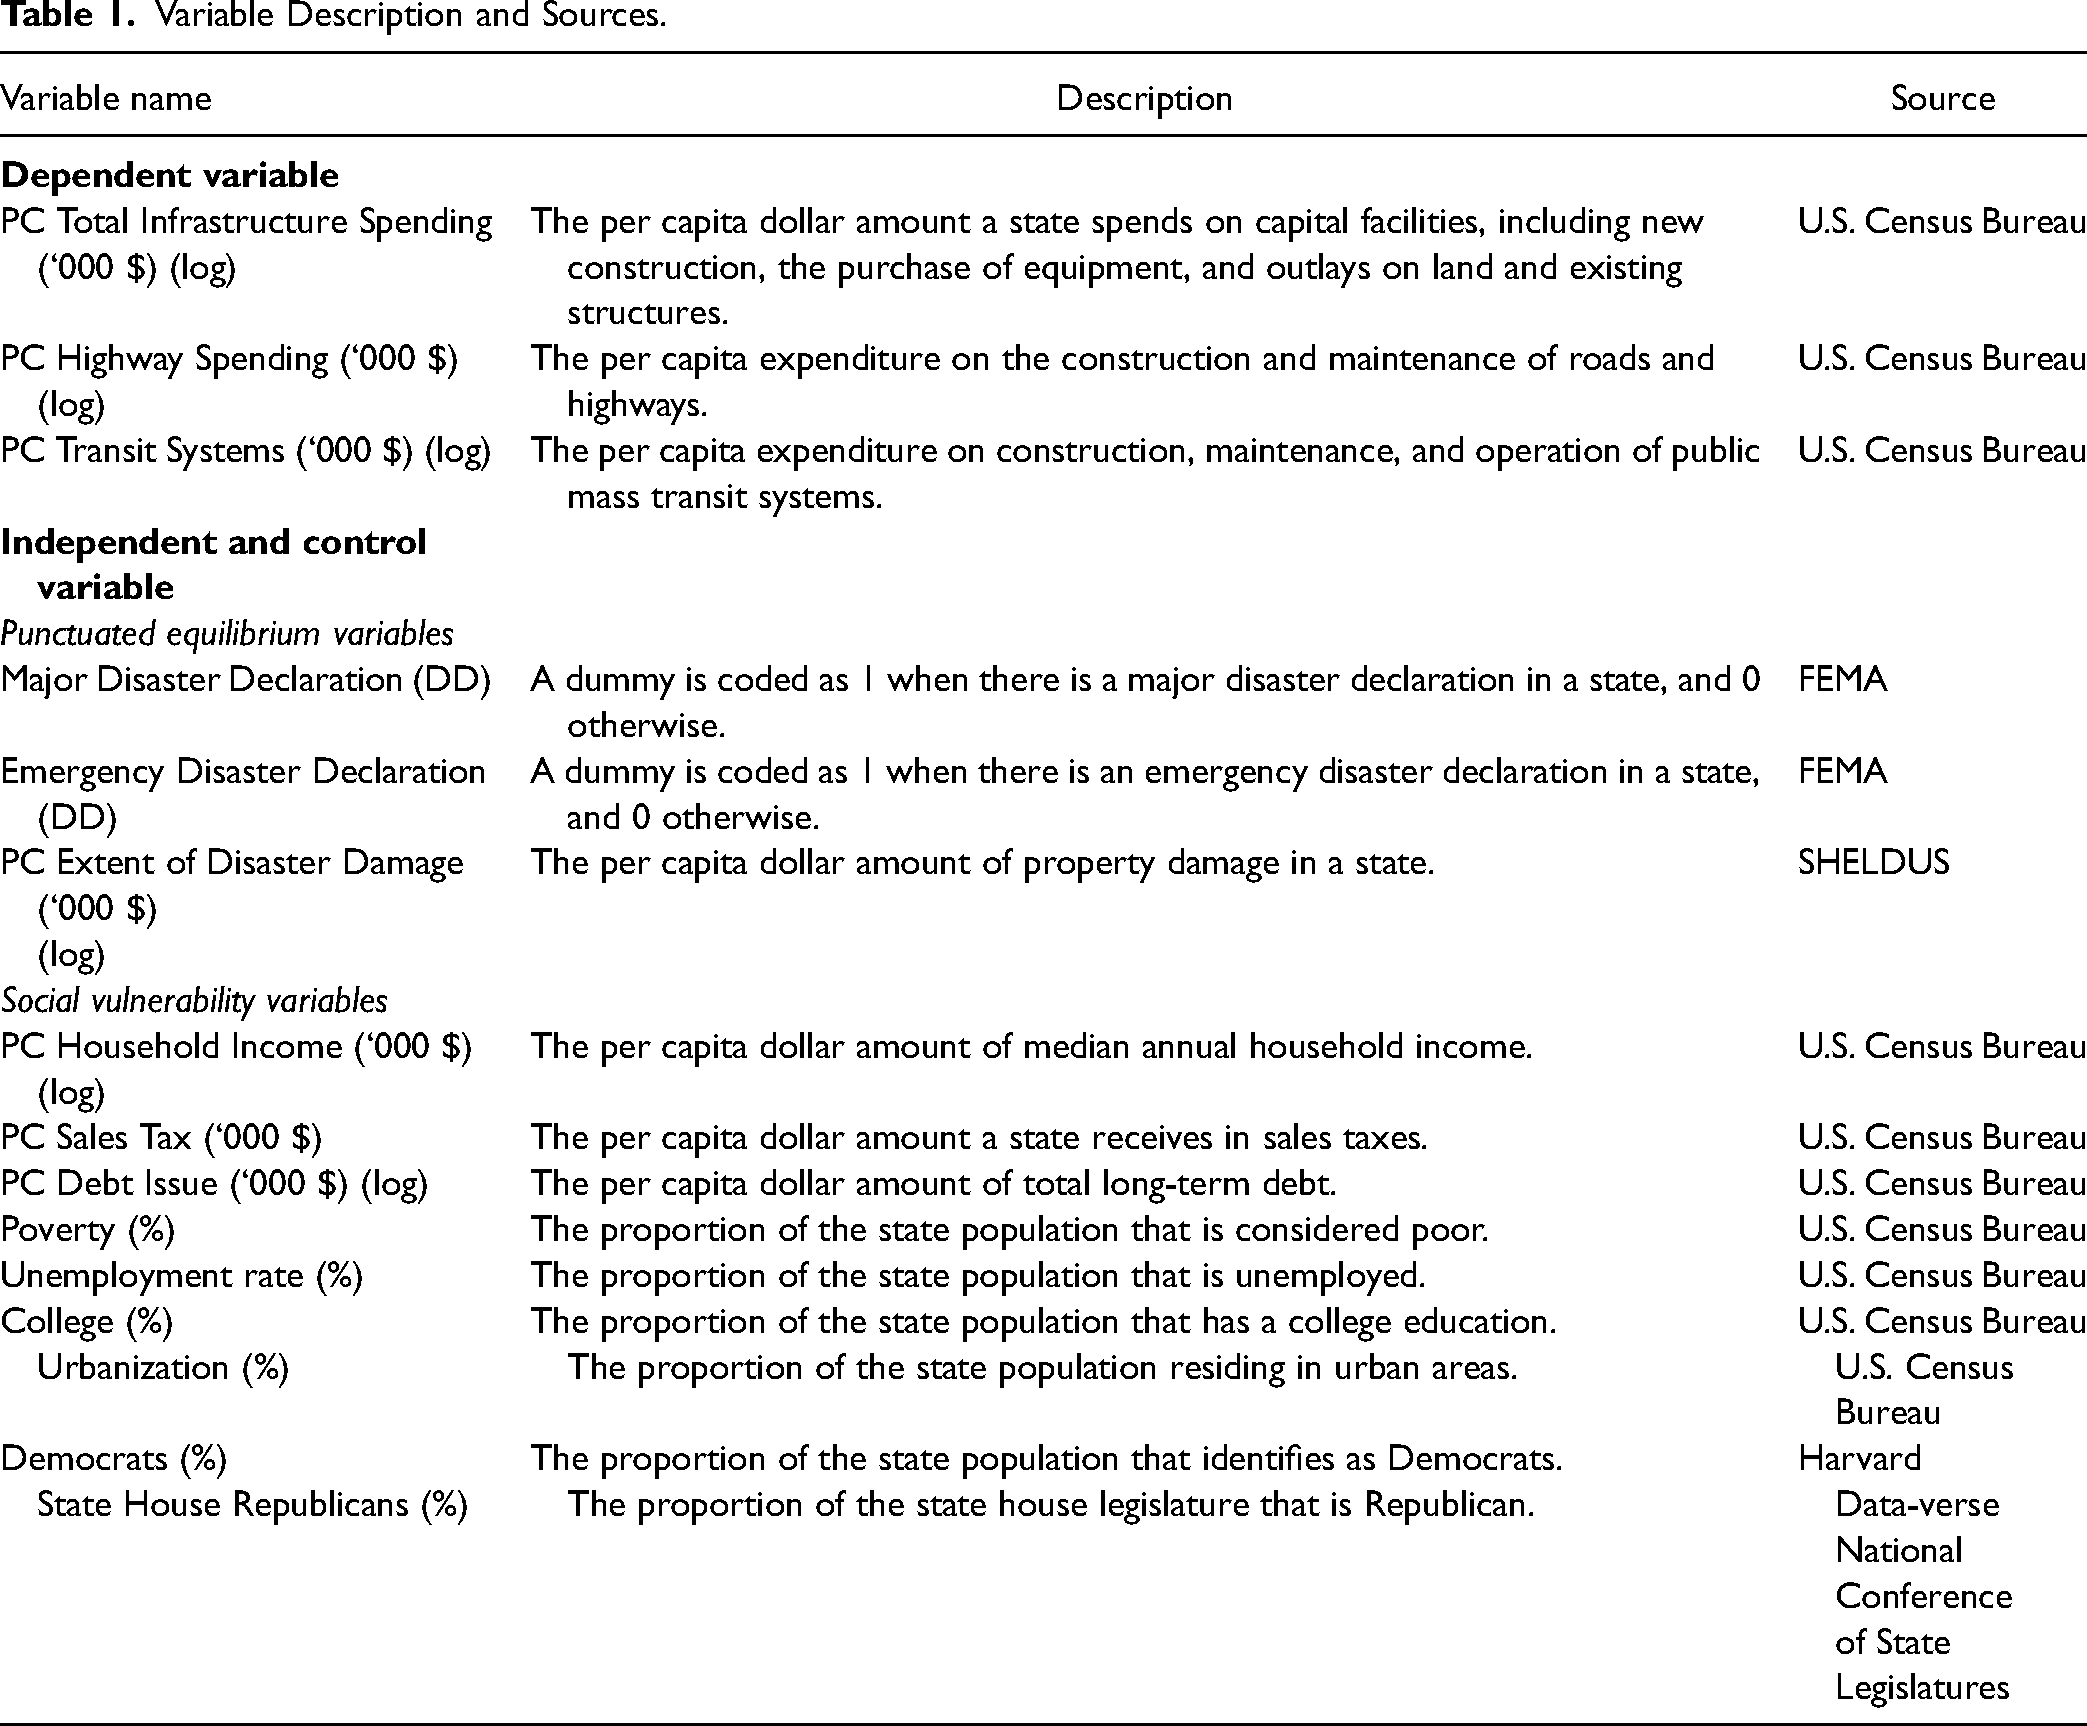
The study controls for political factors with the percentage of the state population that identify with the Democratic Party and the percentage of members of the House of Representatives that identify with the Republican Party. While there are various ways to operationalize political influence, using interval-level measures rather than nominal variables has the advantage of increased variability, which is more favored by political scientists (Fisher & Wassmer, 2015). It also controlled for the percentage of the state population that is urban. Table 1 shows the variable descriptions and their sources. Table 2 reports the descriptive statistics of the variables used in the study.
Variable Description and Sources.
Descriptive Statistics.

Data Analysis
The fixed-effects model estimating the relationship between state infrastructure spending and its determinants is given by the equation: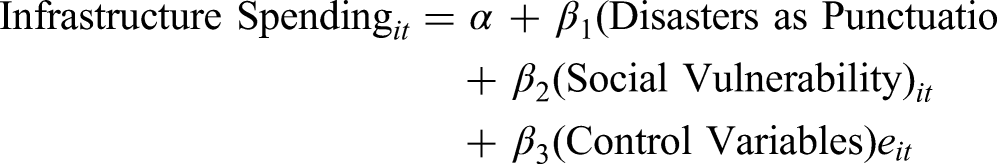
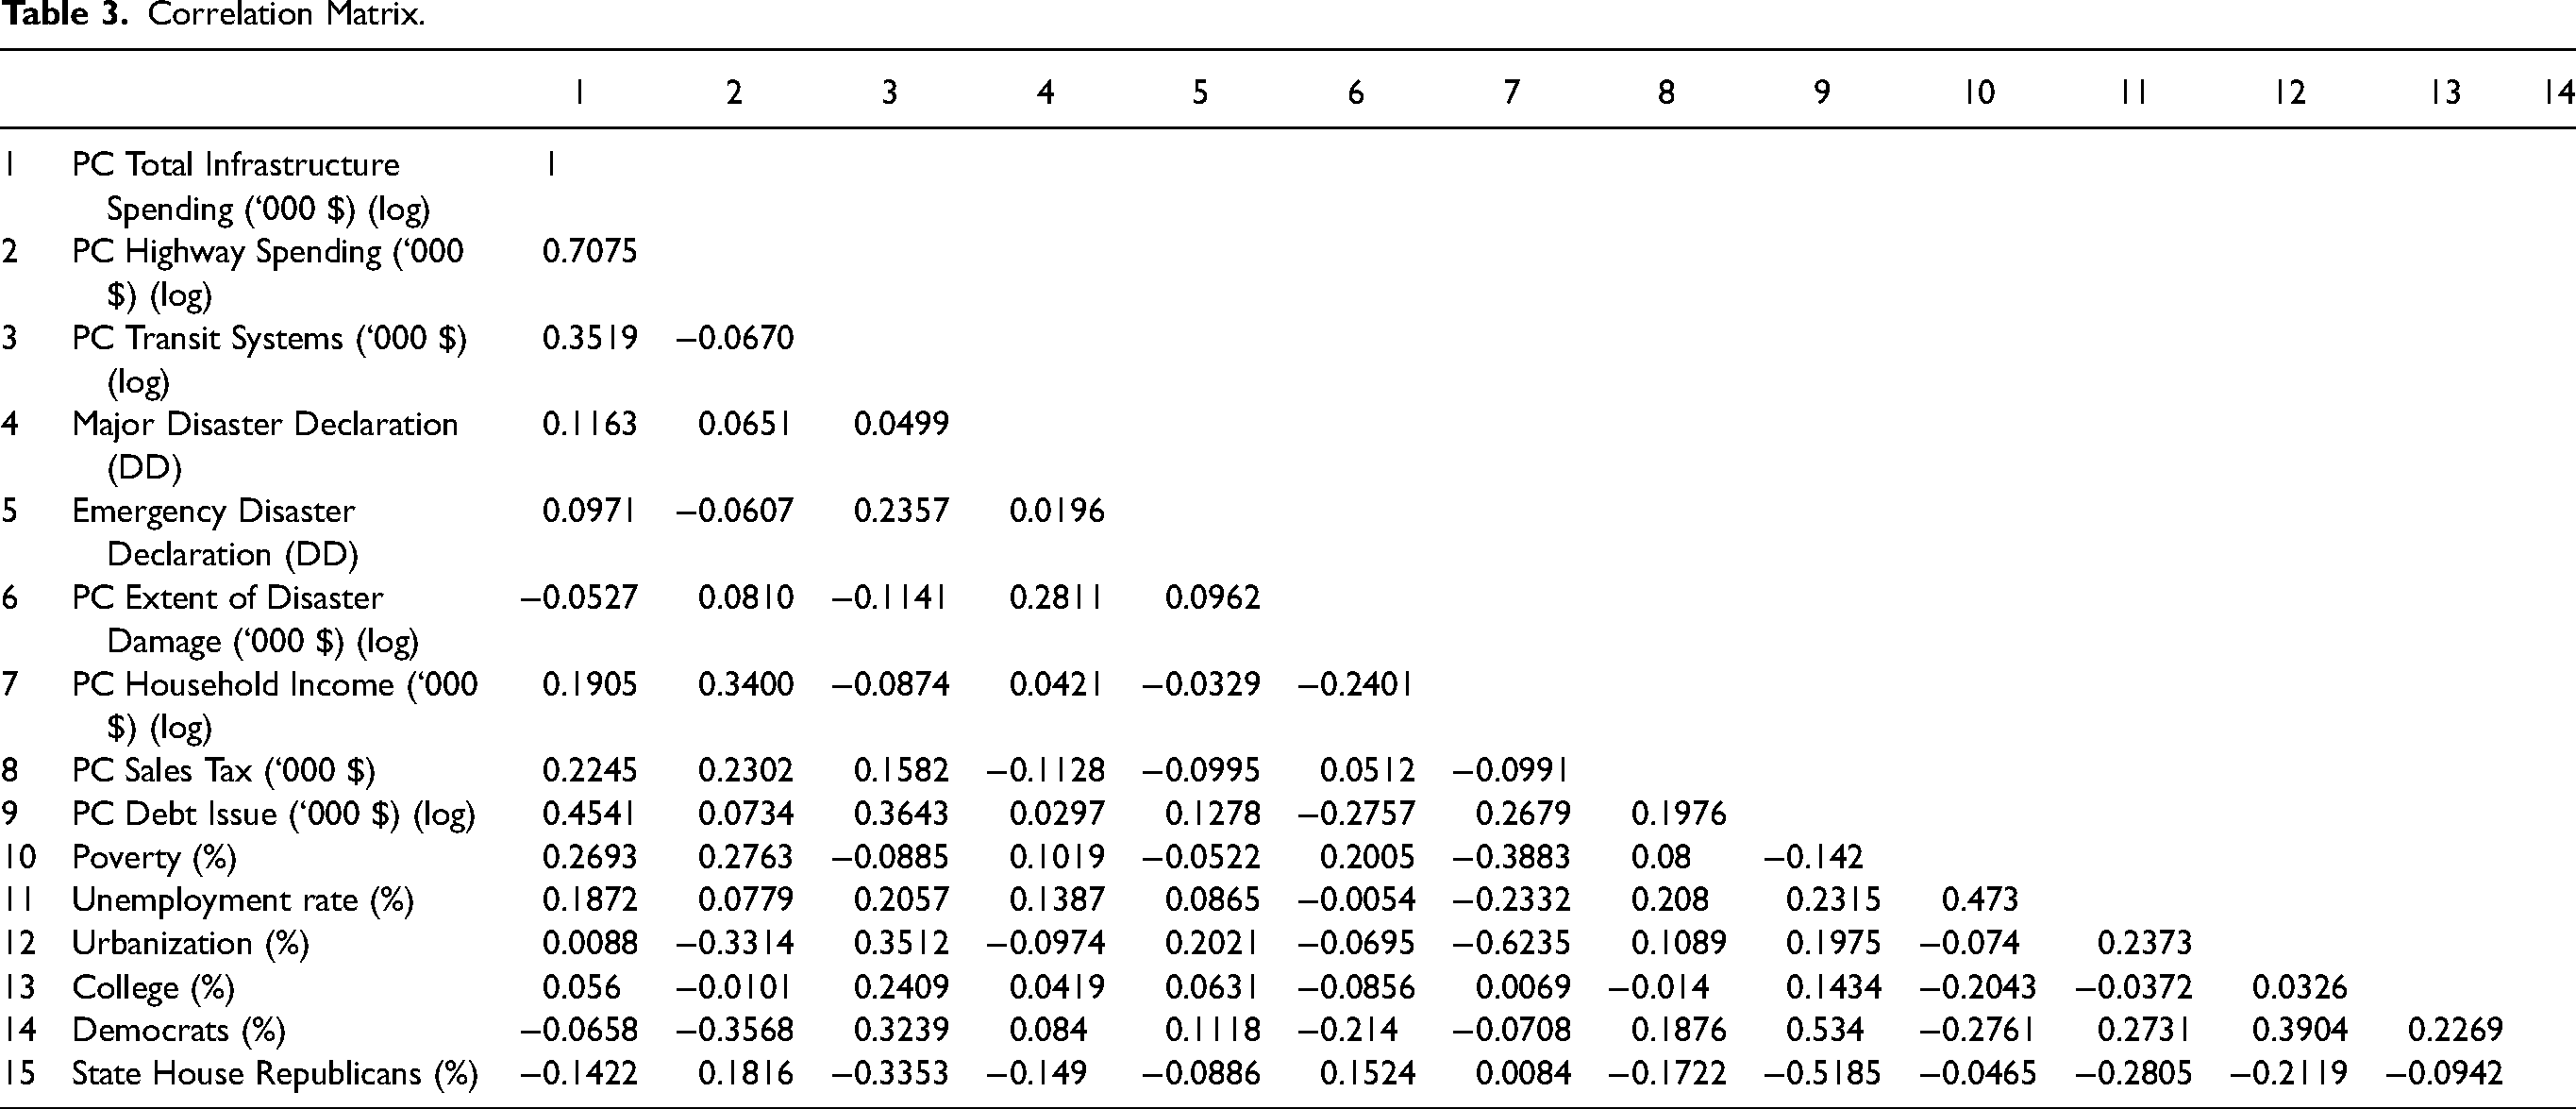
The Hausman (1978) test identifies the appropriate panel estimation method between fixed and random effects regression. The null hypothesis of the Hausman test denotes that the fixed effect is more suitable for capturing dynamic effects. The study also employs the Breusch-Pagan/Cook-Weisberg test for heteroskedasticity and finds that it is not present in the models. When independent variables are correlated, these pose multicollinearity problems and bias the coefficients of the regression. The correlation matrix reported in Table 3 shows that none of the independent variables used in the model pose a multicollinearity problem. The variance inflation factor (VIF) confirms the absence of multicollinearity concerns. The mean VIF is 1.66, and the highest VIF score is 2.54, which is less than the threshold of 4.0 to make multicollinearity a concern. Also, since time may be an important explanatory variable, year effect dummies are included in the model.
Correlation Matrix.
Results and Discussion
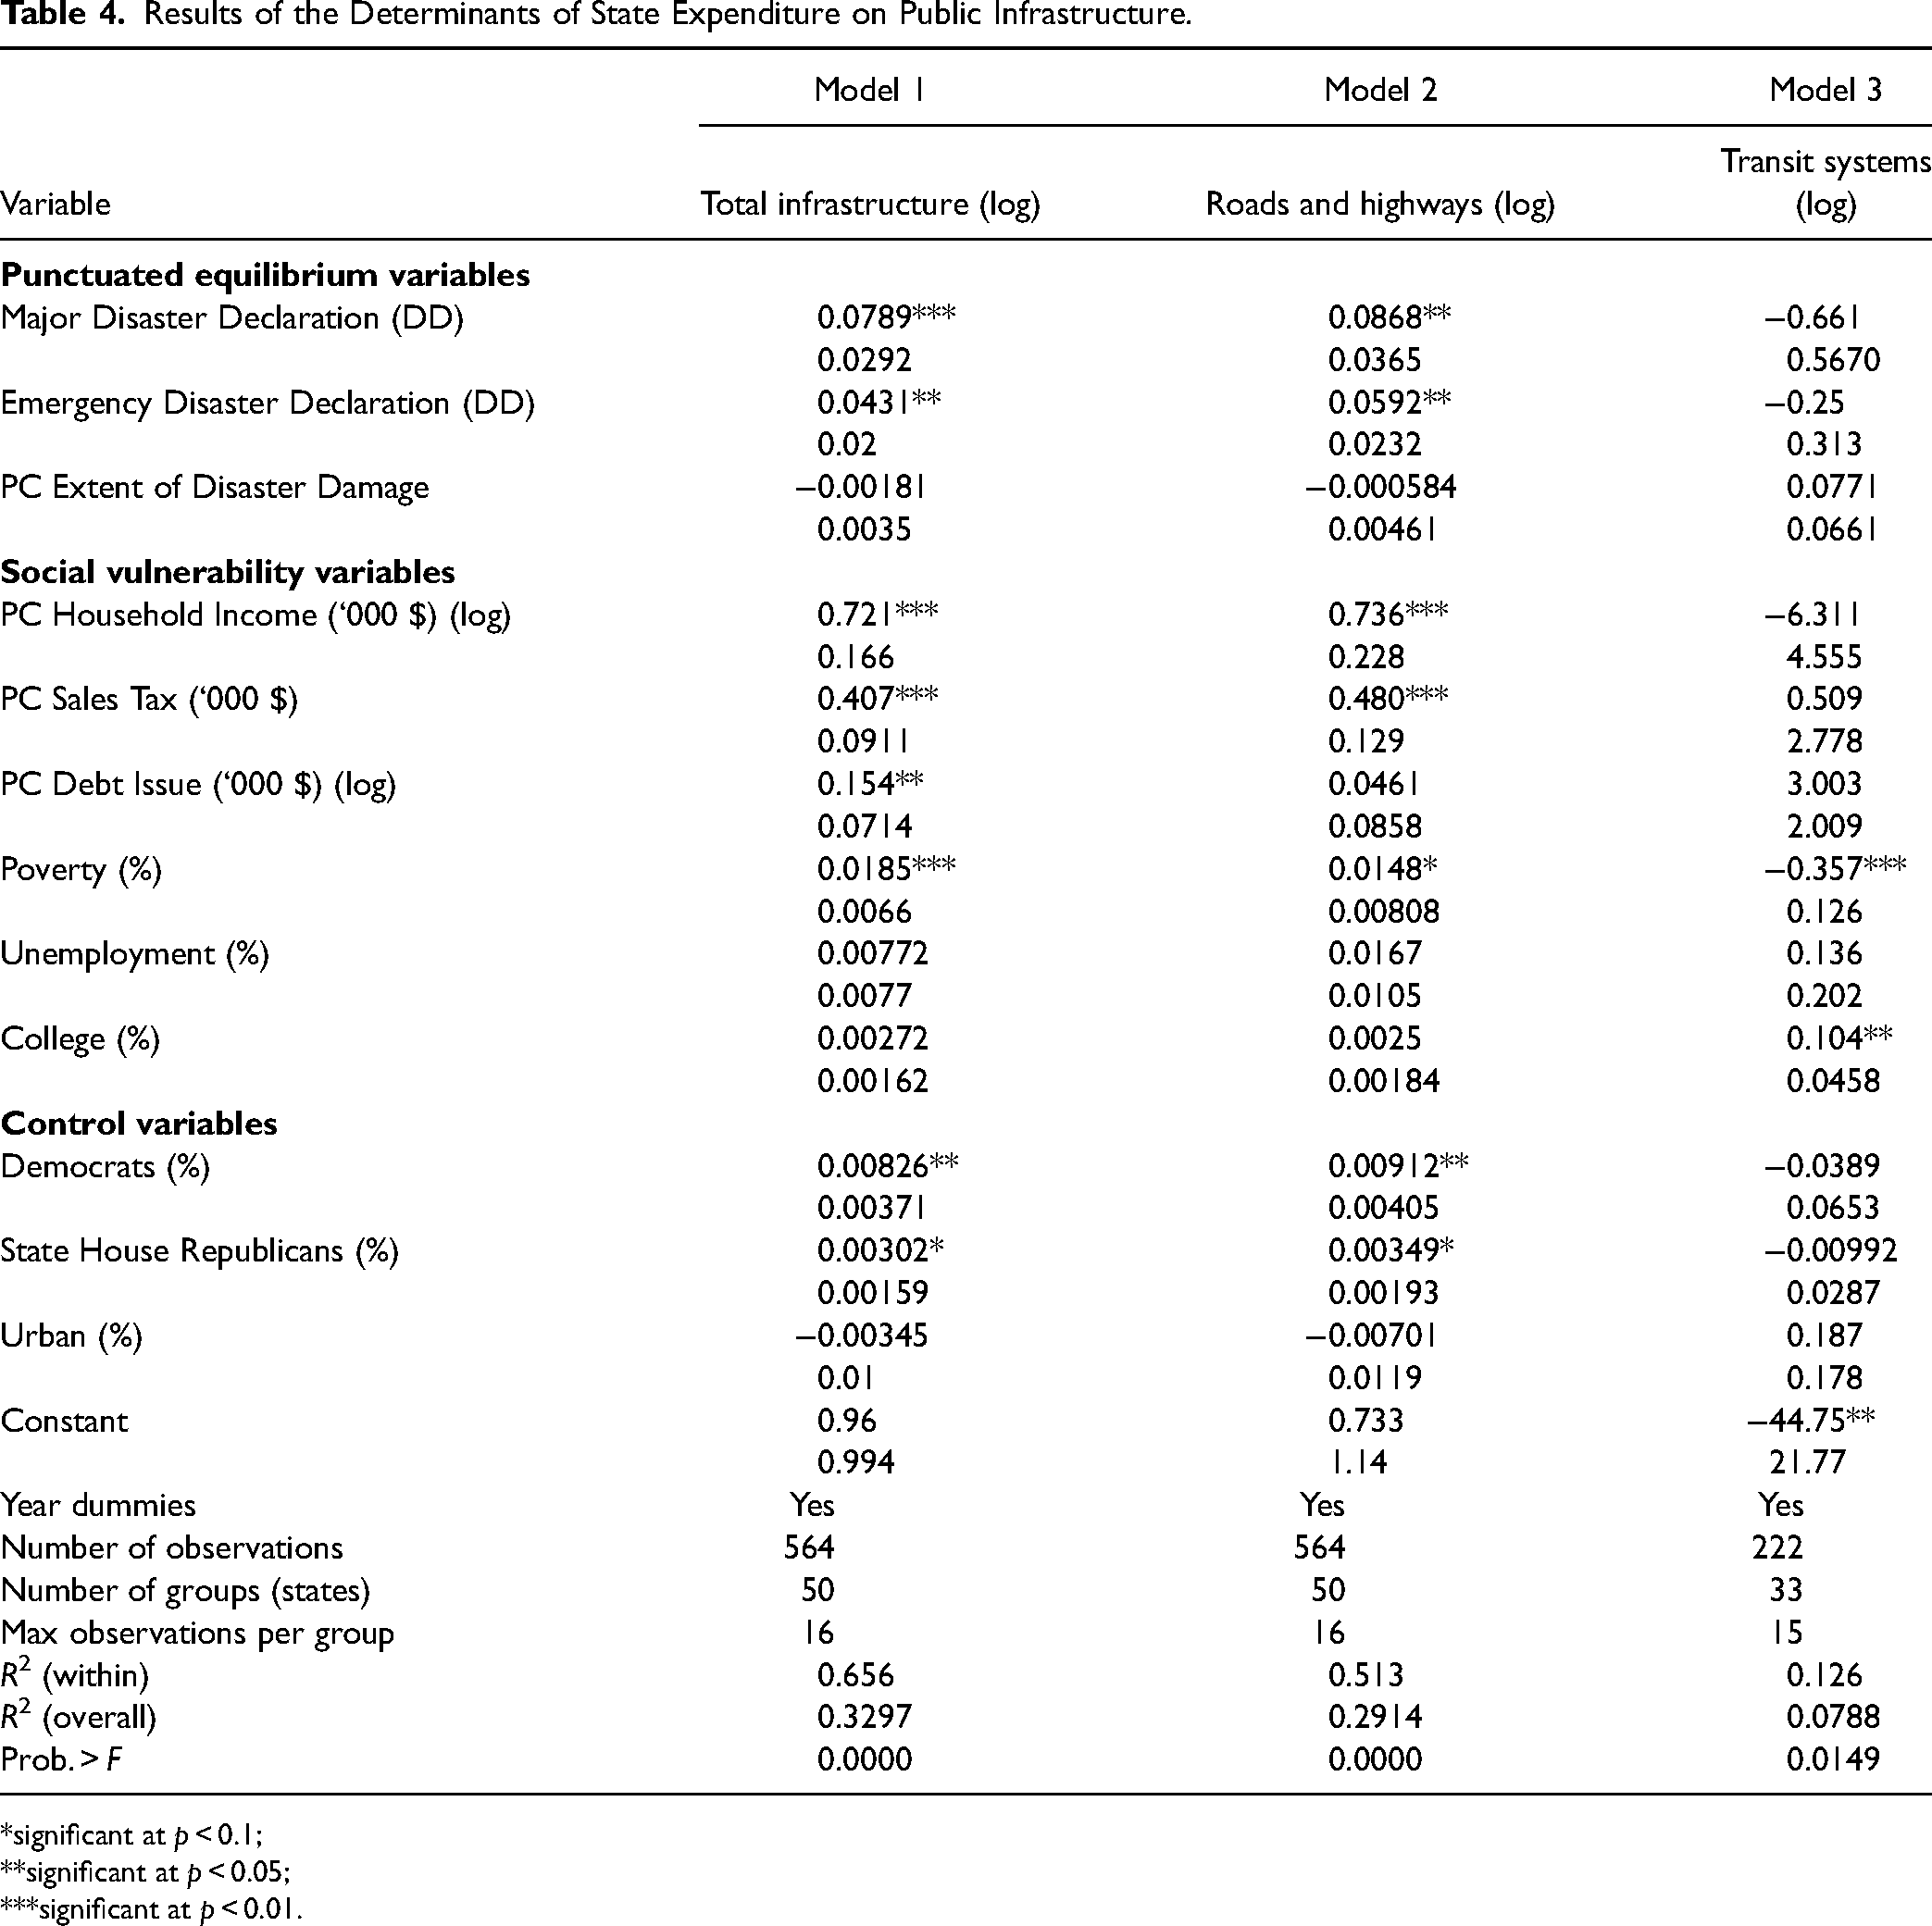
The results of the fixed-effects regressions are reported in Table 4, which shows three models estimating the determinants of per capita state spending on infrastructure. Model 1 depicts the total state infrastructure expenditure. Models 2 and 3 focus on roads and highways and transit systems, respectively. All the models are significant and report reasonable R2s. For example, Model 2 is significant (p < 0.01), and the within R2 value is 0.51, suggesting that the independent variables explain about 51% of the variation in per capita state spending on roads and highways. The fixed-effects regressions show that disasters and social vulnerability factors affect state infrastructure spending decisions, although differences exist among infrastructure types.
Results of the Determinants of State Expenditure on Public Infrastructure.
*significant at p < 0.1;
**significant at p < 0.05;
***significant at p < 0.01.
Disasters as Punctuations
Consistent with punctuated equilibrium theory, the study proposed that major disaster declarations, emergency disaster declarations, and the extent of disaster damage trigger reactive budgetary responses and increased state infrastructure spending for a more resilient society. The study found support for this assertion in Models 1 and 2, where major disaster declarations and emergency disaster declarations influence increases in total state infrastructure spending and road and highway spending. The results show that, controlling for other variables, the major disaster declaration in a state is associated with a 7.89% increase in per capita total infrastructure expenditure (P < 0.05) and an 8.68% increase in per capita road and highway spending (P < 0.05), respectively. Similarly, the emergency disaster declaration in a state is associated with a 4.31% increase in the total per capita infrastructure expenditure (P < 0.05) and a 5.92% increase in per capita road and highway spending (P < 0.05), respectively.
The findings reveal the more nuanced effects of disasters on infrastructure spending. The results show that disasters do not trigger changes in state spending for transit systems as they do with roads and highways. Roads and highways are high-cost investments and are tied to economic development. By investing in roads and highways, states contribute to interstate trade and commerce as well as tourism. Investment in roads and highways is also necessary for the social and economic infrastructure of modern economies (Chen, 2016; Chen, 2018). Understandably, the federal government is more responsive in providing public assistance through short-term and long-term grants to fund the maintenance of roads and highways following disasters, which may contribute to the overall increase in state spending (Ahmadu et al., 2023).
Contrary to expectations, none of the disaster declaration variables influence transit system expenditure. A possible explanation is that transit systems are not pure public goods and may be initiated through public–private partnerships and attract user fees and charges (ASCE, 2021; Taylor et al., 2009). For the private sector investment that is required to complement government efforts, a more favorable economic condition is required.
Furthermore, the extent of disaster damage is not significant in any of the models. It could be that disaster-related damage to physical properties has declined over time due to improved structural innovations (Kahn, 2005). Another possible explanation could be that wealth insulates communities from environmental hazards due to investments in disaster preparedness, building policies, and other safety precautions designed to improve infrastructure resiliency and safety (Anbarci et al., 2005). Furthermore, states are maximizing financing tools such as insurance, catastrophic bonds, and federal assistance to ease the economic shock of disaster punctuation on infrastructure spending (Mechler et al., 2006). Despite these explanations, nonetheless, disasters are traumatic and cause extensive damage that is estimated in billions of dollars annually (Vroman, 2019).
Social Vulnerability
Drawing from social vulnerability theory, the study postulated that prevailing state socioeconomic and sociodemographic factors affect state infrastructure spending. States with unfavorable economic conditions, such as lower household income, lower sales tax revenue, and higher unemployment and poverty rates, are vulnerable and unable to spend more on infrastructure development. Findings indicate that per capita household income increases total state infrastructure spending in Models 1 and 2, although it is not significant in Model 3 (transit system). A dollar increase in per capita household income is associated with a $7.21 increase in per capita state infrastructure spending (P < 0.001) and a $7.36 increase in per capita spending for roads and highways (P < 0.01).
Resource availability is often cited in the literature as a measure of fiscal capacity, reflecting a jurisdiction's ability to generate sufficient resources to finance public goods (Chen, 2016; Cutter et al., 2003; Pagano, 2002). The absence of fiscal vulnerability contributes to greater economic status and demand for infrastructure, which leads to greater state spending to meet the needs for public goods (Kemmerling & Stephan, 2008). Furthermore, states raise revenues from sales tax (Overton & Nukpezah, 2020), and those states that receive more revenue from this source are less vulnerable and are expected to spend more on state policies, including infrastructure development.
Model 1 reports that a dollar increase in per capita sales tax revenue is associated with a $40.7 increase in per capita total state expenditure on infrastructure (P < 0.001) and a $48.0 increase in roads and highways (P < 0.001). The flexible nature of sales tax policies affords its utilization as a fiscal tool to boost economic activities and finance disaster-related reconstruction (Ismayilov & Andrew, 2016; Overton & Bland, 2017; Overton & Nukpezah, 2020; Picou & Martin, 2006). However, sales tax was not a significant predictor of spending on transit systems.
Regarding debt issuance, the findings are that it explains increases in total infrastructure spending. However, it is not significant in Models 2 and 3. Model 1 shows that a dollar increase in per capita state debt increases infrastructure spending by $1.54 (P < 0.05). The finding demonstrates that states are likely to favor public debt issuance in some sectors over others (Nukpezah et al., 2022).
An increase in the state poverty rate is expected to contribute to jurisdictional vulnerability; states that report higher measures on these indicators are expected to report lower spending on infrastructure. Although poverty is significant in all models, it carries a positive sign in Models 1 and 2. States reporting higher poverty rates are associated with higher spending in Model 1 (total infrastructure) and Model 2 (roads and highways), while a higher poverty rate is associated with lower spending in Model 3 (transit systems) (P < 0.01). States with high poverty rates signal deteriorating economic conditions; therefore, such economies are likely to crowd out infrastructure spending for welfare programs to ameliorate the adverse effect of social vulnerability (Guild, 2000). The finding in Model 3 is consistent with the existing scholarship that favorable financial conditions facilitate the development of transit systems in urban centers and states (Gwilliam, 2008).
Contrary to expectations, higher poverty rates attract more state funding for total infrastructure and roads and highways, which suggests a complex and nuanced infrastructure policymaking process at the state level. The finding suggests that states increase their appropriations for certain sectors to address preferred policies, such as economic development and social inequities, by allocating more resources to these programs. The complexity of policymaking likely explains why, although median household income and poverty rates are inversely related, both have positive effects on the dependent variables in Models 1 and 2. States with more college-educated residents tend to report higher-paying jobs, which translates into higher income and higher tax revenues that make investment in government programs such as transit systems possible. The result shows that a percent increase in a state population that is college-educated is associated with a 10.4% increase in spending on transit systems (P < 0.05), controlling for other variables. Since higher educational attainment is often linked to increased income levels (Berger & Fisher, 2013), it is expected that educated individuals can accumulate wealth to purchase services that transit systems provide. Investing in transit systems in a thriving urban setting with more college-educated individuals seeking to commute to work is likely an attractive investment to both the government and the private sector because of the economic benefits.
The study controlled for the political orientation of the states by estimating the effect of the percentage of the state population that identified with the Democratic party and the percentage of members of the House of Representatives that identified with the Republican party. The findings show that states with more Democratic voters spend more on total infrastructure and roads and highways. Previous studies argue that states with strong liberal ideologies are likely to support higher capital expenditures (Fisher & Wassmer, 2015; Izraeli & Folland, 2007; Seitz, 2000), likely because they support larger budgets through higher taxation. The findings also show that states with more Republican members of the House of Representatives support higher funding for infrastructure and roads and highways. This finding affirms extant scholarship that the more business-friendly conservative Republican Party is pro-infrastructure to facilitate business growth (Witko & Newmark, 2006). Thus, while the motive for supporting infrastructure expenditure may differ, it is possible for both political parties to support infrastructure expenditure (Buchheim & Fretz, 2020; Izraeli & Folland, 2007), as in the bipartisan support for the $1.2 trillion IIJA (Goodsell, 2023; Zhang & Batjargal, 2022). Benavides et al. (2021) observe that public managers do not always act in response to their political ideology or the prevailing politics in their states.
Although states with more urban residents and lower unemployment rates are expected to report higher infrastructure spending, these variables are not significant in any of the models. It appears other social vulnerability variables offer a better explanation for government spending on roads and highways and transit systems.
Conclusion
Disasters are exogenous events that cause punctuations in equilibrium and affect the stability of communities (Ahmadu et al., 2023; Jones & Baumgartner, 2012; Tilcsik & Marquis, 2013). Social vulnerability factors, on the other hand, are endogenous socioeconomic and sociodemographic factors that limit a community's access to resources (Ablah et al., 2009; Cutter et al., 2003; Mallick et al., 2011). These two factors influence state spending on public infrastructure. However, the effects are more nuanced considering infrastructure categories such as roads and highways, and transit systems.
For example, disasters affect total infrastructure spending as well as roads and highways spending, likely because they trigger federal public assistance grants for permanent works and emergency works (Ahmadu et al., 2023). However, disasters do not influence state spending on transit systems, which are affected more by favorable state economic conditions. Furthermore, fiscal and economic conditions, such as favorable median household income and sales tax revenue, influence higher infrastructure expenditures and highways and roads spending. However, the effects of state poverty levels are mixed, suggesting complexity in state infrastructure policy decisions.
The present study builds on existing studies that investigate the determinants of infrastructure spending (Buchheim & Fretz, 2020; Chen et al., 2019) in several ways. First, it disaggregates total state infrastructure spending by focusing on two important categories to understand the effects of disaster punctuation and social vulnerability on public infrastructure. Second, it shows how disasters can affect state budgetary decisions and the allocation of resources. While most studies are limited to testing the effects of economic, political, and social factors on capital spending (Buchheim & Fretz, 2020; Chen, 2016; Chen et al., 2019), the present study shows how exogenous disaster events as well as endogenous social vulnerability factors play roles in state spending decisions and therefore contribute to public infrastructure policy making.
The study has several policy and managerial implications. First, it indicates that social vulnerability factors, particularly the economic context of a state—which constitutes the resources available within its boundaries are crucial contributors to state infrastructure spending. Hence, maintaining a robust fiscal capacity is necessary for state policymakers to make sustained infrastructure investments. Second, it implies that when disaster strikes and communities are overwhelmed, states will likely consider how to be more innovative and create a more resilient society by increasing budgetary allocation to specific infrastructure types. Also, policymakers reevaluate government priorities and make changes in budgetary appropriations. Disasters are associated with increased appropriations for public infrastructure, likely to ensure that the investments make the state more resilient to future traumas. If disasters constrain budgets but force state governments to increase their allocation for roads and highways and other infrastructure types, then it is reasonable to conclude that states that experience fewer such crises, spend less on infrastructure and more on other economic and social programs. This is the case because they invest in the resilience of their infrastructure or are in regions that experience fewer disaster events.
Although care was taken in framing the study, there are some limitations. The present study focused on U.S. states rather than local governments. Local-level conditions may differ from state to state, which may affect the generalizability of the study to the local level. Nonetheless, the implications extend to other levels of government that need to invest in infrastructure development. A future study may replicate the study at the local level to understand the extent to which the theories are supported. Also, there are other variables that may determine state investment in infrastructure. For example, the ASCE has graded state infrastructure and estimated gaps in state infrastructure development. A future study might consider how these factors influence state infrastructure spending. It is reasonable to postulate that states that lack the appropriate levels of infrastructure would allocate more resources to these sectors.
Whereas the study included a variable for the level of urbanization of the state as a proxy for population growth and level of congestion, among others, the actual variables may be considered independent variables in a future study. In addition, future research could explore the link between social determinants of health and government infrastructure investment. Social determinants include healthcare accessibility, individuals with disabilities, community dynamics, immigrant populations, and the built environment. Finally, the role of federal assistance in state infrastructure spending could be examined both as a cause and as part of the effect of infrastructure spending.
Footnotes
Declaration of Conflicting Interests
The author(s) declared no potential conflicts of interest with respect to the research, authorship, and/or publication of this article.
Funding
The author(s) received no financial support for the research, authorship, and/or publication of this article.
Author Biographies
Appendix
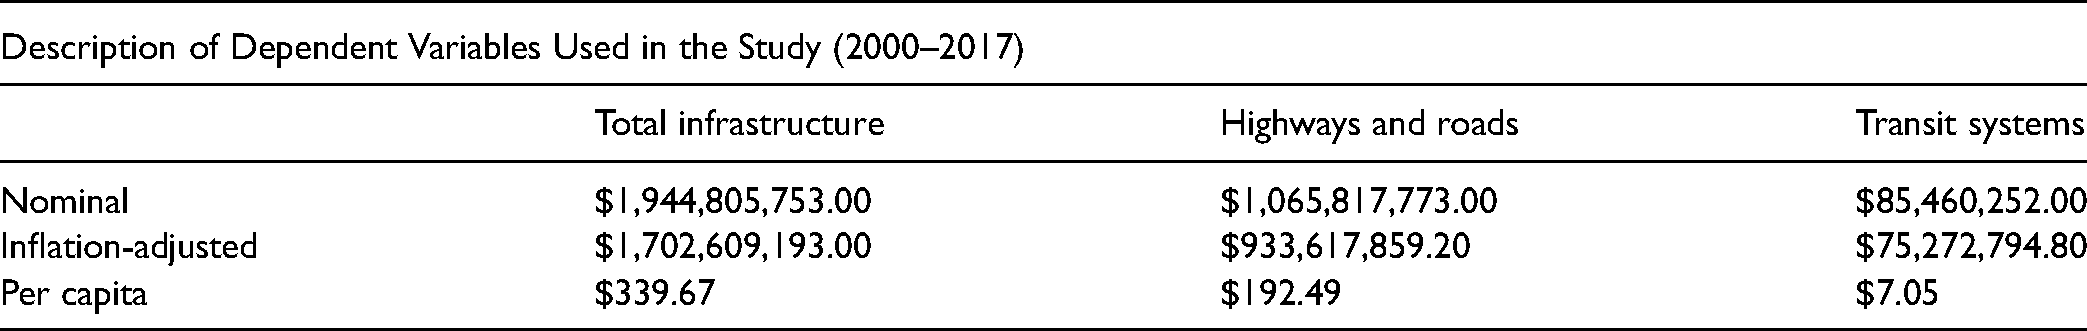
| Description of Dependent Variables Used in the Study (2000–2017) | |||
|---|---|---|---|
| Total infrastructure | Highways and roads | Transit systems | |
| Nominal | $1,944,805,753.00 | $1,065,817,773.00 | $85,460,252.00 |
| Inflation-adjusted | $1,702,609,193.00 | $933,617,859.20 | $75,272,794.80 |
| Per capita | $339.67 | $192.49 | $7.05 |