
Abstract
Few studies have measured auditory imagery in comparison to visual imagery. The aim of this study was to assess the reliability and validity of two Spanish versions of measures of imagery auditory: The Auditory Imagery Scale and the Auditory Imagery Questionnaire. Confirmatory factor analysis found that the Auditory Imagery Questionnaire had two factors, and the Auditory Imagery Scale had one factor. The correlations of both questionnaires with other measures of auditory imagery were significant. The results are discussed in light of future lines of research aimed at evaluating the measures of both Spanish versions.
Numerous studies have examined visual imagery, but very few have focused on auditory imagery, and even fewer on mental imagery related to the other senses (Hubbard, 2010; Lacey & Lawson, 2013). The scant research on mental imagery related to the senses, other than visual imagery, also extends to work related to other cognitive processes (Baddeley, Eysenck, & Anderson, 2009).
Likewise, several tests have been designed for visual imagery, but few are available for measuring auditory imagery (Campos & Pérez-Fabello, 2011). Hubbard (2010) only refers to the Auditory Imagery Scale (AIS; Gissurarson, 1992) for measuring auditory imagery. Recently, Campos and Pérez-Fabello (2011) corroborated four of the most extensively used auditory imagery measures, that is, the AIS (Gissurarson, 1992), the Clarity of Auditory Imagery Scale (CAIS; Willander & Baraldi, 2010), the Auditory Imagery Questionnaire (AIQ; Hishitani, 2009), and the Betts' Questionnaire Upon Mental Imagery (Betts' QMI; Sheehan, 1967).
The AIS (Gissurarson, 1992) consists of seven questions on seven sounds and voices. Gissurarson (1992) obtained a Cronbach's alpha of .80, and the factor analysis found one sole factor. This scale correlated .48 (p < .001) with the Vividness of Visual Imagery Questionnaire (VVIQ; Marks, 1973). This author found no significant differences in scores between women and men on the AIS.
The CAIS (Willander & Baraldi, 2010) is a test composed of 16 items measuring clarity of auditory imagery. Willander and Baraldi found a Cronbach's alpha of .88, and no significant differences in clarity of auditory imagery between women and men were observed. Factor analysis found four components with eigenvalues greater than 1.0. Willander and Baraldi have not correlated the CAIS with other measures of imagery.
Campos and Pérez-Fabello's (2011) analysis of the Spanish Version of the CAIS found a Cronbach's alpha of .82. Factor analysis found five factors explaining 57.4% of total variance. Campos and Pérez-Fabello found no differences on the CAIS between women and men. The CAIS correlated .42 (p < .001) with the Vividness of Visual Imagery Questionnaire-2 (VVIQ-2; Marks, 1995) and −.12 with the Measure of the Ability to Form Spatial Mental Imagery (Campos, 2009, 2013). The correlations for the CAIS with each of the scales on the Betts' QMI were as follows: −.31 Visual scale, −.46 Auditory scale, −.37 Cutaneous scale, −.36 Kinesthetic scale, −.42 Gustatory scale, −.41 Olfactory scale, and −.25 Organic scale (all ps < .001; high scores on the Betts' QMI indicated low imaging capacity). More recently, Campos and Fuentes (2016) obtained an alpha of .88 and found music students scored higher on clarity of auditory imagery than nonmusician. Campos and Fuentes (2016) found no differences between women and men in clarity of imagery auditory.
The AIQ (Hishitani, 2009) is a test measuring the vividness of auditory imagery. Factor analysis found two factors, and the Cronbach's alpha was .85. Hishitani examined if AIQ scores could predict the performance of pitch memory and observed that low imagers produced more recall errors than high imagers (recall error is the absolute difference, measured in semitones, between recalled and correct pitches). The correlation between the AIQ and the VVIQ (Marks, 1973) was .48 (p < .05).
The Betts' QMI (Sheehan, 1967) is a shortened version of the Questionnaire Upon Mental Imagery (Betts, 1909), which consists of 35 items, with 5 items for each of the seven sensory modalities. Campos and Pérez-Fabello (2005) reported a Cronbach's alpha of .92 and a correlation of .58 (p < .01) with scores on the Spanish version of the VVIQ (Campos, González, & Amor, 2002) and −.34 (p < .01) with those on the Spanish version of the Gordon's Test of Visual Imagery Control (Pérez-Fabello, & Campos, 2004). Recently, Campos and Fuentes (2016) found a Cronbach's alpha of .85.
According to Campos and Pérez-Fabello (2011), of the four most widely used auditory imagery measures, that is, the AIS, the CAIS, the AIQ, and the Betts' QMI, two (the CAIS and the Betts' QMI) have been previously assessed in Spanish. Thus, the aim of this study was to analyze the reliability and validity of the Spanish versions of the AIQ (Hishitani, 2009) and of the AIS (Gissurarson, 1992) in order to apply both measures to Spanish populations.
Method
Participants
A total of 444 second- and third-year psychology undergraduates at the University of Santiago de Compostela, Spain (254 women and 190 men); mean age 20.35 years (SD = 2.11), range 19 to 24 years, freely volunteered to participate in the study.
Material
The Spanish translations of the AIQ (Hishitani, 2009), the AIS (Gissurarson, 1992), the CAIS (Willander & Baraldi, 2010), and the Betts' QMI (Sheehan, 1967) were used.
The Spanish version of the AIQ (Hishitani, 2009; see Appendix 1) consisted of 12 questions scored on a scale 1 to 5 (1 = perfectly clear and as vivid as normal audition and 5 = no image at all; you only know that you are thinking of the sound or voice), the vividness of each imagery. High scores indicated low imagery and vice versa. In this study, a Cronbach's alpha of .74 was obtained.
The Spanish version of the AIS (Gissurarson, 1992; see Appendix 2) consisted of seven questions on the auditory imagery of sounds and noises, which were scored on a 4-point scale where 1 = very clear sound/noise and 4 = no sound/noise at all. High scores indicated low imagery and vice versa. In this study, a Cronbach's alpha of .63 was obtained.
The Spanish version (Campos & Pérez-Fabello, 2011) of the CAIS (Willander & Baraldi, 2010) consisted of 16 items measuring clarity of auditory imagery. Participants rated how clearly they could imagine the sound presented in each item. Each item was scored on a 5-point Likert-type response format, where 1 = not at all and 5 very clear. In this study, a Cronbach's alpha of .76 was obtained.
The Spanish version (Campos & Pérez-Fabello, 2005) of the Betts' QMI (Sheehan, 1967) was composed of 35 items, with five items for each of the seven sensory modalities: visual, auditory, cutaneous, kinesthetic, gustatory, olfactory, and organic. Each item is scored on a 7-point scale using anchors of 1 = Image perfectly clear and as vivid as the actual experience and 7 = No image present at all; you only know that you are thinking of the object. High scores indicate low imagery and vice versa. In the present study, a Cronbach's alpha of .92 was obtained.
Procedure
The first step involved translating the AIQ (Hishitani, 2009) and the AIS into Spanish; subsequently, back translation into English by a second translator without referring to the original English version of the questionnaires. Thereafter, with the assistance of the translating team, the final version of the questionnaires was designed.
In groups of approximately 20 students, the Spanish versions of the AIQ, the AIS, the CAIS, and the Betts' QMI were randomly administered in their usual classrooms. All students were guaranteed that their results would remain anonymous and confidential. The study was conducted in accordance with ethical rules contained in the Declaration of Helsinki of 1964. Written informed consent was obtained from each participant.
Data Analysis
Statistical analysis was performed using the SPSS 22.0 software program and IBM SPSS Amos 22. The internal consistency of the tests was calculated by the Cronbach's alpha.
To assess, if hypothesis generated by the original studies was confirmed, we performed a confirmatory factor analysis (CFA) using SPSS Amos software, 22 version (IBM), which gives model fitting indicators (Jöreskog & Sörbom, 1993, 1999).
Two CFAs were tested: one one factored and other two factored. Those were the model using two factors proposed by Hishitani (2009) for the AIQ and the model using one factor suggested by Gissurarson (1992) for the AIS.
Global fit for models were assessed using six indexes: the χ2 to its degrees of freedom (df) ratio—because this index alone is very sensitive to sample size (Jöreskog & Sörbom, 1993)— the goodness of fit index (GFI), the comparative fit index (CFI), the non-normed fit index (NNFI), the root mean square error of approximation (RMSEA), and the standardized root mean square residual (SRMR). Values of the χ2 to df ratio between 0 and 3 are suggested for good fit (Bollen & Long, 1993). For GFI values more than .90 are recommended, while values equal to .95 or higher are recommended for CFI and NNFI (Hu & Bentler, 1999; Jöreskog & Sörbom, 1993, 1999). Values equal to .08 or lower are recommended for RMSEA and SRMR (Browne & Cudeck, 1993).
The internal consistency of the tests was calculated by the Cronbach's alpha.
Student's t test was performed to determine any statistically significant differences in the scores obtained by women and men. Finally, the Pearson product–moment correlation coefficient correlated the AIQ and the AIS with the other imagery tests.
Results
Auditory Imagery Questionnaire
Mean scores on AIQ were 2.30 for women (SD = .57) and 2.21 for men (SD = .56); with no significant difference, t(442) = 1.66, p = .10, between women and men.
Figure 1 shows standardized coefficients for the proposed model, with values ranging between .40 (Item 5) and .67 (Item 3). All values were statistically significant (p < .001). The two factors relationship estimated by the model was .39, statistically significant.
Two-factor model of auditory imagery questionnaire.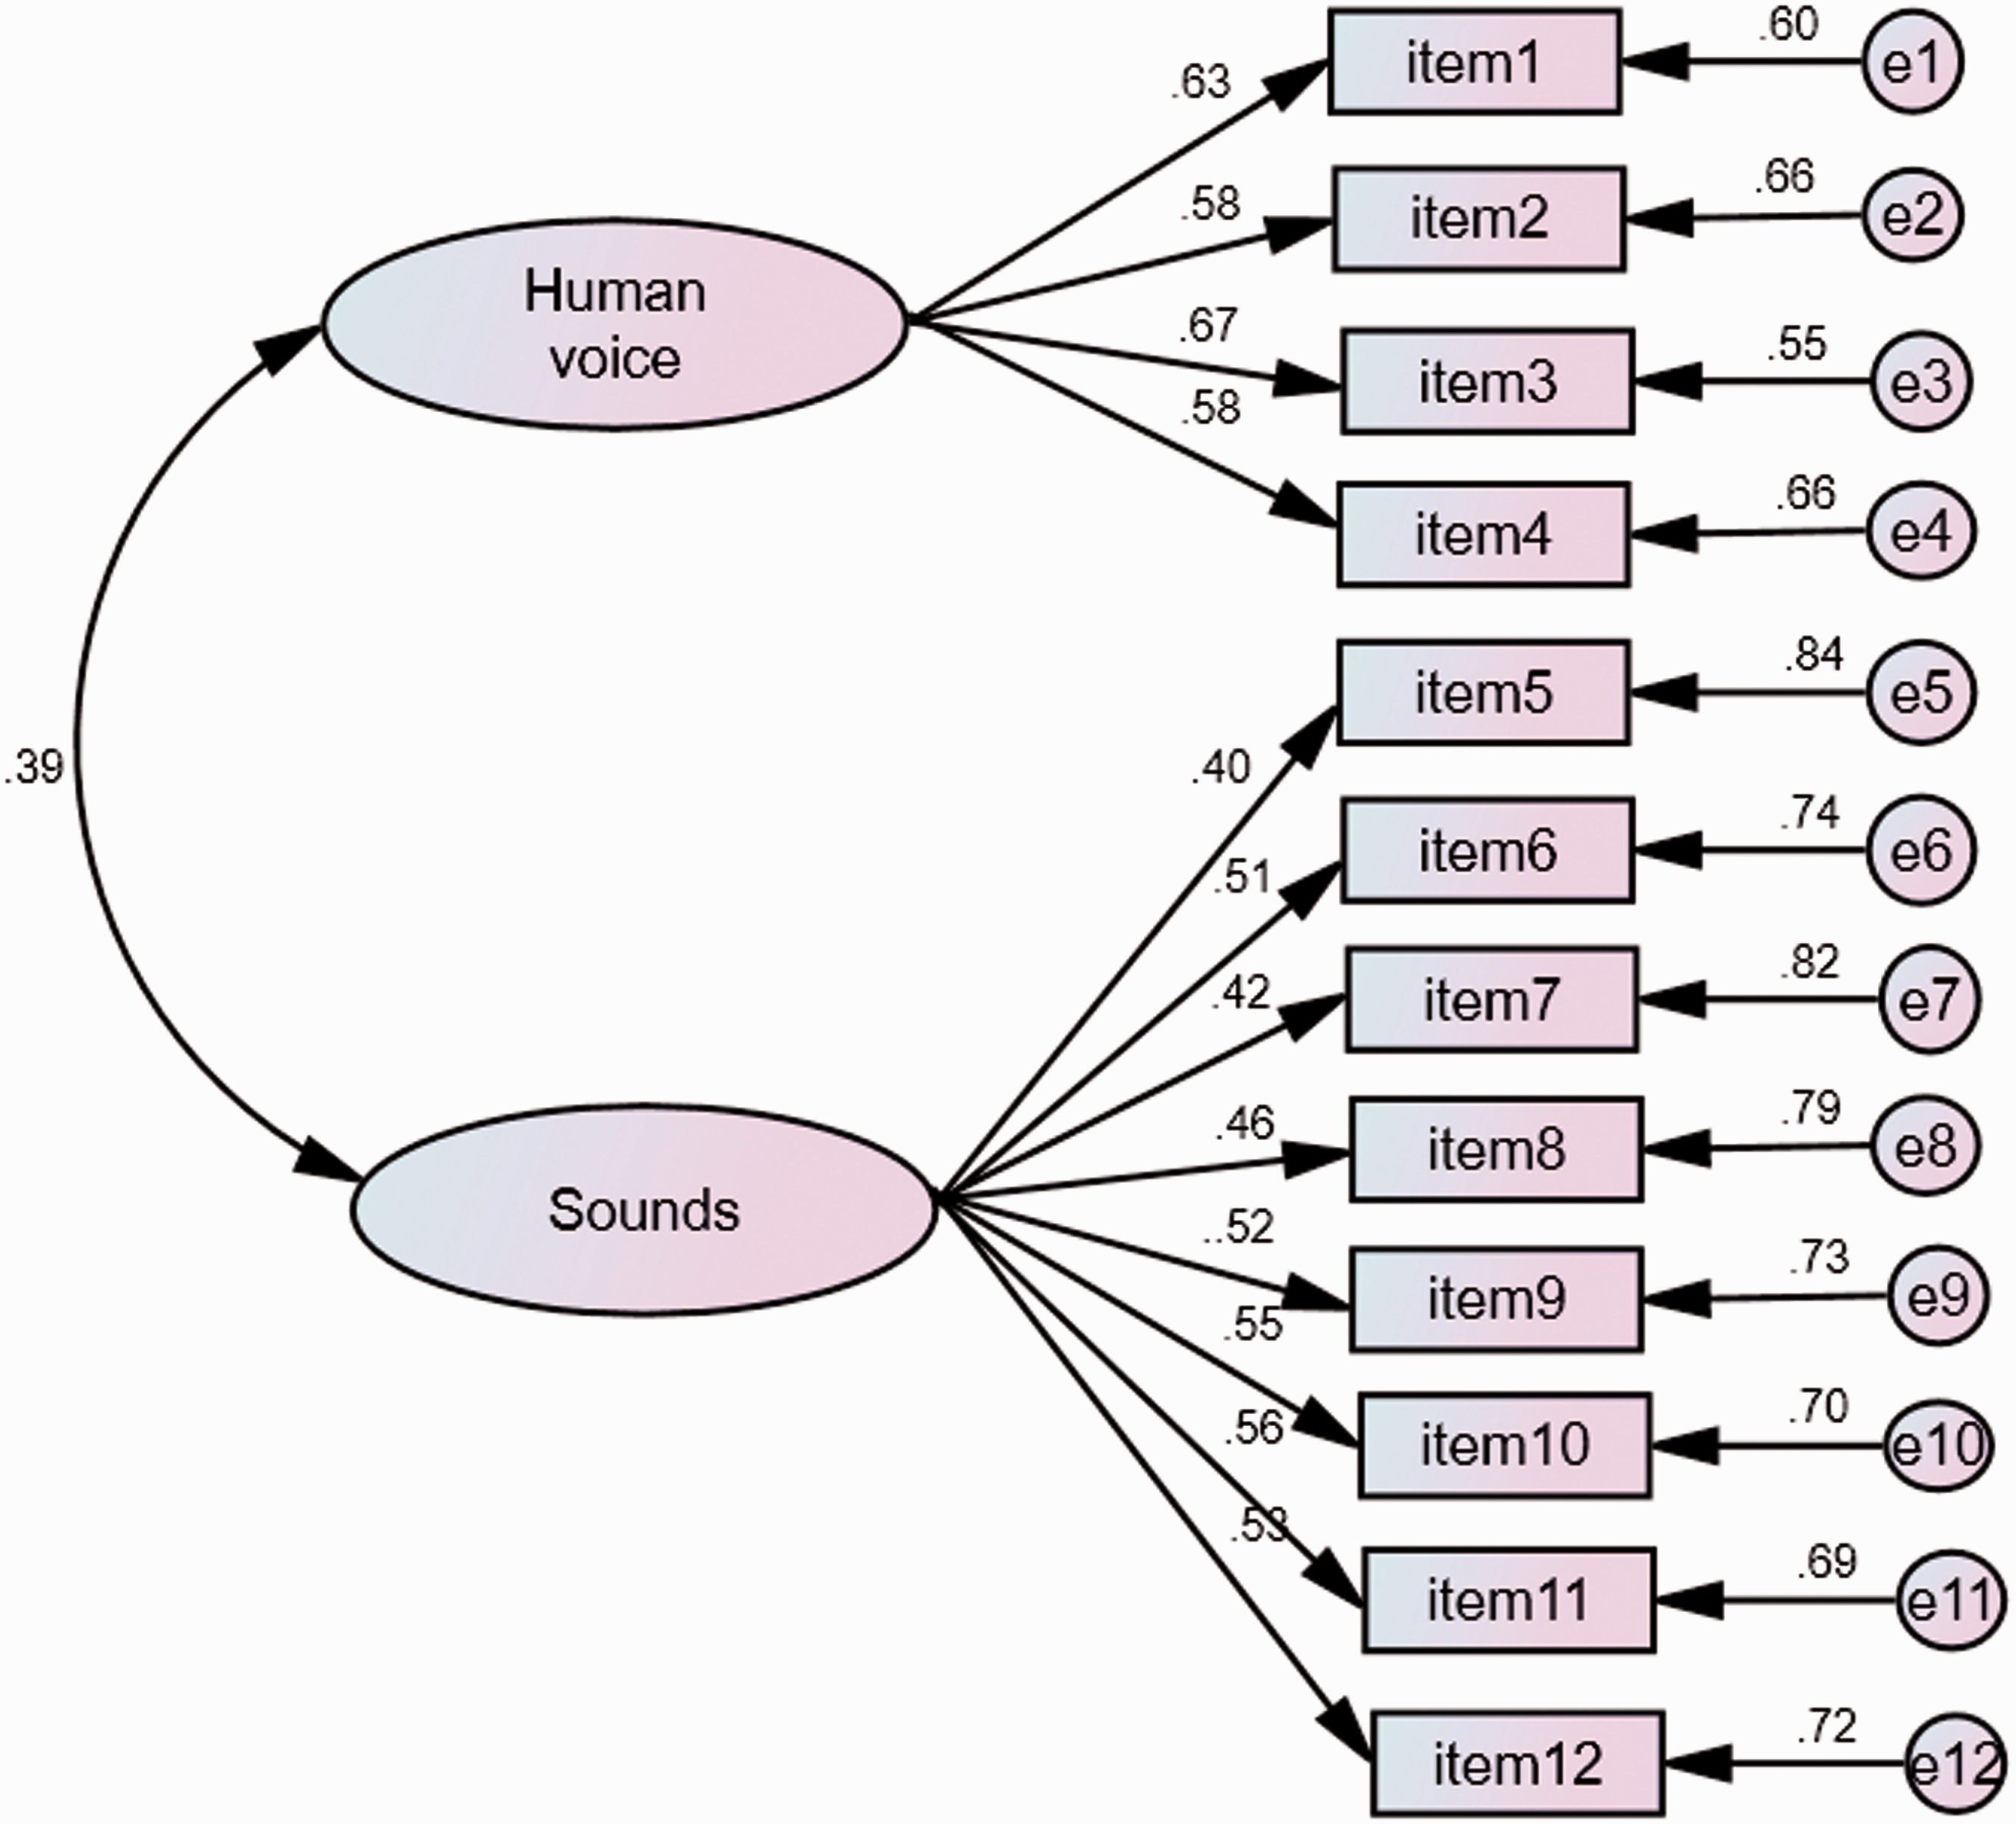
These values suggested an acceptable fit for the model. χ2 (203.05) and df (53) ratio was 3.83 (p < .001). Index values were GFI (.92), CFI (.84), and NNFI (.80). RMSEA and SRMR values were .08 and .07.
The AIQ correlated .44 with the AIS, −.48 with the CAIS, and .59 with the Betts' QMI. The AIQ correlated with the scales on Betts' QMI as follows: .42 visual, .49 auditory, .55 cutaneous, .47 kinesthetic, .36 gustatory, .47 olfactory, and .28 organic scales. All correlations were significant (p < .001).
Auditory Imagery Scale
Mean scores on AIS were 1.80 for women (SD = .37) and 1.81 for men (SD = .42); with no significant difference, t(442) = .28, p = .78, between women and men.
Figure 2 shows standardized coefficients for the proposed model, with values ranging between .21 (Item 7) and .54 (Items 3 and 4). All values were statistically significant (p < .001).
One-factor model of auditory imagery scale.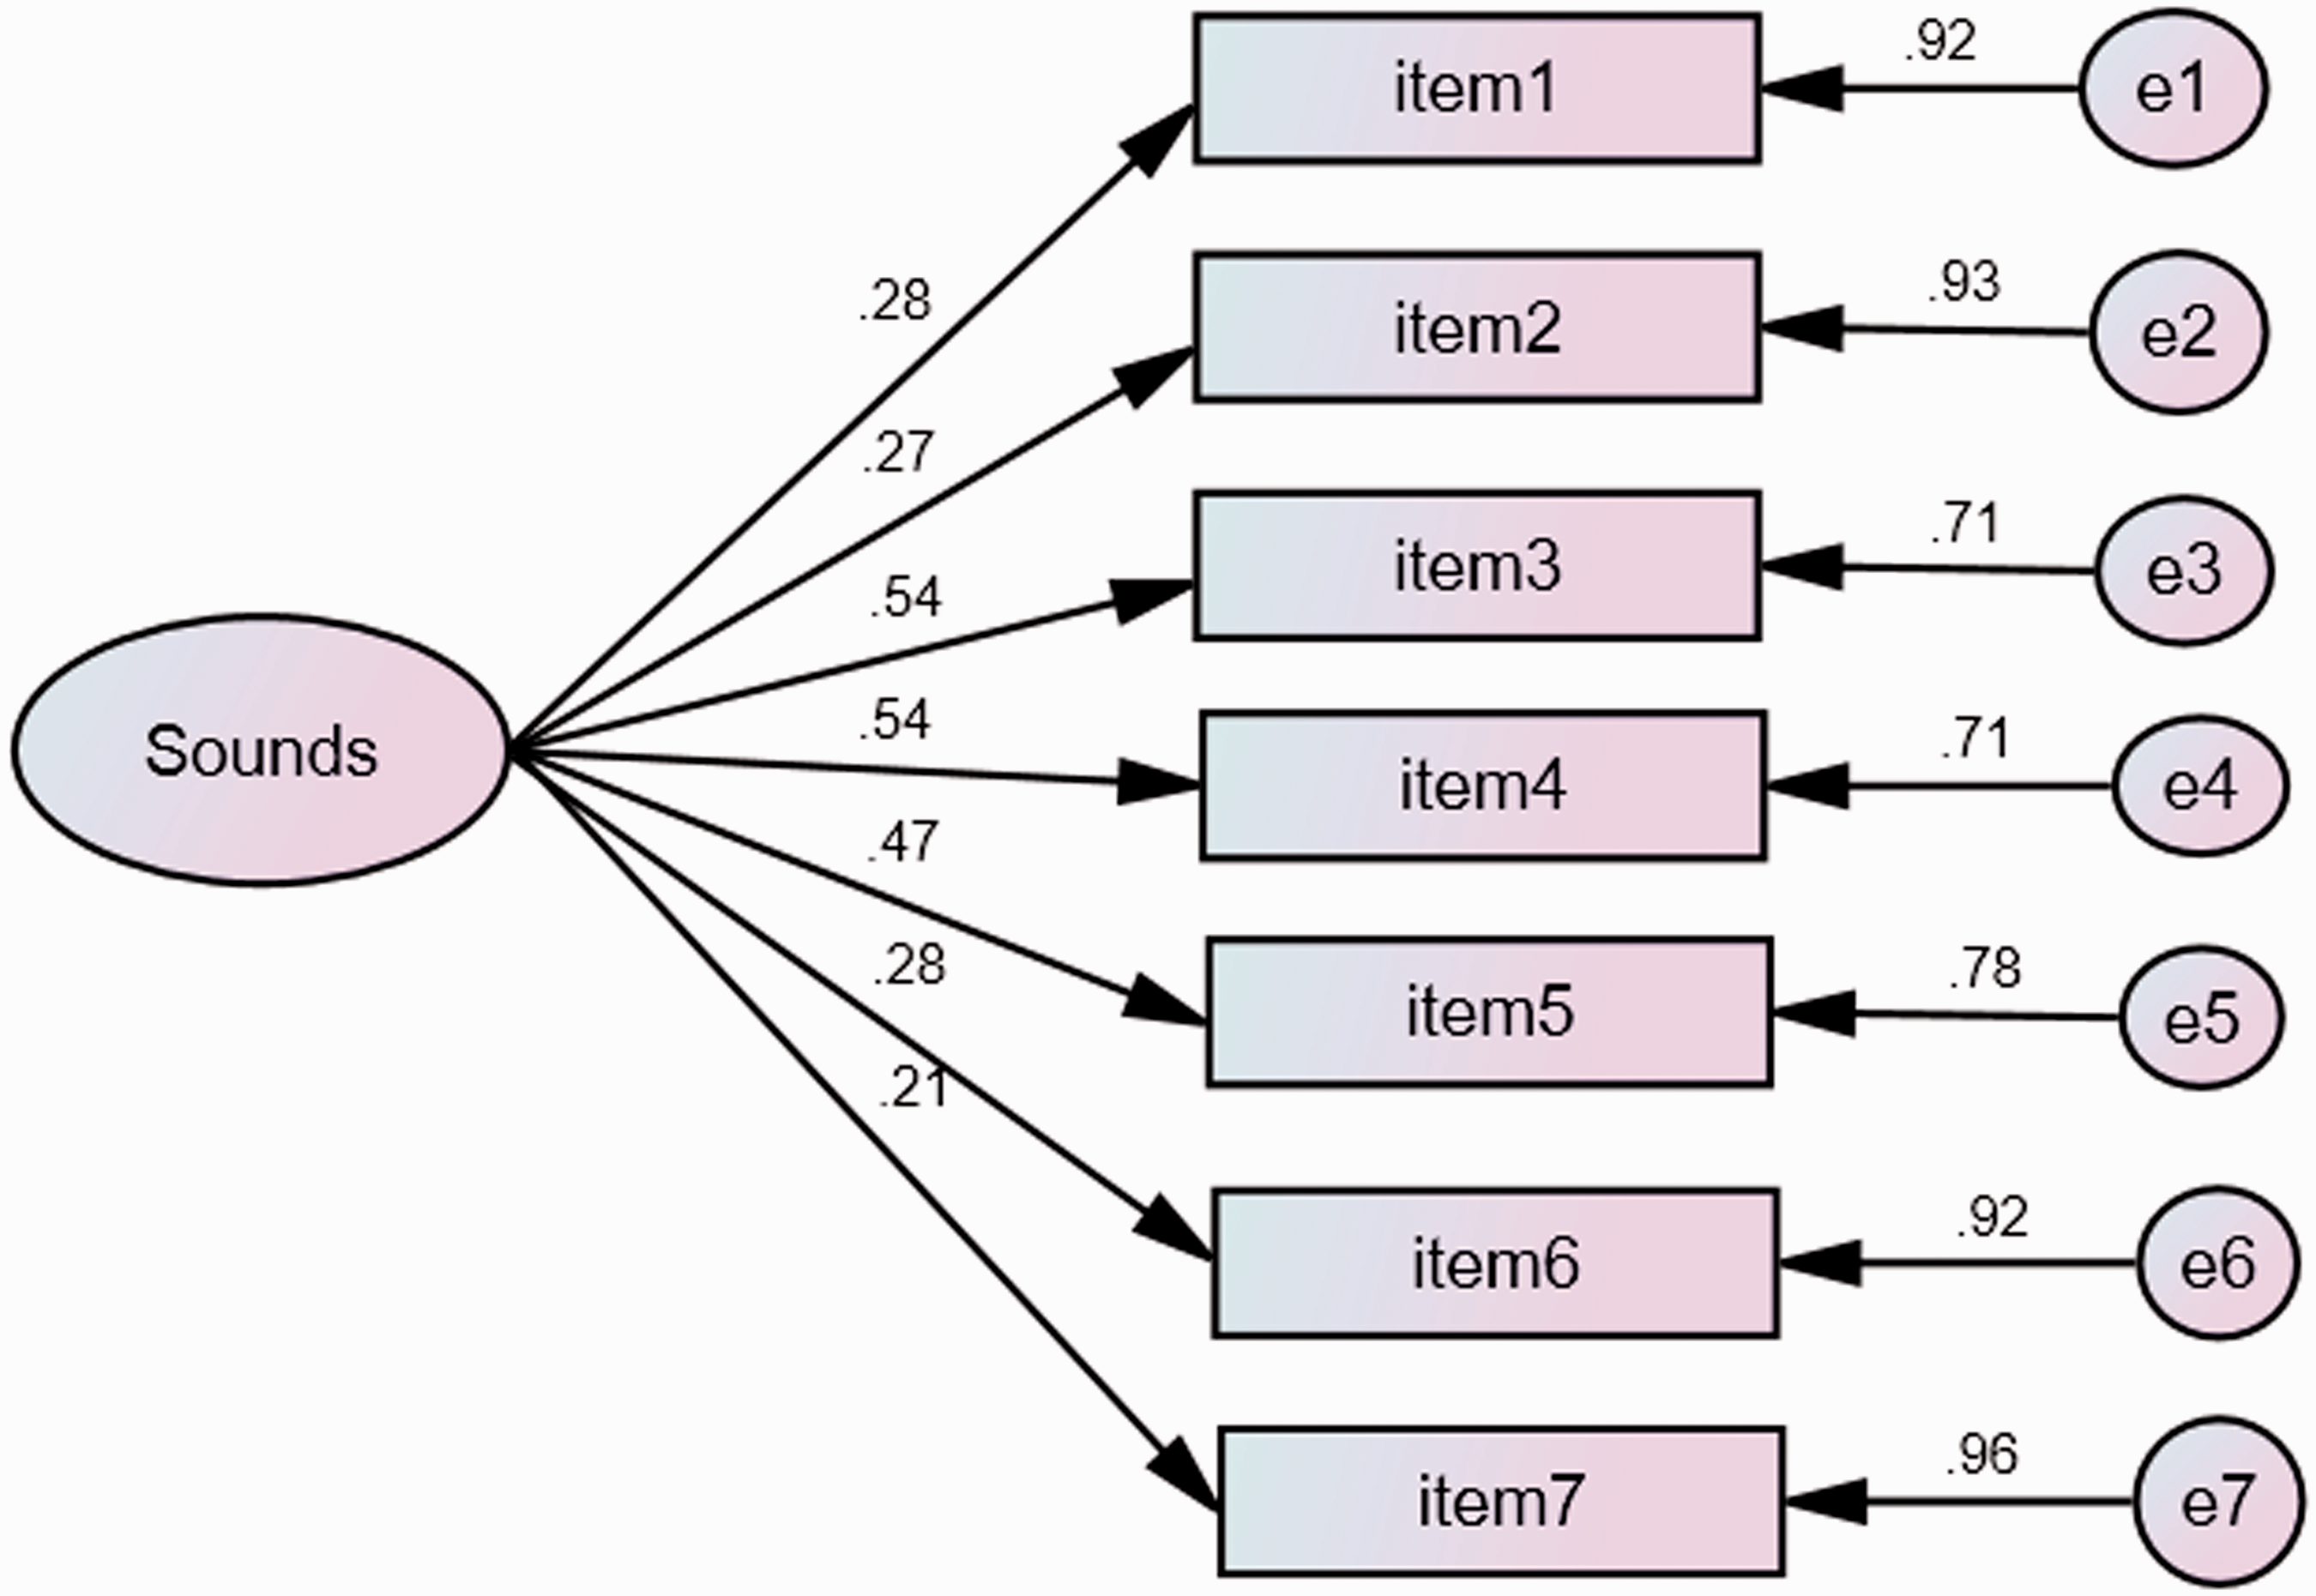
Obtained values suggested an acceptable fit for the model. χ2 (28.70) and df (14) ratio was 2.05 (p < .001). Index values were GFI (.98), CFI (.91), and NNFI (.86). RMSEA and SRMR values were .05 and .04.
The AIS correlated −.49 with the CAIS and .37 with Betts' QMI. The AIS correlated with each of the scales on the Betts' QMI as follows: .32 visual, .40 auditory, .35 cutaneous, .30 kinesthetic, .20 gustatory, .19 olfactory, and .17 organic scales. All correlations were significant (p < .001).
Discussion
As for the reliability of the AIQ, a Cronbach's alpha of (.74) was obtained, which was similar to Hishitani (2009). No significant differences were found between the AIQ scores of women and men. This result was similar to the findings of other studies on auditory imagery tests (Campos & Fuentes, 2016; Campos & Pérez-Fabello, 2011; Gissurarson, 1992; Willander & Baraldi, 2010).
CFA found two factors, the same number as Hishitani (2009), thus the Spanish version of the AIQ had the same factors as the original version, and a similar Cronbach's alpha. The correlations of the AIQ with the AIS, the CAIS, and each of the scales on the Betts' QMI were significant (p < .001) and very similar to those found for the correlation between the AIQ and the VVIQ (Hishitani, 2009; Marks, 1973).
In terms of the reliability of the AIS, the Cronbach's alpha obtained was .63, which is “questionable,” according to the classification of George and Mallery (2003) and was much lower than that obtained by Gissurarson (1992). No significant differences were found between women and men on the AIS scores, which corroborated the studies analyzing gender differences in auditory imagery (Campos & Fuentes, 2016; Campos & Pérez-Fabello, 2011; Gissurarson, 1992; Willander & Baraldi, 2010).
CFA found one factor, thus the Spanish version of the AIS has the same structure as the original version (Gissurarson, 1992). The correlations of the AIS with the AIQ, the CAIS, and each of the scales on the Betts' QMI were significant (p < .001) and similar to that found by Gissurarson (1992) when the AIS was correlated to the VVIQ (Marks, 1973).
Further studies are required to examine the relationships between these questionnaires and other measures of imagery, and a range of auditory imagery vividness. Moreover, work is required to raise the degree of reliability of these tests, and in particular the AIS.
Footnotes
Appendix 1
Appendix 2
Author Note
The author acknowledges the contribution of Shinsuke Hishitani and of Loftur R. Gissurarson for granting permission to use and publish the Spanish version of the Auditory Imagery Questionnaire (AIQ; Hishitani, 2009) and the Spanish version of the Auditory Imagery Scale (AIS; Gissurarson, 1992).
Declaration of Conflicting Interests
The authors declared no potential conflicts of interest with respect to the research, authorship, and/or publication of this article.
Funding
The authors received no financial support for the research, authorship, and/or publication of this article.