
Abstract
Imagery is used in intellectual disability education; however, previous findings on imagery abilities in intellectual disabilities are inconsistent. This study examined the visual and multisensory imagery abilities of individuals with intellectual disabilities and assessed their response reliability. Twenty-six individuals with mild intellectual disabilities (ID) and 34 with typical development (TD) completed the questionnaire on vividness of visual imagery (VVIQ) and multisensory imagery (QMI) twice (first and second sessions). The results showed significant group differences in the VVIQ total score and some VVIQ subfactors only in the first session, but not in the QMI. These VVIQ subfactors showed poor or borderline moderate reliability in ID; however, other VVIQ subfactors and the QMI showed moderate or good reliability. The poor or borderline moderate reliability of the VVIQ may result from language expression/comprehension issues. This study suggests that caution is needed when interpreting the response reliability of some VVIQ subfactors in ID.
Introduction
Mental imagery (hereafter called “imagery”) is “when a representation of the type created during the initial phases of perception is presented, but the stimulus is not actually perceived” (Kosslyn et al., 2006). There are large individual differences in imagery (hereafter called “imagery ability”), with several dimensions such as vividness (how vivid visual imagery is; Marks, 1973), controllability (how well imagery can be manipulated; Gordon, 1949), cognitive style (dominance of visual or verbal processing; Richardson, 1977), and absorption in imagination (degree of absorption in imagination; Tellegen & Atkinson, 1974). Imagery ability is important in many learning contexts, including such as associative learning, language learning, reading, creative production, and problem solving (Antonietti & Colombo, 2011; Fastame, 2021; Guarnera et al., 2017; Paivio, 1969; Pressley, 1976). The significance of imagery abilities has also been discussed in intellectual disability education (e.g., de la Iglesia et al., 2004; de la Iglesia et al., 2005; Jens et al., 1990; Screws & Surburg, 1997; Surburg et al., 1995). Although some speculate about the effectiveness of imagery abilities in intellectual disability education, it remains unclear whether the imagery function in individuals with intellectual disabilities has been clarified.
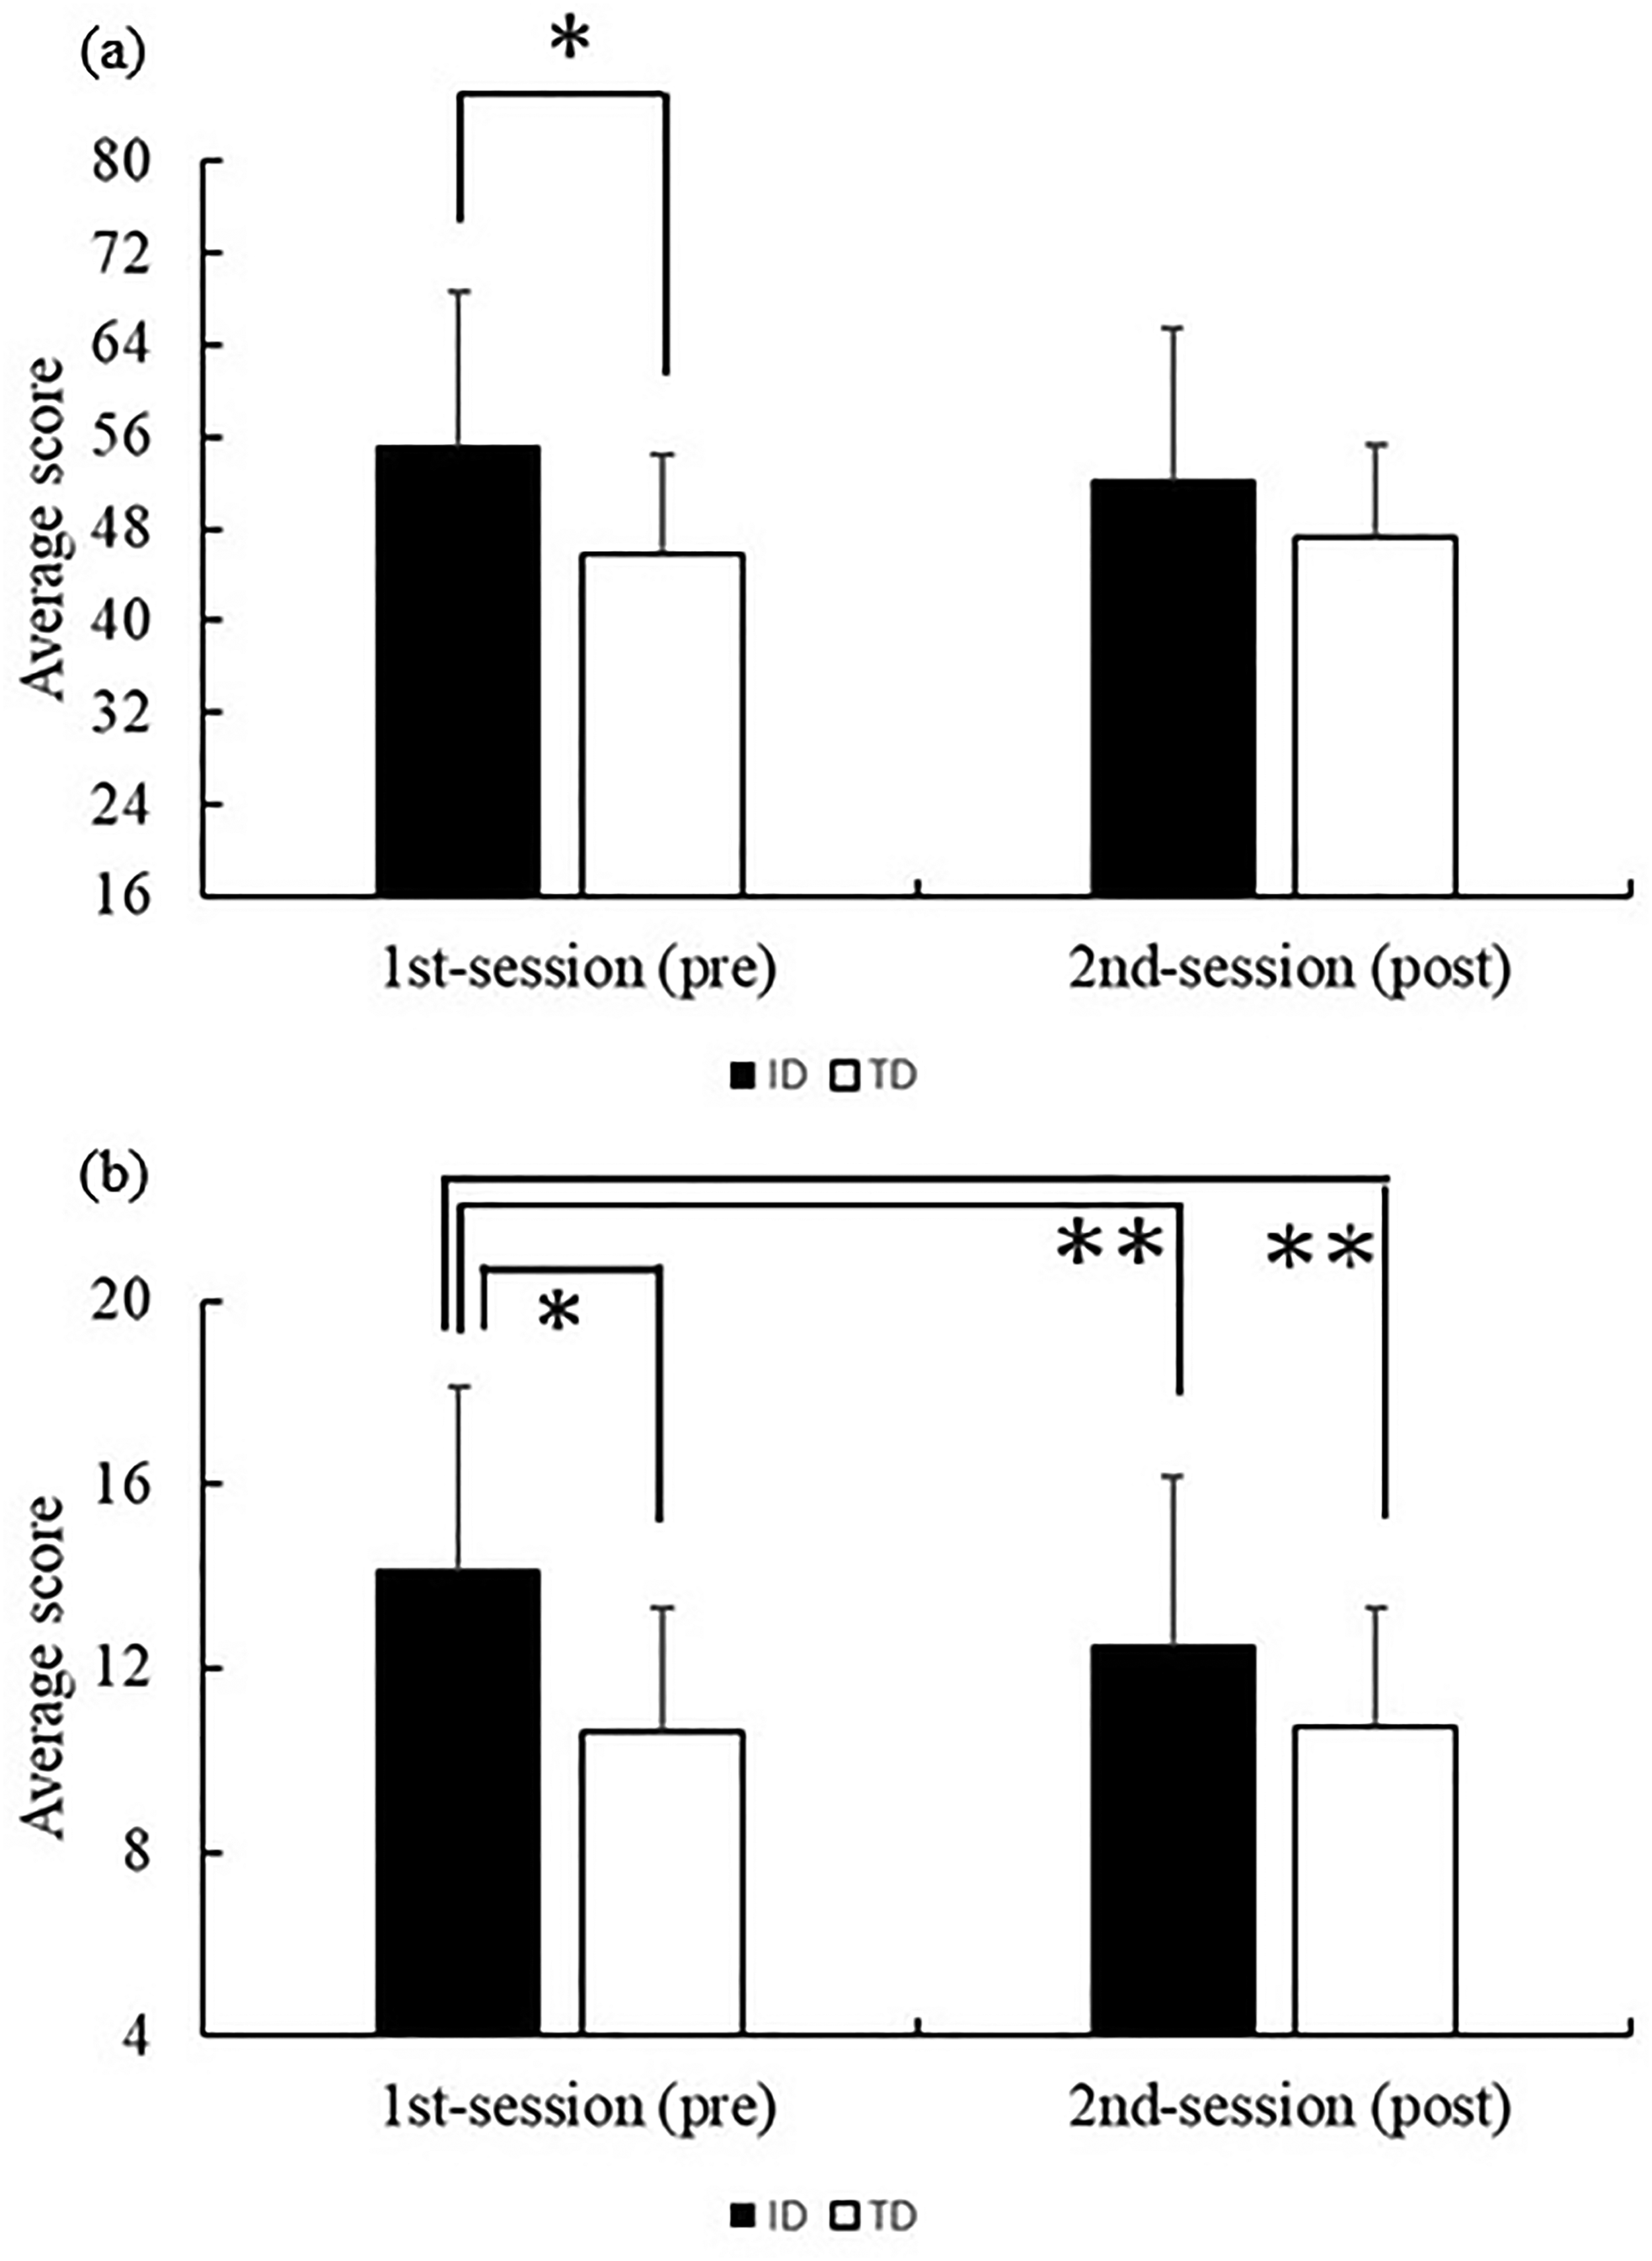
Group differences in significant interactions between the ID and TD groups. (a) Results for VVIQ full: (b) results for the “country scene” subfactor.
Imagery Abilities of Individuals with Intellectual Disabilities
Research on the imagery abilities of individuals with intellectual disabilities has produced inconsistent results, with more studies focused on adults than children. Imagery processing consists of four stages—generation, inspection, maintenance, and transformation (Kosslyn et al., 2006). It reviews on the imagery abilities of individuals with intellectual disabilities across these stages (see Hewitt, Steel et al., 2022). Hewitt, Steel et al. (2022) summarized that, in the generation stage, tasks included creating imagery of random patterns (Courbois, 1996), meaningful stimuli (Brougham et al., 2020; Brown & Bullitis, 2006), using imagery as a memory strategy (Gibson et al., 1995), and practicing motor skills through imagery (Hemayattalab & Movahedi, 2010). Results varied, with some studies reporting better performance among individuals with intellectual disabilities (Brougham et al., 2020), others reporting poorer performance compared to individuals with typical development (Brown & Bullitis, 2006; Hemayattalab & Movahedi, 2010), and some showing mixed results (Courbois, 1996). In the inspection stage, tasks assessed the ability to distinguish between performed and imagined activities (Gordon et al., 1994), showing good performance among individuals with intellectual disabilities (Gordon et al., 1994), while location imagery tasks showed mixed results (Courbois, 1996; Di Nuovo et al., 2018). In the maintenance stage, visual working memory tasks (Carretti et al., 2021; Courbois, 1996; Di Nuovo et al., 2018) showed both good performance (Di Nuovo et al., 2018) and mixed results (Courbois, 1996). In the transformation stage, mental rotation tasks (e.g., Courbois, 1996; Hinnell & Virji-Babul, 2004) revealed both good performance (Hinnell & Virji-Babul, 2004) and mixed results (Courbois, 1996).
An overview of imagery processing stages (generation, inspection, maintenance, and transformation; Kosslyn et al., 2006) shows that individuals with intellectual disabilities can generate imagery at the generation stage, which is considered lower order. Thus, imagery generation is generally not problematic for individuals with intellectual disabilities. However, results at higher-order stages, such as the transformation stage, are inconsistent (see also, Hewitt, Steel et al., 2022). In addition to these stages, outcomes may vary depending on factors such as the task type, task complexity, and level of intellectual disability. Continued research is needed to examine how these factors and imagery processing stages affect imagery abilities.
Other disabilities, in addition to intellectual disabilities, can affect imagery abilities. For example, autism involves sensory impairment (e.g., Kiani & Miller, 2010), and research indicates that autistic individuals have impaired visual imagery abilities (e.g., Maróthi et al., 2019). Therefore, studying imagery abilities in individuals with intellectual disabilities, it is important to consider whether the research focuses solely on intellectual disabilities or includes cases where intellectual disabilities overlap with other disabilities, as this distinction may influence the results.
Vividness of Imagery in Individuals with Intellectual Disabilities Assessed by Questionnaire Methods
Experimental studies are important for rigorously examining the imagery abilities of individuals with intellectual disabilities. While the inspection (e.g., detection task), maintenance (e.g., memory task), and transformation (e.g., mental rotation) stages can be tested experimentally, the generation stage is more challenging. For example, Pearson (2014) proposed the binocular-rivalry imagery paradigm to experimentally assess the generation stage. However, this paradigm requires individual perceptual experiments, which may be difficult for some individuals, such as those with intellectual disabilities. Additionally, the binocular-rivalry imagery paradigm measures visual imagery abilities in terms of visual perception but does not capture abilities across various categories relevant to daily life. Therefore, although this paradigm can assess visual imagery abilities, it is unsuitable for defining individual differences in the vividness of these abilities. In contrast, the questionnaire method allows for the examination of individual differences as continuous variables, offering advantages for studying the generation stage. Using questionnaires, researchers can test whether previous findings at the generation stage can be replicated and whether individuals with intellectual disabilities generate imagery or not. This approach also enables the presentation of findings on the imagery abilities of individuals with intellectual disabilities from the perspective of individual differences.
Questionnaire methods offer notable advantages for research involving individuals with intellectual disabilities. Depending on an individual's living situation or disability, conducting sufficient experimental studies may not be feasible, making simpler approaches necessary. Questionnaires allow for quantitative analysis and straightforward data collection. They are widely used to assess vividness of visual imagery without restricting the target population and have been adopted by both individuals with disabilities and typically developing individuals in various studies. In educational settings, both strict experimental and questionnaire-based methods may be useful for assessing imagery abilities.
The Vividness of Visual Imagery Questionnaire (VVIQ; Marks, 1973) assesses the vividness of visual imagery and is widely used in imagery research due to its validity and reliability. The VVIQ also evaluates visual imagery ability in individuals with intellectual disabilities; however, only two studies have addressed this population (Hewitt, Langdon et al., 2022; Syed et al., 2020). This limited research may be due to the cognitive and linguistic challenges associated with self-reported questionnaires for individuals with intellectual disabilities. Syed et al. (2020) used the VVIQ-2 (Marks, 1995) to compare visual imagery ability among individuals with mild, moderate, and severe intellectual disabilities and typically developing individuals. Participants with intellectual disabilities did not include those with other disabilities, such as autism. Results showed that individuals with mild or moderate intellectual disabilities had visual imagery abilities comparable to those with typical development, while those with severe intellectual disabilities had the lowest abilities among the groups. These findings suggest that visual imagery abilities may be functional in individuals with mild or moderate intellectual disabilities. Hewitt, Langdon et al. (2022) also administered the VVIQ (Marks, 1973) to 10 individuals with mild-to-moderate intellectual disabilities but did not report detailed results, as their primary focus was on the lived experiences of imagery. However, participants’ reports of their imagery experiences suggest that their visual imagery abilities were functional, consistent with the findings of Syed et al. (2020).
Current Study
Hewitt, Langdon et al. (2022) and Syed et al. (2020) used VVIQ (or VVIQ-2) to study visual imagery abilities, analyzing VVIQ as a single factor. However, VVIQ includes four subfactors: “relative and friend,” “rising sun,” “familiar shop,” and “country scene” (Kihlstrom et al., 1991). Because the vividness of visual imagery differs across categories (Dijkstra et al., 2017), each subfactor should be analyzed separately to identify possible differences in vividness. These studies found that individuals with mild intellectual disabilities had imagery abilities comparable to those with typical development. While Syed et al. (2020) used total VVIQ scores, the present study uses all four subfactors to allow for more detailed investigation. This is the first purpose of the current study.
Although previous studies (Hewitt, Langdon et al., 2022; Syed et al., 2020) focused on visual imagery, there are multiple imagery modalities (e.g., Belardinelli et al., 2009), such as auditory and tactile imagery, in addition to visual imagery. Therefore, it is important to consider the multisensory imagery abilities of individuals with intellectual disabilities. The Questionnaire upon Mental Imagery (QMI; Betts, 1909; shortened version: Sheehan, 1967) has been used in many studies to examine multisensory imagery abilities. The QMI assesses seven imagery modalities: visual, auditory, cutaneous, kinesthetic, gustatory, olfactory, and organic. It may provide useful findings for studying the multisensory imagery abilities of individuals with intellectual disabilities. This is the second purpose of the current study.
Concerns exist regarding the reliability of participants’ responses, as previous research has identified reliability issues in questionnaires for individuals with intellectual disabilities (Hartley & MacLean, Jr., 2006). Therefore, the present study should confirm response reliability to imagery questionnaires to provide clearer insights into the stability of responses to the VVIQ and QMI among individuals with intellectual disabilities. This is the third purpose of the current study.
Hypotheses
This study examined visual and multisensory imagery abilities, as well as response reliability in individuals with mild intellectual disabilities based on three hypotheses (H1 to H3). The first aim was to compare visual imagery abilities, specifically, the four subfactors of the VVIQ, between individuals with intellectual disabilities and those with typical development. Syed et al. (2020) reported that individuals with mild intellectual disabilities and those with typical development showed similar visual imagery abilities when using VVIQ total scores but did not analyze subfactors. If individuals with intellectual disabilities have similar visual imagery abilities across all categories, as indicated by the total scores in Syed et al. (2020), no group differences would be expected for any subfactor (H1).
The second purpose was to compare multisensory imagery abilities between individuals with intellectual disabilities and those with typical development. If individuals with intellectual disabilities show similar multisensory imagery abilities across sensory modalities, as observed in visual imagery by Syed et al. (2020), then no group differences would be expected across sensory modalities (H2).
The third purpose was to confirm the response reliability of individuals with intellectual disabilities. Hartley and MacLean, Jr. (2006) found that individuals with intellectual disabilities often provide unstable responses because they tend to respond to reliability issues in questionnaires. If this issue also occurs when measuring imagery ability, the reliability coefficients from the test-retest method may differ between individuals with intellectual disabilities and typically developing individuals (H3). The reliability coefficient shows the stability or consistency of assessment scores and serves as an indicator of score stability for individuals with intellectual disabilities.
Methods
Participants
A total of 26 individuals with intellectual disabilities (14 men and 12 women; mean age = 27.23 years, SD = 4.47) and 34 individuals with typical development (14 men, 19 women, and one non-responder; mean age = 29.74 years, SD = 6.29) participated in the study. There was no significant difference in mean age between the groups (t[58] = 1.72, p = .09).
All participants were Japanese. Individuals with intellectual disabilities were recruited by a special subsidiary company as requested by the author. All the participants had mild intellectual disabilities and held special education record books (ryoiku techo: a government-issued rehabilitation handbook for individuals with intellectual disabilities) with a grade of B2 or 4, which are officially classified as “Mild Intellectual Disabilities” in the Japanese welfare system. This classification is consistent with international diagnostic standards (e.g., DSM-5 [American Psychiatric Association, 2013]) for mild intellectual disabilities.
To ensure response reliability, professional staff from a specialized agency with experience working with individuals with intellectual disabilities supported the assessment. The support was standardized using an instructional script. Staff provided only necessary clarifications and avoided verbal or non-verbal cues that could influence participants’ ratings.
To align the study conditions with those of Syed et al. (2020), participants with disabilities other than intellectual disabilities (such as autism) were excluded. One participant was diagnosed with both intellectual and physical disabilities, but no other participants had diagnoses such as autism, Down syndrome, or other disabilities. The group with typical development included 18 individuals from the public and 16 undergraduate or graduate students from Fukushima University; none reported intellectual or developmental disabilities or psychiatric disorders. Public participants had 12–18 years of education (from high school to graduate level), and most worked in office jobs.
Questionnaires were distributed to participants after they received a comprehensive explanation of the study and provided informed consent. All participants gave informed consent to participate and responded anonymously. For individuals with intellectual disabilities, the contact person at the special subsidiary company explained the study details individually, and these participants responded after understanding the content.
All participants, including those with intellectual disabilities and those with typical development, individually read the following instructions in text form (see also, Marks & Isaac, 1995) and responded at their own pace: “The purpose of this questionnaire is to determine the vividness of your visual imagery. Please evaluate the vividness of each visual imagery according to a rating scale. For each item, please answer how vividly you can picture the imagery in your mind. The evaluation was conducted as follows: 1: no image at all, you only ‘know’ that you are thinking of an object, 2: vague and dim, 3: moderately clear and vivid, 4 = clear and reasonably vivid, and 5: perfectly clear and as vivid as normal vision. Please do not think too hard about it; just answer as you feel.”
In 1 to 4 items (“relative and friend” subfactors), the following instruction was presented: Think about a relative or friend you often see (but who is not here) and carefully observe the picture that comes to mind. Next, the participants were presented with four items, such as
The exact contour of face, head, shoulders and body Characteristic poses of face, head, shoulders and body The precise carriage, length of step etc. in walking The different colors worn in some familiar clothes
Instructions were also provided for items 5 to 8 (“rising sun” subfactors), items 9 to 12 (“familiar shop” subfactors), and items 13 to 16 (“country scene” subfactors).
For participants with intellectual disabilities, furigana was added to all kanji characters as instructed to ensure equal readability. Responses were collected as part of the subsidiary company's operations, under the supervision of a contact person. First, the contact person verbally explained the questionnaire contents, following the instructions described above. Each participant then read the instructions. Because the questionnaire was administered to all participants with intellectual disabilities at the same time, both the text and verbal instructions were standardized. Participants were encouraged to ask the contact person about any unclear sentences or words during the response process.
Materials
This study used the VVIQ (Japanese version; Hasegawa, 1993) to assess the visual imagery abilities in individuals with intellectual disabilities. The questionnaire includes four subfactors: “relative and friend,” “rising sun,” “familiar shop,” and “country scene” (Kihlstrom et al., 1991). Each subfactor contains four items rated on a five-point Likert scale from 1 (no image at all, you only “know” that you are thinking of the object) to 5 (perfectly clear and as lively as seeing it for real). Higher scores reflected greater vividness of visual imagery. The Japanese version of the VVIQ has demonstrated validity and reliability (Hasegawa, 1993).
The QMI (Japanese version: Tanabe & Hibino, 1986) assessed multisensory imagery abilities in individuals with intellectual disabilities by examining cognitive profiles related to multisensory imagery. The questionnaire included seven subfactors (modalities): visual, auditory, cutaneous, kinesthetic, gustatory, olfactory, and organic imagery (Sheehan, 1967). Each subfactor contained five items rated on a seven-point Likert scale from 1 (no image at all, you only “know” that you are thinking of the object) to 7 (perfectly clear and as lively as seeing it for real). Higher scores reflected greater vividness in sensory imagery. The validity and reliability of the QMI Japanese version have been confirmed (Watanabe et al., 2006).
Procedure
All participants receive a face-to-face explanation of questionnaire and methodology. The investigation included the VVIQ and QMI, each administered twice, with the second session occurring about one month after the first. All participants completed both sessions.
Ethical Considerations
The ethics committee of Fukushima University approved the study protocol (approval number: 2021–01).
Analysis
The VVIQ consisted of 16 items rated on a five-point Likert scale, with total scores ranging from 16 to 80 in the “VVIQ full” and from 4 to 20 for each subfactor; lower scores indicate weaker vividness of visual imagery. The QMI comprised 35 items rated on a seven-point Likert scale, with subfactor scores ranging from 5 to 35; lower scores indicate weaker vividness of multisensory imagery.
The present study set the significance level at α = .05 for all examinations. To address multiple comparisons across the 12 scales (VVIQ full, four VVIQ subfactors, and seven QMI subfactors), p-values were adjusted using the Benjamini-Hochberg procedure to control the false discovery rate (FDR). For items with significant interaction, post-hoc comparisons Holm's correction for multiple analysis. First, the study compared questionnaire rating scores between individuals with intellectual disabilities and those with typical development. Levene's test showed significant variance differences between these groups for almost all VVIQ and QMI subfactors (see Table 1). These results indicated that the homogeneity of variance assumption for parametric ANOVA was violated in some conditions. Therefore, the study used the Aligned Rank Transform (ART: Wobbrock et al., 2011) for mixed factorial designs, which enabled us to conduct ANOVA for non-parametric data, was performed on the obtained data, and a two-way mixed-design ANOVA was conducted using the ARTool R package (Kay et al., 2025). A two-way ANOVA with group (2; intellectual disability and typical development) as a between-participants factor and session (2; first and second sessions) as a within-participants factor was conducted for each VVIQ (relative or friend, rising sun, familiar shop, and country scene) and QMI (visual, auditory, cutaneous, kinesthetic, gustatory, olfactory, and organic) subfactors.
Internal Consistency (Cronbach's Alpha) for the VVIQ and QMI.
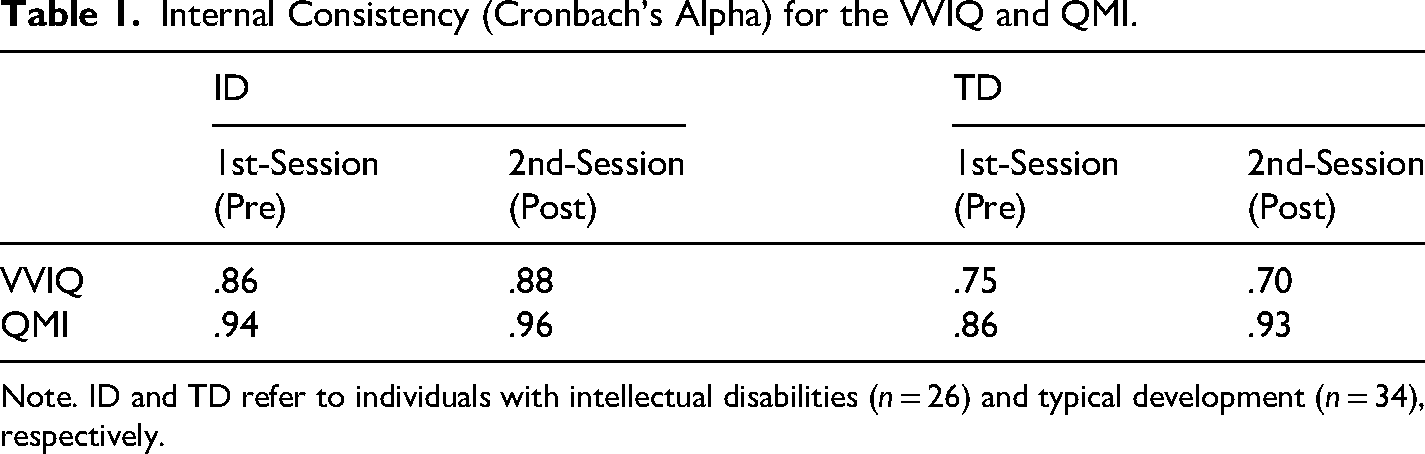
Note. ID and TD refer to individuals with intellectual disabilities (n = 26) and typical development (n = 34), respectively.
Second, the reliability coefficients between the first (pre-) and second (post-) sessions in the VVIQ and QMI were examined using intraclass correlation coefficients (ICC) to assess stability across sessions. Because many variances differed significantly, ICCs were estimated with maximum likelihood (ML) estimation, following the recommendation by Ten Hove et al. (2025) for planned incomplete data. The R package proposed by Ten Hove et al. (2025) was used to calculate ICCs with a two-way random effects model (ICC 2, 1). The degree of ICC was interpreted according to the criteria of Koo and Li (2016): values less than .5, indicated poor reliability, between .5 and .75 indicated moderate reliability, between .75 and .9 indicated good reliability, and greater than .9 indicated excellent reliability.
Results
The internal consistency for each subfactor of VVIQ and QMI was evaluated using Cronbach's α for each group and session (Table 2). Overall, internal consistency was acceptable, with α values ranging from .70 to .96.
Results of Levene's Test for the VVIQ and QMI.
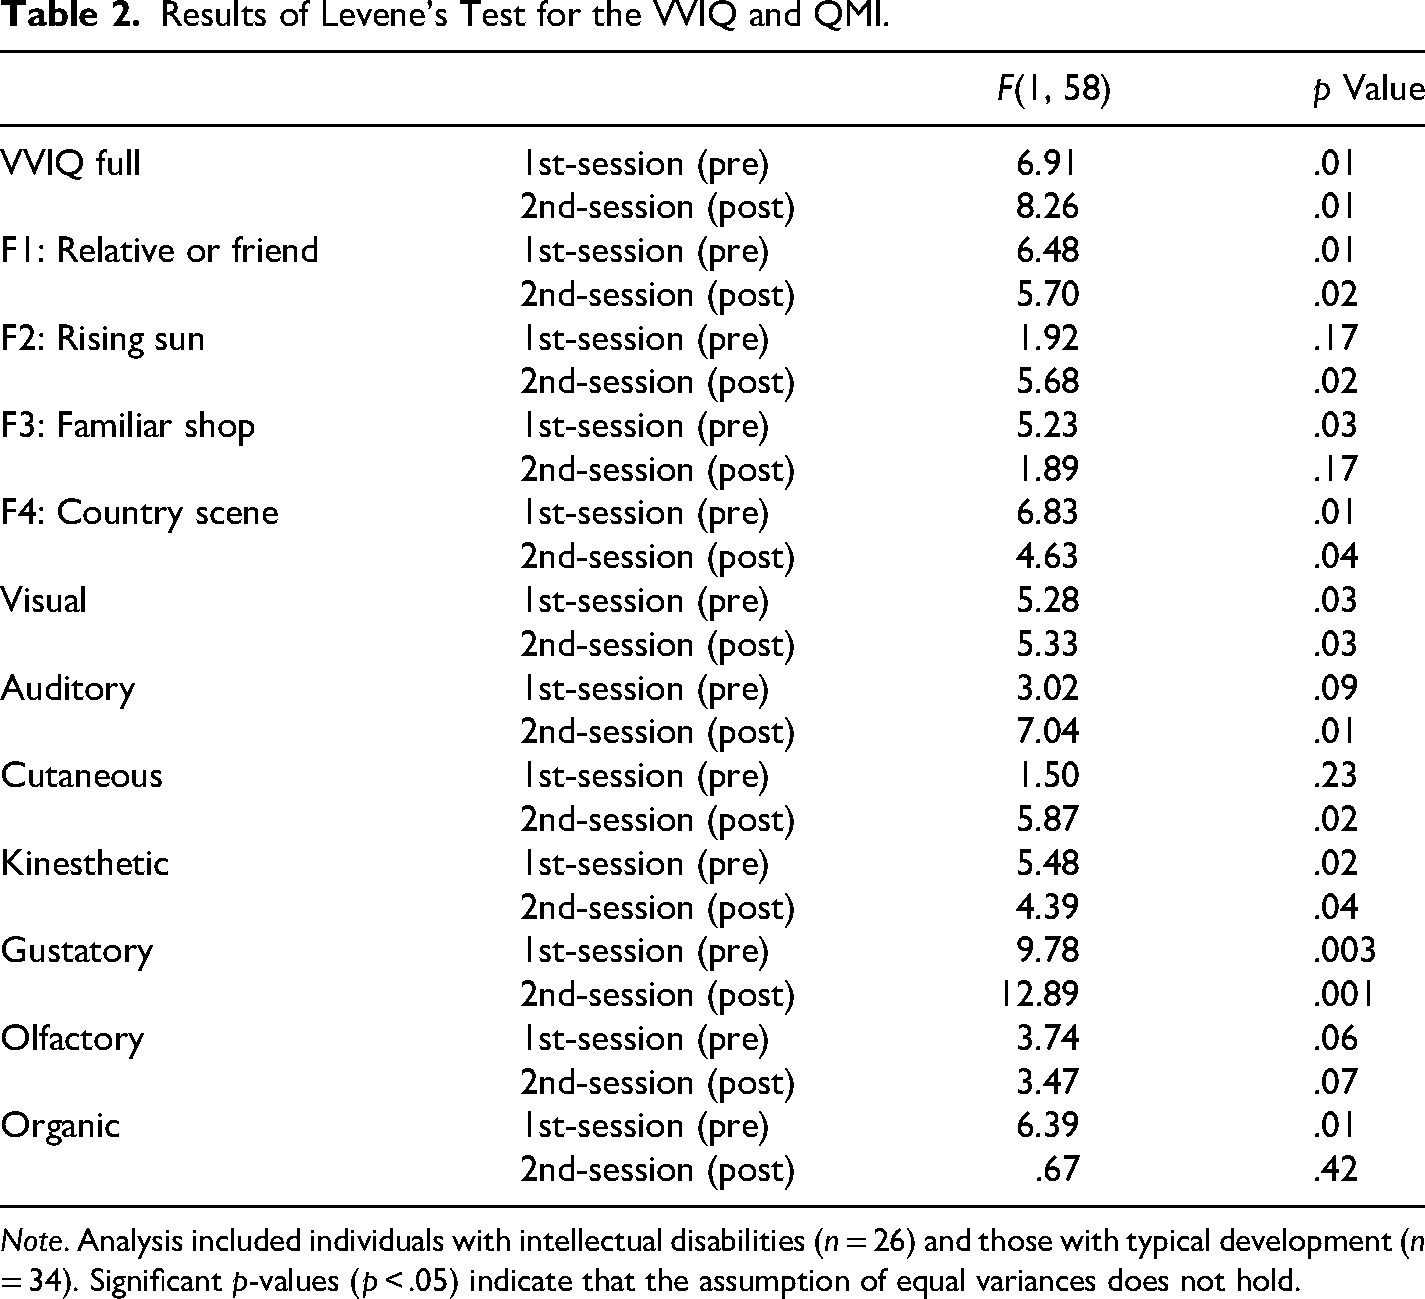
Note. Analysis included individuals with intellectual disabilities (n = 26) and those with typical development (n = 34). Significant p-values (p < .05) indicate that the assumption of equal variances does not hold.
Moreover, the correlation between the subfactors of VVIQ and QMI was calculated to assess convergent validity (Table 3). Because some subscales showed non-normal distribution and violated homoscedasticity, Spearman's rank correlation coefficients (rs) were used. The results indicate correlations approaching significance in individuals with intellectual disabilities (rs = .43–.87) and those with typical development (rs = .35–.72).
Spearman's Rank Correlation Matrix for the VVIQ and QMI in the ID and TD Groups.
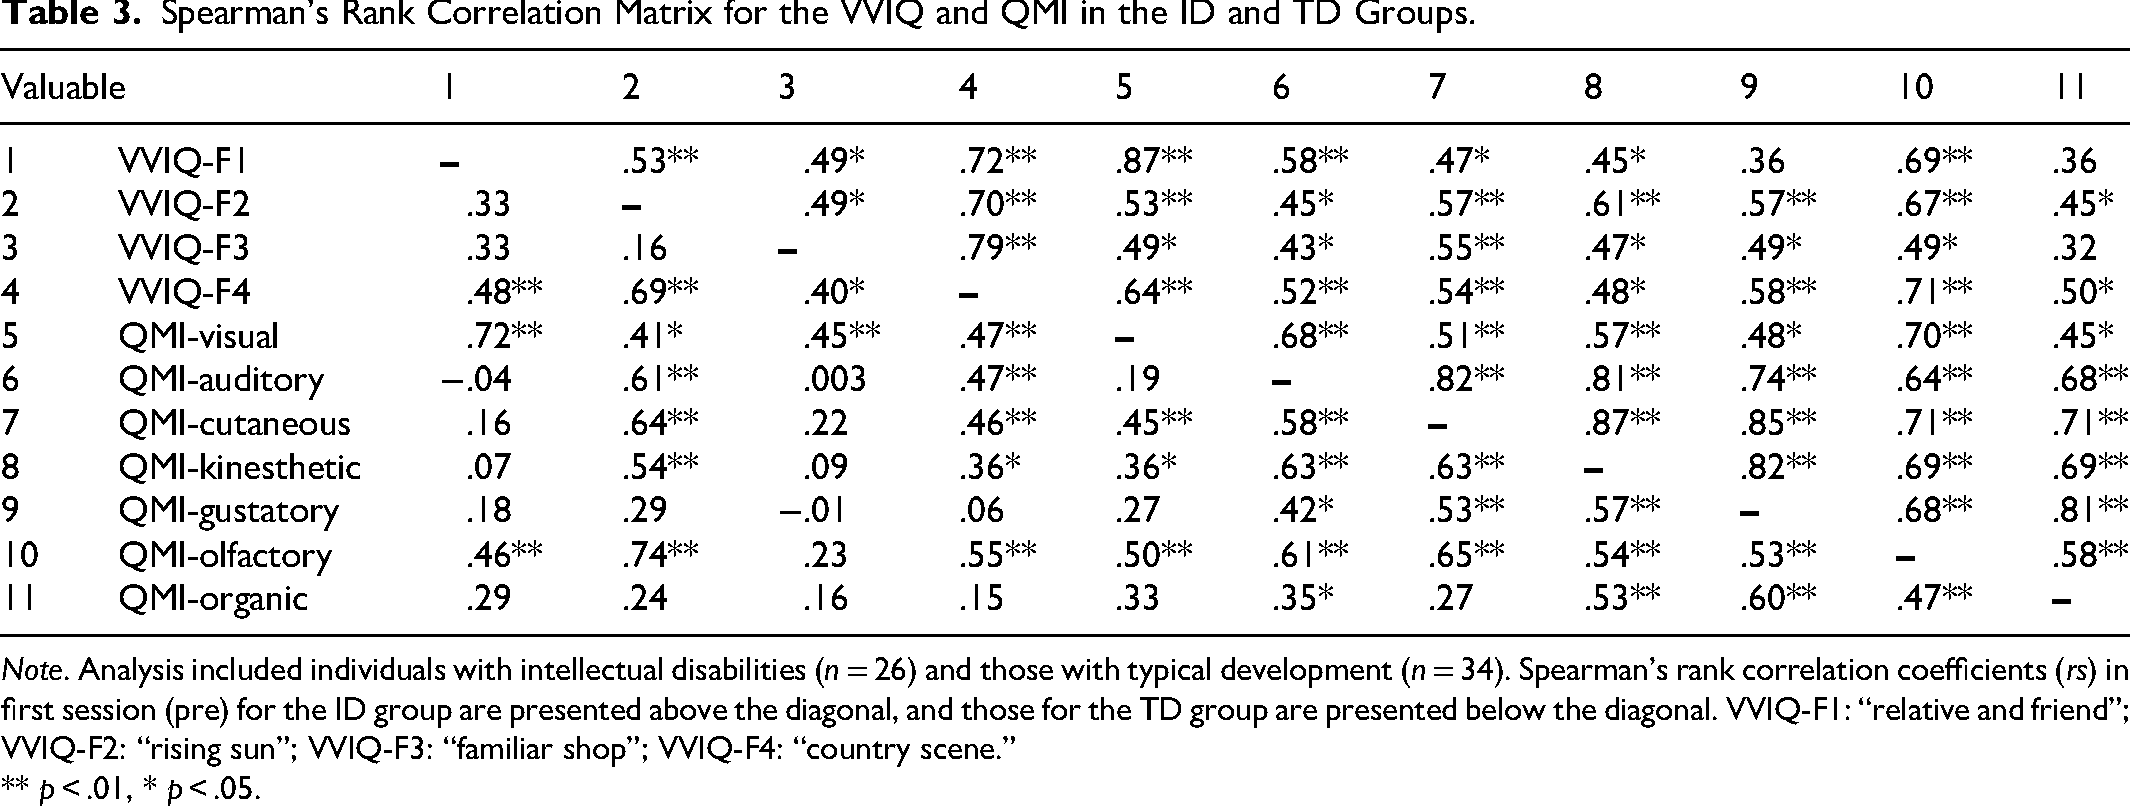
Note. Analysis included individuals with intellectual disabilities (n = 26) and those with typical development (n = 34). Spearman's rank correlation coefficients (rs) in first session (pre) for the ID group are presented above the diagonal, and those for the TD group are presented below the diagonal. VVIQ-F1: “relative and friend”; VVIQ-F2: “rising sun”; VVIQ-F3: “familiar shop”; VVIQ-F4: “country scene.”
** p < .01, * p < .05.
Group Differences in Visual Imagery Abilities
Table 4(a) shows the average rating scores (with SD) and reliability coefficients between the first (pre) and second (post) sessions for individuals with intellectual disabilities and those with typical development on the VVIQ.
Imagery Abilities of Participants on the VVIQ and QMI.
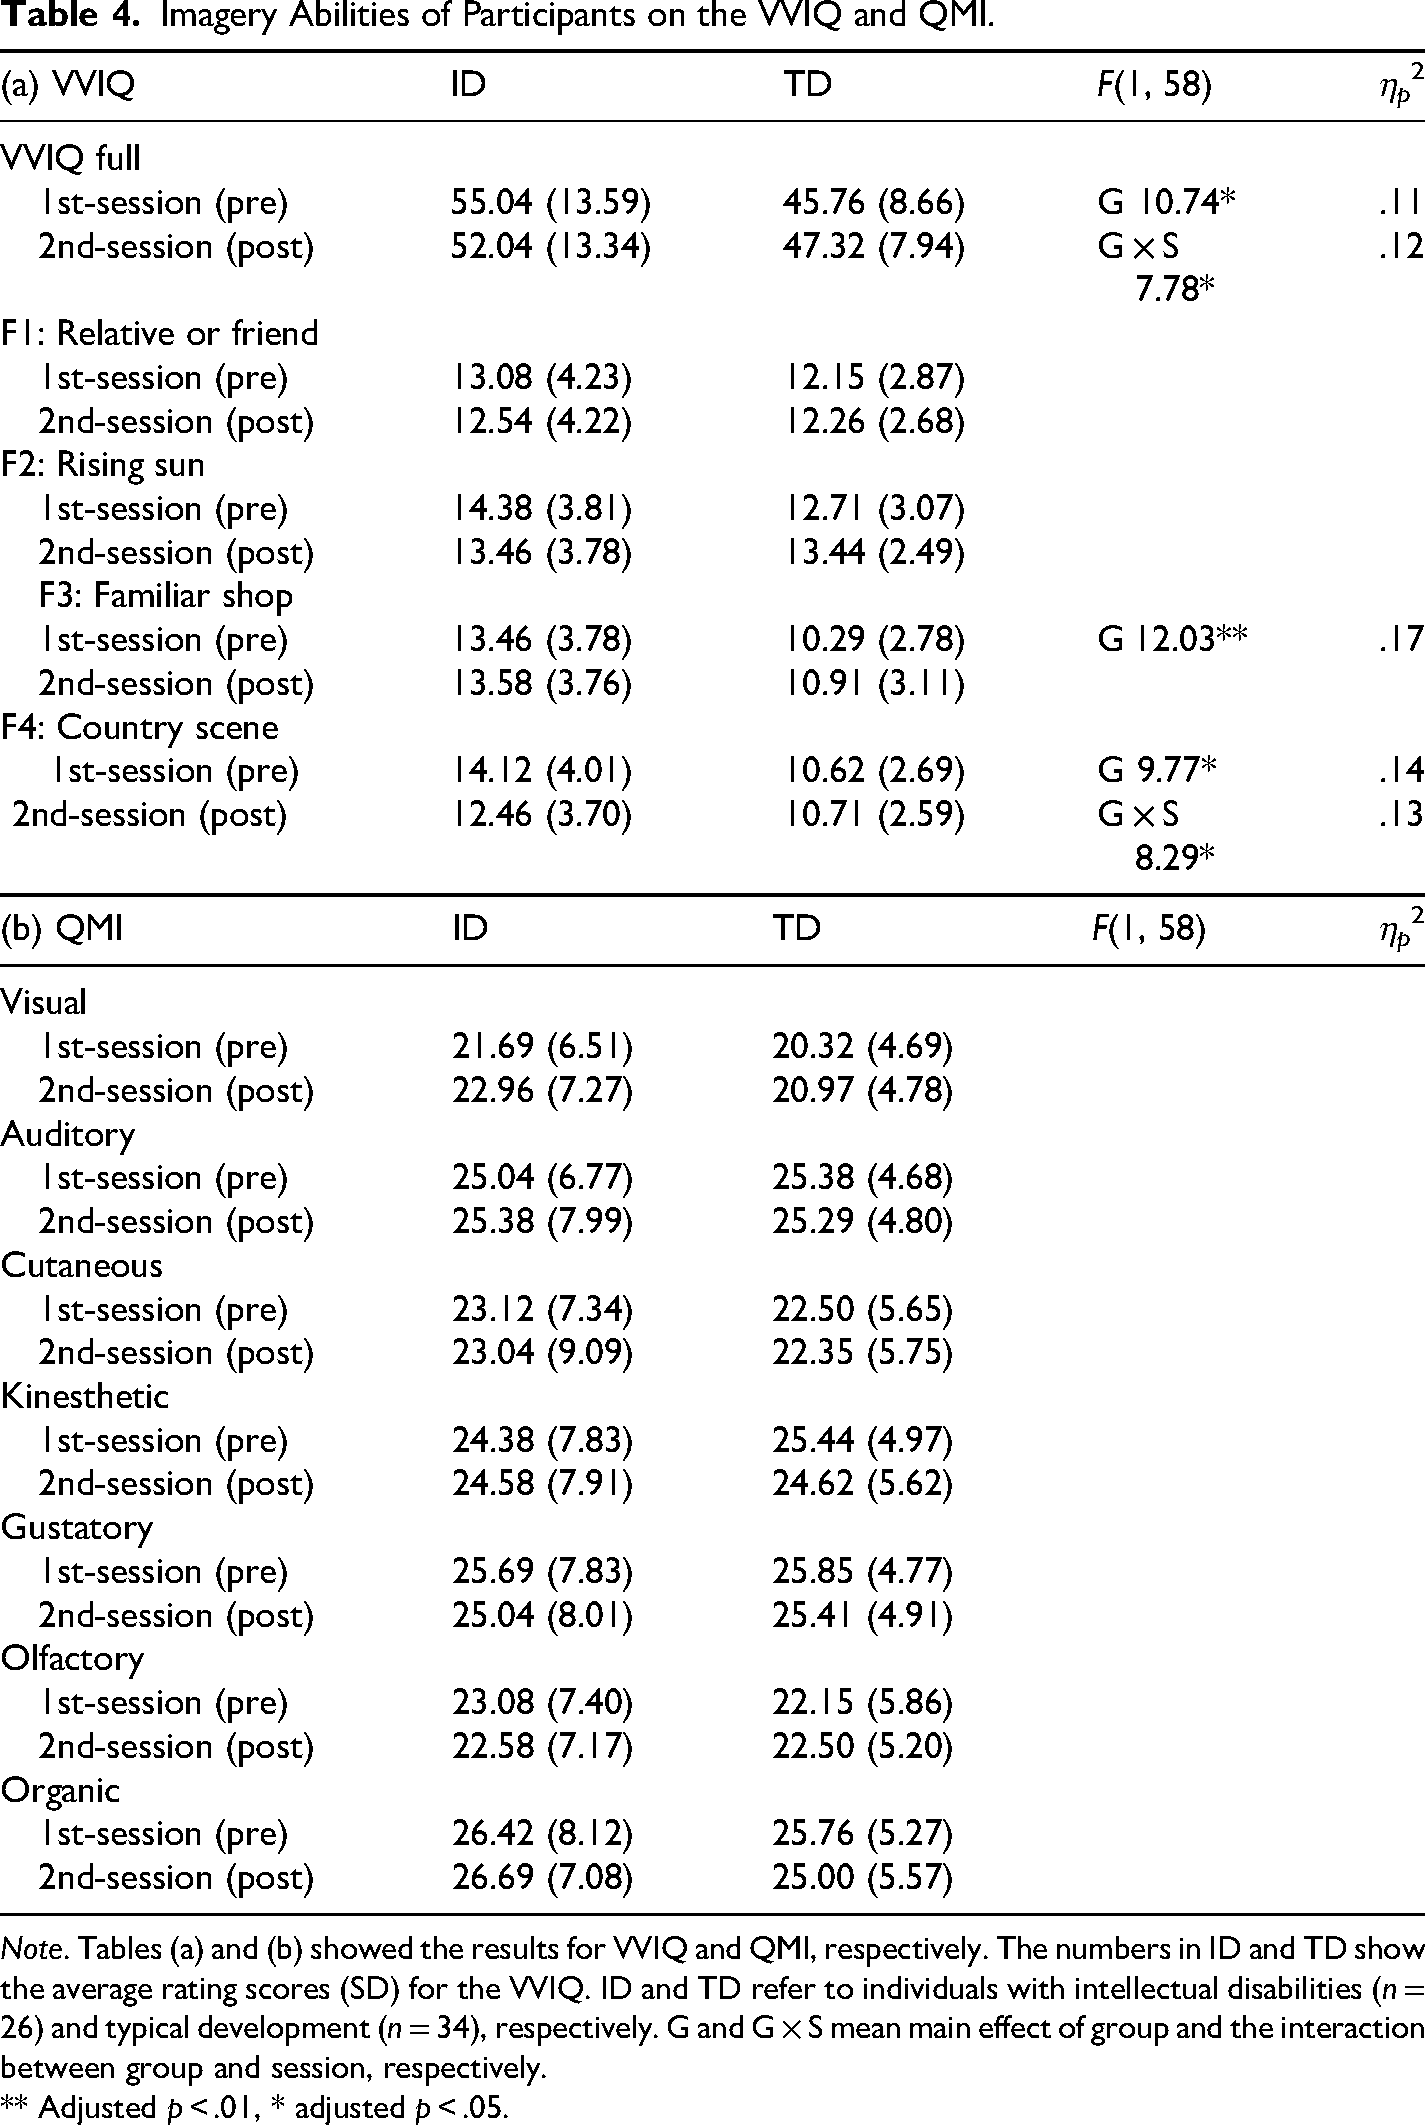
Note. Tables (a) and (b) showed the results for VVIQ and QMI, respectively. The numbers in ID and TD show the average rating scores (SD) for the VVIQ. ID and TD refer to individuals with intellectual disabilities (n = 26) and typical development (n = 34), respectively. G and G × S mean main effect of group and the interaction between group and session, respectively.
** Adjusted p < .01, * adjusted p < .05.
In the VVIQ analysis (Table 4(a)), a two-way mixed-design ANOVA showed a main effect of group in the “VVIQ full,” “familiar shop,” and “country scene” subfactors, showing that the rating scores for intellectual disabilities group were higher than typical development group (VVIQ full: F[1, 58] = 7.11, adjusted p = .03, ηp2 = .11; familiar shop: F[1, 58] = 12.03, adjusted p = .01, ηp2 = .17; country scene: F[1, 58] = 9.77, adjusted p = .01, ηp2 = .14). There was also a significant interaction between group and session in the “VVIQ full” and “country scene” subfactors (VVIQ full: F[1, 58] = 7.78, adjusted p = .03, ηp2 = .12; country scene: F[1, 58] = 8.29, adjusted p = .02, ηp2 = .13). Simple main effect analyses followed these interactions (Figure 1). In the “VVIQ full,” the rating scores for intellectual disabilities group were higher than typically development group in the first session (t(72.59) = 3.26, p = .01), but there was no significant group difference in the second session (t(72.59) = 1.60, p = .22). In the “country scene” subfactor, the rating scores for intellectual disabilities group were higher than typically development group in both the first (t(78.81) = 3.70, p = .002) and second sessions (t(78.81) = 3.46, p = .004). Additionally, within the intellectual disabilities group, rating scores were higher in the first session than in the second session (t(58.00) = -2.61, p = .047). There was no significant group difference in the second session (t(78.81) = 1.91, p = .12).
There were no other significant main effects of session and no significant interaction between group and session in any of the subfactors (F = 0.29–6.07, adjusted p = .06–.73).
Significant group differences were observed in the VVIQ full and in some VVIQ subfactors (“familiar shop” and “country scene”). There was a significant interaction between group and session for the VVIQ full and the “country scene” subfactor. Group differences were present in the first session, but not in the second session. In the “country scene” subfactor, the intellectual disabilities group had lower rating scores in the first session compared to the second session. Therefore, although differences existed between groups, these differences varied by session. It is not possible to conclude that the imagery vividness of the intellectual disabilities group was consistently higher than that of the typical development group.
Group Differences in Multisensory Imagery Abilities
Table 4(b) shows the average rating scores (with SD) and reliability coefficients between the first (pre) and second (post) sessions for individuals with intellectual disabilities and those with typical development on the QMI.
In the QMI analysis (Table 4(b)), two-way mixed-design ANOVA showed no significant main effects of group or session, and no significant interaction between these factors in any subfactor (F = 0.008–3.25, adjusted p = .18–.96). No significant differences were observed in any QMI subfactors.
Test–Retest Reliability of the VVIQ and QMI
Table 5(a) (VVIQ) and 5(b) (QMI) present the reliability coefficients between the first (pre-) and second (post-) sessions. Individuals with typical development showed moderate to good reliability between sessions across all VVIQ subfactors (ICC = .61–.84) and QMI subfactors (ICC = .57–.86). Individuals with intellectual disabilities showed good reliability in all QMI subfactors (ICC = .75–.79). In the VVIQ, these individuals showed moderate to good reliability in the full scale, “relative or friend,” “rising sun,” and “country scene” subfactors (ICC = .54–.82), but poor reliability in the “familiar shop subfactors (ICC = .36)” subfactors.
Intraclass Correlation Coefficients for the VVIQ and QMI.
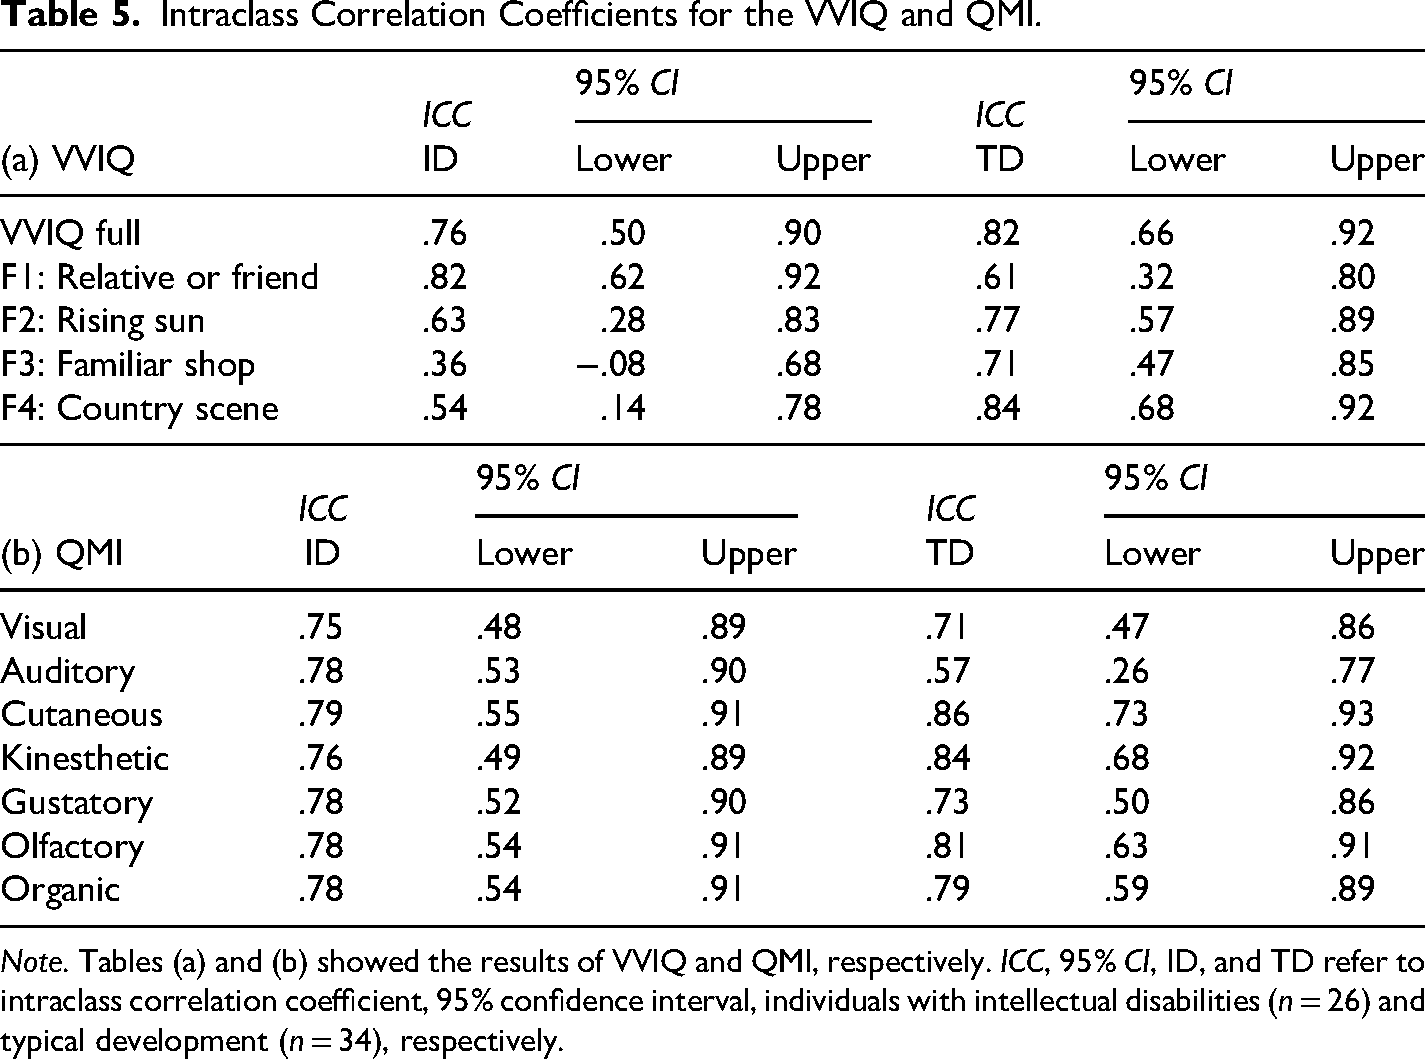
Note. Tables (a) and (b) showed the results of VVIQ and QMI, respectively. ICC, 95% CI, ID, and TD refer to intraclass correlation coefficient, 95% confidence interval, individuals with intellectual disabilities (n = 26) and typical development (n = 34), respectively.
Discussion
This study examined the visual imagery and multisensory abilities of individuals with intellectual disabilities using questionnaires and assessed response reliability with test-retest methods. Results showed no significant differences between individuals with intellectual disabilities and those with typical development in multisensory (QMI) scale scores across both sessions. In contrast, group differences appeared in the visual imagery (VVIQ) full and the “familiar shop” and “country scene” subfactors. For the VVIQ full and “country scene” subfactor, these differences were present only in the first session and disappeared in the second session. The reliability coefficient for the “familiar shop” subfactor was poor, and for the “country scene” subfactor, it was borderline moderate. QMI showed good reliability for individuals with intellectual disabilities, while both VVIQ and QMI demonstrated moderate or good reliability for individuals with typical development.
Visual Imagery Abilities in Individuals with Intellectual Disabilities
This study examined visual imagery ability in individuals with mild intellectual disabilities, consistent with the previous study (Syed et al., 2020). However, unlike Syed et al. (2020), who analyzed the VVIQ as a single-factor model, we analyzed the VVIQ results using its four subfactors. The present VVIQ results differ from those reported by Syed et al. (2020).
Group differences in VVIQ full and certain VVIQ subfactors, such as “familiar shop” and “country scene” may be explained by response instability among individuals with intellectual disabilities. Notably, they scored higher than typically developing individuals in the first session for VVIQ full and the “country scene” subfactor, but this difference was not present in the second session. Previous studies (Hartley & MacLean, Jr., 2006) have reported that response stability can be problematic when using questionnaires with individuals with intellectual disabilities. Therefore, VVIQ results for this group may be unstable. In the “country scene” subfactor, a significant difference was found between the first and second session scores for the intellectual disabilities group.
To assess the response stability for the VVIQ in individuals with intellectual disabilities, the reliability coefficient was used as an indicator of stability. McKelvie (1986) reported a reliability coefficient of .71 for the VVIQ total score using test-retest methods and Pearson's correlation analysis; participants completed the VVIQ again after three weeks. The VVIQ was divided into four subfactors, but only the total score reliability coefficient was reported, not those of the subfactors. In the present study, participants with typical development showed similar reliability coefficients across all subfactors using the intraclass correlation coefficient (ICC = .61–.84). In contrast, participants with intellectual disabilities showed poor reliability coefficients, especially in the “familiar shop” subfactor (ICC = .36). These findings indicate that response reliability for VVIQ subfactors is weaker in individuals with intellectual disabilities than in those with typical development, suggesting concerns for this population (Hartley & MacLean, Jr., 2006).
Response instability among individuals with intellectual disabilities is evident in the results of Levene's test (Table 1) and the differences in standard deviations (SD) between groups (Table 4(a)). Levene's test showed a significant lack of homoscedasticity. Individuals with intellectual disabilities had much higher SD—nearly double those of individuals with typical development across several factors. These findings indicate greater response instability within the group of individuals with intellectual disabilities.
Language expressions may contribute to response reliability among individuals with intellectual disabilities. Some individuals with intellectual disabilities may be unable to experience visual imagery or may experience it only to a limited extent (Brown & Bullitis, 2006). Brown and Bullitis (2006) showed several photographs to individuals with intellectual disabilities, removed the photographs, and asked participants to imagine them and provide verbal reports. While participants gave verbal reports, the content varied widely. Hewitt, Steel et al. (2022) argued that individuals with intellectual disabilities may generate imagery but cannot explain its content, which can lead to the mistaken interpretation that they cannot generate imagery. Additionally, Hewitt, Langdon et al. (2022) found that individuals with intellectual disabilities can experience rich and detailed imagery, indicating substantial individual differences. Because the present study used questionnaires, difficulties with verbalization among individuals with intellectual disabilities may have affected their responses. These language expression challenges may have contributed to the response instability observed in this group.
Another possibility is language comprehension among individuals with intellectual disabilities may influence response instability. The specific items for “familiar shop” are “The overall appearance of the shop from the opposite side of the road,” “A window display including colors, shapes and details of individual items for sale,” “You are near the entrance. The color, shape and details of the door,” and “You enter the shop and go to the counter. The counter assistant serves you. Money changes hands” (referring to Zeman et al., 2015). The VVIQ was administered using written instructions. No group differences appeared in any QMI subfactors, for which instructions were also word-based. If word-based instructions for QMI did not produce group differences, language comprehension issues among individuals with intellectual disabilities may explain group differences in VVIQ. Although the present study aimed to make instructions easy to understand, this accommodation may not have been fully effective. Additionally, the test–retest reliability of some subfactors may have been affected by changes in the specific referents participants chose to visualize. Because participants were not required to use the same referents across sessions, differences in the complexity or familiarity of imagined scenes may have contributed to fluctuations in imagery vividness ratings.
Multisensory Imagery Abilities in Individuals with Intellectual Disabilities
No studies have examined multisensory imagery ability in individuals with intellectual disabilities. Existing results indicate that individuals with intellectual disabilities display patterns similar to those with typical development in multisensory imagery. Therefore, it can be assumed that individuals with intellectual disabilities have functional abilities in multisensory imagery, including auditory, cutaneous, and visual imagery.
The absence of group differences in the visual subfactor of the QMI, despite observed group differences in some VVIQ subfactors, may result from the limited number of items in the QMI visual subfactor, especially given the fewer categories compared with the VVIQ subfactors.
The response stability of individuals with intellectual disabilities was assessed using the reliability coefficient as an indicator. Evans and Kamemoto (1973) reported total reliability coefficients for the QMI as follows: .67 (visual), .74 (auditory), .82 (cutaneous), .74 (kinesthetic), .75 (gustatory), .72 (olfactory), .61 (organic), and .91 (total), based on test-retest methods and Pearson's correlation analysis. Participants completed the QMI again after six weeks. In the present study, individuals with intellectual disabilities (ICC = .75–.79) and those with typical development (ICC = .57–.86) showed similar reliability coefficients using ICC, indicating that both groups demonstrated comparable response reliability.
The reliability coefficient for multisensory imagery in individuals with intellectual disabilities was equivalent to that in typically developing individuals. Brown and Bullitis (2006) reported that individuals with intellectual disabilities can generate multisensory imagery, and the present results indicate that multisensory imagery may function in this population.
Educational Implications
These results are important for intellectual disability education. They indicate that imagery abilities (i.e., generation) in individuals with intellectual disabilities can be similar to those in individuals with typical development in some situations, but not in all, and response reliability may be a concern. In educational settings, instructions such as “like this” or “imagine this” are often used to encourage imagery, including visual and multisensory forms (e.g., auditory, tactile). The findings show that such instructions may be appropriate for some individuals with intellectual disabilities, but not for others, due to variability in response reliability. Individual differences in imagery abilities are substantial for both groups, so this caution also applies to individuals with typical development. However, for individuals with intellectual disabilities, concerns about response reliability require particular attention when using imagery-based instructions. Teaching through imagery may be effective in some cases, so further research is needed to determine which types of content individuals with intellectual disabilities can reliably recall as imagery. Given the wide range of imagery abilities, educators should assess each individual's abilities carefully. This study highlights the need to consider the imagery abilities of individuals with intellectual disabilities in educational practice.
Limitations
This study has four limitations. First, it used a questionnaire, which is broad and easy to administer. However, because the data are subjective, response reliability is a concern. Response bias, such as social desirability, is also an issue, and this study did not measure social desirability. To address these concerns, objective experimental methods could be used, but such methods for assessing visual and multisensory imagery abilities are still being developed (e.g., the binocular-rivalry-imagery paradigm: Pearson [2014]) and are difficult to implement in group settings. Thus, while the questionnaire method allows for broad and easy data collection, its limitations should be considered alongside the potential benefits of objective methods.
Second, the findings apply to adults with intellectual disabilities, not children. Although imagery is often used in the education of children with intellectual disabilities, these abilities have not been adequately examined, and consistent results have not been obtained. This study focused on adults, but further research on children with intellectual disabilities is needed to directly examine the effects of imagery abilities in educational settings. Future studies should investigate the visual and multisensory imagery abilities of children with intellectual disabilities.
Third, factors such as working memory capacity, language ability, and participants’ familiarity with the questionnaire items may have influenced the assessment for individuals with intellectual disabilities. Additionally, a perceptual change may have occurred between the first (pre) and second (post) sessions, as the second session took place about one month after the first, potentially resulting in a significant change in sensory imagery. This study did not collect data to address these concerns. These factors should be considered when interpreting the results.
Insufficient attention has been given to the low reliability of responses to specific factors in the VVIQ. Possible reasons include issues VVIQ instructions, specific categories, and the experiences and memories of individuals with intellectual disabilities. The limited scope of VVIQ questions is another concern; future research should include questions about additional categories to improve instruction clarity. It is also important to assess the overall abilities of individuals with intellectual disabilities in understanding the written instructions for the VVIQ. If the word-based instructions of QMI do not produce group differences, the VVIQ may need to be revised for greater clarity, similar to QMI.
Conclusion
The visual and multisensory imagery abilities of individuals with intellectual disabilities are likely similar to those of typically developing individuals. However, individuals with intellectual disabilities may show poor or borderline moderate response reliability on imagery questionnaires compared to typically developing individuals. Therefore, researchers should carefully consider the reliability of responses from individuals with intellectual disabilities when using visual imagery questionnaires.
Footnotes
Funding
The author disclosed receipt of the following financial support for the research, authorship, and/or publication of this article: This work was supported by the Japan Society for the Promotion of Science, (grant number 23K25164, 22K18577, and 25K03421).
Declaration of Conflicting Interests
The author declared no potential conflicts of interest with respect to the research, authorship, and/or publication of this article.