
Abstract
A recent study of a large sample of children living in London demonstrated that their imagination-based self-portraits exhibited systematic drawing biases such as depicting the head too round and the eyes too far up the head. The present study aimed to replicate and extend on these findings in a sample of self-portraits produced by children from all around the world to determine if these drawing biases are universal or culturally specific to children living in Western Europe. Developmentally, children ranging in age from 3 to 11 years old were observed to draw the head too round and the eyes too high up the head. Children ranging in age from 3 to 8 years old, but not children ranging in age from 9 to 11 years old, were observed to draw the mouth too high up the head. As the children grew in age from 3 to 11 years old, these biases persisted, but there were linear trends for the biases of drawing the eyes and mouth too high up the head to become less exaggerated with increasing age. Geographically, children living in Africa, Asia, Europe, and South/Central America were all observed to exhibit these three systematic biases, indicating that these are universal drawing biases not affected by the geographic location the children were raised in.
Drawing human faces is a behavior that children and adults engage in all around the world. Perhaps due to the popularity of this activity, researchers have investigated the psychological and developmental processes that are associated with individual variability in the appearance of such drawings (Brodie, Wyatt, & Waller, 2004; Cohen, 2005; Cohen & Bennett, 1997; Cohen & Earls, 2010; Cohen & Jones, 2008; Costa & Corazza, 2006; Freeman & Loschky, 2011; Hayes & Milne, 2011; Kozbelt, Seidel, ElBassiouny, Mark, & Owen, 2010; Kozbelt, Snodgrass, & Ostrofsky, 2014; McManus et al., 2012; Ostrofsky, 2013; Ostrofsky, Cohen, & Kozbelt, 2014).
Of recent interest has been the nature of biases adults and children exhibit when drawing the spatial relationships between facial features (Costa & Corazza, 2006; Hayes & Milne, 2011; McManus et al., 2012; Ostrofsky, 2013; Ostrofsky et al., 2014). When drawing a copy of a standard face photograph, most adult nonartists produce multiple systematic error biases, such as drawing the shape of the head too round and drawing the eyes and mouth too high up the length of the head (Ostrofsky et al., 2014). Some of these observational drawing error biases mirror the direction of biases inherent in nonartist adults’ face drawings produced from their imagination without the guide of a model. Relative to how facial features are spatially positioned in the average adult face, adult nonartists’ imagination-based face drawings depict the shape of the head too round and the vertical position of the eyes too high (McManus et al., 2012; Ostrofsky, 2013, Study 2). Further, Ostrofsky (2013, Study 2) demonstrated that the spatial positioning of many facial features are positively correlated between observation- and imagination-based drawings (e.g., roundness of the head, the vertical position of the eyes and mouth, and the width of the nose).
Presumably, imagination-based drawings reflect how features of common objects and their relative spatial positioning are canonically represented in graphic-based long-term memories (Matthews & Adams, 2008; Picard & Durand, 2005). If this is true, then the findings that there are congruent and covarying spatial biases between observation- and imagination-based face drawings suggest that one reason why adult nonartists err when drawing a face from observation is because they are biased to some degree by how spatial relationships between facial features are represented in long-term memory. Thus, in explaining observational drawing performance, it would be important to understand the properties of graphic-based long-term memories that are reflected by imagination-based drawings.
With respect to faces, one property of interest is how graphic-based long-term memories and spatial biases apparent in imagination-based drawings develop from early-to-late childhood. Are the previously documented spatial biases in face drawings specific to adults, or do they emerge early in childhood? If they exist in young children, do these biases remain stable as children age, or are there observable changes across development? In perhaps the only study to address these questions, McManus et al. (2012) analyzed a set of imagination-based self-portraits produced by children aged from 3 to 11 years old. Relative to anthropometric norms representing the spatial positioning of features in the average child’s face, children were observed to draw the head too round and position of the eyes and nose too high up the length of the head. Although even the oldest children exhibited these biases, there were developmental trends such that these biases became less exaggerated as children grew older. Specifically, increasing age was associated with narrowing of the shape of the head and lower placements of the eyes and nose. Thus, children’s imagination-based face drawings exhibit some reliable spatial biases that are directionally congruent with what has been observed in adults’ imagination- and observation-based face drawings. These findings suggest that adult observational drawing errors are related to long-term memory biases that have been acquired in early childhood and persist, in a less exaggerated state, into adulthood.
However, one limitation of this study was that the children’s drawings were exclusively sampled from a single school in London, England. Thus, it remains open to question as to whether the observations reported by McManus et al. (2012) are universal or culturally specific. Although some aspects of drawing development have been argued to be universal (e.g., Kellogg, 1970), there have been multiple demonstrations of cultural differences in the content and developmental trajectory of children’s drawings (e.g., Cox, 1998; Toku, 2001; Wilson & Wilson, 1982, 1987). Because all of the spatial biases reported above have been observed in the face drawings of children living in a single Western European country, one may question whether biases such as drawing the head too round and the eyes too high up the face, and their developmental changes, are specific to Western European children or are universally exhibited by children all around the world.
In order to investigate this issue, the current study examines spatial biases and their developmental changes found in imagination-based self-portraits produced by children ranging in age from 3 to 11 years old who live in countries located in six different continents. The self-portraits were measured to quantify how round the children drew the head and how high up the head the eyes and mouth were positioned. Developmental and geographic analyses of these spatial biases were conducted.
Developmentally, drawings produced by children of four different age groups (3–4, 5–6, 7–8, and 9–11 years old) were analyzed in order to determine (a) which age groups exhibited systematic directional biases in drawing these spatial relationships relative to anthropometric norms and (b) if there were developmental changes in the expression of such biases as children grew older in age. Children in each age group were sampled from countries across North and South/Central America, Europe, Africa, Asia, and Australia. The goal of this analysis was to determine if the observations reported by McManus et al. (2012) can be replicated in a culturally and geographically broader sample of children.
Geographically, drawings produced by children living in Europe, Africa, South/Central America, and Asia were analyzed in order to determine (a) which geographic groups exhibit systematic directional biases in their drawings of the spatial relationships between features and (b) if there are any differences between children living in the different continents with respect to the magnitude of such spatial drawing biases.
Methods
Materials
The drawings analyzed in this study were taken from Gilles Porte’s Early Pictures: Portrait - Self-Portrait online archive of children’s self-portraits (Porte, Maurer, & Gujer, 2012). In total, this collection currently contains 958 self-portraits produced by children ranging in age from 2 to 15 years old from 36 countries distributed throughout six continents. After being provided a black sheet of paper and a sharpened white crayon, each child was simply asked to draw themselves. No further instruction was provided, and no time limit was imposed on this task. After each drawing was created, the name, age, and country that the child was living in at the time the drawing was produced was recorded.
Procedure
The drawings included in this analysis were selected based on the criterion that the drawing must include a face that depicts at least both eyes and a mouth embedded in a drawing of a human figure. Out of the 958 drawings in the archive, 506 drawings met this criterion and were included in the analysis to be reported below.
Four spatial measurements, A to D, were made for each drawing and are illustrated in Figure 1. “A” measured the length of the head, with the landmark points being defined as the two points on the top and bottom of the head with the greatest vertical distance from one another. “B” measured the width of the head, with landmark points being defined as the two points on each side of the head with the greatest horizontal distance from one another. “C” measured the vertical distance from the top of the head to the eye-line. If the two eyes were not perfectly aligned horizontally, the midpoint of the line that intersected the middle of the two eyes was used as the landmark point. “D” measured the vertical distance from the top of the head to the lowest point of the mouth.
Illustration of how the drawings were measured and definition of the three spatial relation ratios.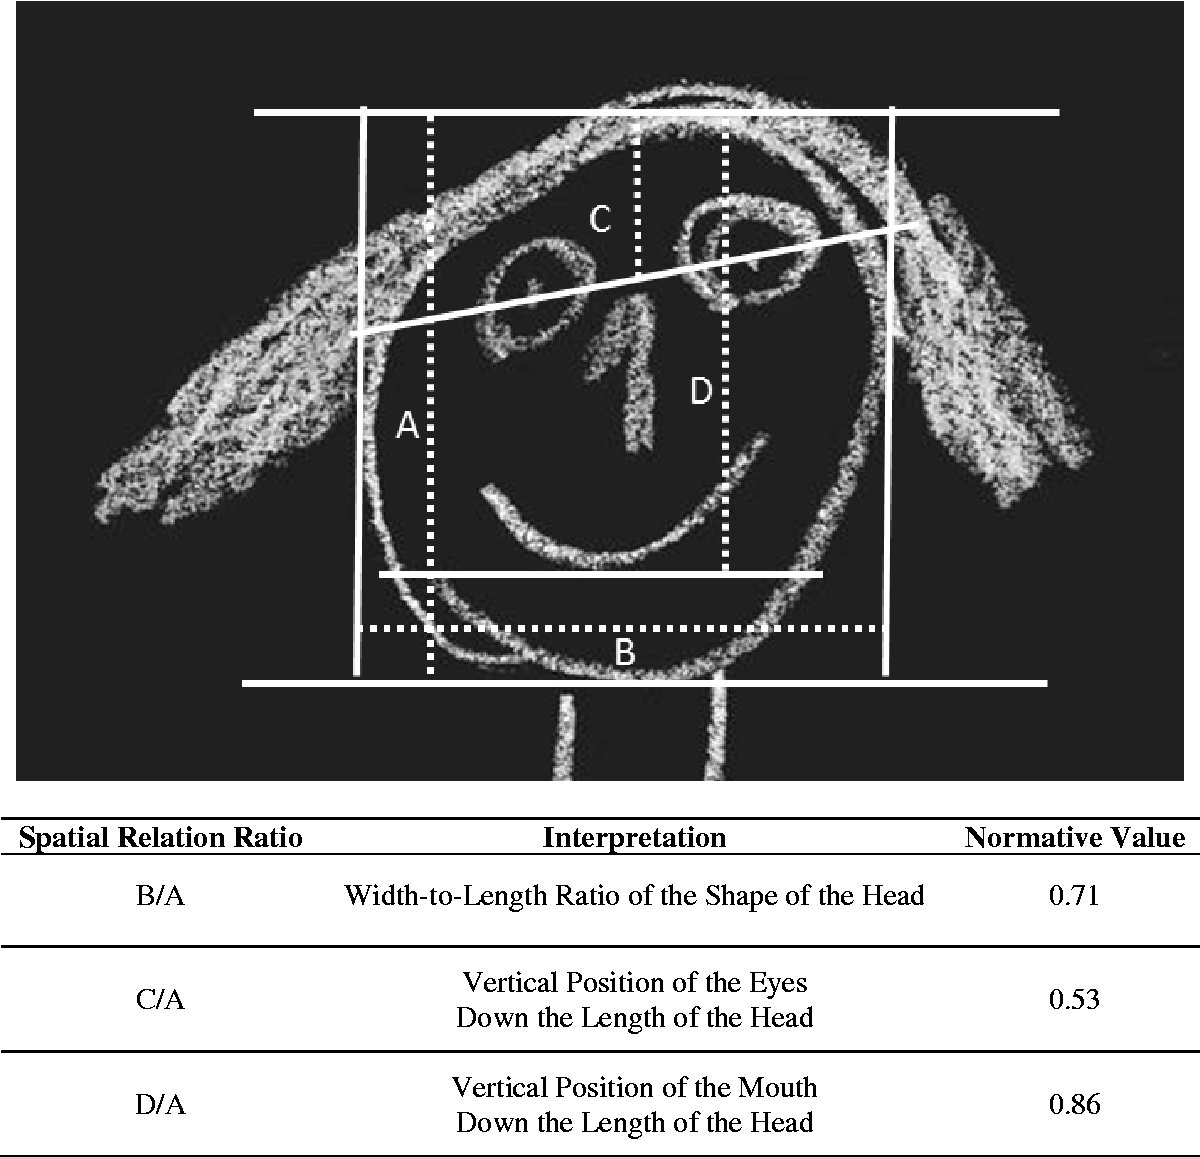
Based on these four measurements, three spatial relation ratios were calculated. The B/A ratio quantified the width-to-length ratio of the shape of the head. Here, a ratio value of 1 indicates that the width and length of the head are equal. A ratio value less than 1 indicates that the width was less than the length of the head, and a ratio value greater than 1 indicates that the width was greater than the length of the head. The C/A ratio quantified the vertical positioning of the eyes on the length of the head. The D/A ratio quantified the vertical positioning of the mouth on the length of the head. For the C/A and D/A ratios, greater values indicate that the feature was positioned lower down the head relative to lesser values.
Once these spatial relation ratios were calculated, three bias ratios (one for each of the spatial relation ratios) were computed that quantified the degree to which each drawing deviated from normative values of the spatial relation ratios of the average 6-year-old face. Normative values were acquired from the anthropometric measurements of Farkas and Munroe (1987) (measured from an illustration of these values in McManus et al., 2012). The normative values of the three spatial relation ratios for the average 6-year-old face were B/A = 0.71; C/A = 0.53; D/A = 0.86. Bias ratios were computed as:

For the B/A ratio, a bias ratio value greater than 1 indicates that the width-to-length ratio of the head in the drawing was greater than the normative value. For the C/A and D/A ratios, a bias ratio value less than 1 indicates that the eyes and mouth were positioned higher up the length of the head in the drawing than they are on the average 6-year-old face.
Developmental Analyses
For the purpose of analyzing spatial drawing biases across different developmental stages, each drawing was grouped according to the age of the child producing the drawing. There were four age groups that were constructed: (a) 3 and 4 year olds (n = 111), (b) 5 and 6 year olds (n = 312), (c) 7 and 8 year olds (n = 54), and (d) 9, 10, and 11 year olds (n = 29).
Geographic Analyses
For the purpose of analyzing spatial drawing biases across the different geographic locations that the children lived in, each drawing was grouped according to the continent that the country they lived in was located. Here, only drawings produced by children aged from 4, 5, and 6 years old were included in these analyses (N = 383). Due to the fact that that there were too small a number of 4-, 5-, and 6-year-old drawings from Australia and the only North American country in the collection (Canada), these two continents were not included in the analysis. Therefore, each drawing was grouped into one of the following four continent groups: (a) Africa (11 countries; n = 116) 1 ; (b) Asia (10 countries; n = 119) 2 ; (c) Europe (7 countries; n = 107) 3 ; and (d) South/Central America (3 countries; n = 41). 4
Results
Developmental Analyses
Mean (Standard Error) of Spatial Relation and Bias Ratio Values Across the Age Groups.
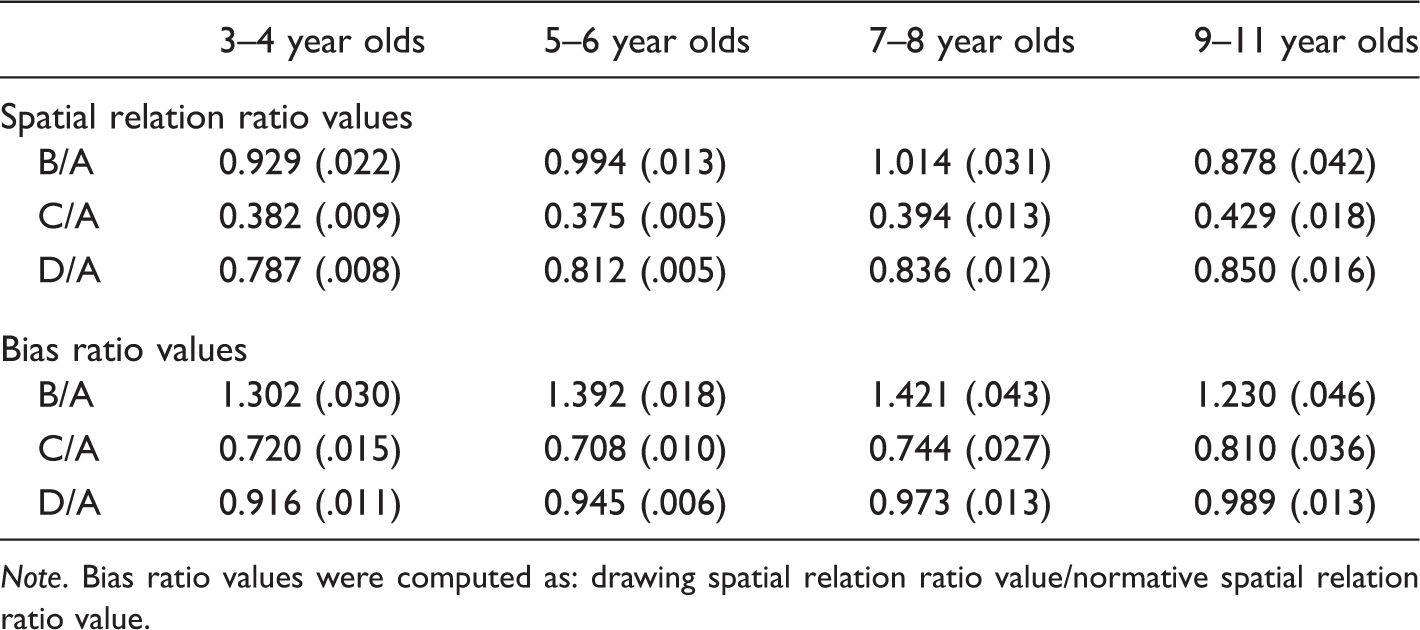
Note. Bias ratio values were computed as: drawing spatial relation ratio value/normative spatial relation ratio value.
Analysis of Drawing Biases for Each Age Group.
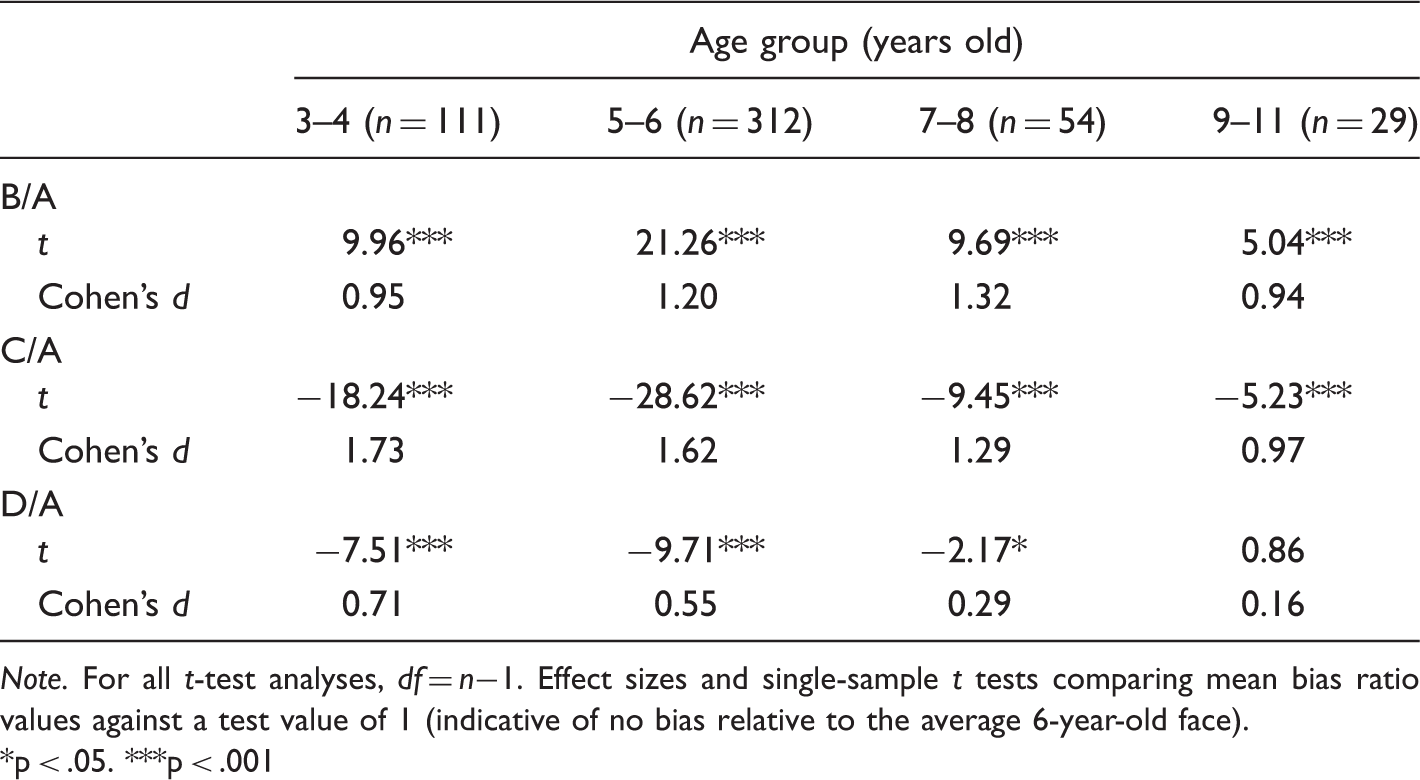
Note. For all t-test analyses, df = n−1. Effect sizes and single-sample t tests comparing mean bias ratio values against a test value of 1 (indicative of no bias relative to the average 6-year-old face).
p < .05. ***p < .001
Next, three regression analyses were conducted to determine if the magnitude of the drawing biases changed linearly from younger to older children. With respect to the B/A bias ratio values, there was not a significant linear relationship between age and the magnitude of bias in drawing the width-to-length ratio of the head, F(1, 504) = 0.15, standardized β = .017, p = .695.
With respect to the C/A bias ratio values, there was a significant, positive linear relationship between age and the magnitude of bias in drawing the vertical position of the eyes, F(1, 504) = 4.65, standardized β = .096, p < .05. This indicated that, as the children grew older, there was a trend for the drawings of the vertical position of the eyes to deviate from the average 6-year-old face to a progressively smaller degree. In other words, there was a trend for the eyes to be vertically positioned lower down the length of the face as the children increased in age.
With respect to the D/A bias ratio values, there was a significant, positive linear relationship between age and biases in drawing the vertical position of the mouth, F(1, 504) = 17.99, standardized β = .186, p < .001. As the children grew older, their drawings of the vertical position of the mouth deviated from that of the average 6-year-old face to a progressively smaller degree. This reflects a trend for the vertical position of the mouth to be positioned lower down the length of the face in the drawings of children who are older compared with those who are younger.
Geographic Analyses
Mean (Standard Error) of Spatial Relation and Bias Ratio Values Across the Geographic Groups of Children Aged 4 to 6 Years Old.
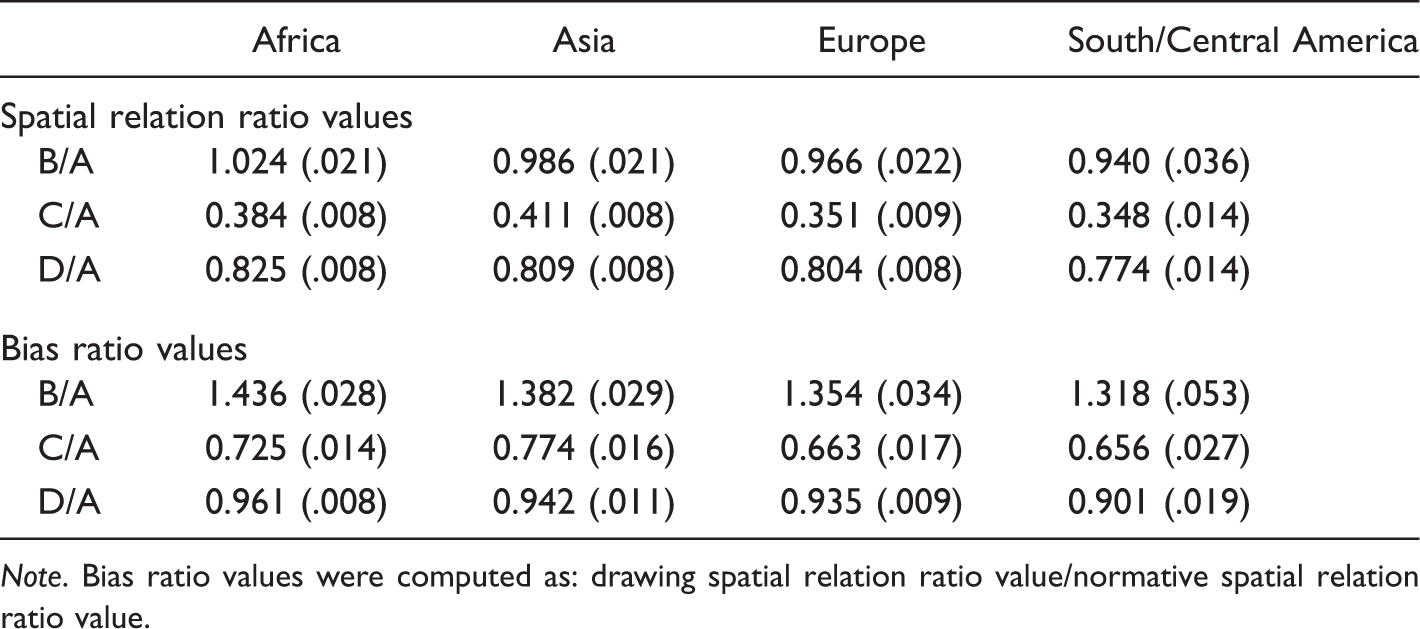
Note. Bias ratio values were computed as: drawing spatial relation ratio value/normative spatial relation ratio value.
Analysis of Drawing Biases for Each Continent Group.
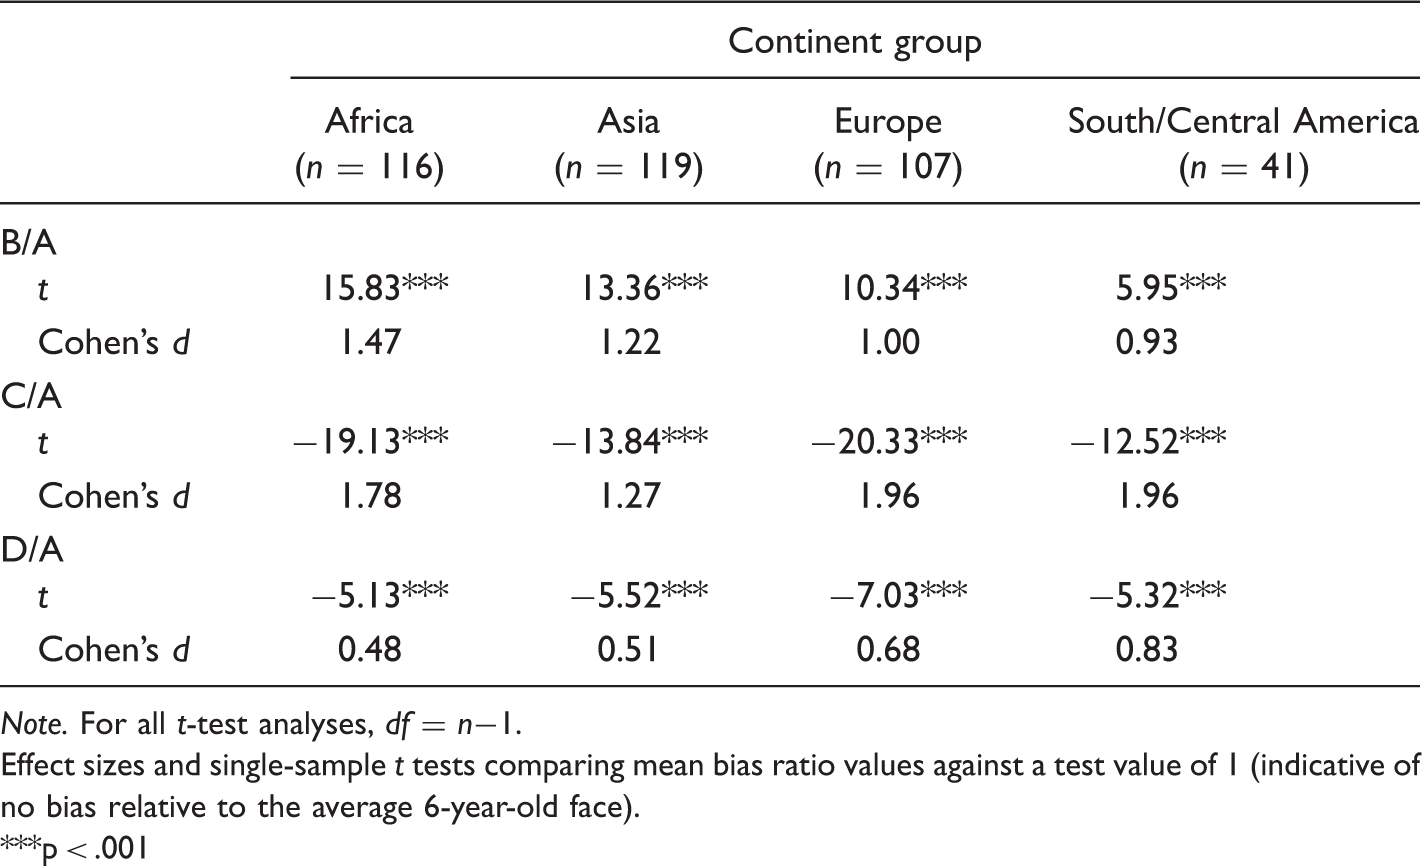
Note. For all t-test analyses, df = n−1.
Effect sizes and single-sample t tests comparing mean bias ratio values against a test value of 1 (indicative of no bias relative to the average 6-year-old face).
**p < .001
With respect to the drawings of the width-to-length ratio of the head, the B/A bias ratio values did not significantly differ between the four geographic groups, F(3, 379) = 1.88, p = .132, partial η2 = .015.
With respect to the drawings of the vertical position of the eyes, the C/A bias ratio values significantly differed between the four geographic groups, F(3, 379) = 10.08, p < .001, partial η2 = .074. Follow-up Scheffe tests indicated that the bias in Asian children’s drawing of the vertical position of the eyes was significantly smaller than the drawings of European children (p < .001) and South/Central American children (p < .01). In other words, Asian children’s drawing placed the vertical position of the eyes lower down the length of the face than European and South/Central American children. No other comparisons indicated significant differences at the .05 α-level.
With respect to the drawings of the vertical position of the mouth, the D/A bias ratio values differed significantly between the four geographic groups, F(3, 379) = 3.72, p < .05, partial η2 = .029. Follow-up Scheffe tests indicated that the bias in African children’s drawings of the vertical position of the mouth was significantly smaller than those of South/Central American children (p < .05). In other words, the African children drew the vertical position of the mouth lower down the length of the face than did South/Central American children. No other comparisons indicated significant differences at the .05 α-level.
Discussion
The current study extends our understanding of the spatial biases that are present in children’s imagination-based drawing of faces. Here, McManus et al.’s (2012) observations that children living in London, England systematically draw the head too round and the eyes too high up the face were replicated in a geographically broader sample of children. An additional observation made here was that the drawings produced by children aged from 3 to 8 years were also biased to draw the mouth too high up the head. These drawing biases were present in the drawings of 4- to 6-year-old children living in Africa, Asia, Europe, and South/Central America, indicating a universal similarity in the style in which children draw these spatial relationships. Although some differences were noted in the drawing biases between children living in different continents, these differences pertained to the magnitude of the biases, and not their direction or presence.
The causes of these geographic differences are presently unclear. They may be due to racial/ethnic- and culture-based differences in average facial structure that children are potentially sensitive to (Farkas et al., 2005; Zhuang, Landsittel, Benson, Roberge, & Shaffer, 2010). However, it is currently unclear as to whether the specific differences between geographic groups that were observed pertaining to the magnitude of vertical eye and mouth drawing biases mirror specific differences in the average facial structure of Asians, Africans, South/Central Americans, and Europeans. Therefore, future research that evaluates racial/ethnic differences in facial morphology may provide clues as to why children of different geographic locations differ from each other with respect to the magnitude of the drawing biases observed here. Nevertheless, despite the fact that some aspects of children’s drawings differ across cultures (Cox, 1998; Toku, 2001; Wilson & Wilson, 1982, 1987), it appears that biases in the spatial configuration of facial features is not an aspect of drawing that is influenced by the geographic location the child develops in.
Developmentally, children ranging in age from 3 to 11 years old were observed to express these drawing biases in a qualitatively similar fashion. However, with respect to the vertical positioning of the eyes and mouth, significant developmental trends were observed that indicated a progressive lowering of the features down the length of the face in the direction of the average 6-year-old face. Thus, as children grow older in age, the bias to draw the eyes and mouth too high up the face is reduced in magnitude while not disappearing completely (with the exception of the vertical position of the mouth, where 9- to 11-year-old children do not systematically draw the mouth too high up or down the face). In contrast, the bias to draw the head too round was not observed to reduce in magnitude in a linear fashion as children age from 3 to 11 years old. This is inconsistent with findings reported by McManus et al. (2012). Presently, the source of the discrepancy between these findings is unclear. On the one hand, this could indicate that the age-based progressive narrowing of the shape of the head observed by McManus et al. is culturally specific to children living in London. On the other hand, the lack of a significant linear change in bias across the age groups observed here could be due to the relatively smaller sample size (in comparison with McManus et al., 2012), and consequently, not enough power to detect a significant linear change if it exists universally.
It is of interest to note that past research has demonstrated that these spatial biases are also present in Western nonartist adult’s imagination- and observation-based face drawings (McManus et al., 2012; Ostrofsky, 2013; Ostrofsky et al., 2014), indicating that the developmental trend of a reduced magnitude of these biases does not lead to a complete elimination of them into adulthood. It may require extensive training and experience in drawing before these biases are completely eliminated. This remains an open question because the presence versus absence of these biases in the drawings of skilled artists has not been previously investigated. Nevertheless, if this developmental trajectory is truly universal, the directional congruence of spatial bias in the face drawings of Western children and adults leads to the prediction that adult nonartists from non-Western countries (e.g., those living in Africa or Asia) would also exhibit the same spatial drawing biases when asked to draw a face from imagination or observation. Future research aimed at testing this hypothesis would further clarify the universal or culturally specific nature of face drawing biases.
Following this, it is worth considering the nature of the graphic representations that are stored in long-term memory that guide imagination-based drawings related to observational drawing performance. On the one hand, it could be that the spatial positioning of facial features is represented metrically. According to this perspective, spatial memory biases would be conceptualized as the representations of the relative metric distances between features deviating from that of the average face. On the other hand, it could be that the configuration of facial features is represented in memory in a nonmetric, symbolic fashion. Here, spatial memory biases would take the form of individuals coding the positioning of features in a categorical fashion (e.g., the eyes are the highest feature, the nose is the middle feature, and the mouth is the lowest feature). McManus et al.’s (2012) finding that the eyes are positioned lower and the mouth higher in the face when a nose was neglected to be drawn compared with when a nose was drawn in the face may be consistent with this latter possibility. Here, features could be competing with each other for position in the space of the face. However, future research is needed to distinguish between these two possibilities as the methods employed in this study are not equipped to provide a test of these hypotheses.
Finally, it is important to note that there are two important limitations to this study that prevents one from making strong conclusions relating to the universal or culturally specific nature of these drawing biases. First, the geographic groups that the drawings were categorized into were very broad, each containing countries that are culturally diverse from one another (e.g., Middle-Eastern and Eastern Asian children were combined together in the Asian group). Thus, it is still possible that there are more specific cultural differences with respect to these drawing biases that have been masked by the relatively broad categorization of drawings into continent-based groups. Second, the geographic groups only contained drawings produced by children who were 4 to 6 years old. So, it is still possible that there might be geographic differences in the presence versus absence of these drawing biases for children younger than 4 years old and older than 6 years old. These two limitations exist due to the available collection of drawings analyzed here, and thus, cannot currently be overcome. With respect to the first limitation, the sample size of drawings within each country was too small to allow for powerful enough individual country/culture comparisons (M [SD] of drawings per country = 12.03 [5.62]). With respect to the second limitation, the available number of drawings in the collection produced by children younger than 4 years old and older than 7 years old is too small to adequately analyze whether there are geographic differences in these age groups.
Following this, another limitation exists with respect to the degree of representativeness of children included in the four age groups compared with each other for the developmental analyses. There was a substantial inequality in sample size with respect to the children in the two age groups ranging from 3 to 6 years old (n = 423) compared with the children in the two age groups ranging from 7 to 11 years old (n = 83). Thus, one may question whether the latter two age groups were as representative of their respective global population as the former two age groups. Thus, it is possible that the observations made here might not be replicated if more equally representative age groups were available to compare with one another.
The limitations highlighted above may be improved upon with future research. Gilles Porte has collected over 4,000 drawings in total from children living in 38 different countries (Porte et al., 2012). Although only 938 of them have been digitized and made publically available to date, an ongoing project is being conducted that aims to digitize and make available the entire collection in the near future. Once this has been accomplished, the analyses conducted in the current study could be made more powerful with samples of drawings that are more strongly representative of the age and geographic groups focused on here. Nevertheless, the current study has generated preliminary evidence that has furthered our understanding, albeit tentatively, of the developmental and geographic nature of drawing biases produced in early and late childhood.
Footnotes
Acknowledgments
I would like to acknowledge the contributions of Dr. Chris McManus, Dr. Dale Cohen, and an anonymous reviewer in providing helpful comments on an earlier version of this manuscript.
Declaration of Conflicting Interests
The author declared no potential conflicts of interest with respect to the research, authorship, and/or publication of this article.
Funding
The author received no financial support for the research, authorship, and/or publication of this article.