
Abstract
Why do some people not enjoy listening to music as much as others? Two studies explored whether people high in physical anhedonia—an aspect of schizotypy that is associated with reduced pleasure from physical stimuli—are less engaged in the musical world than other people. Study 1 examined individual differences in music engagement and experience. People with higher levels of physical anhedonia reported valuing music less, experiencing fewer aesthetic emotions in response to music, liking fewer genres of music, and having less music experience. Study 2 used experience sampling to examine how individual differences in physical anhedonia predicted music engagement, music listening habits, and the aesthetic experiences of music in everyday life. During a typical week, people with higher levels of physical anhedonia spent less time listening to music. Taken together, these results suggest that as physical anhedonia increases, people become increasingly detached from and disinterested in music.
Sometimes it seems as if our lives are set to a soundtrack—in fact, researchers have found that people spend at least a quarter of their day listening to music (Juslin, Liljeström, Västfjäll, Barradas, & Silva, 2008; Nusbaum et al., 2014; Sloboda, O’Neill, & Ivaldi, 2001), so people in general seem to prefer musical accompaniment to their everyday activities. Many studies have found that people can have powerful physical and emotional reactions to music (Gabrielsson, 2011; Grewe, Kopiez, & Altenmüller, 2009; Salimpoor, Benovoy, Larcher, Dagher, & Zatorre, 2011). Goldstein (1980) found that listening to certain music is associated with a flood of opioid neurotransmitters, the same ones responsible for intense euphoric experiences. Blood and Zatorre (2001) found using positron emission tomography scans that when listening to music, blood flow is increased to the pleasure centers of the brain (i.e., dorsomedial midbrain and left ventral striatum) and decreased to areas of the brain associated with stress, inhibition, and fear (i.e., right amygdala, left hippocampus/amygdala, and ventral medial prefrontal cortex). Consistent with this effect, Sloboda et al. (2001) found that in everyday experiences, people reported being happier and more alert after listening to music.
Because music is so pervasive in the environment and people engage deeply with it, musical disinterest is intriguing. Everyone has some times when they would rather not listen to music—such as when they are trying to concentrate on a task (Cassidy & MacDonald, 2007; Furnham & Strbac, 2002) or trying to avoid a car accident (Dibben & Williamson, 2007)—but there are likely broader individual differences in how much people engage with and enjoy music in their everyday lives. Research on individual differences suggests that physical anhedonia would likely predict musical disinterest. Physical anhedonia is a stable individual difference and a facet of schizotypy, which is a continuum that reflects an underlying vulnerability for schizophrenia and related disorders (Kwapil, Barrantes-Vidal, & Silvia, 2008). Few people at the high end of the continuum will develop full-blown disorders, but they will often display weaker or less frequent instances of the aberrant experiences, beliefs, and behaviors typical of schizophrenia. A major component of schizotypy is a cluster of negative symptoms (Kerns, Docherty, & Martin, 2008; Kwapil et al., 2008), such as diminished reward from social contact, known as social anhedonia (Silvia & Kwapil, 2011), and diminished reward from physical and sensory experiences, known as physical anhedonia (Chapman, Chapman, & Raulin, 1976).
People high in physical anhedonia find less pleasure in things that most people enjoy; they are more indifferent to experiences like getting a massage, smelling fresh-baked cookies, or watching a sunset. Anhedonia is also a core construct of depression, but the anhedonia characteristic of negative schizotypy tends to be trait-like, does not involve elevated levels of negative affect, and is not limited to depressive episodes (e.g., Blanchard, Horan, & Brown, 2001). Because physical anhedonia is a continuum, it is typically measured and assessed as a dimension rather than as discrete high and low groups.
Recent research has used functional magnetic resonance imaging methods to examine brain activity in response to classical conditioning and found that people high in physical anhedonia have reduced activity in the left ventral striatum, an area of the brain associated with reward anticipation (Dowd & Barch, 2012). Other functional magnetic resonance imaging studies of nonclinical samples find that higher physical anhedonia is associated with increased ventral medial prefrontal cortex activity (an area of the brain associated with fear processing) when processing positive information (Harvey, Pruessner, Czechowska, & Lepage, 2007)—which, as Zatorre and coworkers (Blood & Zatorre, 2001; Salimpoor et al., 2011; Salimpoor & Zatorre, 2013) demonstrated, is reduced when people experience a pleasurable activity like listening to music.
Evidence from neuroscience research illuminates the deficits in affect and pleasure that are experienced in physical anhedonia: For most people, listening to music tends to be associated with increased activity in the pleasure centers of the brain. For people higher in physical anhedonia, however, research shows deficits in brain activation associated with anticipating and processing pleasurable stimuli. Therefore, it likely follows that physically anhedonia is associated with gaining less pleasure from music.
The Present Research
The present research explores how people typically experience music in everyday circumstances. In two studies, we examine how physical anhedonia relates to people’s thoughts, habits, and experiences involving music in everyday life. Study 1 uses multivariate models to understand how people engage with and experience music. We expect that physical anhedonia will predict several aspects of music listening. Because physical anhedonia is characterized by diminished physical and sensory pleasures (like listening to music), we suspect that as physical anhedonia scores increase, people will experience less intense aesthetic emotions in response to music, will like fewer genres of music, and will be less engaged with music (e.g., less likely to attend concerts or to play an instrument).
In Study 2, we expand this work into the real-world experience of music by using experience-sampling methods (ESMs) to explore the association of physical anhedonia with people’s experiences with music in everyday life. In this study—as in Study 1—we were interested in exploring differences in the music preferences and listening habits of people who vary in physical anhedonia. ESM is a diary method that repeatedly assesses participants at random times in their typical daily environment (Conner, Tennen, Fleeson, & Barrett, 2009). It offers several advantages over traditional assessment methods in that it enhances ecological validity, reduces retrospective bias by assessing experiences at the time of the signal, and allows for the assessment of the effects of contextual experiences. ESM thus provides an effective method for examining individual differences in everyday music listening and experiences, as demonstrated by several recent studies (Greasley & Lamont, 2011; Nusbaum et al., 2014). We expected Study 2 to replicate the findings from Study 1—physical anhedonia should predict less engagement with music—in people’s natural environments.
Study 1
Method
Participants
Participants included 204 students enrolled in an undergraduate psychology course at the University of North Carolina at Greensboro (UNCG). Data for this study were collected as part of a broader study about personality. People earned credit toward an optional course assignment for their participation. Similar to the demographic characteristics of students at the university, participants were mostly Caucasian (60.3%) and African American (31.4%) females (69.6%). The average age of our sample was 19.62 years, but participants ranged in age from 18 to 32 years.
Physical anhedonia measure
We assessed physical anhedonia using Winterstein et al.’s (2011) 15-item short form of the extensively used Physical Anhedonia Scale. Although researchers interested in schizotypy often use Chapman et al.’s (1976; Chapman, Edell, & Chapman, 1980) long form of this scale, the short form is a reliable and valid alternative (Gross, Silvia, Barrantes-Vidal, & Kwapil, 2012; Winterstein et al., 2011). Sample items such as “The beauty of sunsets is greatly overrated” and “It has often felt good to massage my muscles when they are tired or sore”—answered simply true or false—are typical of this assessment. Note that only one item has any content related to music (“When I’m feeling a little sad, singing has often made me feel happier”). Each item was scored so that people received a 1 for each item endorsed in the anhedonic direction and a 0 for all others; the sum of the items endorsed served as each person’s physical anhedonia score. Consistent with the literature (Kwapil et al., 2008), the physical anhedonia scores were treated as continuous, not split into high and low groups.
Music engagement and preferences measures
As in past work (e.g., Nusbaum & Silvia, 2011; Silvia & Nusbaum, 2011), we measured several different aspects of people’s music listening habits, experience and engagement with music, music genre preferences, and experiences of unusual aesthetic emotions (i.e., feeling chills, feeling touched or moved, or feeling absorbed) in response to music. People reported how many hours they listen to music in a typical day, how often they attend concerts (almost never, one or two a year, one or two a month, at least once a week), and whether they typically listen to music very closely or just in the background (mostly on in the background, about equal, mostly listening to it closely). People also reported how often (expressed as a percentage of time, from 0% to 100%) they hear inner music (i.e., hearing music in their mind when no music is playing; Beaty et al., 2012), as well as how much they like or dislike the inner music, and how often the inner music is something they are composing, rehearsing, or improvising.
We measured how much people value music with three items: People reported how important music is to them (1 = not at all important, 7 = extremely important), how much they value music (1 = not much, 7 = very much), and how unpleasant it would be for them to go a whole day without listening to music (1 = not at all unpleasant, 7 = extremely unpleasant). Participants also reported their engagement and experience with music, such as whether they played an instrument, how many hours a week they spent practicing music, and how many college classes related to music they had taken. Finally, people completed the Creative Achievement Questionnaire (Carson, Peterson, & Higgins, 2005), which assesses people’s degree of achievement in 10 different creative domains including (importantly) music achievement, but also in areas like fine arts, dance, and scientific discovery (see Silvia, Wigert, Reiter-Palmon, & Kaufman, 2012).
The Short Test of Music Preferences—Revised (Rentfrow & Gosling, 2003) was administered to assess how much people like different genres of music. This questionnaire asks people to rate how much they like 23 different genres of music (e.g., blues, classical, hip-hop, and folk) on a 1 (dislike strongly) to 7 (like strongly) scale. Genres are then collapsed into four groups according to shared characteristics: reflective and complex (including bluegrass, blues, classical, folk, international/foreign, jazz, new age, and opera genres), intense and rebellious (including alternative, heavy metal, punk, and rock genres), upbeat and conventional (including country, gospel, oldies, pop, religious, and theme song/soundtrack genres), and energetic and rhythmic (including dance/electronica, funk, rap/hip-hop, reggae, and soul/R&B genres).
Individual differences
Recent work shows that people differ in how often they experience unusual aesthetic states in everyday life (Nusbaum et al., 2014; Nusbaum & Silvia, 2011, 2014). In a 10-item survey (Silvia & Nusbaum, 2011), people expressed how often they experienced three kinds of unusual aesthetic states—feeling chills, feeling touched, and feeling absorbed—while listening to music. Responses to items such as “When listening to music, how often do you completely lose track of time?” were given using a 1 (never or rarely) to 7 (nearly always) scale.
Procedure
People participated in groups of 1 to 8. Upon arrival to the lab, participants were briefed on the study and gave informed consent. Because all of the survey materials were presented electronically, people read instructions for and completed each survey at their own pace.
Results and Discussion
Model specification and data reduction
Multivariate and univariate regressions were used to evaluate the effect of physical anhedonia on several outcomes related to the experience and enjoyment of music listening. All analyses in this study were conducted in Mplus 7 using maximum likelihood estimation with robust standard errors. All effects are standardized unless otherwise noted. Confidence intervals (95%) are in square brackets. Because some outcomes were binary, they were analyzed with logistic models—thus, the coefficients are interpreted as logit differences. Overall, the distribution of physical anhedonia scores (M = 1.99, SD = 1.92, Min/Max = 0, 9) resembled the distribution from a large sample of over 6,100 UNCG students (M = 2.12, SD = 2.32, Min/Max = 0, 14). Reliability, estimated as H using a model for categorical items, was high (H = .93).
Valuing music
Do people high in physical anhedonia value music less than other people? Responses to the three questions regarding music value were averaged to create an estimate of how much people value music (Cronbach’s alpha = .83). Higher scores on the Physical Anhedonia Scale predicted significantly lower value of music (β = −.221 [−.353, −.089], p = .001). As we suspected, people high in physical anhedonia valued music less, overall, than people lower in physical anhedonia.
Unusual aesthetic states
Summary of the Effects of Physical Anhedonia on Unusual Aesthetic States: Study 1.
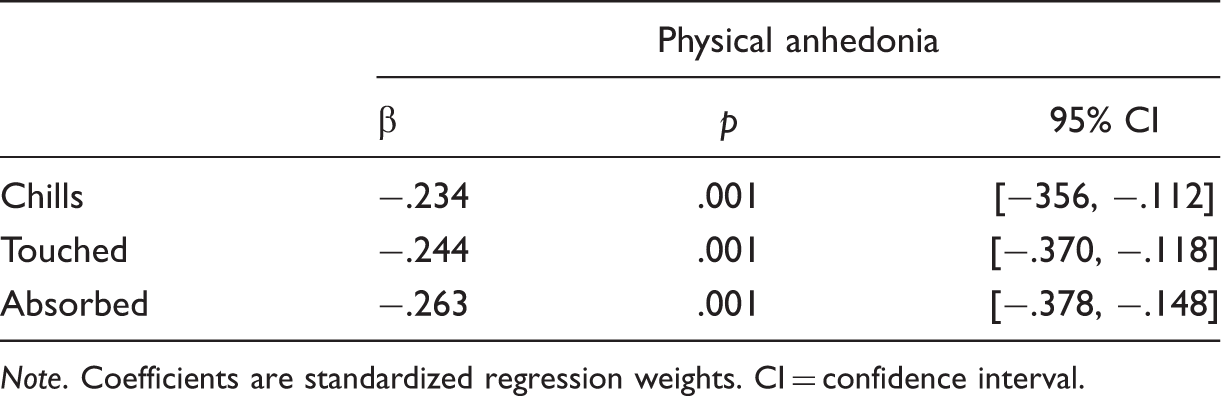
Note. Coefficients are standardized regression weights. CI = confidence interval.
Music genres
Summary of the Effects of Physical Anhedonia on Music Genre Preferences: Study 1.
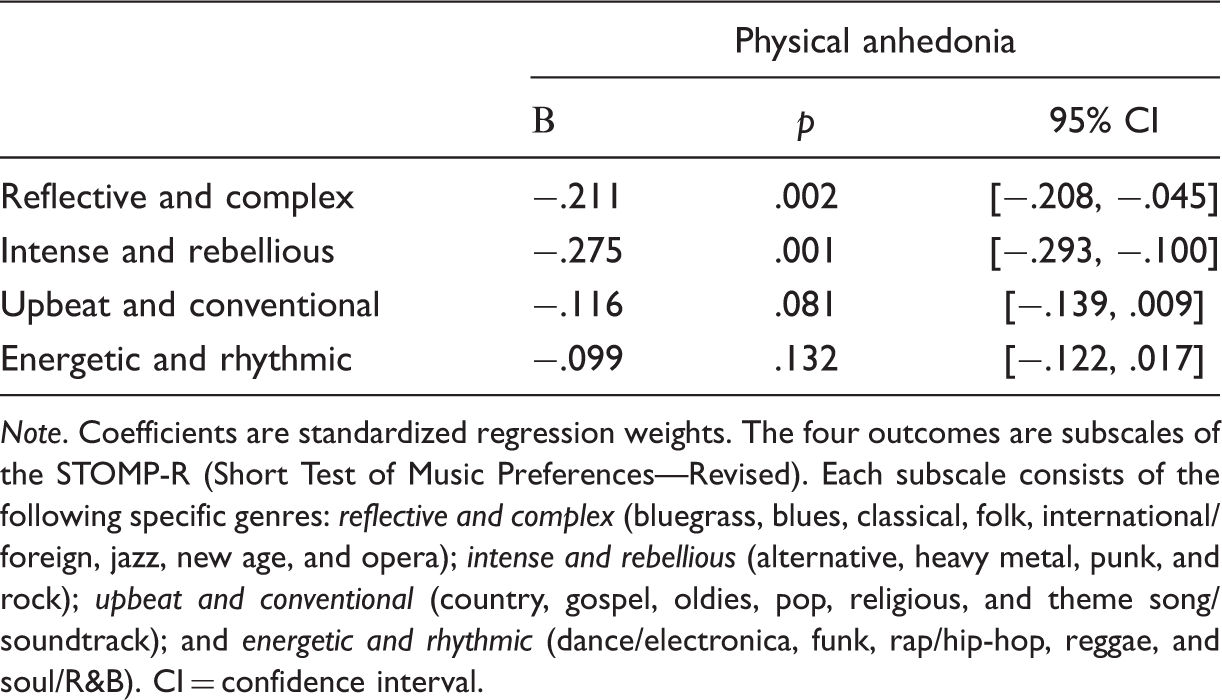
Note. Coefficients are standardized regression weights. The four outcomes are subscales of the STOMP-R (Short Test of Music Preferences—Revised). Each subscale consists of the following specific genres: reflective and complex (bluegrass, blues, classical, folk, international/foreign, jazz, new age, and opera); intense and rebellious (alternative, heavy metal, punk, and rock); upbeat and conventional (country, gospel, oldies, pop, religious, and theme song/soundtrack); and energetic and rhythmic (dance/electronica, funk, rap/hip-hop, reggae, and soul/R&B). CI = confidence interval.
Music experience
Summary of the Effects of Physical Anhedonia on Music Engagement and Experience: Study 1.
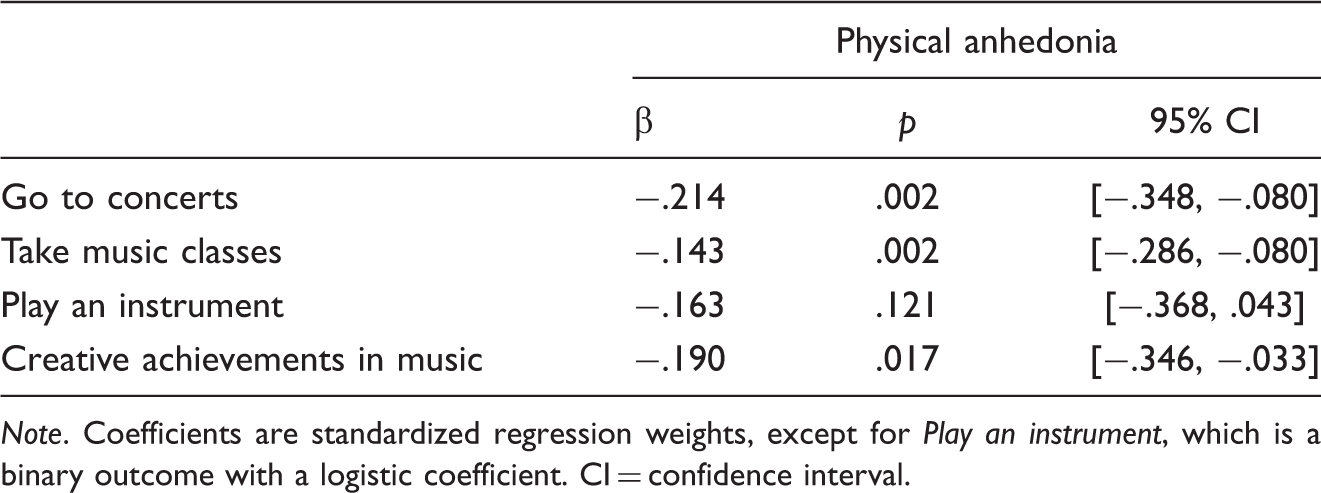
Note. Coefficients are standardized regression weights, except for Play an instrument, which is a binary outcome with a logistic coefficient. CI = confidence interval.
In summary, people high in physical anhedonia were less engaged with music listening and music experiences overall. They reported valuing music less, took fewer music classes, attended fewer concerts, and had fewer creative achievements in musical domains. People high in physical anhedonia also reported liking fewer genres of music than other people and experiencing fewer unusual aesthetic emotions when listening to music (i.e., feeling chills, feeling touched, and feeling absorbed).
Study 2
People high in physical anhedonia indicated in the laboratory that they liked listening to music less than other people, but do their music listening habits actually differ in everyday life? Persson and Robson (1995) have urged researchers to take assessment out of the lab and investigate musical experiences as they occur in everyday life. In Study 2, we used ESMs to examine the differences in music listening preferences and habits in the everyday routines of people who vary in physical anhedonia. People filled out multiple daily surveys asking about thoughts, music listening activities, and emotions. Because we assessed people during a typical week, the study allows us to determine whether music listening habits and experiences are predicted by physical anhedonia in everyday life.
Method
Participants and design
A total of 106 students from UNCG participated in this study as part of a broader study on the psychology of daily life (Beaty et al., 2012; Nusbaum et al., 2014); there was no overlap with the sample from Study 1. About 81% of our sample was enrolled in psychology classes at the university and volunteered for credit toward an optional course component. The remaining 19% of the sample were music majors, recruited from the university’s School of Music, Theatre, and Dance, who were paid $20 for their participation. We specifically recruited music majors in an effort to diversify our sample in terms of music listening habits. On average, participants were 19.6 years old (SD = 2.55). As is typical of the university’s demographic makeup, our sample was predominately women (73%).
Study 2 involved two parts. People first came into the lab to complete a series of questionnaires measuring aspects of personality, music experiences, and music preferences. They were then instructed about the experience-sampling procedure and the use of the telephone-based survey system.
Between-person measures
As in Study 1 described earlier, we administered the 15-item short form of the Physical Anhedonia Scale (Winterstein et al., 2011).
Experience-sampling procedure
After completing the initial survey and information session, participants began the experience sampling part of the study. For 7 days, they were surveyed 10 times daily at random intervals within a 12-hour window. (Because of variation in when people started and finished the study, some people received more than 70 total calls.) Participants chose their own survey windows (e.g., 8 a.m. to 8 p.m., 12 noon to 12 midnight) to ensure that the survey calls captured their waking hours. The surveys were administered via cell phone using SmartQ Interactive Voice Response software (Telesage, 2009), and all responses were given using the standard 0 to 9 telephone number pad (for a more detailed review of the survey software, see Burgin, Silvia, Eddington, & Kwapil, 2013). Each survey took about 2 to 3 minutes to complete and asked a series of questions about people’s current activities, thoughts, and emotions.
Survey questions were divided into three blocks. The first block asked people about current activities and emotions and included the following items: “Are you listening to music right now?” (yes or no), “Are you alone or with other people?” (alone or with others), “Right now, how happy do you feel?” (1 = not at all to 7 = very much), “Right now, how sad do you feel?” (1 = not at all to 7 = very much), and “Right now, how worried do you feel?” (1 = not at all to 7 = very much). The second block asked if people were listening to music and included the following items: “Did you choose this music?” (yes or no), “Does this music have special meaning to you?” (1 = not at all to 7 = very much), and “Are you listening closely to the music?” (1 = not at all to 7 = very much). The third block asked if people were not listening to music and included the item, “Right now, are you hearing music in your head?” (yes or no).
Compared with traditional palm-pilot methods, the SmartQ Interactive Voice Response (Telesage, 2009) system has a few unique advantages that increase response rates on the experience-sampling surveys. First, the software allows participants to choose their own 12-hour window of survey time based on when they are most likely to respond to survey calls. Second, it administers surveys using touch-tone responses on the participants’ own cell phones, which eliminates the need to carry around extra equipment that may be lost or left at home during the survey window. Finally, unlike traditional ESM procedures, people were able to return the call within 5 minutes to complete the survey if they were unable to answer the phone when the survey call was initiated, which reduces missing data (Silvia, Kwapil, Eddington, & Brown, 2013). Those participants who completed at least 70% of the phone surveys were entered into a drawing for one of two $100 Amazon.com gift certificates.
Results and Discussion
Data reduction and model estimation
The following analyses were run as two-level random effects models in Mplus 7 using maximum likelihood with robust standard errors. In accordance with Enders and Tofighi (2007), all Level 1 (within-person) predictors were group-mean centered and all Level 2 (between-person) variables were grand-mean centered. All coefficients are unstandardized; coefficients for the binary outcomes are logistic. As is typical in experience-sampling studies, people varied in how many surveys they completed (Silvia et al., 2013; Silvia, Kwapil, Walsh, & Myin-Germeys, 2014). Only people who completed at least one survey per day were included in these analyses. This reduced our final sample size to 98 people. The remaining sample answered about 46 surveys (SD = 15, Min/Max = 11, 77) during the week of experience sampling. Overall, the physical anhedonia scores resembled the distribution and reliability of Study 1 (M = 1.69, SD = 1.74, Min/Max = 0, 9, H = .84).
Frequency of music listening
Overall, people reported listening to music about 22% of the times they were surveyed. Did physical anhedonia predict listening to music less often in everyday life? To explore this question, we regressed the within-person frequency of music listening on the between-person measure of physical anhedonia. As we suspected, people higher in physical anhedonia were listening to music at the signal significantly less often than other people (b = −.108 [−.194, −.022], p = .014). We found in Study 1 that people higher in physical anhedonia reported listening to music less often; in the current study, we see that they are indeed listening to music in their daily lives less.
Context of music listening
Summary of the Effects of Physical Anhedonia on Context of Music Listening: Study 2.
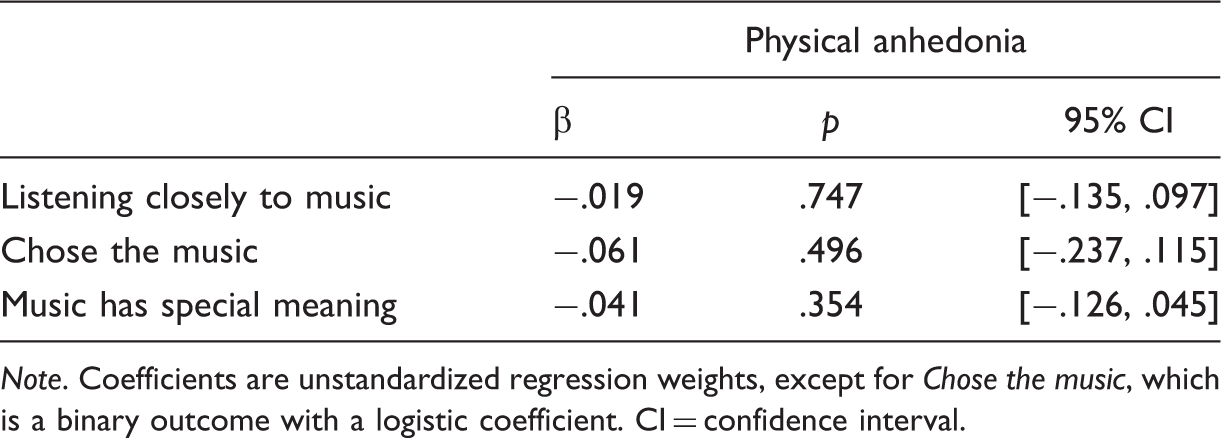
Note. Coefficients are unstandardized regression weights, except for Chose the music, which is a binary outcome with a logistic coefficient. CI = confidence interval.
Emotion and music listening
Does listening to music create different emotional states for people higher in physical anhedonia? This model examined cross-level interactions of physical anhedonia with listening to music to predict people’s emotional state. Here, music was the within-person (Level 1) predictor, physical anhedonia was the between-person (Level 2) predictor, and outcomes included feeling happy, feeling sad, and feeling worried. Essentially, this model examines whether the relationship between listening to music and emotional state is different among people with varying levels of physical anhedonia.
Summary of the Effects of Physical Anhedonia on Emotions: Study 2.
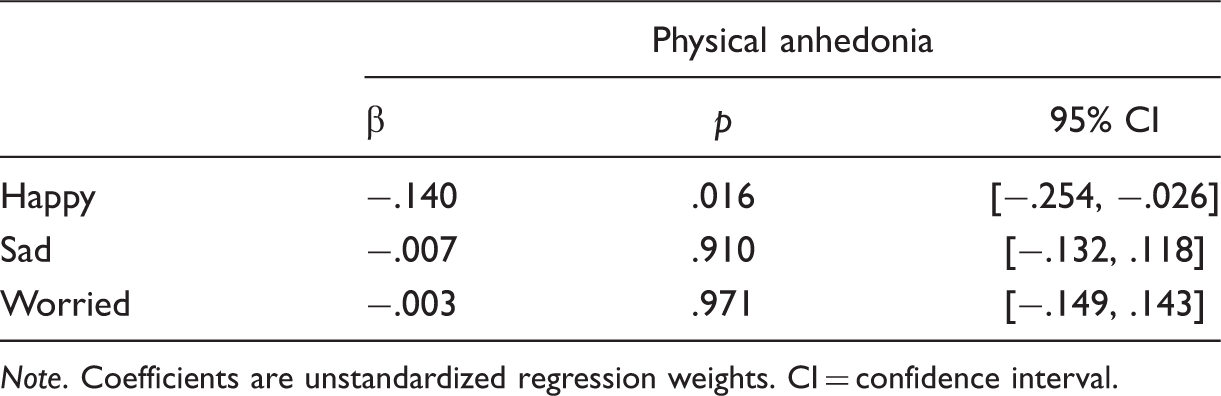
Note. Coefficients are unstandardized regression weights. CI = confidence interval.
Experiencing inner music
Do people higher in physical anhedonia experience inner music (i.e., hearing music in your head when not listening to music) less often than other people? To examine this, we regressed the binary inner music variable on physical anhedonia. We found that although physical anhedonia was not a significant predictor of hearing inner music, the estimate of logit change was in the expected (negative) direction (b = −.133 [−.326, .060], p = .178).
General Discussion
The present studies indicate that people higher in physical anhedonia listen to and enjoy music less than other people. But what makes them feel this way? Earlier work has provided some hints—people high in physical anhedonia show aberrant processing and anticipation of positive, rewarding stimuli (Dowd & Barch, 2012; Harvey et al., 2007)—but did not address how everyday music listening experiences are encountered and perceived by people higher in physical anhedonia. In two studies, we thus explored how physical anhedonia predicts how people engage with and experience music.
In Study 1, we used multivariate methods from a cross-sectional study to examine whether physical anhedonia predicts different aspects of self-reported music listening, music value, and experience with and engagement in music. Our hypotheses were supported: People with higher physical anhedonia scores valued music less, had less music experience, liked fewer types of music, and experienced unusual aesthetic states like chills, goosebumps, and feeling absorbed less often. These findings may account for some of the inexplicably wide variability in earlier studies of music listening and aesthetic experiences (Nusbaum & Silvia, 2014; Silvia & Nusbaum, 2011). For example, research on aesthetic chills shows that some people (perhaps 8% to 12%; Nusbaum & Silvia, 2011) report never having experienced chills from music, whereas most people experience chills occasionally and some report feeling chills almost daily (Grewe, Nagel, Kopiez, & Altenmüller, 2007; Grewe et al., 2009; Nusbaum & Silvia, 2011; Silvia & Nusbaum, 2011). Measuring physical anhedonia in future work might help account for such wide variation in experiences of music, although it certainly isn’t the only relevant trait for understanding musical disinterest.
In Study 2, we expanded on these findings by using experience sampling to explore how people experience music in their everyday lives. Multilevel models showed that our hypotheses were again supported: High physical anhedonia scores predicted listening to music significantly less often and feeling significantly less happy in everyday life. In addition, we found a significant interaction between physical anhedonia, feeling worried, and listening to music—people high in physical anhedonia felt more worried when listening to music than other people did. The results of Study 2 dovetail nicely with neuroimaging studies that show (a) that when people in general listen to music, there is increased activity associated with pleasurable experiences and (b) that when people high in physical anhedonia are exposed to enjoyable stimuli, there is less activity in areas of the brain associated with pleasure and more activity in areas associated with fear processing.
It’s worth noting some limitations of the present work. For one, all the participants were college students. As a group, college students are known for being particularly engaged with music. On the one hand, this makes musical disinterest harder to detect, so the present studies offer good evidence for it. On the other hand, a broader, more diverse sample would allow more variability in some aspects of musical experience, such as the number of creative achievements in music and the kinds of music genres people preferred. Furthermore, it would be worth extending this work with a broader range of physical anhedonia. The average level of physical anhedonia was close to large norm samples (Gross et al., 2012), but people with unusually high scores are an interesting population and would be worth oversampling in future work. Such research could examine the generality of the diminished pleasure from music. For example, it seems likely that physical anhedonia would predict diminished pleasure in many aesthetic domains, from nature to visual art to the built environment, so diminished musical pleasure is probably part of a general reduction in aesthetic pleasure.
Taken together, the current studies suggest two things for future research in the psychology of music preferences, experiences, and everyday uses. First, as Study 1 suggested and Study 2 demonstrated, people higher in physical anhedonia are actually listening to music less often in their everyday lives, and their relative lack of enjoyment and engagement suggest that they are a group worth future study. Second, although this study was successful, we did find a somewhat low base rate of listening to music: Only about 22% of time people were surveyed, they were also listening to music. Juslin et al. (2008) found people were listening to music 37% of the time, and Sloboda et al. (2001) found that people were listening to music about 44% of the time. This suggests that event-triggered sampling—in which people complete surveys any time they are engaging in the target behavior (Moskowitz & Sadikaj, 2012)—may also be a fruitful avenue. In this approach, people would be signaled to complete a questionnaire whenever a target event occurs, such as whenever someone has listened to music for more than 10 minutes or whenever people play a song that has special meaning for them. By narrowing and specifying the context, event-contingent sampling methods can allow a fine-grained look at how people respond to important situations. In any case, the family of ESMs is clearly fertile for understanding how people engage with—or don’t engage with—music during their everyday lives.
Footnotes
Author Note
This research was presented at the 2014 meeting of the American Psychological Association in Washington, DC.
Declaration of Conflicting Interests
The authors declared no potential conflicts of interest with respect to the research, authorship, and/or publication of this article.
Funding
The authors received no financial support for the research, authorship, and/or publication of this article.