
Abstract
Culture encompasses all meanings created by humanity, while cultural communication refers to the process of creating shared meanings. Museums, as carriers of cultural heritage, play a crucial role in sustaining this communication. In today's digital era, the synergy emerging from interactions among museums holds great significance. This study investigates the global museum network using Social Network Analysis (SNA) to examine centrality, community structures, and roles, complemented by Principal Component Analysis (PCA) for deeper structural insight. Conducted in R, the analysis revealed that the National Gallery of Victoria leads in betweenness centrality, while the Musée du Louvre and the Metropolitan Museum of Art dominate in closeness, degree and eigenvector centrality. The results show a Western-centric network, with museums in Paris, New York, and London occupying central positions. The findings emphasize the importance of fostering a more balanced and inclusive structure for global cultural communication.
How Instagram Connects Museums Around the World
Museums are much more than just spaces for cultural heritage; they are also active participants in global cultural communication. Therefore, how the world's leading museums are connected in the digital age and which museums have a higher reach is a crucial issue.
This study maps the Instagram follower relationships between fifteen of the world's most visited museums, as derived from The Art Newspaper's 2024 global ranking. Using Social Network Analysis (SNA) and Principal Component Analysis (PCA), it examines which museums occupy central positions, which act as bridges between regions, which have limited visibility within the network, and which are located in isolation on the periphery of the network.
The findings point to a strongly Western-centric network. The Musée du Louvre and the Metropolitan Museum of Art stand out as dominant centers, while the National Gallery of Victoria and the Museum of Modern Art (MoMA) play key bridging roles between geographic communities. Asian museums such as the Shanghai Museum and the National Museum of Korea, despite significant visitor numbers, are located on the periphery of the network.
These patterns indicate that digital platforms like Instagram, rather than democratizing cultural communication, tend to reinforce existing hierarchies of institutional prestige. Closing this gap requires a conscious series of actions. In this regard, support programs for regional museums, joint exhibitions between regions, and policies that increase the digital visibility of underrepresented institutions can be considered important.
Introduction
Cultural communication is an integral part of life, a valuable field of communication that functions as a carrier of humanity's cultural progress. Along with the function of cultural communication, how this communication process is conducted is also considered a crucial point. Today, when we talk about cultural communication, we can consider that there are many actors in the art world. It is possible to mention many actors, from producers (artists, artisans, etc.), exhibitors and distributors (museums, fairs, etc.), market actors (collectors, investors, etc.), financial and support structures (sponsors, foundations, etc.), producers of criticism and discourse (curators, critics, academics, etc.), to publishing and distribution networks (magazines, publishing houses, digital platforms, etc.). Considering that each actor contributes differently to the art world, it can be said that those actors, particularly those responsible for exhibition and distribution, stand out and differentiate themselves from others due to their valuable role in disseminating “cultural communication.” Within this framework, museums can be considered to have established themselves as significant actors. It is known that museums, as part of their existence, occupy a central position in the cultural transmission process, maintaining their function as carriers of culture. However, the extent to which each museum's independent activities contribute to this process remains unclear.
Museums can be thought of as operating independently through social media channels aimed at the general public. However, while many museums have an independent communicative and interactive presence in digital media, it's also possible to speak of the existence of a global museum network. When museums are positioned as actors operating within a global network, their connections and interactions not only with the public but also with each other become crucial. Digital platforms are emerging as one of the most effective ways to establish this connection and interaction in today's digital world.
A review of the literature reveals numerous studies on museums’ use of social media platforms, specifically Instagram, in their interactions with visitors. Jarreau et al. (2019, pp. 1–2) analyzed museums’ use of Instagram using content analysis. They focused on whether museums were promoting, disseminating scientific knowledge, sharing research and collections, and encouraging public engagement. The study revealed that museums were missing opportunities to promote informal education, foster scientific literacy, engage with the public, and promote the public visibility of scientists. They focused on the end results of collections and curatorial work rather than the communication of science. Therefore, they recommended creating Instagram posts that offer exhibition creation, behind-the-scenes insights, and visibility. Budge (2017, p. 67) examined the textual and visual sharing of museum visitors on Instagram. The study found that museum visitors shared content to share details of their experiences, highlighting the exhibition content (especially the objects), and to record their experiences. Rodríguez-Vera et al. (2024) analyzed public interaction in five European museums via Instagram, highlighting the value of listening and interacting with user content in relation to reputation and image, demonstrating the importance of two-way communication. Suess and Barton (2022) examined visitors’ Instagram use practices and the reasons for using Instagram during the experience phase, concluding that visitors use Instagram for purposes such as enhancing aesthetic experience, sharing experiences, and organizing gallery space. Larkin (n.d.) demonstrated that museums disseminated information and provided visual representations through postcards even before social media. Suess (2020, pp. 2–4) argued that Instagram is more than just a social media tool; it provides museums with significant institutional opportunities. Suess (2018, p. 107), by researching exhibition visitors’ use of Instagram, found that Instagram use expands the aesthetic experience by taking visitors beyond the physical space. Weilenmann et al. (2013, p. 1843) showed that museum visitors use Instagram to reconstruct their museum experiences and create their own narratives.
The above studies focused on the connection between museums and individual actors. However, the interaction between the art world and, specifically, museums is also important. Foka (2022) proposed a methodology for creating a network that maps the current structure of the art world, creating an artworld network. It has been demonstrated that many more artworld actors can be identified using Natural Language Processes (NLP). The study examined tweets posted by a cluster of art world actors to determine mentions, retweets, and interactions with friends. The Artworld network, as a rich data source, was found to provide data on the global transformation of contemporary art, the influence of art world actors on art production processes, and the roles of these actors in these processes. Vrana et al. (2021) examined the performance of the Instagram accounts of the world's most visited museums and their interconnectedness through SNA, revealing that the network formed by these accounts is small.
Given the limited research on the interactions between art world actors and museums, focusing on the structure and nature of these interactions is a gap in literature. In this context, considering the aforementioned general and specific spaces, focusing on the interaction between museums, particularly as carriers of cultural communication, rather than the interaction of all art actors in general, has the potential to create a more specific perspective. Rather than understanding the interaction of all actors in general, focusing on museums within the art world allows for a more detailed examination of museum interaction, thus offering an opportunity to deepen and diversify research specifically on museums. Based on this perspective, this study examines the location and interconnectedness of actors within the global museum network. Focusing on Instagram, a social media platform, the nature of these interactions is discussed using a sample of the most visited museums and their locations. A situational analysis is conducted by examining the interconnectedness of museums rather than their relationship with individuals.
Theoretical Background
Various definitions of culture have been offered in the literature, and these definitions offer different perspectives on how culture shapes the relationship between individuals and society. Schim and Doorenbos (2010, p. 256) describe culture as the mechanism by which people learn how to exist in the world, how to behave, what to value, and what gives meaning to existence. Geertz (2013) defines culture as “a historically transmitted pattern of meaning embodied in symbols, an inherited system of understanding expressed in symbolic forms through which people communicate, maintain, and develop their knowledge and attitudes about life.” Swidler (1986, p. 273) argues that culture consists of symbolic means of meaning such as beliefs, ritual practices, art forms, and ceremonies, as well as informal cultural practices such as language, gossip, stories, and the rituals of daily life. These various definitions offer different perspectives on how culture shapes the relationship between individuals and society. As can be seen, culture is not merely a matter of behavior; it also encompasses abstract elements such as values, beliefs, symbols, norms, ways of thinking, and understandings of time and space.
Drion (2022) emphasized that culture should be considered not in terms of what it is, but rather as the way in which it is “communicated,” essentially a process. According to the author, viewing culture solely as “communication about culture” or “transmission of culture” is insufficient; culture itself should be conceptualized as a process of “communication” (Drion, 2022, p. 5). This approach allows for the blurring of the boundaries between culture and communication, and even the possibility of discussing the existence of the term “cultural communication” as a specific form of communication for culture.
Cultural communication can also be considered as the process of creating and affirming a shared identity through elements such as autonomy and unity, individual and community (Carbaugh, 2013, p. 5). Cultural communication is defined as the process of activity that generates and organizes shared meanings for social life, which serves to enable members of society to act meaningfully and coordinately in relation to the communicative demands of people in their lifeworld (Philipsen, 2003, pp. 35–36). Cultural communication also involves a sense of shared identity. Thus, it also involves shaping daily life. Cultural communication is more than simply using common patterns; it is about directing people's senses, performances, and evaluations, in other words, producing their actions, in relation to the reproduction of history and shared emotion (Carbaugh, 2013, pp. 5–6).
Museums play a crucial role in cultural communication. Given that cultural communication is historical and linked to shared emotions, one of the carriers of these elements is undoubtedly the production of artworks. Furthermore, museums, not only through the artworks they contain but also as spaces, are representatives of culture and have specific communicative responsibilities. Museums are considered to have a responsibility and duty to promote cultural exchange (Li, 2024, p. 2). In this respect, it can be argued that museums, as carriers of culture, should be positioned as important actors in cultural communication.
When it comes to communication, the concept of interaction emerges. The functioning of a social system is made possible through interaction. Interaction, as a structure between actors, reflexively rewrites the past from a present-tense perspective, potentially rewriting it. Therefore, it can be considered an evolutionary category at the network level, related to the mutual expectations of actors (Leydesdorff, 2008, pp. 163–164). In this context, the interaction of actors, such as museums, can be considered important in the context of cultural communication. It can be argued that cultural transmission can occur through interaction, and the shared cultural heritage created by humanity can be shared.
Considering the channels through which interaction can be established, the internet can be said to be the most effective tool today. Social media, in particular, can be considered to hold a significant place on the internet. In this era, where higher levels of interaction and participation are expected, museums have turned to social media to maintain their current status, integrating it into their processes for achieving their goals, such as disseminating information, promoting programs, and engaging with others (Jarreau et al., 2019, pp. 1–2). While museums can utilize various social media platforms such as YouTube, X, and Facebook, Instagram, in particular, appears to be heavily used due to its visual structure. It is believed that Instagram can generate revenue by emphasizing interaction, enabling not only visual and textual representations or the sharing of experiences but also the ability to listen to and observe audiences (Budge, 2017, p. 70).
Beyond this individual perspective, the institutional interaction between museums is also crucial. From a cultural communication perspective, collective efforts are crucial for museums, as cultural bearers, to maintain or increase their visitor numbers. When institutions come together, just like individuals, they can create broader impacts. The interconnectedness of museums, like other institutions, means that museums operating with similar objectives can expand their spheres of influence and leverage each other's prestige and standing. In this respect, it's crucial to seek platforms or tools that enable or sustain collective efforts, and to turn to digital channels as enablers of interaction in a digitalized world.
Instagram can be considered one of the most suitable platforms for museums’ interactions with each other, just as it is for communication with the public. Instagram is known as a high-capacity platform for generating interaction and reaching various actors (Sanches & Ramos, 2025, p. 2). Considering that Instagram also serves as a meaning-making platform, it can be considered important for sharing cultural elements and creating shared meanings. Just as museums can reach their visitors through Instagram, they can also reach other museums. In this respect, it can be said that social media, and specifically Instagram, has become a crucial access tool for all museum interactions.
Cultural communication collaborations can be sustained through Instagram. Similarly, Instagram can be considered a facilitator for joint activities or for planning face-to-face collaborative activities. In this context, if museums are positioned as actors or nodes within a larger network, it is important to consider social media tools, specifically Instagram, in determining their position within this network. This allows us to identify how museums can participate in the global museum network to conduct cultural communication activities and the connections between museums.
However, at this point, a specific problem can be considered arises in terms of representation. There are numerous museums in the world, and their potential for global interaction varies. This potential difference can be considered to create problems in terms of visibility. A certain imbalance in terms of participation among actors can also be anticipated. Nevertheless, despite this imbalance, it can be said that digital channels offer significant potential for cultural communication efforts. Being visible, rather than being invisible, creates the basis for greater engagement. Utilizing this platform is crucial for expanding the global museum network's interactional reach within the context of cultural communication.
When considering the communication function of museums, issues such as education, the maintenance and dissemination of national memory, the use of technology, media image presentation, and cultural narrative forms come to the fore (Li, 2024, p. 2). In addition to these issues, it can be argued that museums need to consolidate, or in other words, integrate, their communication function. As the sub-folds of a whole, the common carriers of world cultural heritage, museums must capitalize on each other's strengths, increase their influence, and support each other to achieve visibility. They must interact to ensure this support.
Study
Study Universe and Sample
The universe of this research consists of art museums and cultural institutions operating globally. The study sample was determined based on The Art Newspaper's 2024 list of the “World's 100 Most Visited Museums.” The Art Newspaper was chosen because it is considered a reliable and respected publication in the international art field. This annual report provides up-to-date, comparable, and globally accepted data on museum visitor numbers. In this context, the list provides a strong basis for analyzing visitor trends, cultural appeal, and the international visibility of art institutions in museums across various geographic regions.
In this study, 100 museums from the list published by The Art Newspaper were examined, preserving their rankings. To increase geographical representation, museums were classified by continent (Europe, Asia, Australia, North America, and South America). Based on this classification, the top three museums on each continent were included in the sample. This resulted in a total sample of 15 museums. However, network analyses revealed that a significant portion of the three museums in South America did not exhibit interaction, or in other words, did not establish a follow-up relationship with other museums within the network. Since the list of 100 museums did not include any other museums from South America besides these three, it was not possible to include different South American museums in the sample. In other words, another museum that would represent the South American continent could not be found. If there had been more than three museums in the list of 100, it would have been possible to eliminate them from the highest ranking to the lowest. However, since this was not possible, in order not to weaken the holistic structure of the analysis and to avoid reducing the sample size, museums located in Mexico, the region closest to South America, were included in the sample, considering geographical proximity and potential for cultural interaction. This classification allowed for the analysis of museums not only based on visitor numbers but also within the context of their cultural and geographical locations. Therefore, this study allows for a comparative assessment of regional differences in global museum practices, the ways in which cultural communication occurs across continents, and the international impact of art institutions.
In this study, the continent-based narrowing of the list of 100 museums is not a random reduction, but rather a methodologically conscious form of sampling. Purposive sampling in scientific studies means selecting a research object to explain the fundamental problem and phenomenon (Creswll, 2013, p. 156). With this approach, instead of a network representing specific geographies, an attempt was made to construct a balanced structure where different continents contribute to the network structure and make comparability stronger. Purposive sampling makes it possible to capture large variations—meaningful differences (Patton, 2015, p. 462). In network studies, sampling (well-defined and with clearly defined boundaries) is known as an applied perspective when considering population, time/resource, etc. (Wesserman & Faust, 1994, pp. 33–34). On the other hand, the visual structure of social network analysis also supports this choice. As the number of nodes increases, the interpretability of SNA metrics can become more difficult. Although node-connection diagrams are frequently used for visualizing networks, they can lead to a “hairball” appearance when the graph reaches a certain complexity (Yoghourdjian et al., 2020, p. 1677). This makes it difficult to read the network structure and can impair the analytical usability of the network. While all members can be included in the graph in medium or smaller-scale networks, the number of members that can be shown in detail may decrease as the network grows (Schulz, 2014, p. 23).
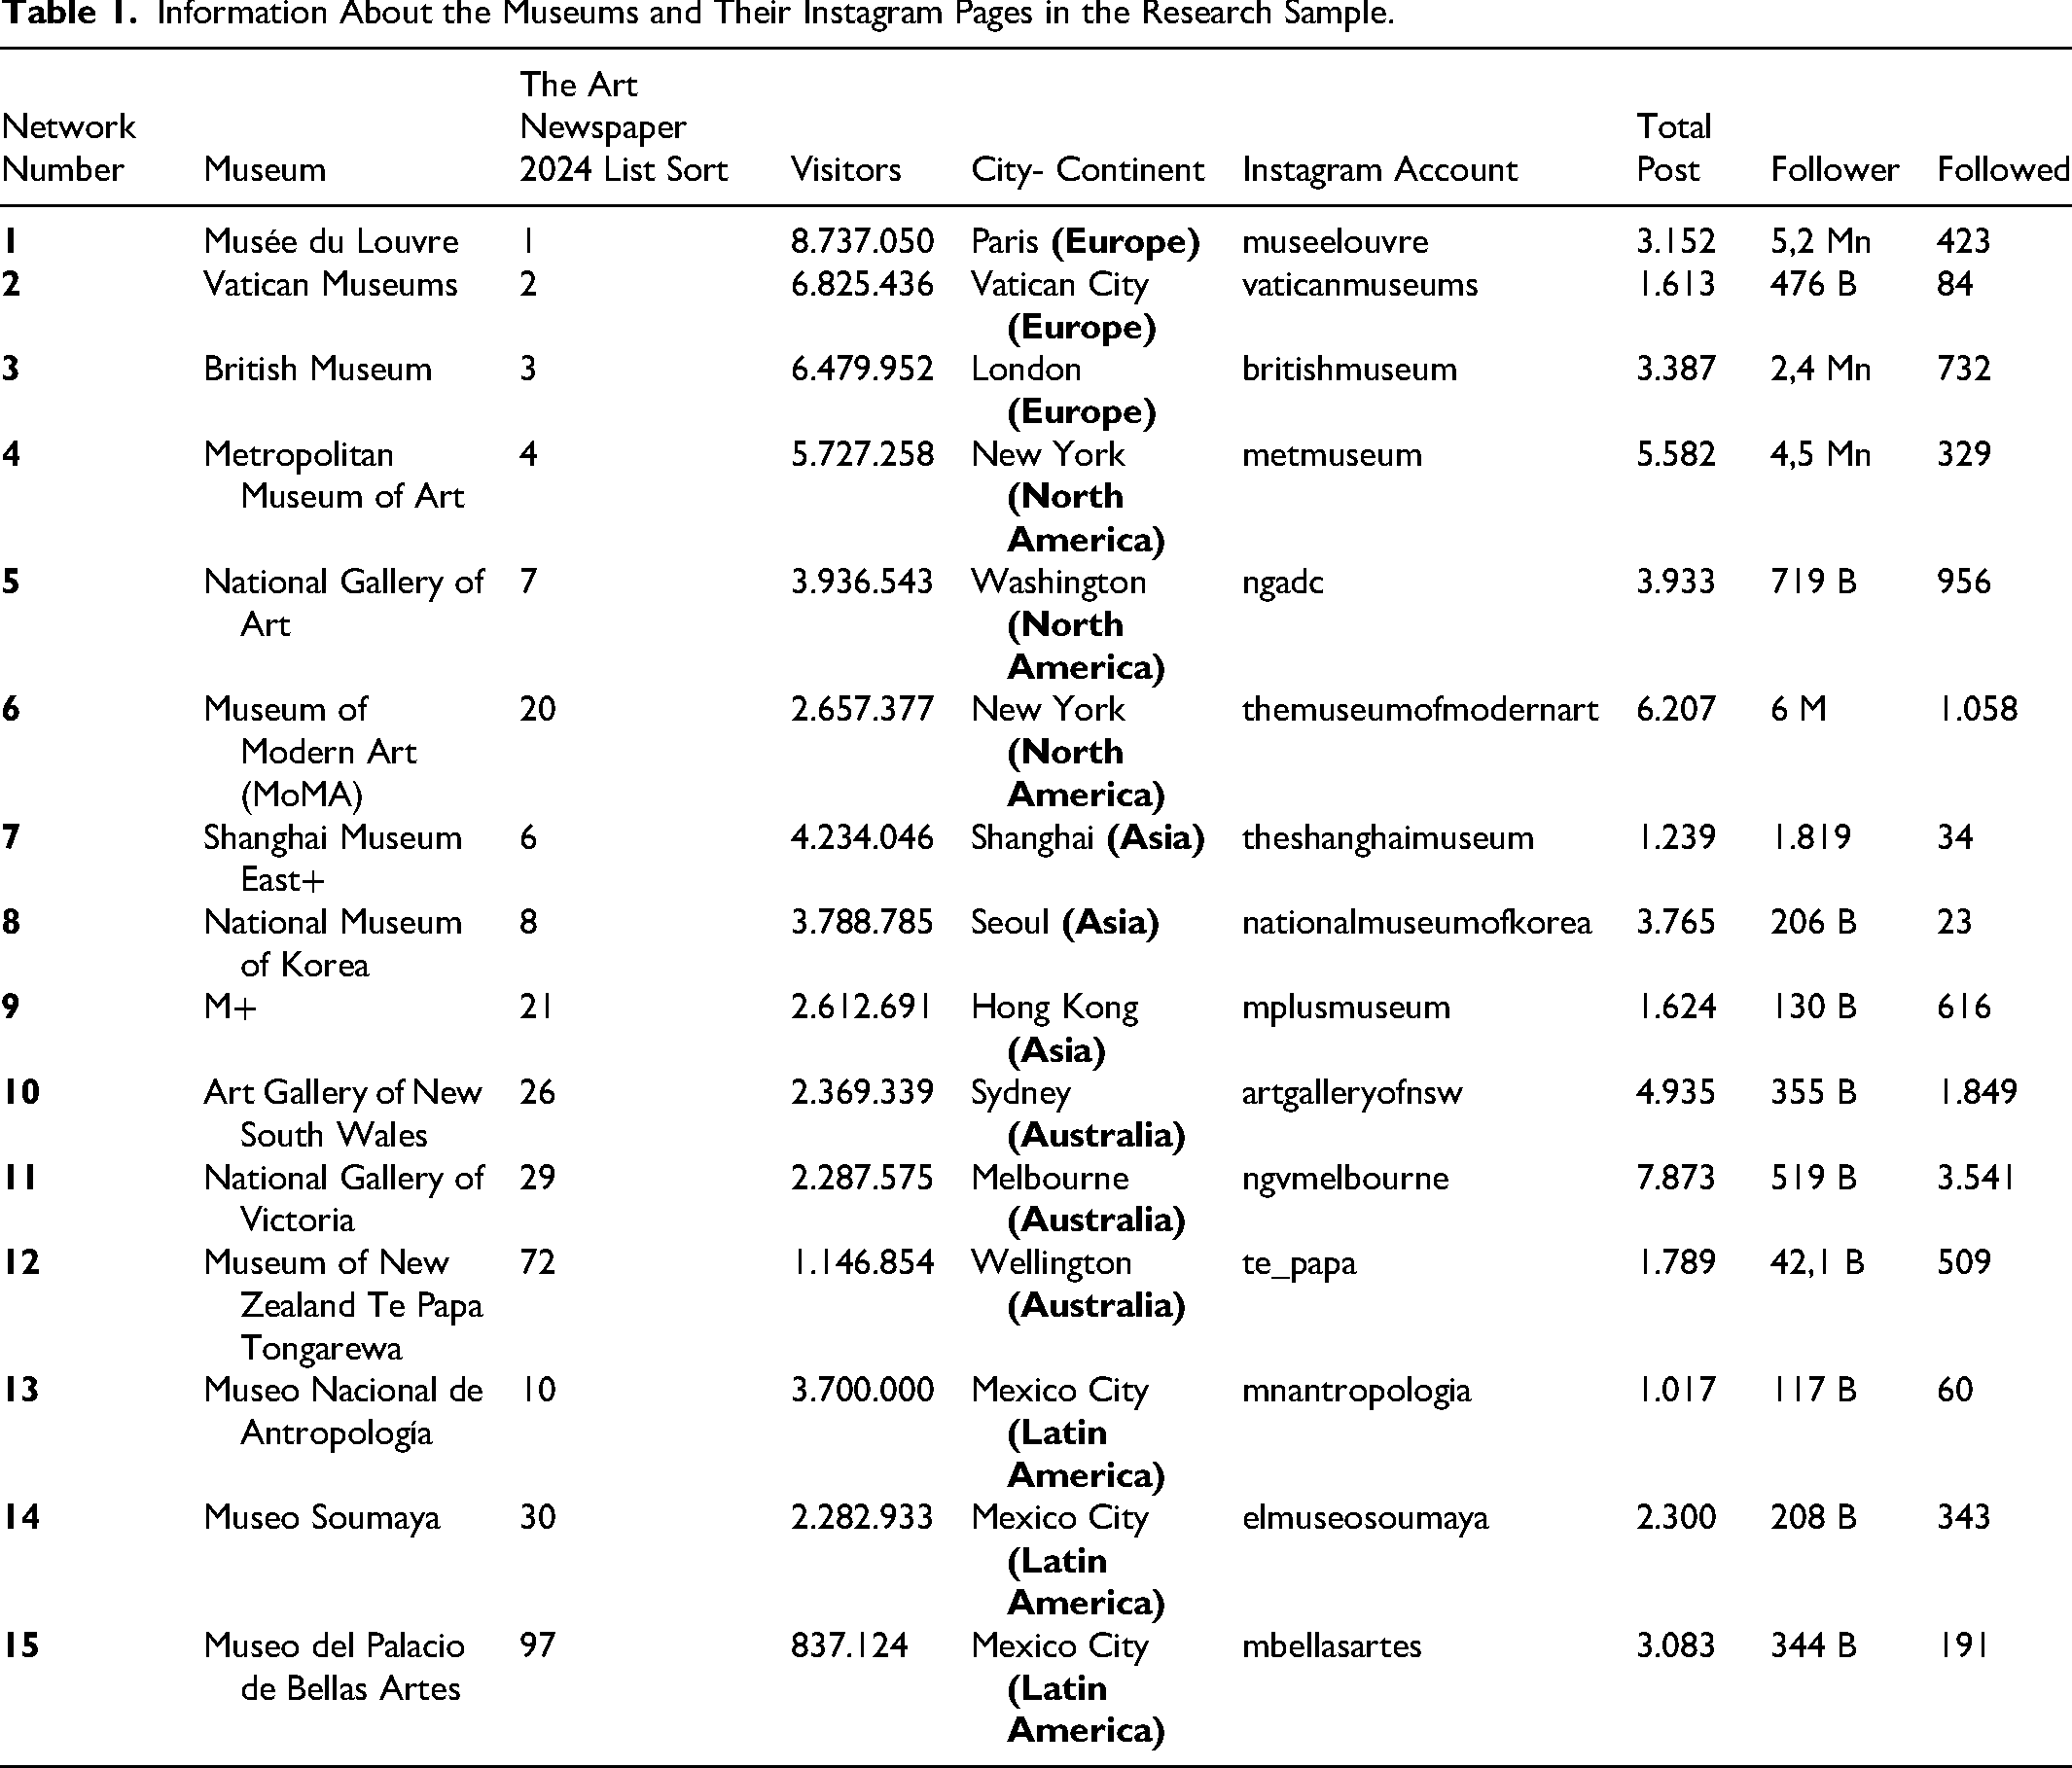
The sample museums and their Instagram accounts selected from the “World's 100 Most Visited Museums” list published by The Art Newspaper in 2024 are presented in the table below, as of October 24, 2025:
As seen in Table 1, the Musée du Louvre, the Vatican Museums, and the British Museum stand out as the museums with the most physical visitors. Conversely, the Museum of Modern Art (MoMA) stands out as the museum with the most followers on Instagram. Following MoMA are the Musée du Louvre and the Metropolitan Museum of Art. The National Gallery of Victoria, the Art Gallery of New South Wales, and the Museum of Modern Art (MoMA) are the museums with the most followers on other accounts. In terms of total posts, the National Gallery of Victoria, the Museum of Modern Art (MoMA), and the Metropolitan Museum of Art are the leading ones.
Information About the Museums and Their Instagram Pages in the Research Sample.
Method
This study utilized social network analysis (SNA). Social network analysis is known as an approach that examines the connections (edges) between actors (nodes) and extracts structural patterns from these relationships (Balaji et al., 2021; Tuncay & Savaş, 2025). In this study, the concept of interaction is defined through museums following each other on social media platforms, specifically Instagram; thus, follow relationships are considered and processed into the network as a link (edge). In this study, Instagram follow data was collected manually, and each follow relationship was defined as a directional edge. When one museum follows another, an edge is created from the following institution to the followed institution, and this structure was created in the R programming language. The purpose of this analysis is to describe hubs, bridges, communities, and communication structures. Centrality measures used in the social network phase (Betweenness centrality, Closeness centrality, Degree centrality, and Eigenvector centrality) allow the structural position of nodes in the network to be assessed across various dimensions.
Betweenness centrality measures the number of shortest paths and their shared role in a network. In this metric, nodes that are more frequently present on the shortest paths between other nodes receive a higher score. The significance of a higher score is assessed through the likelihood of interconnectedness to increase knowledge ownership and data volume (Ayoub et al., 2022, pp. 2–4). Betweenness can also be considered in terms of an actor's strategic position in the network, the criticality of their presence, and their bridging function.
Closeness centrality is used to express the shortest path length in a network. Central vertices receive higher values in this metric (Sulaiman et al., 2016, p. 68). Actors with high values are thought to excel at disseminating information quickly and facilitating resource flow, thus occupying a central position in the network's operation. This can be considered in terms of issues such as the speed of communication processes and the efficiency of information dissemination, or overall network access and communication efficiency.
Degree centrality measures the number of actors directly connected to a single actor (Ledesma González et al., 2021, p. 657). This metric measures the interactional power of nodes within the network, using their density and number of connections. A high value is associated with centrality and the ability to influence the network. This also reveals a node's interactional capacity, level of influence, visibility, and reach.
Eigenvector centrality focuses on determining how well an actor is connected to other well-connected actors. As a more nuanced version of Degree, it also takes into account the quality of connections, assuming that not all connections have the same importance (Tabassum et al., 2018, p. 6). This metric can be thought of as the influence and prestige of actors. Concepts such as social influence, leadership, and reputation are evaluated with respect to actors in the network.
Additionally, role detection was also implemented regarding the roles of actors in the network. Role analysis, a method used to understand the structural characteristics of a network and the functions of nodes, considers not only the number of connections in a network but also the positions of the nodes. Role and position detection methods are used to determine the structure of a social network and its member behaviors (Vega et al., 2015, p. 1). By calculating degree, betweenness, closeness, and eigenvector centrality metrics of the actors constituting the network, the strength of the actors’ connections, their effectiveness in transportation, and their position in the information flow were revealed. Actors were classified into four roles: leader, bridge, other, and marginal. Roles were determined through hierarchical clustering analysis using four centrality measures (degree, betweenness, closeness, and eigenvector). Clusters with high degree, closeness, and eigenvector values were labeled as leaders; clusters with similarly high centrality values and significantly high betweenness values were labeled as bridge clusters; clusters with medium values were labeled as other; and clusters with the lowest values were labeled as marginal.
In this study, the Laiden Algorithm was also utilized to determine the clustering status of the network. The Leiden approach is known to provide precise community detection. Unlike the Louvain approach, this approach offers advantages in terms of guaranteed convergence, refinement phase, quality of communities, and reproducibility, revealing clusters in the network (Patil et al., 2024, pp. 8–9). In community analysis, a Q value approaching 1 emphasizes strong community structure (Li & Schuurmans, 2011, p. 1366; Sah et al., 2014, pp. 3–4). A low resolution value indicates a small number of groups, while a high resolution value indicates a large number of groups (Traag et al., 2019, p. 2).
In this study, Principal Component Analysis (PCA) was applied to centrality indicators to analyze the structural properties of the network more comprehensively. Principal component analysis is known as a method used to reduce a data table into its basic features, called principal components, based on variables (Greenacre et al., 2022, p. 1). Principal component analysis (PCA) is a technique that minimizes information loss while reducing the size of data sets to increase interpretability (Jolliffe & Cadima, 2016, p. 1). The analysis aims to reveal the common dimensions (components) formed by variables by explaining the variance structure and thus reveal the correlation level between variables. PCA reduces multidimensional data to a small number of meaningful dimensions, allowing us to identify which indicators move together. This method aims to reveal which “structural dimension” the variables in the study (degree, betweenness, closeness, and eigenvector centrality metrics) represent. This method attempts to validate the conceptual structure of the study. Indeed, PCA has been used in similar research in literature. Wang et al. (2025, p. 2) used PCA to reduce the complexity of network measurements of degree, betweenness, closeness, and eigenvector centrality. Yip and To (2023, p. 482) used SNA results as PCA input by obtaining metrics such as in-degree, out-degree, betweenness, and closeness centrality. This approach was preferred to ensure that the resulting basic components contain information from all metrics in a balanced way and to avoid any shortcomings or contradictions created by looking at only one metric. Vignery and Laurier (2020, p. 11, 19) argue that PCA is an approach that allows determining which centrality metrics best represent nodes within a network, and they have identified the contribution of each metric to the dimensions. This approach aligns with our study. In our study, supporting these approaches, the betweenness, closeness, degree, and eigenvector centrality values of each museum were given as variables, and the museums as observation units as inputs to PCA. In the resulting biplot, the distribution of both museums and metrics was visualized, and their contributions to the dimensions and explanation ratios were evaluated. It can be said that PCA has benefits, particularly in terms of revealing structural similarities between museums, understanding the relationships between metrics, minimizing information loss by reducing dimensions to facilitate interpretation, and addressing complex relationships in a single visualization.
All statistical and network-based analyses in this research were conducted using the R programming language (version R.4.4.3). R is an open-source statistical computing and visualization environment widely used for data analysis, modeling, and graphical production across a wide range of disciplines, including the social sciences (The R Project, 2025). R software has a large ecosystem of packages that enable reproducible execution of multivariate analyses, social network analyses, and data visualizations. The following libraries were used in this study: igraph, ggraph, ggplot2, ggrepel, stats, FactoMineR, dplyr, and RColorBrewer. The data is shared in Appendix A.
Findings
The study initially focused on four centrality parameters. In addition to presenting the centrality parameters collectively, role analyses of network actors were also conducted. Table 2 presents the results of the relevant parameters and the distribution of roles within the generated network.
Centrality Measures and Role Analysis of Official Museum Instagram Accounts of Most Visited Museums.
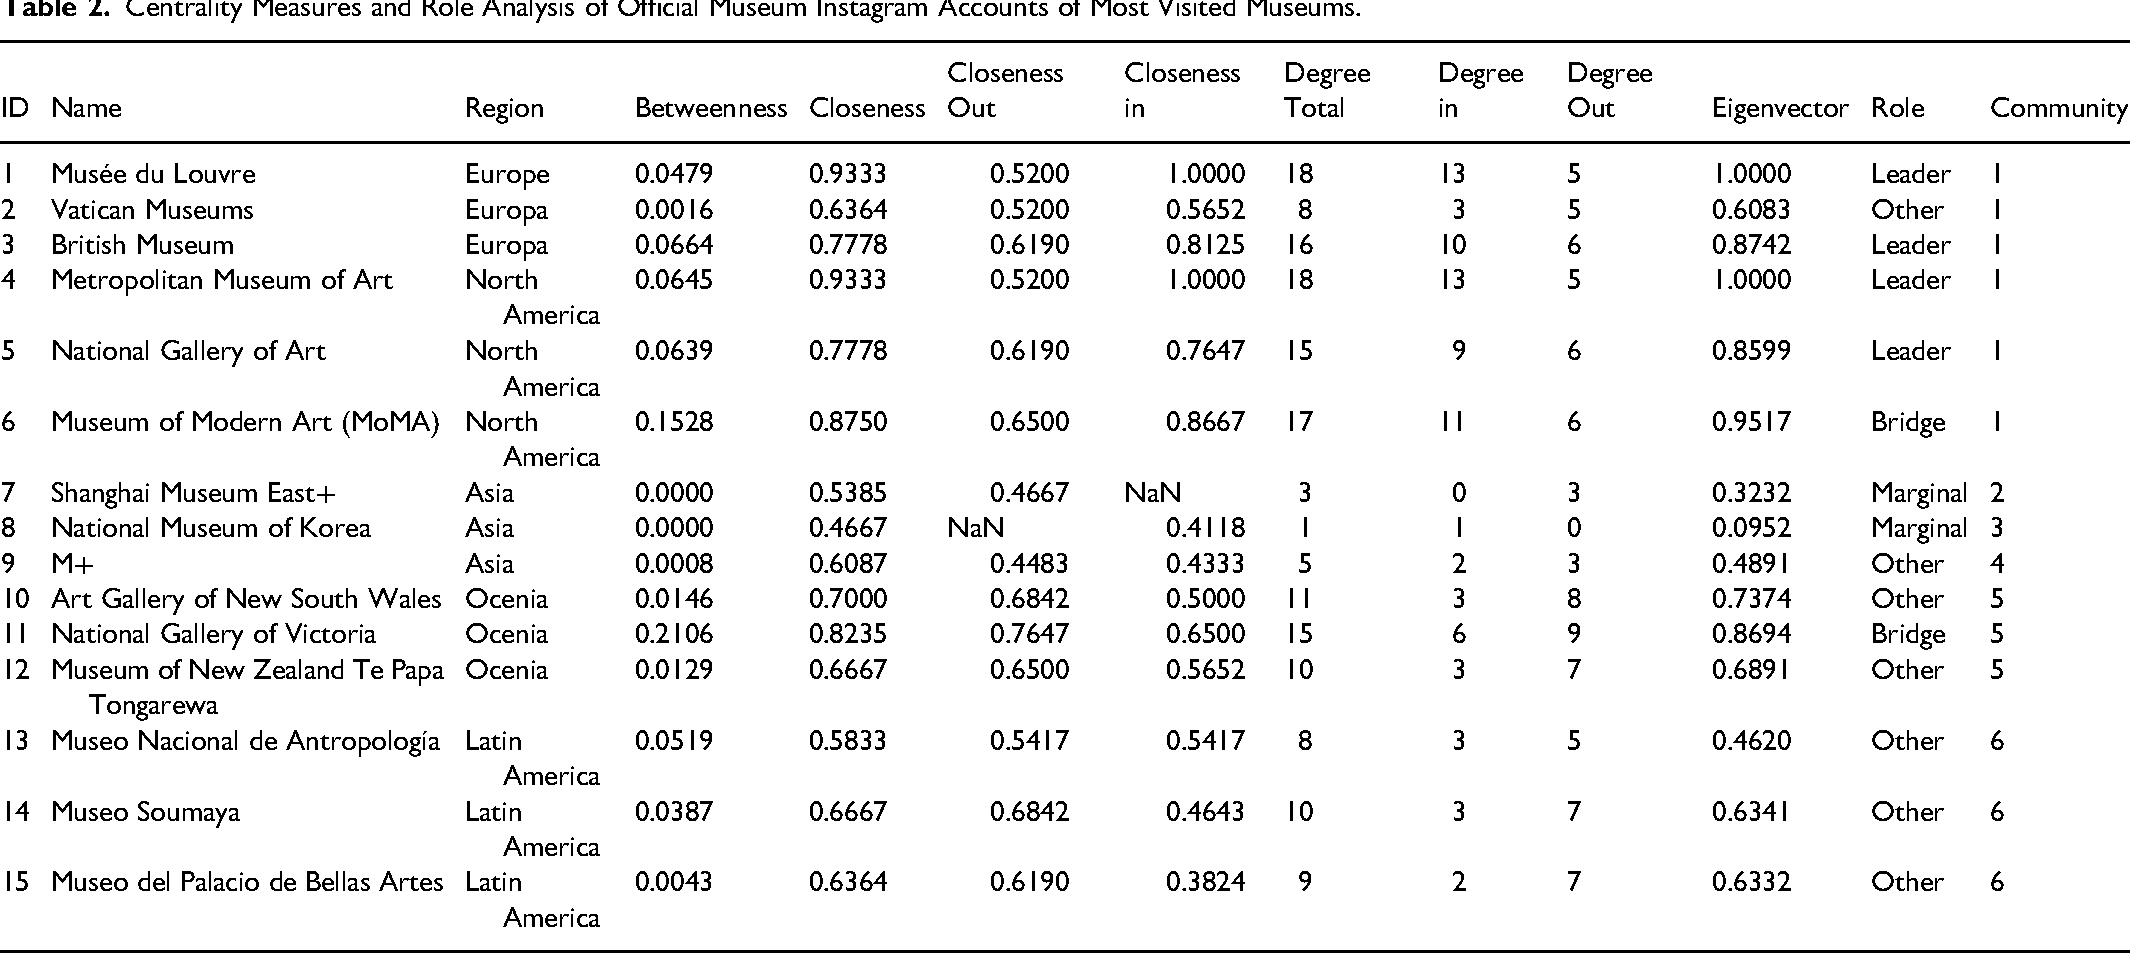
When the data in Table 2 are examined considering the betweenness centrality results in the network, it is seen that the National Gallery of Victoria (11) (0.2106) has a central role in facilitating the flow of information or interaction among sub-communities. Another museum that stands out in terms of betweenness centrality value is the Museum of Modern Art—MoMA (6) (0.1528). MoMA establishes itself as an important transit point due to its location. The British Museum (3) (0.0664), the Metropolitan Museum of Art (4) (0.0645), and the National Gallery of Art (5) (0.0639) are museums that serve as bridges at a moderate level. The Museo Nacional de Antropología (13) (0.0519) and the Musée du Louvre (1) (0.0479) have a noteworthy role as supporting institutions. The Museo Soumaya (14) (0.0387), the Art Gallery of New South Wales (10) (0.0146), and the Museum of New Zealand Te Papa Tongarewa (12) (0.0129) assume a moderate bridge role due to their peripheral locations. Museo del Palacio de Bellas Artes (15) (0.0043), Vatican Museums (2) (0.0016) and M + (9) (0.0008) play a very limited mediating role. Shanghai Museum (7) (0.0000) and National Museum of Korea (8) (0.0000) do not play a mediating role. When a general assessment of the painting is made, it can be said that National Gallery of Victoria (11) and MoMA (6) are particularly positioned at a critical point in the international museum communication network (Figure 1).
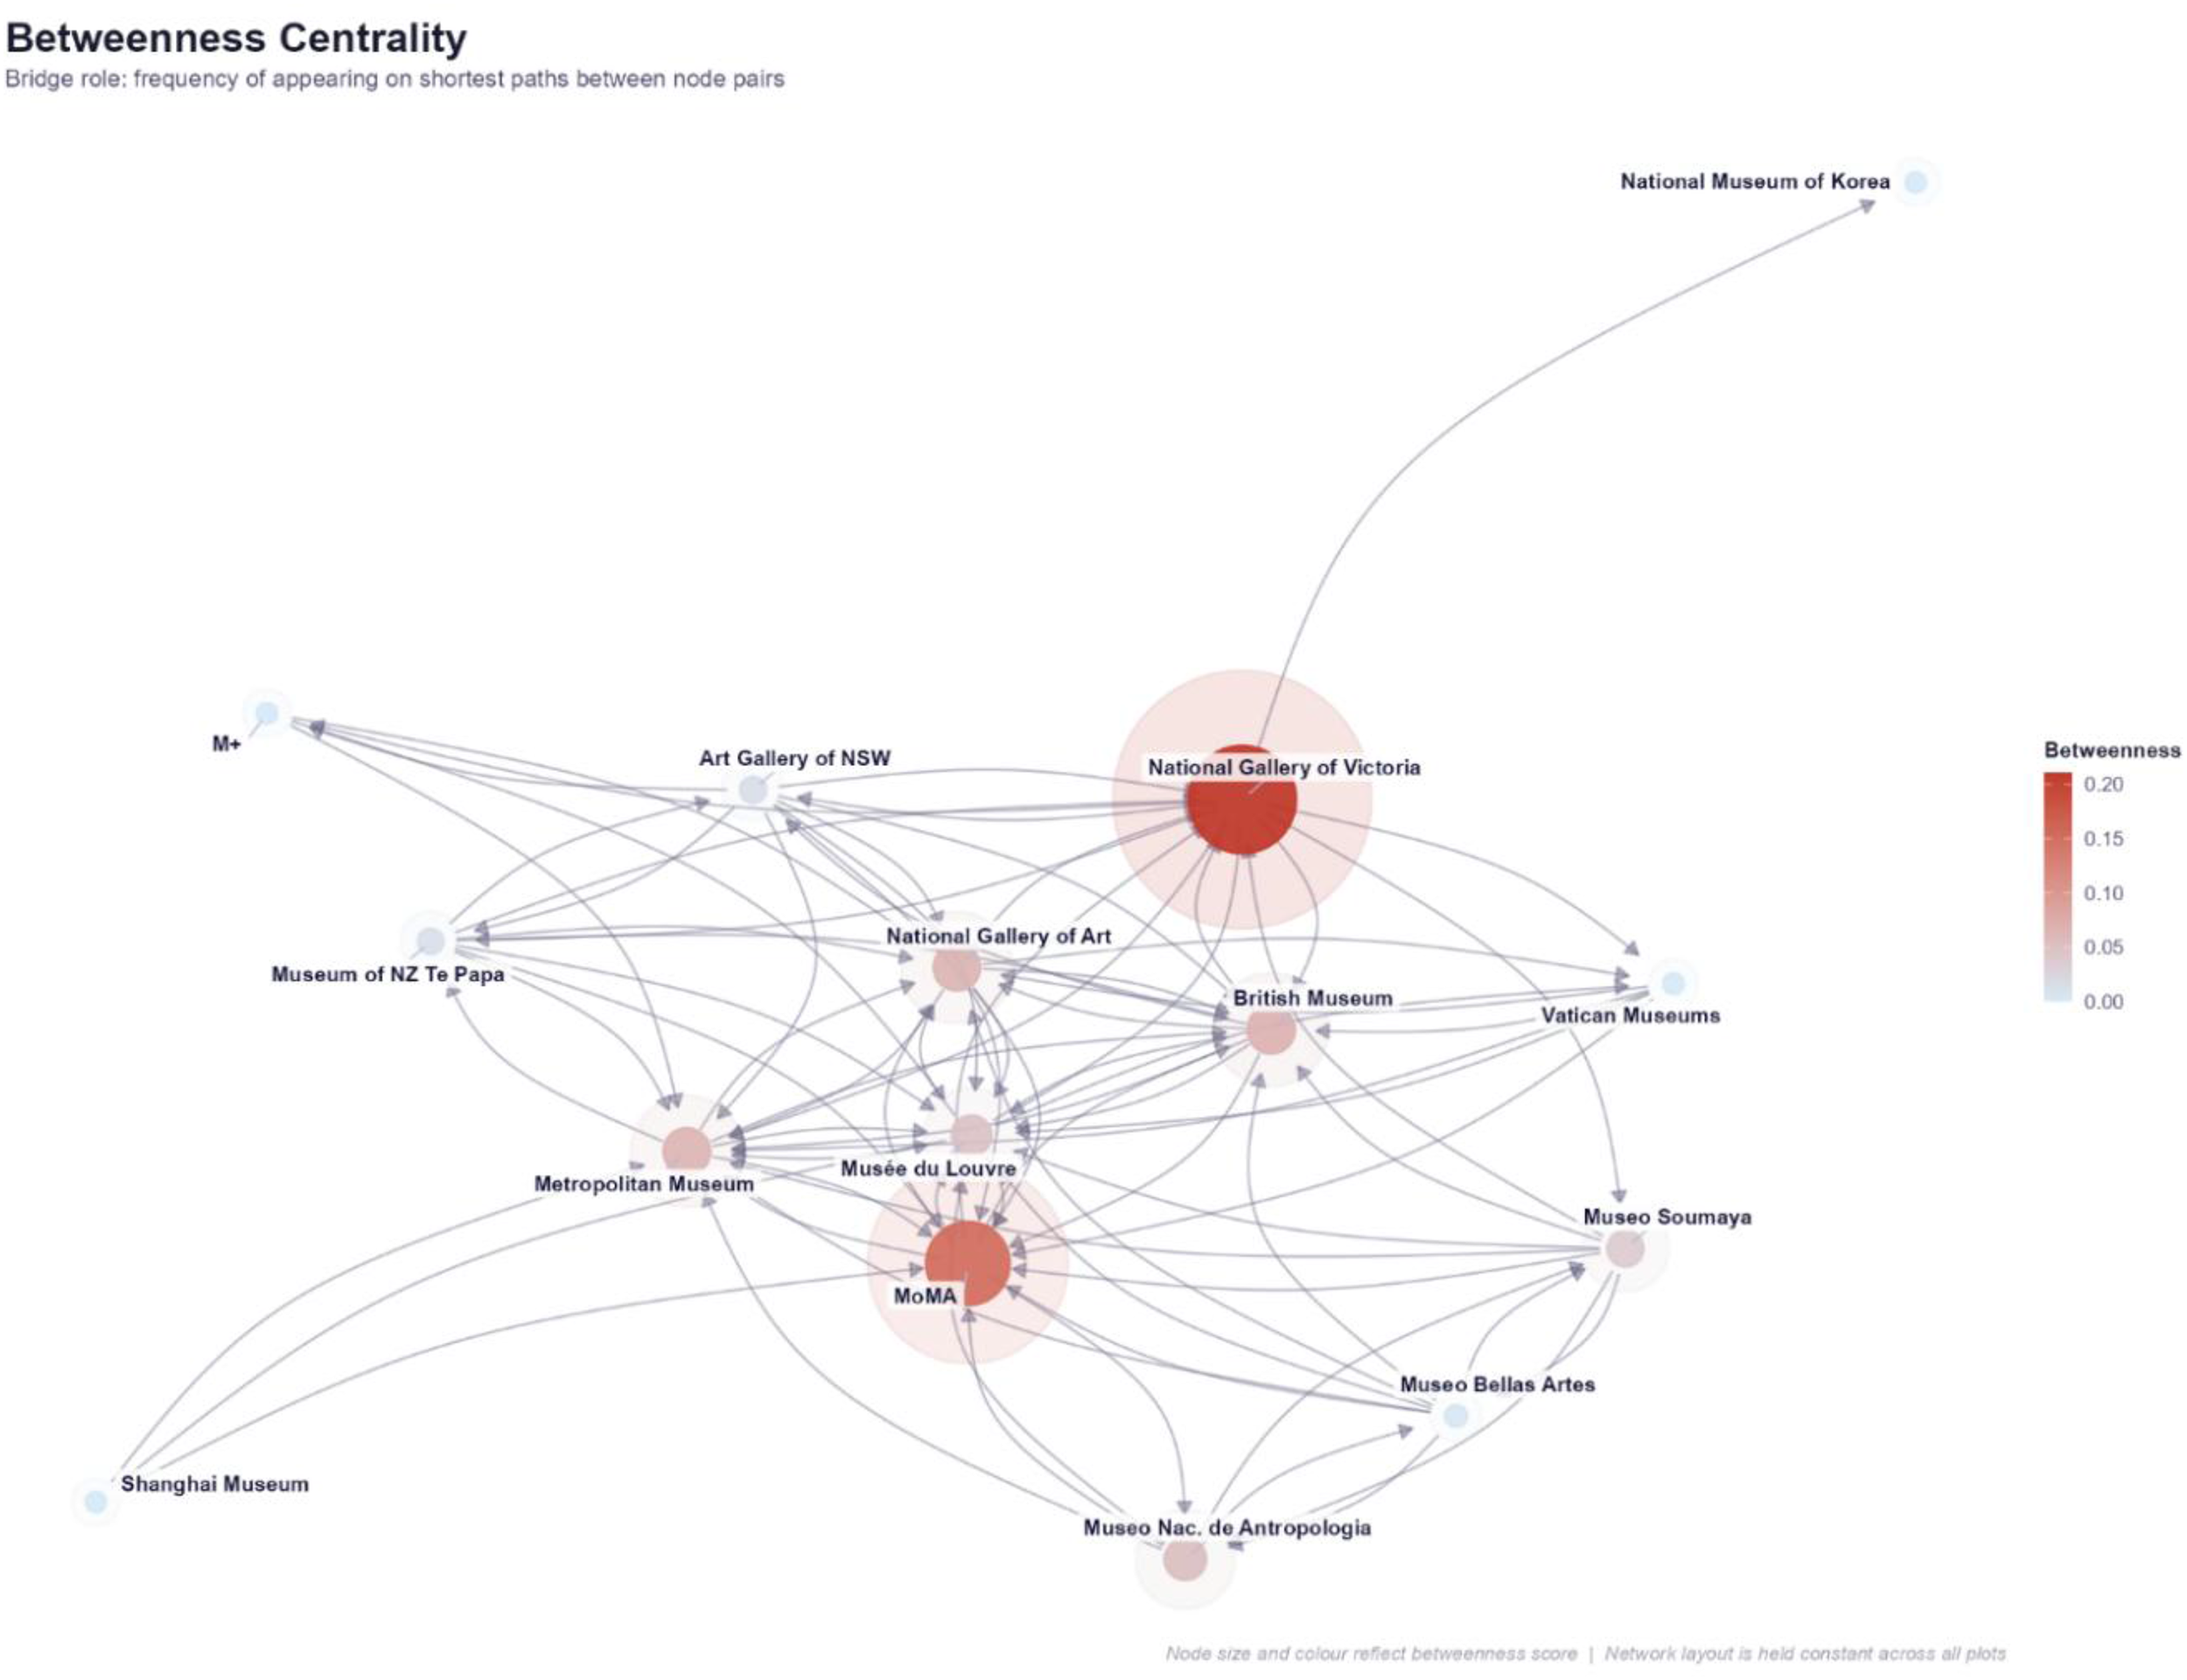
Betweenness centrality.
When the data is examined in terms of closeness centrality, values such as closeness out and closeness in also appear. Closeness out is related to the speed at which a node reaches other nodes, while closeness in is related to the ease with which other nodes reach a node. Having a high value means being in a central and accessible position in the network. Accordingly, it can be said that the National Gallery of Victoria (11) (0.7647 / 0.6500) is the fastest museum in terms of accessibility and plays a central role in terms of information dissemination and interaction. However, while Art Gallery of New South Wales (10) (0.6842 / 0.5000) and Museo Soumaya (14) (0.6842 / 0.4643) exhibit an active presence, particularly in regional interactions, they present a limited picture on a global level. Museum of Modern Art—MoMA (6) (0.6500 / 0.8667) demonstrates its accessible status as a center of attraction with its high closeness-in value. Museum of New Zealand Te Papa Tongarewa (12) (0.6500 / 0.5652) appears to have a prominent role in both accessibility and accessibility. The National Gallery of Art (5) (0.6190 / 0.7647) and the British Museum (3) (0.6190 / 0.8125) are observed to be positioned as reference points in the international network with their high closeness-in values. The Musée du Louvre (1) (0.5200 / 1.0000) and the Metropolitan Museum of Art (4) (0.5200 / 1.0000) have a highly accessible, central and globally focal position with their high closeness-in value. Similarly, the Museo Nacional de Antropología (13) (0.5417 / 0.5417) is also a strong receiving center. Vatican Museums (2) (0.5200 / 0.5652) has a relatively limited access speed and is a limited receiver in the network with its moderate accessibility. Museo del Palacio de Bellas Artes (15) (0.6190 / 0.3824) exhibits a limited interaction picture at the regional level with its values. Shanghai Museum (7) (0.4667 / NaN) exhibits a limited accessibility and disconnection, or in other words, an isolated appearance, while M + (9) (0.4483 / 0.4333) exhibits a marginal position. National Museum of Korea (8) (NaN / 0.4118) is located outside the network with limited interaction (Figure 2).
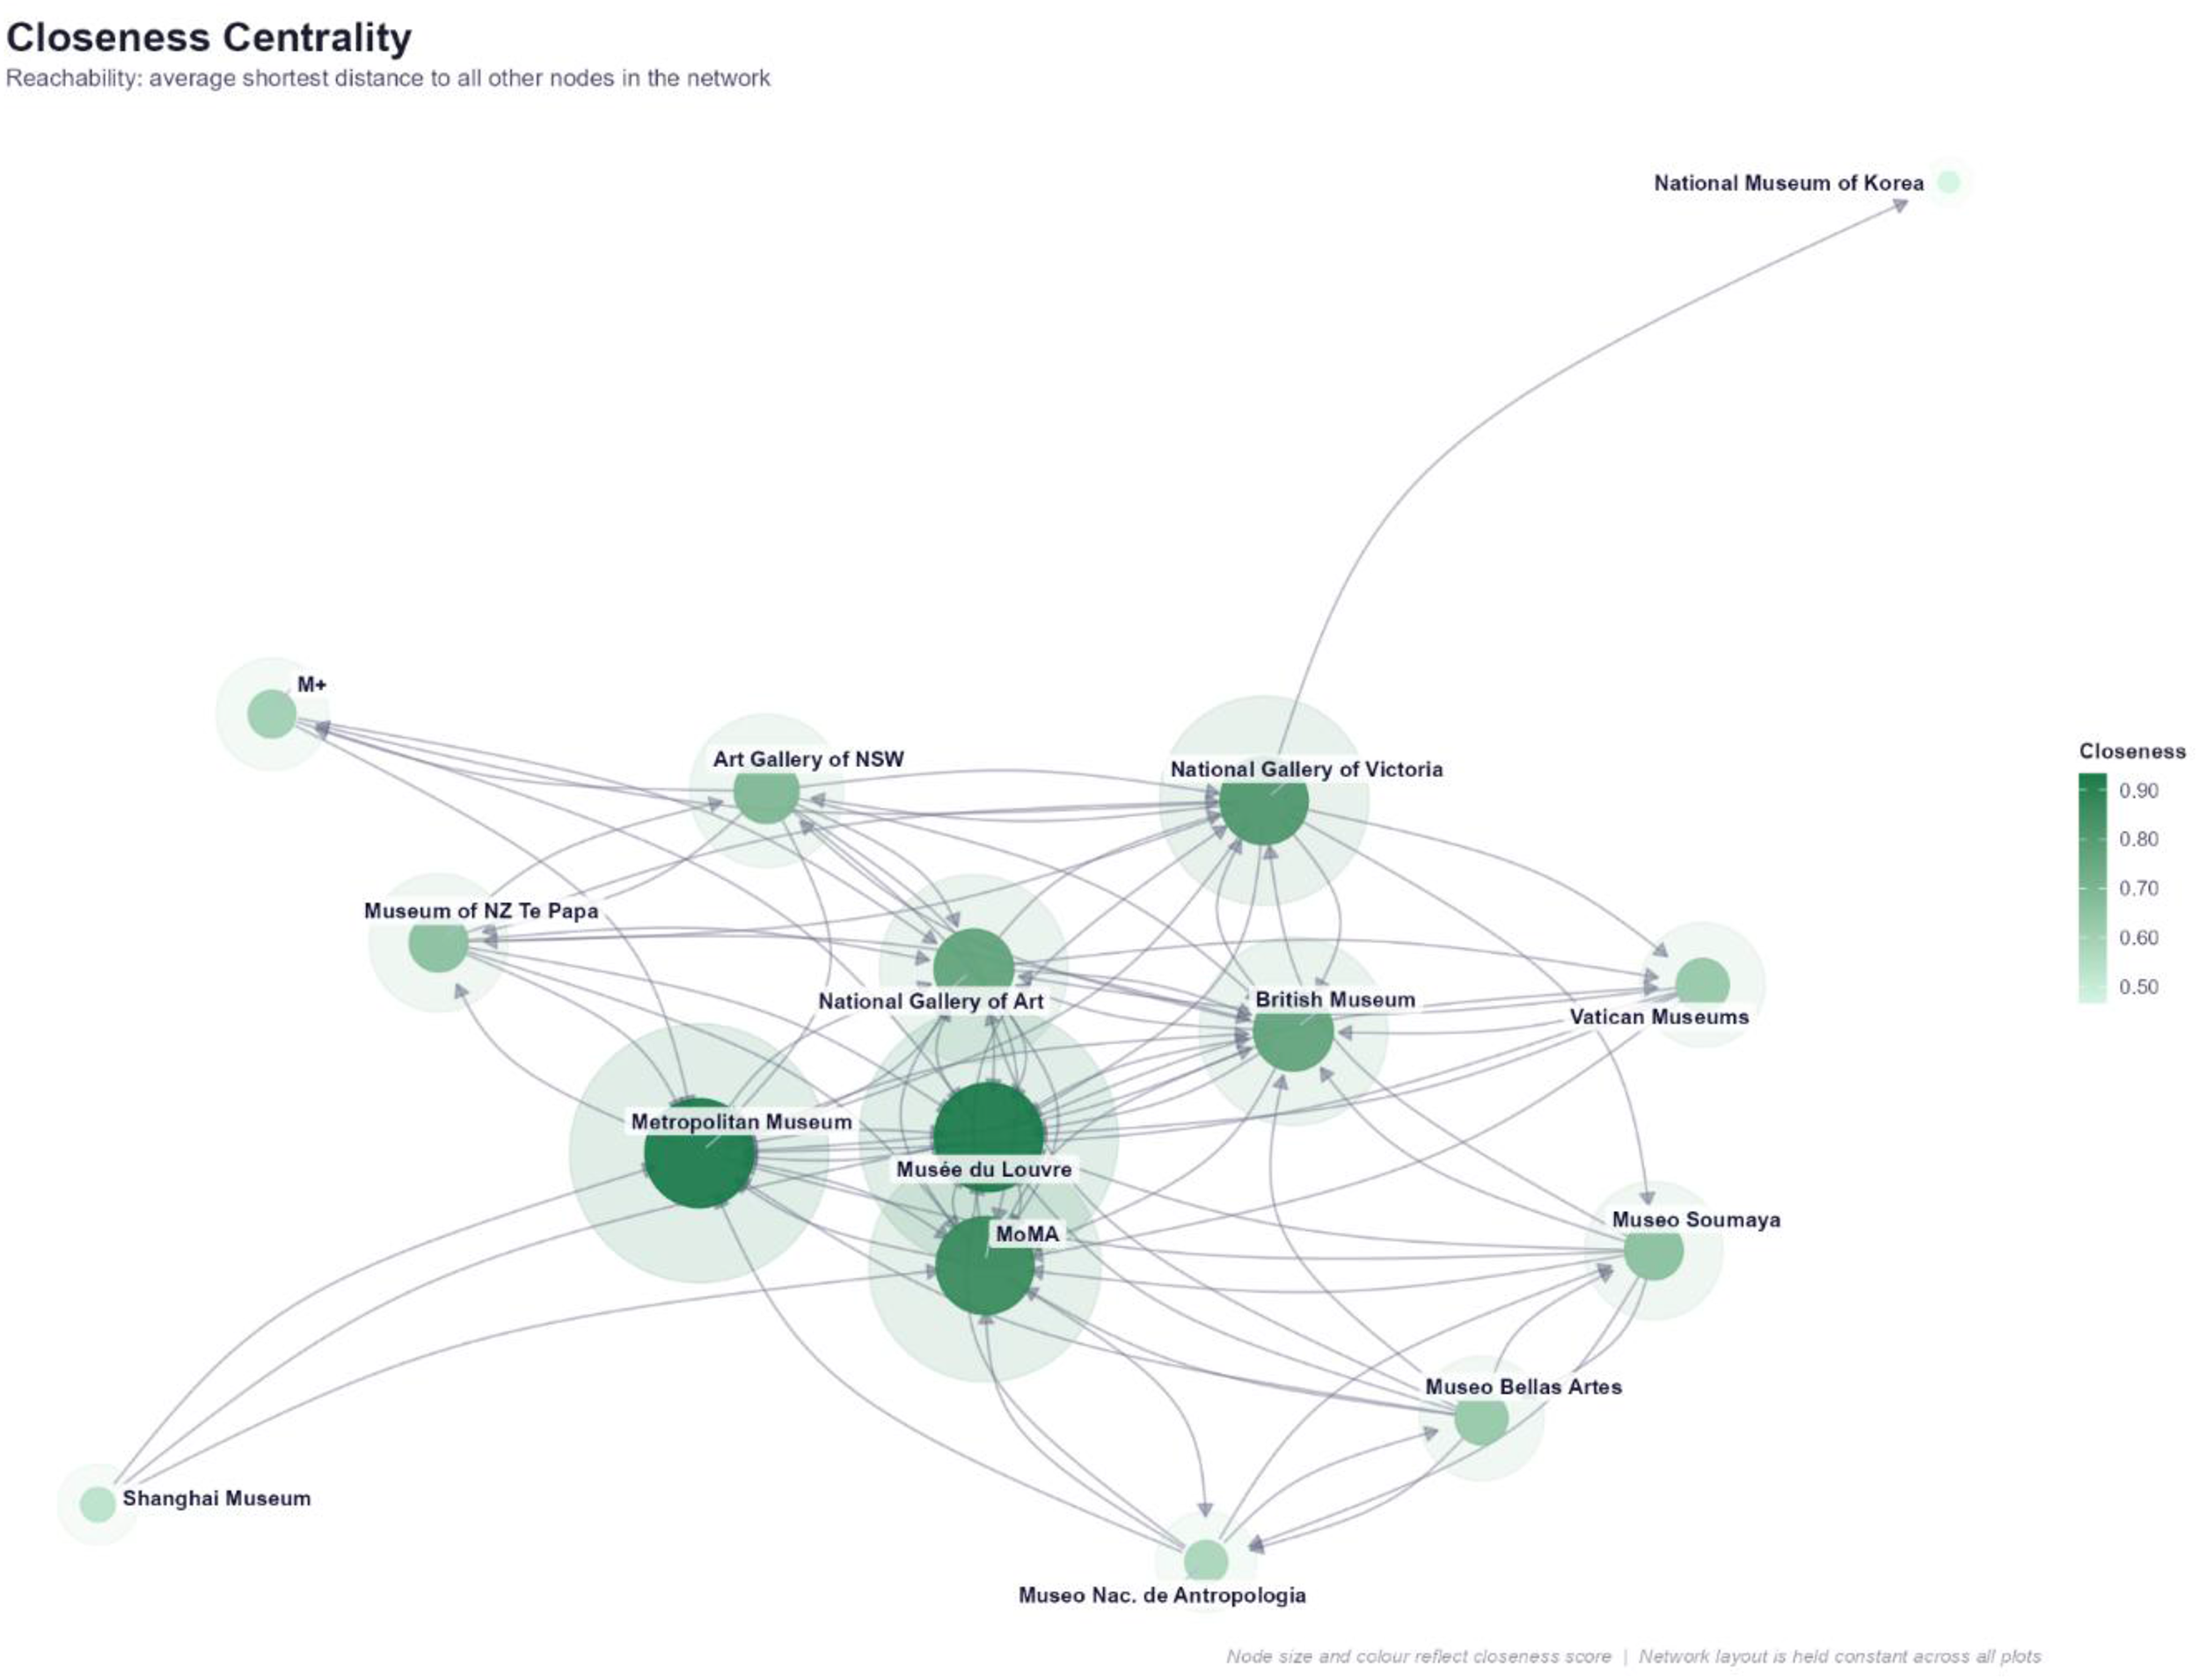
Closeness centrality.
When the data is examined in terms of degree centrality (total degree), it is seen that the museums with the highest value are Musée du Louvre (1) (Total Degree = 18) and Metropolitan Museum of Art (4) (Total Degree = 18). This shows that the two museums are central actors in terms of interaction in the global museum network. Considering that both museums receive and send a high number of links (degree out - degree in = 5–13), it can be said that they play an important role. The two aforementioned museums are followed by the Museum of Modern Art—MoMA (6) (Total Degree = 17), the British Museum (3) (Total Degree = 16) and the National Gallery of Art (5) (Total Degree = 15). These museums are positioned as secondary degree centres with the number of connections they have (degree out - degree in = 6–11; 6–10; 6–9). It is observed that the National Gallery of Victoria (11) (Total Degree = 15) exhibits an asymmetric interaction structure with a high number of connections (degree out - degree in = 9–6); the Art Gallery of New South Wales (10) (Total Degree = 11) and the Museum of New Zealand Te Papa Tongarewa (12) (Total Degree = 10) offer a semi-environmental structure with a medium level of connection capacity (degree out - degree in = 8–3; 7–3). Vatican Museums (2) (Total Degree = 8) and Museo Nacional de Antropología (13) (Total Degree = 8) exhibit limited interaction with a medium-low level connection capacity (degree out - degree in = 5–3; 5–3). Museo Soumaya (14) (Total Degree = 10) and Museo del Palacio de Bellas Artes (15) (Total Degree = 9) are similarly observed to be in the network with medium-level connections (degree out - degree in = 7–3; 7–2). M + (9) (Total Degree = 5), Shanghai Museum (7) (Total Degree = 3) and National Museum of Korea (8) (Total Degree = 1), which have the lowest values, are observed to have a limited connection with the global museum interaction network with an environmental quality (Figure 3).
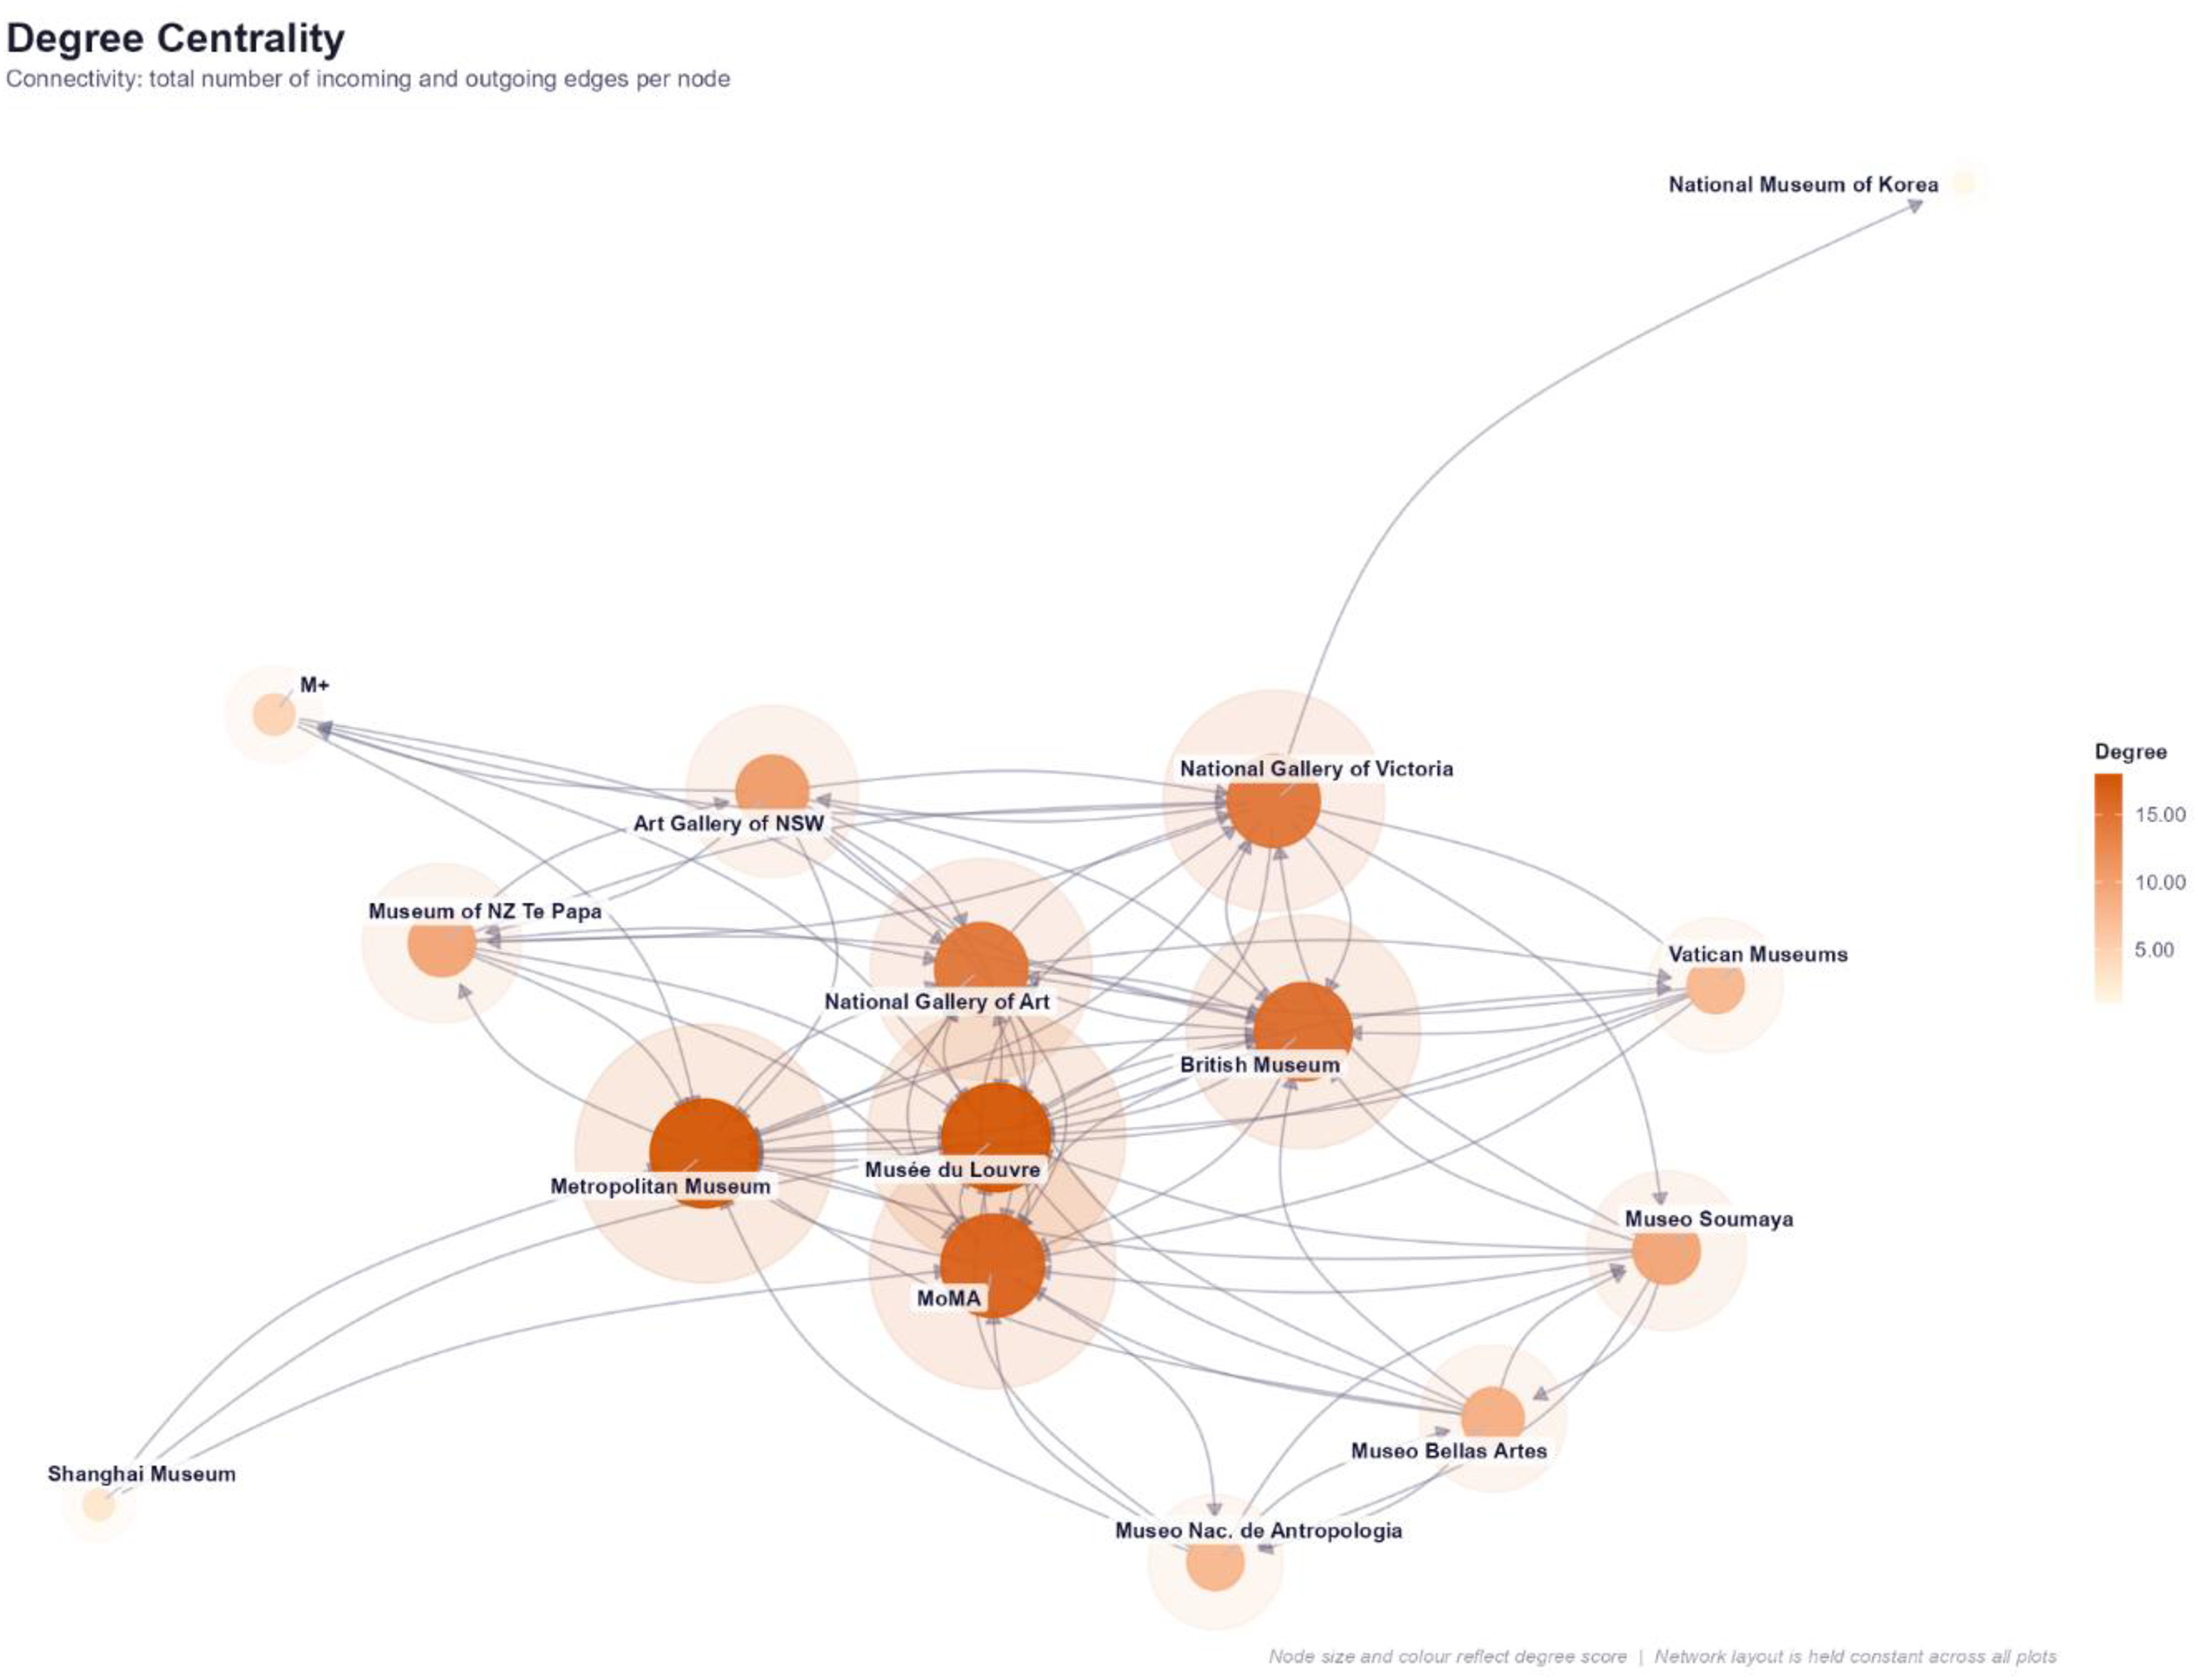
Total degree centrality.
When the data is examined in terms of Eigenvector centrality, it is seen that Musée du Louvre (1) (1.0000) and Metropolitan Museum of Art (4) (1.0000) are the two most effective centers of the network. This value shows that the museums in question not only have a high number of connections but also connect with other high-ranking museums. In this respect, it can be said that the core of the global museum network is formed by the two museums mentioned. The two museums in question are followed by the Museum of Modern Art—MoMA (6) (0.9517), British Museum (3) (0.8742), National Gallery of Victoria (11) (0.8694) and National Gallery of Art (5) (0.8599), all of which are in a high-level central location with their high value. The Art Gallery of New South Wales (10) (0.7374) offers a mid-to-high level interaction, while the Museum of New Zealand Te Papa Tongarewa (12) (0.6891), Museo Soumaya (14) (0.6341), Museo del Palacio de Bellas Artes (15) (0.6332) and Vatican Museums (2) (0.6083) can be considered in a partially peripheral location with mid-level connections. M + (9) (0.4891) and Museo Nacional de Antropología (13) (0.4620) form the surrounding area with low-impact connections, while Shanghai Museum (7) (0.3232) stands out as the museum with the lowest value in this location. National Museum of Korea (8) (0.0952) can be said to be the weakest center, with limited connections to effective nodes (Figure 4).
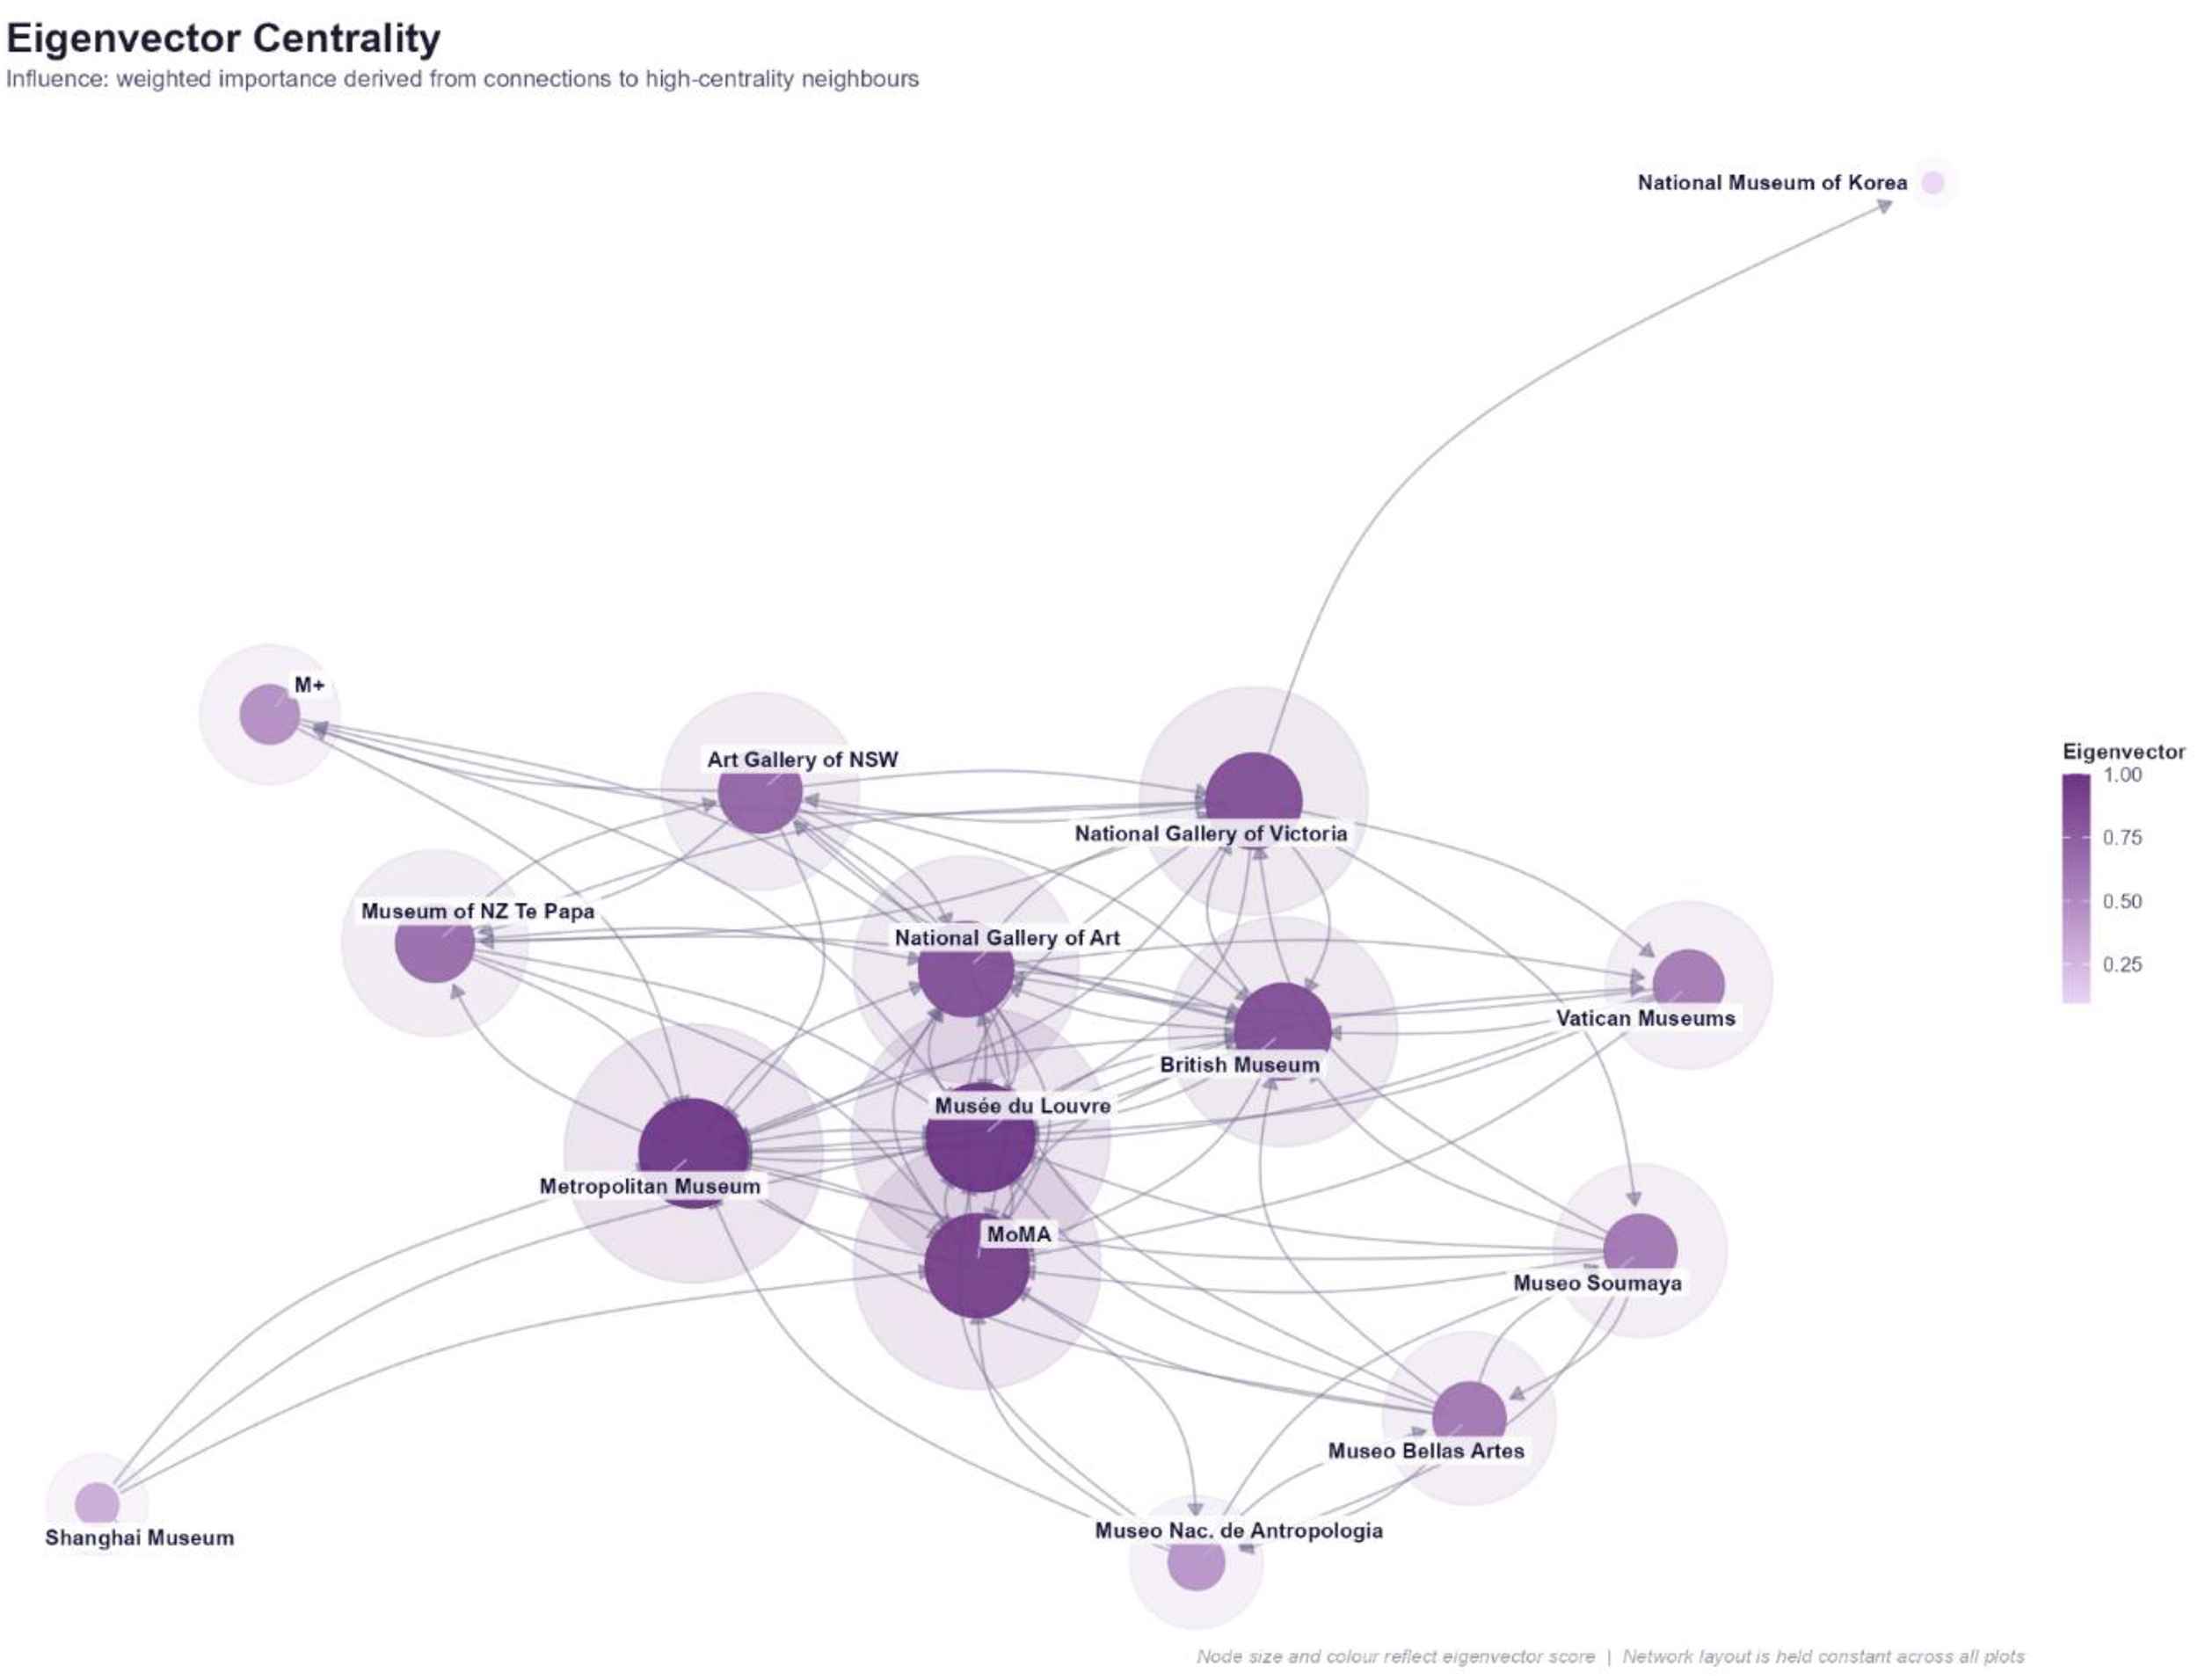
Eigenvector centrality.
When the actors in the network are examined in terms of their roles, it is seen that Musée du Louvre (1), Metropolitan Museum of Art (4), British Museum (3) and National Gallery of Art (5) are the leading actors in the network; Museum of Modern Art—MoMA (6) and National Gallery of Victoria (11) are the bridge actors; Art Gallery of New South Wales (10), Museum of New Zealand Te Papa Tongarewa (12), Museo Soumaya (14), Museo del Palacio de Bellas Artes (15), Vatican Museums (2), M + (9) and Museo Nacional de Antropología (13) are the other actors; Shanghai Museum (7) and National Museum of Korea (8) are positioned marginally. According to the analysis findings, the museums occupying the central position of the network with high degree and eigenvector values are the Musée du Louvre (1), Metropolitan Museum of Art (4), British Museum (3) and National Gallery of Art (5). While these museums have strong interconnections and influence capacity in the global museum network, it can be interpreted that they have direct relationships with influential museums, not just numerous connections. It can be considered that these museums are one step ahead in setting digital communication standards and directing cultural visibility. The Museum of Modern Art—MoMA (6) and the National Gallery of Victoria (11) are classified as having a bridge role, and both museums are seen to have a strong mediating capacity in the network with high betweenness values. MoMA (6) and the National Gallery of Victoria (11), as the two museums with the highest betweenness values in the network, are in a critical position to direct the flow of information and interaction among sub-communities. Museums in the Other category, such as the Vatican Museums (2), M + (9), Art Gallery of New South Wales (10), Museum of New Zealand Te Papa Tongarewa (12), Museo Soumaya (14), Museo del Palacio de Bellas Artes (15) and Museo Nacional de Antropología (13), can be considered to have a certain visibility and interaction within the network with their medium level closeness values. It can be said that these museums do not have an influence on the direction of information flow, and that they create an impact regionally and thematically rather than on a global scale. It can be observed that the Shanghai Museum (7) and the National Museum of Korea (8), which have a marginal role, offer a limited number of connections with low degree and betweenness values and show a weak appearance in the stage of integration into the global network.
Considering the community analysis conducted within the scope of the study, it is observed that the global museum network is divided into six groups. The Q value of 0.3346 obtained within the scope of the analysis refers to a certain level of modularity, in other words, to a certain degree of differentiation and identifiable subgroups among the actors. The modularity value (Q) is known as a measure of how distinct the community structure is in a network. A Q value above 0.3 to 0.4 is generally considered an indicator that the subgroups are genuine communities (Fortunato & Barthélemy, 2007: 37). The Q value of 0.3346 obtained in this study proves that there is no completely random structure in the network, and that a certain degree of community divergence exists. However, it is not entirely accurate to say that strong clustering has occurred. Although clustering is observed at the geographical and regional levels in the global museum network, cross-connections with museums from different regions soften community boundaries. As a relatively moderately clustered network, the global museum network can be said to offer a mixed communication structure that combines both geographical and regional affinities with global cross-connections. The first and largest of the identified groups is formed by the coming together of highly interactive museums of European and North American origin such as the Musée du Louvre (1), Vatican Museums (2), British Museum (3), Metropolitan Museum of Art (4), National Gallery of Art (5) and Museum of Modern Art—MoMA (6). The second group consists of a single member, the Shanghai Museum (7). Similarly, the third group consists solely of the National Museum of Korea (8). The second and third groups can be understood through the independence and unique digital identities of the respective museums. The fourth group appears to be formed by M + (9) alone. It can be said that M + (9) has an independent and unique position, differentiating itself from other Asian museums in the network. The fifth group consists of Oceania museums, comprising the Art Gallery of New South Wales (10), the National Gallery of Victoria (11), and the Museum of New Zealand Te Papa Tongarewa (12). The sixth group consists of Latin American museums, comprising the Museo Nacional de Antropología (13), Museo Soumaya (14), and Museo del Palacio de Bellas Artes (15). In this respect, it can be considered that the last two groups have strong connections within themselves due to geographical and cultural proximity, as a regional interaction cluster. In general, it can be said that while the global museum network offers a certain integration, it exhibits a regional clustering tendency in the Oceania and Latin America regions, and Asian museums, with their independent positions, present an isolated appearance in the network (Figure 5).
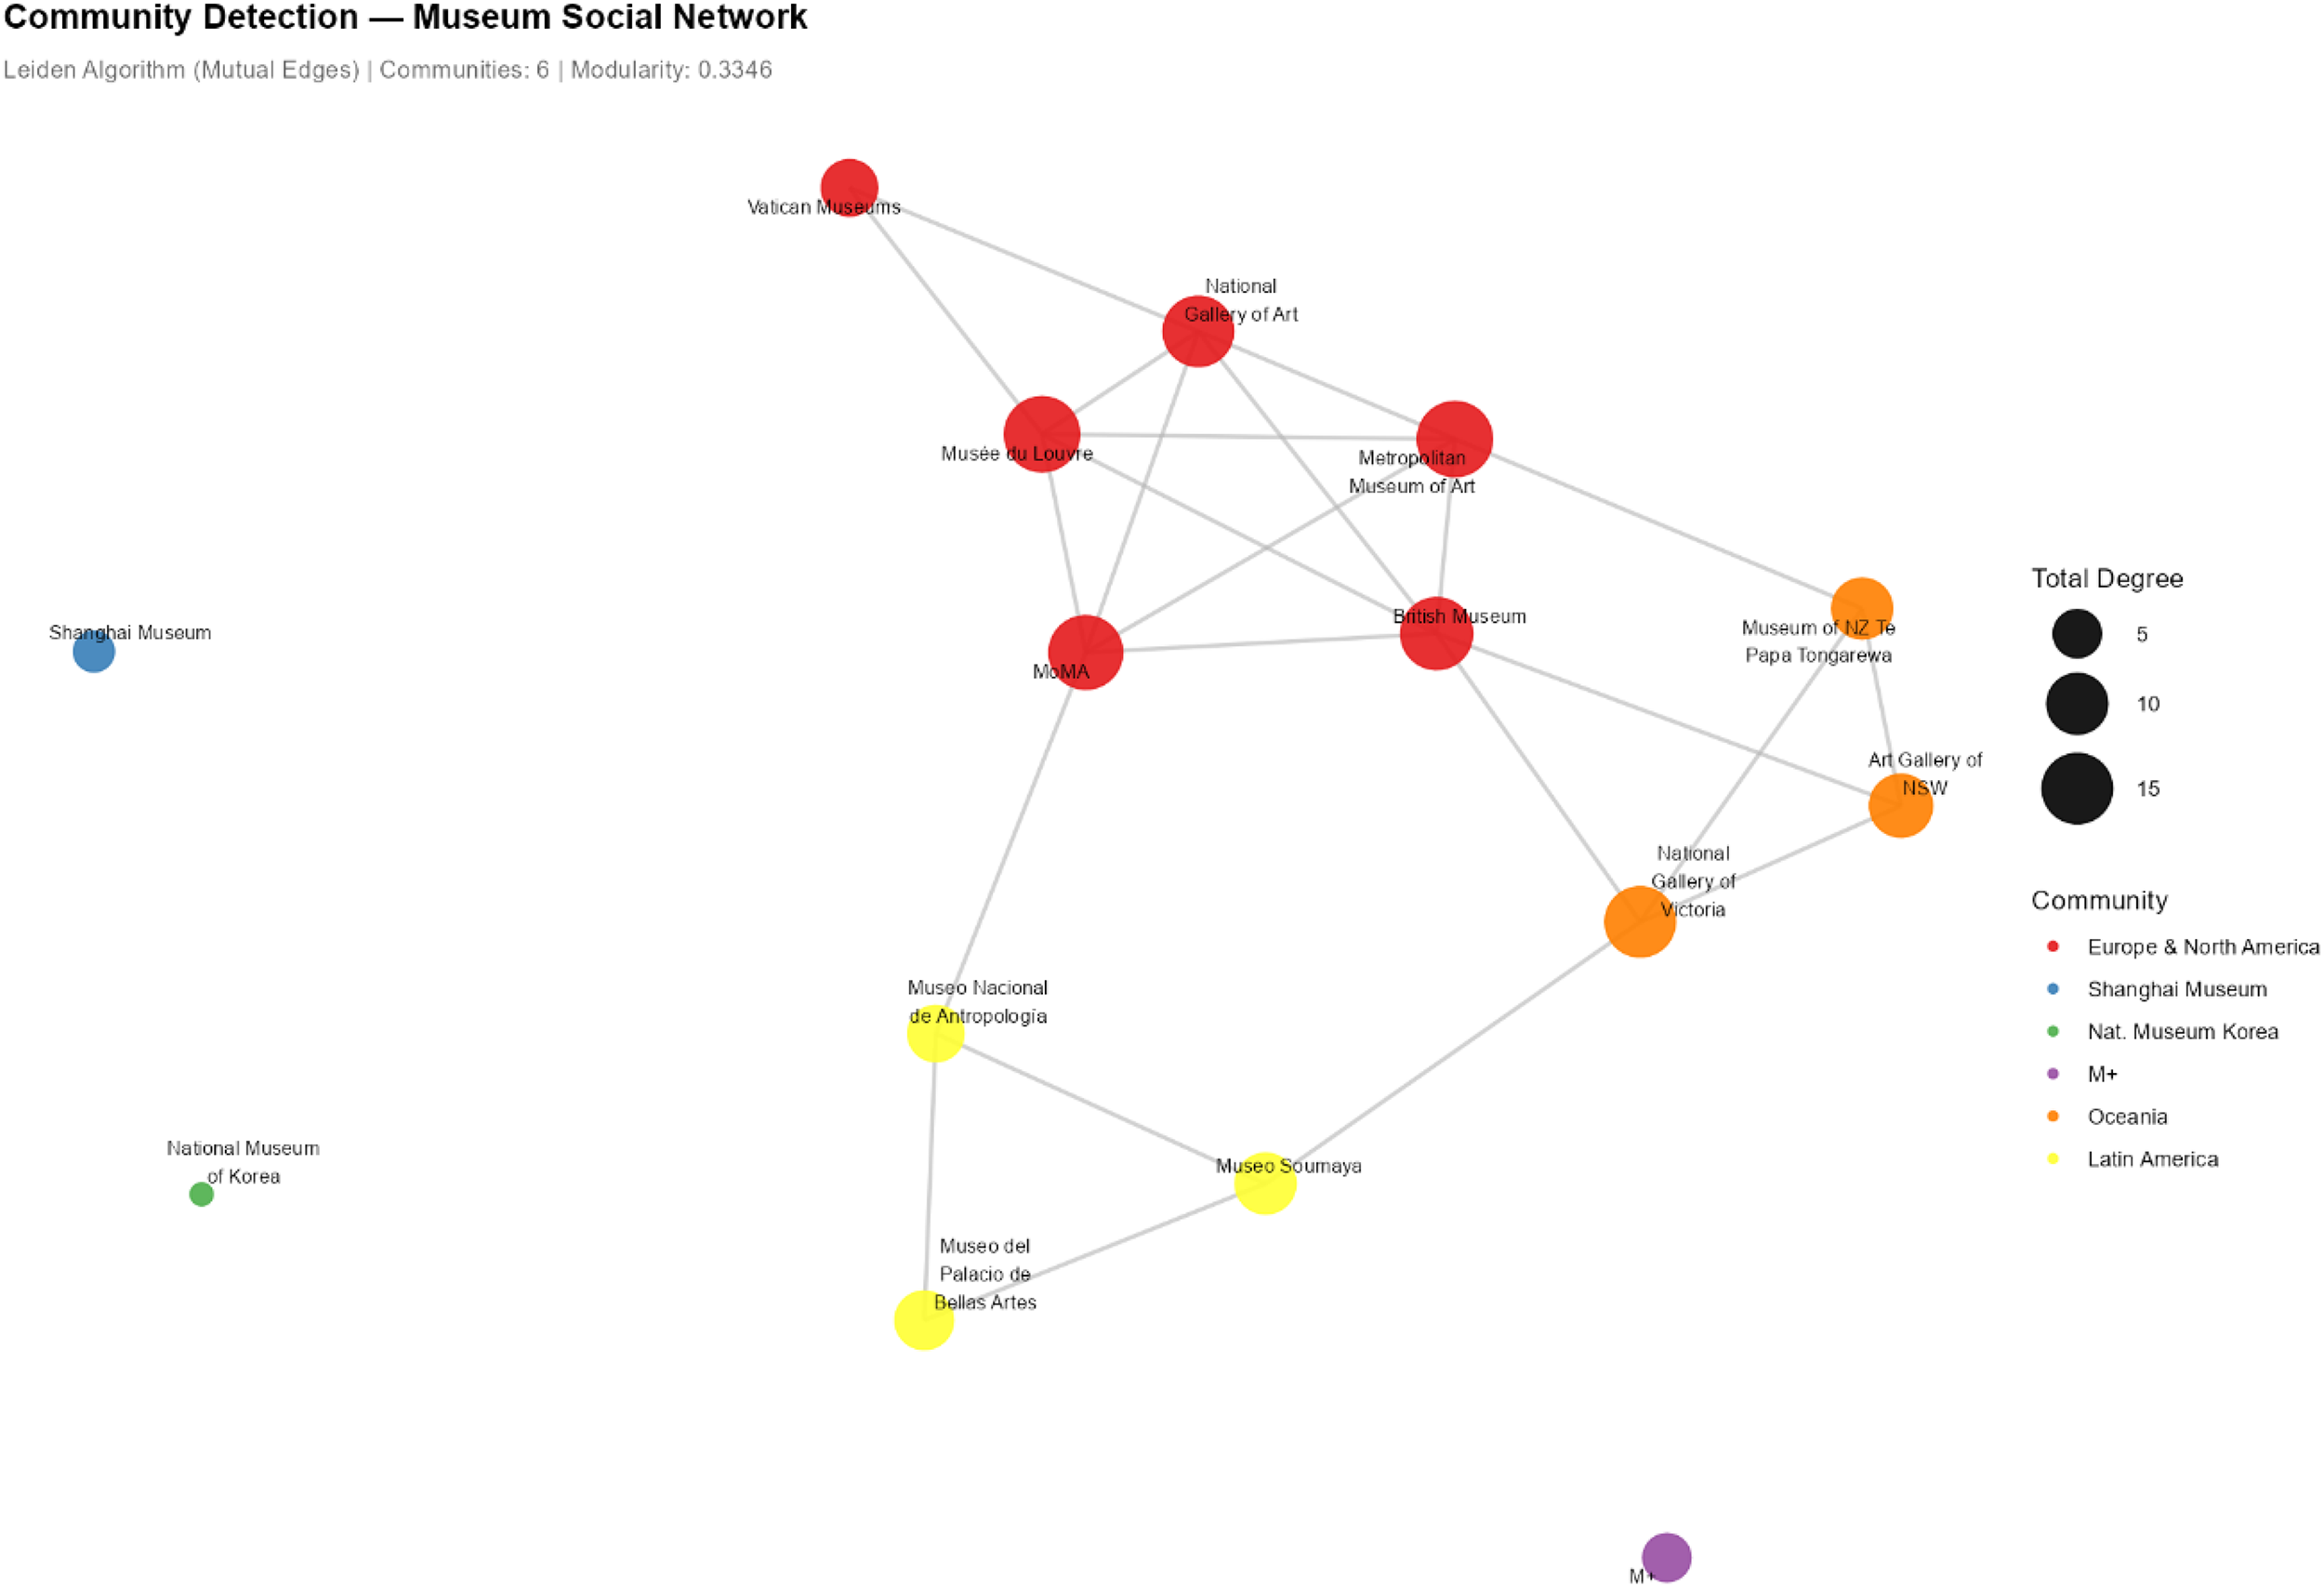
Community analysis.
Following the presentation of metrics such as degree, betweenness, closeness, and eigenvector, Principal Component Analysis (PCA) was conducted to examine which metrics were related to each other in the global museum network and how museums were clustered based on these metrics. In the PCA analysis, four centrality metrics—Degree, Betweenness, Closeness, and Eigenvector—were used as variables, and the fifteen museums included in the research sample were used as observation units. Using this structure as input, components were generated using PCA. In PCA analysis, dimension can be defined as an artificial axis that explains the common variance shared by multiple variables. It can be considered to represent the common underlying structure that the variables themselves cannot measure. Considering that all metrics, which appear to measure different things, are ultimately concerned with a museum's position within the network—in other words, each metric addresses this issue from different perspectives, the attempt to aggregate them within the same component can be said to mean expressing multiple metrics on a single axis. For example, while a person's height, weight, and body measurements are different, they all actually reflect a common “physical structure.” In PCA analysis, reducing such measures to a single dimension can reveal the “physical structure” dimension. In our research, a similar approach was taken, grouping metrics that answer the same question. PCA score calculation involved standardizing and comparing four centrality values, then creating a weighted linear combination using component loadings. The positions of each museum within the components were also obtained from this calculation.
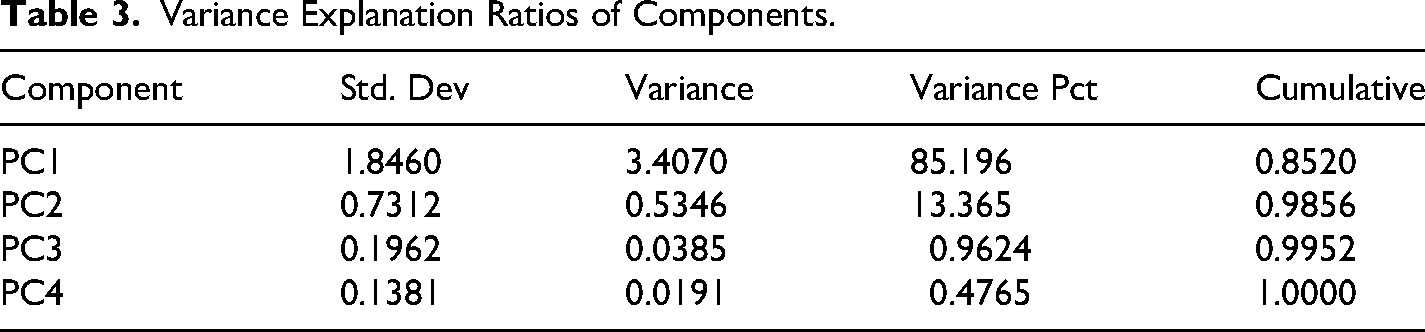
Table 3 shows that, according to the PCA results, the first component, PC1, explains 85.2% of the variance, making it the largest component in the dataset. This can be interpreted as indicating a tendency for centrality measures to cluster largely under a single structural dimension. When the second component, PC2, is examined, it explains 13.4% of the variance. When the two components are considered together, it is observed that 98.6% of the variance is explained by these two components. The other two components (PC3 and PC4), with 0.96% and 0.48% respectively, are considered to have made a limited contribution.
Variance Explanation Ratios of Components.
After identifying the significant components based on their variance ratios, the contextual meanings of the components were also examined. Within this framework, the correlation value of each variable with the relevant components was also examined. Table 4 shows the correlation level of all centrality measures with the components.
Correlation Between Centrality Measures and Principal Components.
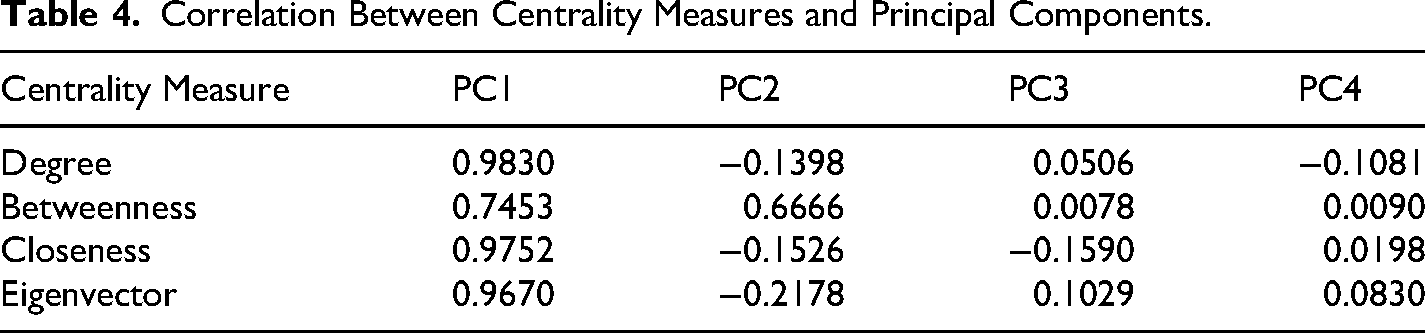
Table 4 shows that PC1 receives its highest load from the variables degree (0.9830), closeness (0.9752), and eigenvector (0.9670), and that the betweenness (0.7453) variable also loads PC1 significantly. Considering that degree describes the number of direct connections, betweenness the mediating role, eigenvector the connections with strong nodes, and closeness the accessibility in the network, it can be said that PC1 can be interpreted in terms of “overall influence and connection strength/overall centrality”. PC1 can be considered to show the potential of actors to be the leading node. The second component, PC2, receives its highest load from the betweenness (0.6666) variable. Given that other variables (degree, closeness, eigenvector) exhibit low and negative loads, it can be said that PC2 represents a mediation dimension that arises independently of high link count or eigenvector strength. Considering that the betweenness metric expresses the position of a node on the shortest paths between other nodes, it can be said that PC2 reflects a mediation capacity stemming from structural location rather than link strength. In this context, it is possible to evaluate PC2 through the lens of “spatial mediation” or “link-independent spatial mediation”. When PC3 is examined, it is seen that all variables exhibit very low loads. The most significant load is provided by closeness (−0.159), but this value can be considered limited. With its low variance ratio, it can be assumed that PC3’s contribution to the global museum network is quite limited. When PC4 is examined, it is seen that all variables offer very low loads. The highest load is provided by eigenvector (0.0830), but this value can also be considered quite limited. With its lowest variance ratio, it can be assumed that PC4’s contribution to the global museum network is negligible. When the results are considered collectively, it can be said that the roles of the actors in the global museum network are linked to multidimensional structural dynamics such as interaction, access speed, the quality of connections, and mediation capacity.
Visualization was also employed to enhance the interpretability of the analysis and depict relationships. This effort was made to display variables, actors, and observations on the same plane. The biplot shows which variables define the components. The arrows in the biplot indicate the direction and strength of the correlation between the variables and the components. The angle represents the correlation between the variables. A narrow angle indicates a positive relationship, while a wide angle indicates a negative relationship. Observations and museums can also be viewed in the biplot with the numerical values assigned to them. It becomes clear which structural dimension an observation has the highest power on. The proximity or distance between the locations of variables can also be explained by the ratio of their common variances. Being located close can be thought of as being located in the same dimension.
As shown in Figure 6, the variance distributions of the PC1 (85.2%) and PC2 (13.4%) components are displayed. When the axes are examined in terms of museums, it is seen that on the right side of the graph, in other words, on the positive PC1 axis, the Musée du Louvre (1), Metropolitan Museum of Art (4), British Museum (3), National Gallery of Art (5), Museum of Modern Art—MoMA (6) and National Gallery of Victoria (11) stand out with high values in terms of degree, closeness and eigenvector. It can be said that these museums, as actors interacting with strong centers that have wide connection sets, have a visible role in terms of international visibility and directing the flow of information with their high interaction potential. It can be considered that these museums have a central and influential position with the high scores they received in the first component.
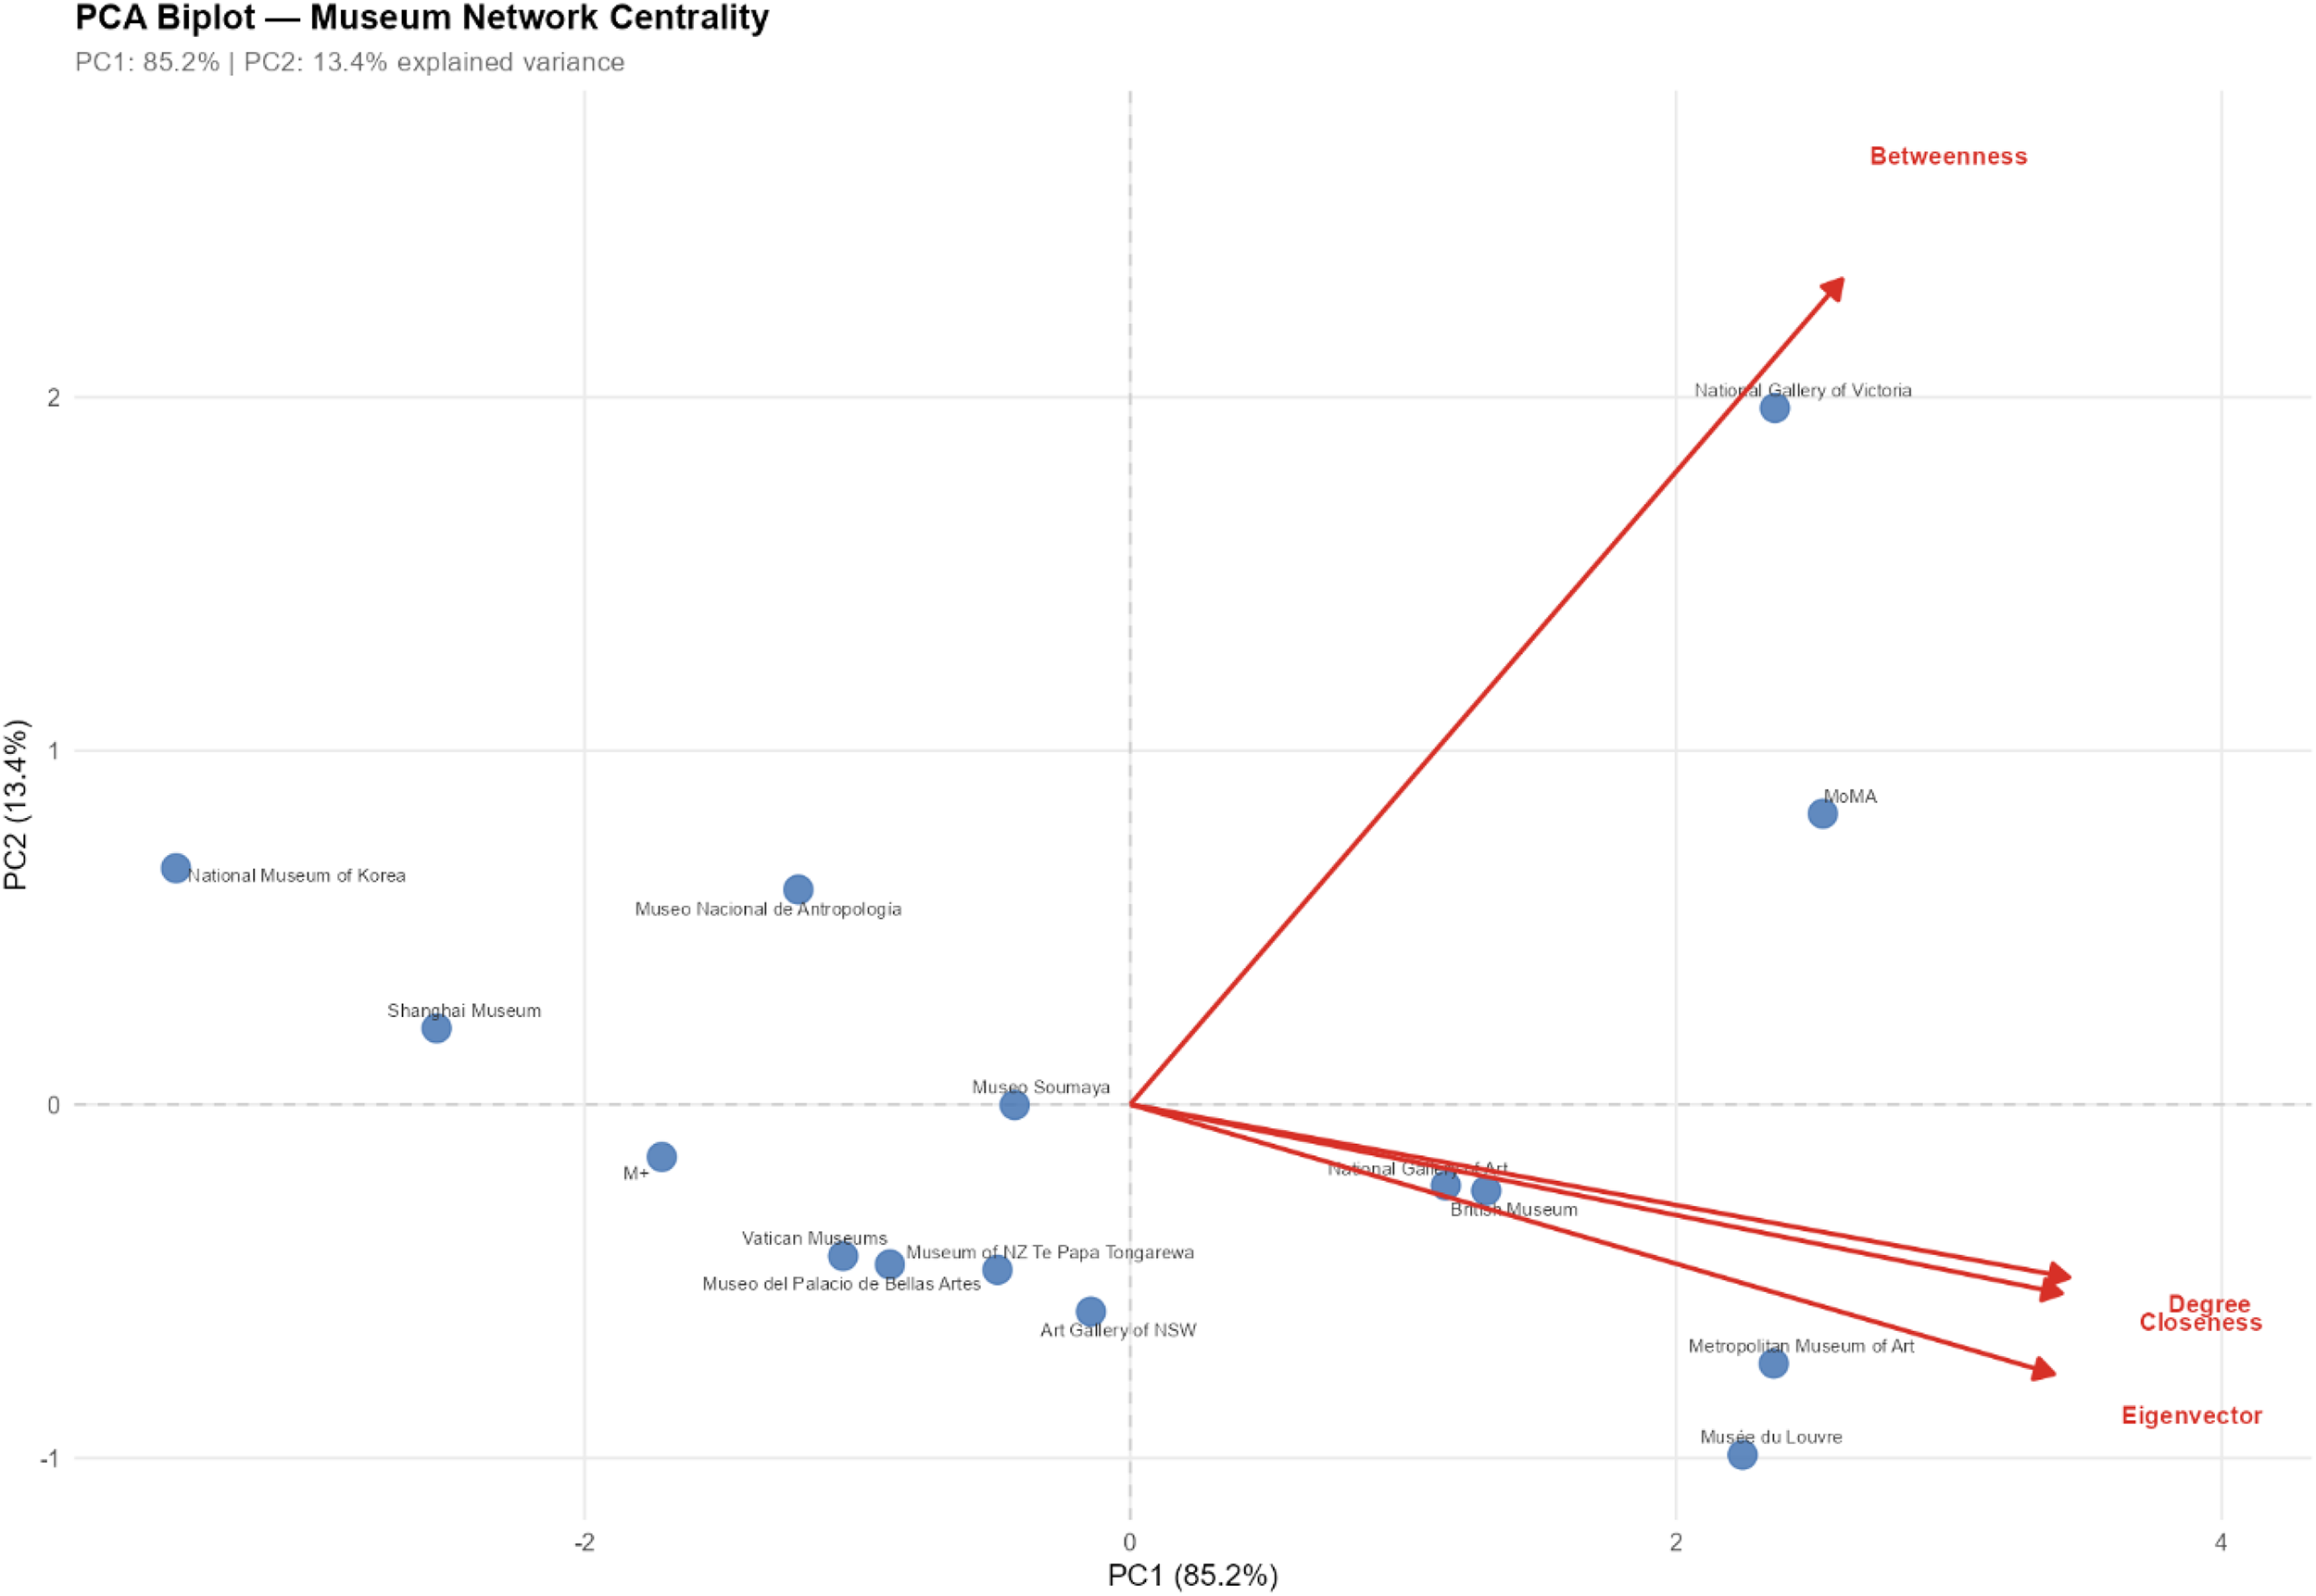
Principal component analysis result (Biplot).
Examining the left side of the graph, it can be seen that the National Museum of Korea (8), Shanghai Museum (7), M + (9), Vatican Museums (2), Museo Nacional de Antropología (13), Museo del Palacio de Bellas Artes (15), Museum of New Zealand Te Papa Tongarewa (12), Art Gallery of New South Wales (10) and Museo Soumaya (14) are located on the negative PC1 axis. Different profiles stand out within this group. The National Museum of Korea (8) and Shanghai Museum (7) are seen to be positioned as the most peripheral actors in the network with low degree and betweenness values. It can be said that M + (9) and Vatican Museums (2) exhibit a limited interaction table with medium-low degree values. Art Gallery of New South Wales (10), Museum of New Zealand Te Papa Tongarewa (12) and Museo Soumaya (14) are observed to be in a relatively more connected position within this group with medium degree values. In general, it can be said that the museums in this group are in a secondary position with lower degree, closeness and eigenvector values compared to the museums on the positive PC1 axis.
When the second component PC2 axis is examined upwards, it is seen that the betweenness arrow is positioned in this direction and the National Gallery of Victoria (11) and the Museum of Modern Art—MoMA (6) stand out with high betweenness values. This situation describes that these museums have the capacity to direct the flow of information and interaction by taking on an intermediary role between other nodes in the network. It can be said that the National Gallery of Victoria (11) being in the top position shows that it functions as a strategic bridge in the network with its high mediation capacity.
When the PC2 axis is examined downwards, it is seen that Musée du Louvre (1) and Metropolitan Museum of Art (4) are positioned in this direction, standing out with their low betweenness values. Although they have high degree, closeness and eigenvector values, it can be said that they exhibit a limited appearance in terms of their mediating roles.
Actors such as Museo Soumaya (14), Museum of New Zealand Te Papa Tongarewa (12) and Art Gallery of New South Wales (10) exhibit medium-level values on both axes due to their proximity to the center. Although the museums, whose mediating roles can be considered limited with their low betweenness values, provide a certain visibility in the network with their medium degree, closeness and eigenvector values, it can be thought that they do not have a decisive position on a global scale.
Conclusion
The importance of museums in cultural communication is undeniable today. Because they house the achievements and evidence of a long historical period, as well as contemporary cultural creations, museums can be said to have a highly valuable social function. Considering that we live in an age of communication and, at the same time, in an era where digitalization has reached its peak, it is crucial that museums, identified as such valuable elements, interact with society.
When it comes to interaction, museums’ communicative activities aimed at the general public come to the fore. While the importance of these activities is undeniable, another crucial aspect is the communication and interaction between museums. As mentioned, considering that we live in an age of digital communication, museums with shared goals and shared raison d’êtres must forge strong bonds.
The research results show that, in terms of “betweenness,” the National Gallery of Victoria and the Museum of Modern Art (MoMA) have the highest values, standing out in facilitating the flow of information or interaction between sub-communities. In terms of “closeness,” the Musée du Louvre and the Metropolitan Museum of Art stand out with the highest values. Furthermore, the National Gallery of Victoria, with its “closeness out” value, can be said to play a role as a center for information dissemination and interaction, being the fastest-reaching museum. Additionally, the Art Gallery of New South Wales and the Museo Soumaya appear to exhibit an active role in regional interactions. In terms of total degree, the Musée du Louvre and the Metropolitan Museum of Art stand out. These two museums are central actors in terms of interaction within the global museum network, playing a significant role due to the high number of connections they both receive and send. When the research results are analyzed through eigenvector centrality, it is clear that the Musée du Louvre and the Metropolitan Museum of Art are the two most influential hubs of the network. These museums not only have high connectivity but also establish connections with other high-ranking actors. These two museums can be considered the core of the global museum network.
An examination of the roles of actors in the global museum network reveals that the Musée du Louvre, Metropolitan Museum of Art, British Museum, and National Gallery of Art are positioned as leaders. The Museum of Modern Art (MoMA) and the National Gallery of Victoria are classified as bridges, with both museums demonstrating strong mediating capacity within the network through high betweenness values. The “Other” category includes the Vatican Museums, M+, Art Gallery of New South Wales, Museum of New Zealand Te Papa Tongarewa, Museo Soumaya, Museo del Palacio de Bellas Arte, and Museo Nacional de Antropología. The “Marginal” category features the Shanghai Museum and the National Museum of Korea. These results indicate that the Musée du Louvre, Metropolitan Museum of Art, British Museum, and National Gallery of Art occupy central positions within the global museum network, based on their high degree and eigenvector values.
Approaching the subject from a group perspective, or in other words, examining the groups formed within the global museum network, six groups emerge. The largest group is the European and North American group, consisting of six members. The second largest group is formed by two separate groups of three members each. One group consists of museums from Oceania, and the other of museums from Mexico. The remaining three groups are represented by only one member each. In this context, the Shanghai Museum, the National Museum of Korea, and M + stand alone in the network. The Q value (Q = 0.3346) obtained within the scope of the community analysis refers to a certain level of modularity. In other words, it refers to a certain degree of differentiation and identifiable subgroups among the actors. This situation reveals that the global museum network is a complex communication structure that combines geographical and regional affinities with global cross-connections. While a regional clustering tendency was observed, particularly in the Oceania and Latin America regions, Asian museums can be considered to exhibit an isolated appearance due to their independent positions. The PCA analysis performed also supports these results. Recalling that PCA analysis identified two components, PC1 as “overall influence and connectivity/overall centrality” and PC2 as “spatial mediation/connection-independent spatial mediation,” it can be said that these two dimensions overlap with the structural patterns observed in community analysis. In this respect, while PCA statistically defines the dimensions of centrality, the Leiden algorithm reveals the organizational structure at the community level. The combination of the two methods confirms that the global museum network exhibits moderate modularity with specific regional clustering; however, the integration of Asian museums into the network remains limited due to their independent and isolated locations. For example, it can be said that actors such as Musée du Louvre (1), Metropolitan Museum of Art (4), British Museum (3), MoMA (6) and National Gallery of Art (5), which have high values on the PC1 axis, are located together within the European and North American community, and that both PCA and Leiden methods cluster museums with similarly high centrality values. As a second point, it is seen that the National Gallery of Victoria (11) and MoMA (6), which have high scores in the PC2 component, have a relatively stronger mediation potential compared to other museums with the highest betweenness values in the network. However, it was found that museums such as Shanghai Museum (7), National Museum of Korea (8) and M + (9), which formed groups on their own in the community analysis, were positioned on the negative side with low scores on the PC1 axis and their integration into the global museum network remained limited. In addition, it can be said that PCA results show that not only the number of connections but also elements such as the speed of access to information, location and interaction capacity shape the structure of the global museum network, and PCA makes the multidimensional structural roles visible both statistically and conceptually.
A general assessment reveals a Western-centric structure within the global museum network. While museums in major cities like Paris, New York, and London exhibit a high level of connectivity, museums in Asia are observed to be positioned as peripheral actors with lower centrality. This situation suggests a geographical and structural imbalance. Musée du Louvre (1) and Metropolitan Museum of Art (4) stand out as the two museums with the highest degree and eigenvector values, having the most interaction and being the most referenced by other museums. British Museum (3) and National Gallery of Art (5) also closely follow these two museums with high degree and eigenvector values, positioned as leading and secondary center actors. Museum of Modern Art—MoMA (6) and National Gallery of Victoria (11) are seen to have a critical mediating capacity in the network, acting as bridges with high betweenness values. Museo Soumaya (14), M + (9) and Museo del Palacio de Bellas Artes (15) exhibit limited reception capacity at the regional level with low closeness in values. Shanghai Museum (7) and National Museum of Korea (8) are positioned as the most peripheral and isolated actors in the network with zero betweenness and very low degree values. Thus, it is seen that the foundation of the global museum network is formed by Musée du Louvre (1) and Metropolitan Museum of Art (4), and the second ring supporting this foundation is formed by British Museum (3) and National Gallery of Art (5). This structure reveals a Western-centric network pattern. While the Latin American museums Museo Nacional de Antropología (13) is included in the network with medium-level connections in the other category, Museo Soumaya (14) and Museo del Palacio de Bellas Artes (15) similarly exhibit a limited interaction picture at the regional level. Asian museums such as Shanghai Museum (7), National Museum of Korea (8) and M + (9) are seen as the actors with the most limited integration into the global museum network due to their low centrality values and independent positions. Although the Vatican Museums (2) are located within the European and North American community, they are positioned at a more peripheral level of centrality with relatively low degree and eigenvector values compared to other museums in the same community. The Art Gallery of New South Wales (10) and the Museum of New Zealand Te Papa Tongarewa (12) are positioned as actors that provide a certain visibility on a regional scale within the Oceania community with medium-high degree and eigenvector values.
Finally, although it is a side finding of the research, it is noteworthy that only 3 South American museums are included in the list of 100 museums, and that these museums do not engage with each other. The fact that only 3 South American museums are in the top 100 offers a debatable perspective on the interest in museums in South America, and the lack of interaction among these museums indicates a lack of sufficient understanding in terms of communication and connection. This situation also shows that South American museums are disconnected from the network. Given the low museum visitor rates, it's worth questioning the connections of South American museums not only with other museums but also with other art actors (especially visitors). Perhaps, conversely, the low public and tourist interest in museums doesn’t motivate them to join the global network. If the process is considered dynamically from both sides, it could be argued that structural factors influence the interactive activities of museums, and that there may be stimulating cultural elements that encourage museums to interact with other museums or, in other words, to join the global museum network. Furthermore, it could be argued that the community analysis would be stronger if more museums were added to the network. However, since the scope of this study examines a network of the most visited, globally visible, and influential museums, the sample size can be considered sufficient. The data format used in this research necessitates sampling because it is not possible to include all museums in the world in a network. It is considered that other studies may produce results that complement the findings of this research.
When examining the structure of the global museum network, perhaps one of the most important findings concerns its power. When the source of this power is questioned, geographical and demographic location appears to play a significant role. In this context, it can be argued that digital communication capacity should also be considered in conjunction with geographical and demographic location, and that digital communication cannot be considered independently of these elements. It is evident that Western-centric museums, possessing a deep-rooted and strong cultural heritage, attracting high visitor numbers, and distinguishing themselves through institutional prestige, hold a decisive position within the global museum network. This situation means that cultural capital transcends the boundaries of the physical world and establishes itself in the digital realm as well. It is possible to argue that this transfer of cultural capital from the physical to the digital world deepens, rather than eliminates geographical and demographic inequalities in terms of digital communication, and that it reproduces and strengthens the existing hierarchical structure. However, despite the Western-centric nature of the digital interaction process in terms of cultural communication, it can be argued that museums from other regions are also beginning to gain visibility. In this respect, it can be argued that strengthening intercultural ties will increase inclusiveness in cultural communication and ensure the sustainability of interaction among actors. Policy recommendations are needed to develop a structure that will reduce the imbalance between the periphery and the core, foster a multi-voiced structure in cultural communication, and foster multifaceted dialogue. Within this framework, prioritizing digital infrastructure and collaborations with peripheral countries to strengthen global cultural equality, or for authorized institutions to develop grant programs for regional museums, may be suggested. Similarly, simultaneous exhibitions could be considered to enhance digital diplomacy and balance network balance, or algorithmic support could be provided to enhance the digital visibility of surrounding museums. Alternatively, a different proposal could be to establish direct cultural collaborations among surrounding museums to establish multipolar cultural collaboration networks, or to improve knowledge sharing among Western museums through joint research projects. Finally, exchange programs among museum staff could be proposed for training and value creation.
However, it is also important to mention the algorithmic control exerted by profit-oriented Western platforms like Instagram. It can be argued that algorithmic control may be significant in determining which museums are more visible and what is considered culturally important. At this point, the danger of reinforcing a colonial cycle of cultural hegemony emerges. This study also discusses whether the Instagram-based dataset creates a structural limitation. The fact that Instagram is positioned as a limited presence in some geographies and a central hub for digital strategy in others opens up a debate about whether the system is fully reflected. In this context, it can be argued that the existing network structure reflects both the unique interconnectedness between museums and the Western-centric platform structure, and that the Western-centric platform ecosystem imposes a certain hierarchical structure. Therefore, the call for a more inclusive system of cultural communication can be defined not only through the relationships between museums themselves, but also through the balancing of platform structures in terms of algorithmic power. It can be argued that questioning algorithmic power structures could be an important starting point for understanding the global museum network.
Footnotes
Acknowledgements
We would like to thank our family, colleagues, and institutions for their support during the research and writing of the article.
Ethical Considerations
We wish to confirm that ethical approval was not required for the present study because the study did not involve humans, and all research was conducted to the highest possible ethical standards.
Informed Consent Statement
Written informed consent for publication of their details was not obtained in this study as the study did not involve living human participants.
Authorship Confirmation/Contribution Statement
Author 1: Conceptualization (equal); methodology (equal); formal analysis (equal); writing—original draft (lead); writing—review and editing (equal). Author 2: Methodology (equal); software (lead); writing—original draft (equal); formal analysis (equal); review and editing (equal). Author 3: Conceptualization (lead); writing—original draft (equal); formal analysis (equal); review and editing (equal). Author 4: formal analysis (equal); writing—original draft (equal); writing—review and editing (equal).
Funding
The authors received no financial support for the research, authorship, and/or publication of this article.
Declaration of Conflicting Interests
The authors declared no potential conflicts of interest with respect to the research, authorship, and/or publication of this article.
Data Availability
The datasets generated during and/or analyzed during the current study are available from the corresponding author on reasonable request.
Author Biographies
Appendix A
The following list includes the R codes used in the study.