






Abstract
This paper introduces a dataset gathered entirely in urban scenarios with a car equipped with one stereo camera and five laser scanners, among other sensors. One distinctive feature of the present dataset is the existence of high-resolution stereo images grabbed at a high rate (20 fps) during a 36.8 km trajectory, which allows the benchmarking of a variety of computer vision techniques. We describe the sensors employed and highlight some applications which could be benchmarked using the present work. Both plain text and binary files are provided, as well as open-source tools for working with the binary versions. The dataset is available for download at http://www.mrpt.org/MalagaUrbanDataset.
Keywords
1. Introduction
Applying the scientific method to computer vision and simultaneous localization and mapping (SLAM) implies being able to perform rigorous benchmarking of the different algorithms in order to determine their suitability and relative performance.
The interest of the community in this sense is clear, given the number of projects and workshops devoted to the topic (Bonarini et al., 2006; Sturm et al., 2012). One of the best-known SLAM datasets is the Sydney Victoria Park dataset (Guivant and Nebot, 2001), which is, however, limited to two-dimensional (2D) range-bearing mapping. The project Rawseeds (Bonarini et al., 2006) also aimed to provide indoor and outdoor datasets with visual information. More recent releases that include images of urban areas (Peynot et al., 2010; Geiger et al., 2012) or both images and laser data of park-like zones (Smith et al., 2009) have also attracted the attention of the community, clearly reflecting the demand for this kind of release.
In comparison to previous datasets, and as summarized in Table 1, we claim that the present work provides a unique combination of (i) multiple laser scanners pointing in various orientations and (ii) high-rate (20 fps) and high-resolution (1,024 × 768) stereo images of good quality (e.g. minimal motion blur). In addition, a significant part of our dataset reflects dynamic environments with real-life traffic, thus becoming a challenging testbed for SLAM, visual odometry and object-detection methods.
A comparison of some previous datasets regarding the presence (✓) or not (×) of GPS sensors, GT, IMU the usage of laser scanners, the kind of cameras on the vehicle and the dataset path lengths.

The structure of this paper is as follows. Section 2 addresses the configuration of the vehicle, next we describe each employed sensor and finally Section 3 presents the dataset itself.
2. Vehicle setup
2.1. Physical characteristics
In order to be able to navigate outdoors in a safe way throughout typical urban scenarios we decided to employ a common Citroen C4 car, shown in Figure 1. All the sensors were installed on a modified roof-rack, designed for the flexible placement of heterogeneous devices. This configuration allowed us to drive through city traffic without restriction.

The vehicle employed for collecting the dataset: (a) general view and (b) close-up of the sensors.
Two computers were also installed inside the vehicle to cope with the computational and storage bandwidth requirements. All the electrical power for the computers and sensors was obtained from the vehicle’s own power system.
We recorded data from eight sensors: one stereo camera, five laser scanners, one inertial measurement unit (IMU) and one global positioning system (GPS) receiver.
Figure 2 schematically illustrates the placement of each sensor on the vehicle, with approximate (hand-measured) coordinates shown in Table 2

Side and top views, respectively, of the relative positions of sensors on the vehicle’s roof-rack structure. Compare with Figure 1(b). Not to scale.
Summary of the approximate sensor positioning on the vehicle. Refer to Figure 2.

Next we briefly describe the relevant characteristics of each sensor and the reasons for their inclusion in the dataset.
2.1.1. The stereo camera
Color imaging was provided by a Point Grey Research Bumblebee 2 stereo camera, configured to capture images at its maximum resolution of 1,024 × 768 at 20 fps. As opposed to our previous dataset (Blanco et al., 2009), the usage of a stereo camera instead of two independent cameras assures precise synchronization in both image streams. The camera gain and white-balance control were left in ‘automatic’ mode.
Once one determines the camera’s intrinsic parameters, the rigid mounting of the two CCD sensors inside the camera and the use of a fixed focal distance, leads to a reliable calibration that is not affected by shocks and vibrations. Although the dataset includes all camera calibration parameters, we also publish a collection of raw stereo images of a checkerboard to allow the reader to apply different calibration methods.
This camera was placed pointing forwards and slightly tilted up, to avoid capturing part of the vehicle chassis. Despite the small parallax obtained during navigation from forward-looking cameras, we decided to use this configuration for its interesting applications in detecting other vehicles, pedestrians, traffic lights, etc.
2.1.2. The laser scanners
The vehicle was equipped with five laser scanners: three Hokuyo UTM-30LX and two SICK LMS-200. The former are small, energy-efficient scanners with a range of 30 m and a field of view of 270◦. With an angular resolution of 0.25◦, they provide nominal accuracies of 30 and 50 mm for distances below and above 10 m, respectively. The latter models, manufactured by SICK for industrial use, are considerably heavier, more robust and more energy demanding. However, their working range extends up to 80 m, and they are less prone to detecting “phantom points” near sharp edges, a problem occasionally found in range data from Hokuyo sensors.
Regarding the placement of the scanners onboard, they can be divided in three groups:
The two SICK scanners sense in the horizontal plane. These data may be useful for 2D SLAM for parts of the trajectory that are flat enough.
Two lateral Hokuyo sensors provide vertical scanning of the vehicle’s surroundings.
One Hokuyo scanner is placed pointing forwards and tilted down, in order to sequentially scan the road ahead of the vehicle, e.g. for obstacles.
The two scanners (SICK and Hokuyo) pointing forwards may find applications in detection algorithms that fuse visual and range information.
2.1.3. Inertial measurement units
Inertial sensors based on inexpensive microelectromechanical system (MEMS) technology are now present in many portable devices such as tablets and smartphones. Therefore, it seems reasonable to try to explore the possibilities that these sensors create for improving visual odometry or visual SLAM methods.
To endow our dataset with this kind of information we installed an xSens MTi inertial unit on the vehicle. It was firmly attached to the roof structure like all of the other sensors, thus the angular velocities sensed by the device could be accurately assigned to the rest of the sensors as well, disregarding the negligible effects of the structure elastic deformations during the drive.
With a rate of 100 Hz, the measurements provided by this device include:
Three-axis acceleration. We have experimentally measured its static error, which has a standard deviation of σacc ≈ 0.05 m/s2.
Three-axis instantaneous angular velocity. Its experimental angular velocity error has been found to be σgyro≈ 0.4◦/s, while systematic errors were noticed for yaw (rotation around the z-axis) of the order of ~0.6◦/s.
Attitude dead-reckoning in three dimensions, as provided by the internal filter implemented by the manufacturer.
2.1.4. The global positioning system receiver
We also installed a consumer-grade, low-cost GPS receiver on the car, with a two-fold purpose: (i) providing approximate positioning for a better understanding of the whole trajectory traversed in this dataset (see Figure 3), and (ii) offering realistic GPS data for usage in visual SLAM applications aimed at the automotive industry.
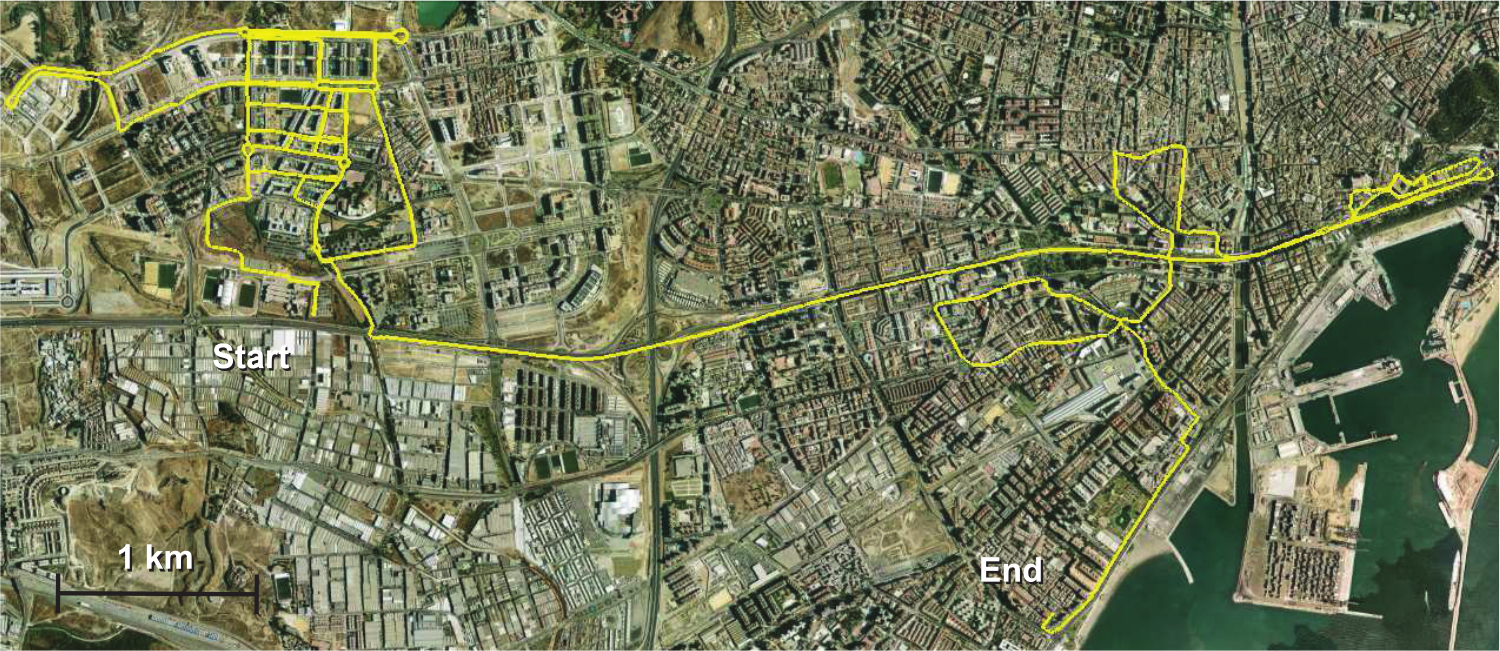
An overview of the complete trajectory, as reconstructed from GPS data. A zoomable version is available online.
This sensor provides positioning data at 1 Hz during the whole dataset, with the exception of a few unavoidable segments (‘urban canyons’ and dense groves) where the signal was too weak to provide good localization.
Two additional industry-grade GPS receivers were also installed in the vehicle (mmGPS devices from Topcon, the two cylindrical yellow devices in Figure 1), but positioning information was not available from these receivers during the recording of the dataset. However, frames with GPS timing information were collected from both receivers in order to accurately synchronize the local clocks of the two computers. By grabbing satellite timestamps from two identical receivers in both computers we have been able to establish a least-square fit of the mapping between the reference GPS time and the local clocks. More importantly, this mapping provides an accurate way of merging the partial datasets grabbed in each machine during an offline post-processing stage. Interestingly, we found out that not only did the local clocks have an offset (as could be expected) but that they exhibited a small drift (6.06 and 83.33 ms/s, respectively), which has been corrected in the published dataset.
2.2. Software
The vehicle was equipped with sensors of quite different types, each generating data at different rates. Thus, the software intended to record the data logs must be capable of dealing with asynchronous streams from the sensors. For this purpose, we employed the data logger application rawlog-grabber, as we also did for previous datasets (Blanco et al., 2009).
This program launches one thread for each individual sensor. Then, each thread splits the sensory data into their corresponding natural discrete pieces (called observations), e.g. a complete 2D scan for laser scanners, and marks them with timestamps. Since our system does not run on a real-time OS, we had to ensure that no observation was lost, by creating a first in first out (FIFO) queue for each thread, then merging all of their outputs into a thread-safe timestamp-sorted queue, which was periodically pushed to a binary rawlog file. We chose binary log files for their bandwidth efficiency in contrast to other pure-text formats. Afterwards, we post-processed the binary logs to generate plain text logs for the convenience of readers.
Collecting large images (1,024 × 768) at real-time without dropping frames presented an additional challenge, because hard-disk bandwidth is not enough for saving raw images, while lossy compression solves the issue but introduces a high computational burden. Our approach consisted of parallelizing the latter task by creating additional threads with the sole purpose of compressing images into a high-quality format (JPEG format, quality = 95).
3. Dataset summary
The following paragraphs describe the most relevant characteristics and statistics of the dataset presented; accessing the supplementary material online 1 is recommended for greater insight.
3.1. Description
The dataset was recorded as a single sequence during a car trip throughout different urban areas of Málaga, with a total duration of ~93 min. An overlaid impression of the GPS-reconstructed path over a map of the city is provided in Figure 3.
Observations from all sensors were recorded at their maximum nominal rates. These values, along with the actual average rates obtained from the logged stream of data, are shown in Table 3. The similarity of actual and nominal rates means that only a tiny fraction of sensory data was dropped for most sensors (mostly due to corrupt frames for communication errors), with the worst case being the sensor
Summary of the grabbed data from each sensor. The actual rates shown here are the average values obtained as the ratio count: duration.

Regarding the trajectory followed during the recording, we can split the dataset into the following segments or epochs (within parentheses, the starting and end points measured in minutes since the start):
Epoch 1 (0–6 min): Four loops within the parking lot of the Computer Science School of the University of Málaga. This area was also recorded 13 months earlier for a previous dataset with a different camera (Blanco et al., 2009), making this segment ideal for testing place-recognition algorithms.
Epoch 2 (6–10 min): Driving towards a nearby suburb, crossing one under-construction road.
Epoch 3 (10–52 min): One of the main parts of the dataset, in which two Northwestern Málaga suburbs (El Cónsul and El Romeral) were transversed several times including nested-loop closures. The car underwent a parking maneuver during minutes 17–19. Traffic lights and overtaking also appear in this segment.
Epoch 4 (52–60 min): A trip towards downtown, traversing a highway-like road. In contrast to the velocity range of 20–40 km/h (12.4–24.9 mph) in the other epochs, in this segment the vehicle moves faster than 50 km/h (31 mph).
Epoch 5 (60–93 min): Another of the most interesting segments, since it includes several loop-closures in downtown. Here we find the highest traffic density for the entire dataset.
As an additional tool to help the interested reader to pick relevant segments from the dataset we created a video index (see Figure 4), available online. 2 Apart from the camera images, the video shows a 3D point-cloud reconstruction of the environment from the vertical laser scanners and GPS data as a gross estimate of the ground truth path. Some snapshots of the obtained scenarios can be also seen in Figure 5.

A view of the dataset video index, which simultaneously displays: (top-left) raw video frames, (bottom-left) the current location of the vehicle over the city map and (right) the local 3D point-cloud from the laser scanners.

Three sample screenshots from the dataset: (left) 3D reconstructions from vertical laser scanners and GPS-only information, (right) images from the stereo camera in the same places.
In order to make working with the dataset easier, it was further divided into 15 smaller sequences or extracts, illustrated in Figure 6. A video is also available online for each individual sequence, such that they can be easily inspected. Next, we enumerate the length in seconds of each extract and provide a brief description of its contents:
Straight path in the faculty parking (39 s).
Through an under-construction road (92 s).
Three-quarters of a turn at a roundabout (41 s).
Crossing a roundabout, some traffic (32 s).
Loop-closure (~1.7 km) in a straight avenue (240 s).
Loop-closure (~1.2 km) around building blocks (230 s).
Loop-closure (~0.7 km) around a small avenue (106 s).
Long loop-closure (~4.5 km) (501 s).
Through the campus boulevard, with some traffic (50 s).
Multiple loop-closures in a suburb area (865 s).
Highway incorporation, some traffic (144 s).
Long avenue (~3.7 km), dense traffic (443 s).
At downtown. Dense traffic and pedestrians (1,572 s).
Direct sun conditions in a parking area (112 s).
Direct sun conditions in a suburban area (69 s).

Summary of the 15 dataset extracts available for download. For each segment, the vehicle path is shown together with aerial urban images for reference. Refer to the online material for interactive maps.
Although all sensory data are provided in plain-text format, it is worth mentioning that two ready-to-use applications (named
3.2. Challenges
We found that a particularly challenging problem during the recording of outdoor images was the appearance of vertical smears caused by direct sun exposure. After several attempts on different days we obtained, on a cloudy day, the present dataset which exhibits a minor occurrence of such smears. Another challenging aspect of the images, from the point of view of computer vision, was the dynamic gain control of the camera which may introduce hurdles for feature-tracking algorithms. However, we believe that these challenges are intrinsic and unavoidable for any real-world problem where cameras are to be placed on vehicles for navigation in uncontrolled, outdoor scenarios. In order to allow researchers to easily compare diverse robust techniques against this kind of problem, we released two short dataset extracts (numbered #14 and #15) with direct sun exposure.
4. Conclusions
We have presented a dataset whose most relevant component is the presence of high-rate and high-resolution stereo video in unmodified urban scenarios. The authors believe that the mobile robotics community will find it especially suited for the benchmarking of visual odometry, visual SLAM and appearance-based recognition methods. Moreover, the presence of several laser scanners enables LiDAR-vision object detection and recognition within realistic traffic situations.
Footnotes
Funding
This work was partially funded by the Spanish Ministerio de Ciencia e Innovación (grant numbers DPI2008-03527, DPI2011-25483 and JDC-MICINN 2011).