
Abstract
Cell migration refers to the directional cell movement in response to a chemoattractant gradient, a key process that occurs in a wide variety of biological phenomena. Cell protrusion force is generated by the actin polymerization of a cell, which drives the cell to move toward the stimulus as induced by the chemoattractant gradient. This paper presents a new methodology for the direct measurement of cell protrusion force utilizing a robot-aided optical tweezer system. The functionalized beads that are robotically trapped and placed near the cell serve as both cell migration stimulators and protrusion force probes. The force generated by the actin polymerization of the cell propels the bead to move away from the trapping center when the cell comes in contact with the bead. Such a deviation can be determined and used to calculate the trapping force, which is equal to the protrusion force at a balanced position. With the quantitative measurement of the protrusion, we find that the protrusion force of a live cell in response to a chemoattractant within the range of hundreds of piconewtons. We further probe the protrusion force distribution at the cell leading edge and find that the highest protrusion force appears at the cell migration direction. These measurements can help us characterize the mechanism of cell migration and lay a solid foundation for further proactive control of cell movement.
1. Introduction
Cell migration refers to the movement of cells along particular directions to specific locations under extra stimuli, such as chemical gradient, and represents a central process in a wide variety of biological phenomena (Haastert and Devreotes, 2004; Roussos et al., 2011). Although immense progress has previously been made in the study of cell migration, particularly in the investigation of various stimuli and involved proteins (Gurdon and Bourillot, 2001; Ridley et al., 2003), the understanding of cell migration mechanism for the precise and proactive control of cell movement remains limited. Cells rearrange their shapes during migration in response to extracellular signals and extend protrusions at the leading edge (Haastert and Devreotes, 2004). The protrusion force (Fp), which is generated from the actin polymerization of a cell, drives the cell to move toward the stimulus. Elucidation of the force of protrusion is of great importance to understand the actin polymerization-generated movement. Thus far, studies on the quantitative measurement of Fp and the force distributed along the direction of cell migration have rarely been conducted, thereby inhibiting further advances in cell motility research.
Studies have developed direct or indirect approaches to measure the force generated by actin polymerization. For instance, a propulsive force is approximately equivalent to a few nN (Marcy et al., 2004; Heinemann et al., 2011). Some researchers also reported that the maximum Fp (Fpmax) is approximately tens or hundreds of piconewtons (McGrath et al. 2003; Prass et al., 2006). In another study, the propelling force is <20 fN (Cameron et al., 2004). Most of these measurements were performed with bacterial and spherical polystyrene beads. A new approach that can simulate the in vivo environment to induce cell polarization and migration is urgently needed to measure the Fp of cells quantitatively and more accurately.
Over the past decade, robotics have been proven to be an effective tool for many cell manipulations at the single-cell level (Jager et al., 2000; Abbott et al., 2007; Lu et al., 2010; Nelson et al., 2010; Chen et al., 2012; Chen and Sun, 2012; Diller et al., 2013). Among various robotic systems, a robot-aided manipulation system incorporated with optical tweezers has demonstrated unique advantages of high flexibility, high precision, and non-invasive contact manner. The ideal size of the microparticles handled by a robot–tweezer combined system ranges from tens of nanometers to tens of microns (Tan et al., 2011; Wang et al., 2011; Thakur et al., 2014), and many human/animal cells fall within this range. Automated manipulation of optical trapping has also been developed (Hu and Sun, 2011; Chowdhury et al., 2013; Wu et al., 2013). A recent report indicated that an optically manipulated microsource can be efficiently used to induce cell migration (Kress et al., 2009). These advantages enabled robotically controlled optical tweezers to function as a special robot end-effector for the advancement of the automated control of cell migration.
To achieve proactive control of cell migration, the relevant mechanism must first be elucidated. In this mechanism, cell protrusion force serves a key function. In this paper, a robot-aided cell manipulation system equipped with optical tweezers was used to measure the cell protrusion force quantitatively for cell migration control. This research was performed in the following perspectives. Firstly, the chemoattractant environment, where cells were induced to polarize and migrate, was modeled. The chemoattractant-loaded polylactic-co-glycolic acid (PLGA) beads were optically trapped and placed near the cell. The beads released chemicals into the environment surrounding the cell, simulating the in vivo environment where cells are induced to polarize and migrate. Secondly, a method for the direct measurement of Fp on live cells during the chemoattractant gradient-induced migration was developed. When the cell migrated toward the PLGA bead, the Fp propelled the bead and caused the bead to deviate from its trapping center. The offset of the bead with respect to its trapping center, which can be measured through image processing technology, was used to calculate the Fp that was supposed to be approximately equal to the optical trapping force exerted on the bead. Finally, experiments were performed on leukemia cancer cells to demonstrate the accuracy of the proposed method. With the quantitative measurement of Fp, we found that the Fp of a live cell in response to a chemoattractant was within the range of hundreds of piconewtons. We further probed the spatial and temporal force distribution at the cell leading edge and found that the cell exhibited the highest protrusion force at the cell migration direction. The proposed approach will enable the examination of the cell migration mechanism in a chemical environment and will facilitate the quantitative measurement of protrusion force distribution at the cell leading edge. The research outcome will lay a solid foundation for the control of cell migration in future studies.
2. Theory
2.1. Models
Cells spatially sense their external environment and respond to certain chemical stimuli. The generation of a controllable chemical environment to enable the control of cell migration is critical in this research. In this study, a robot-aided microengineered approach was used to generate a chemoattractant environment that can simulate in vivo conditions. As shown in Figure 1, the PLGA microbead trapped by the optical tweezers was placed near the cell (Figure 1(a)). The PLGA bead, which was fabricated using a solvent evaporation-spontaneous emulsion technique (Fahmy et al., 2005), was loaded with a specific chemokine. Such a bead was biocompatible and degraded slowly, releasing chemical molecules into the medium to form a chemical gradient. The cell sensed the gradient generated by the PLGA bead and moved toward the bead (Figure 1(b)). By controlling the motion of the bead through robotically controlled optical tweezers, the migration of the cell can be regulated (Figure 1(c)).
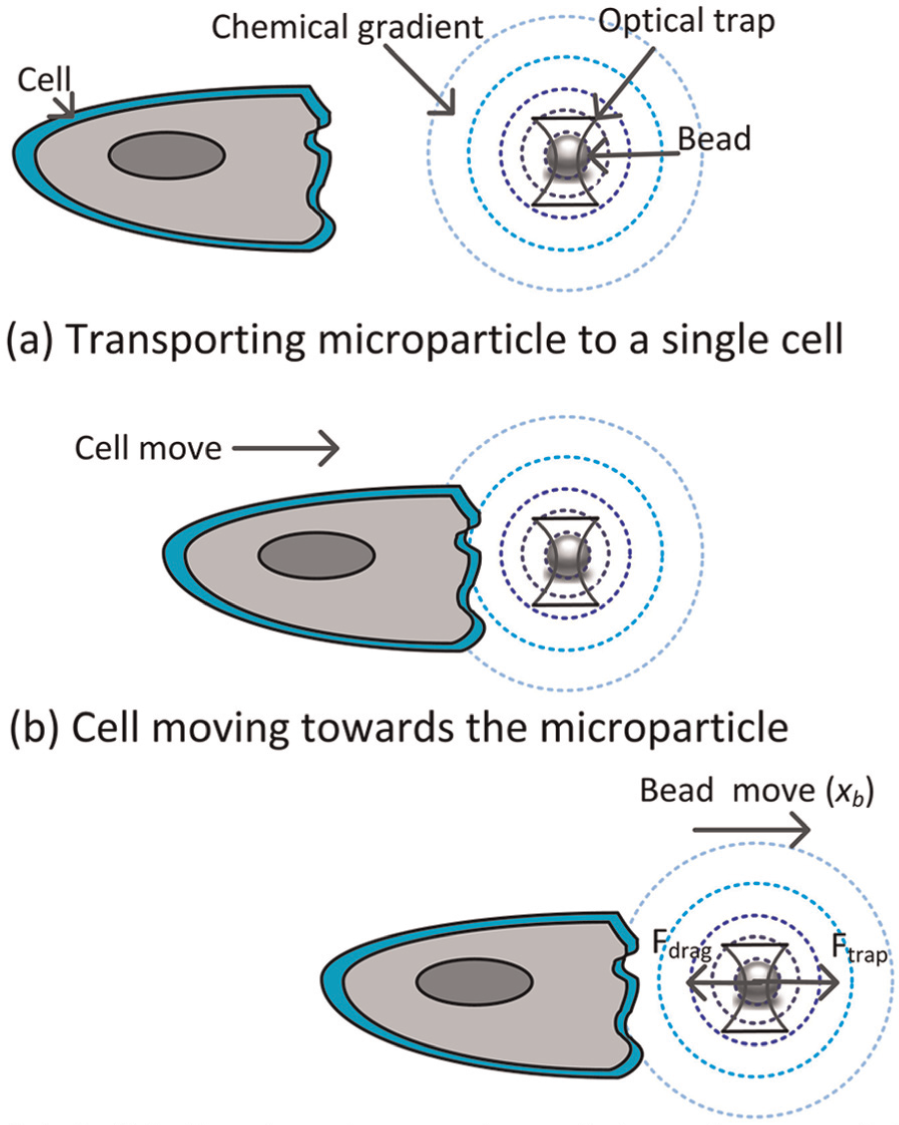
Schematic of cell migration.
Control of cell migration is based on the control of the PLGA bead. The forces that govern the motion of the bead, trapped by robotically controlled optical tweezers, consist of the trapping force caused by the optical trap (Ftrap) and the viscous drag force caused by the liquid (Fdrag). We define x as the distance (offset) between the bead centroid and the focus of the trap. The trapping force Ftrap is proportional to x as expressed below (Hu and Sun, 2011):
where x0 is a critical displacement, beyond which Ftrap decreases; and k is the trapping stiffness within the critical displacement. The viscous drag force Fdrag exerted on the bead can be calculated as (Svoboda and Block, 1994; Gou et al., 2013)
where
The cell protrusion force was measured by a robot-aided cell manipulation system equipped with optical tweezers in our laboratory, as shown in Figure 2. The system consists of three main modules. The first module is a continuous wave laser source with wavelength of 1064 nm (V-I06C-3000 OEM I-series, Spectra Physics) to manipulate the micro/nano-sized beads (ranging from 100 nm to 100 µm). The second module is a motorized x-y-z stage (resolution < 10 nm) mounted with an incubator to keep cells in an atmosphere of 5% CO2 and 37°C temperature. The third module is an image processing system that consists of a computer and a charge-coupled device (CCD) camera. The dichroic mirror reflects the laser beam into the objective and enables the images of the cells and the trapped beads to pass into the CCD camera. The positions of the cells and beads can be detected by a digital image processing technique. The manipulation process can be observed using an inverted microscope.
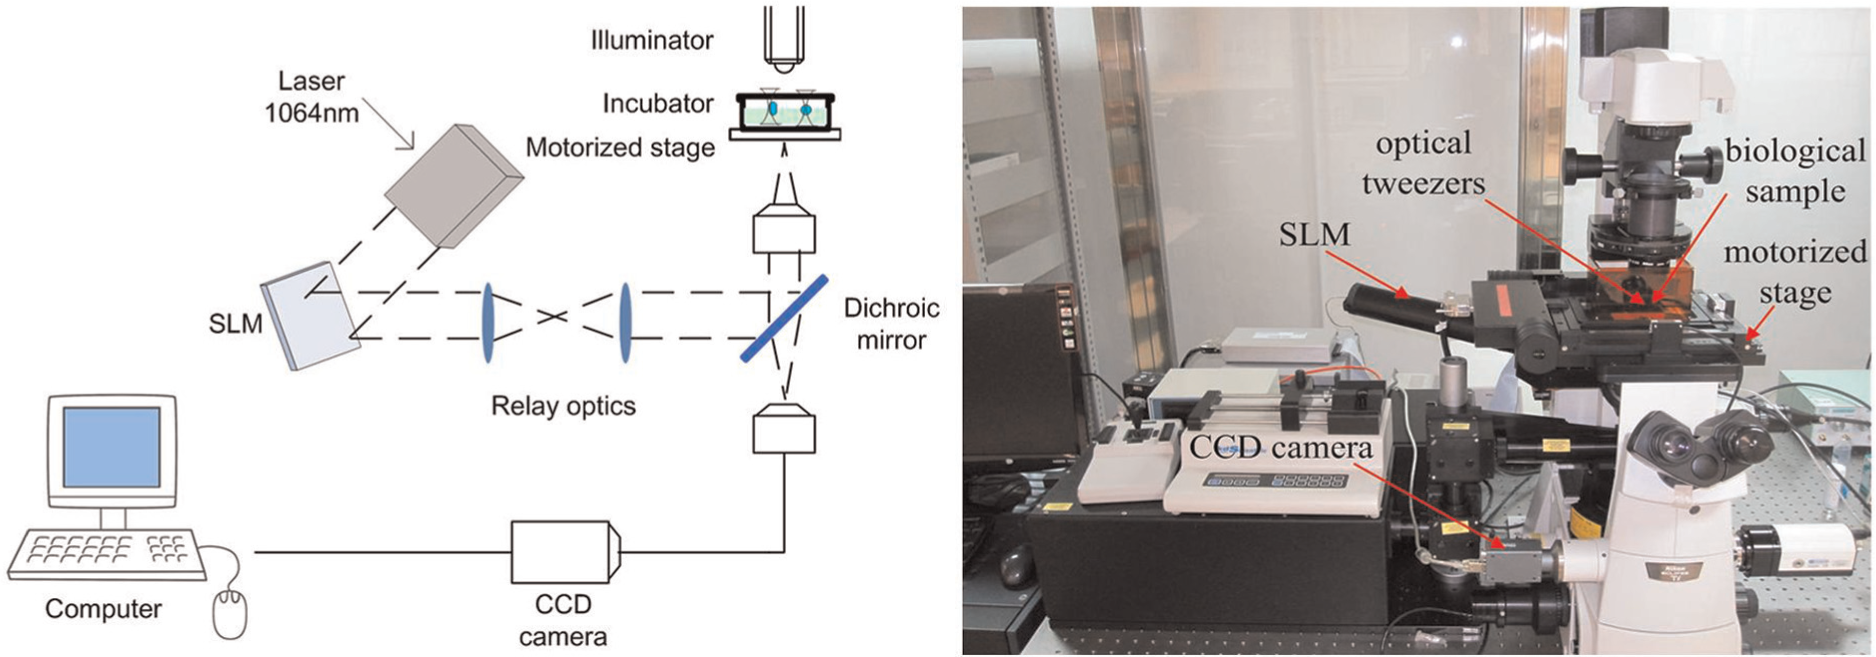
Schematic of optical tweezer system.
2.2. Force measurement
Figure 3 shows a schematic diagram of the proposed method to measure Fp. Firstly, the PLGA bead was trapped and placed near the cell at 3–5 µm. The cell sensed the chemical stimuli produced by the PLGA bead and moved toward the bead [Figures 3(a) and (b)]. The optical trap holding the bead was maintained at the same position during the process. As the cell moved toward the bead, the force generated by actin polymerization of the cell propelled the bead and caused it to move away from the trap center. Ftrap exerted on the bead increased in proportion to x of the bead with respect to the focus of the trap within a certain range. In this process, the bead was subjected to three forces, namely, Ftrap caused by the optical trap, viscosity drag force (Fdrag) caused by the liquid, and Fp generated by actin polymerization [Figure 3(c)]. Figure 3(d) shows a cell sample during measurement.
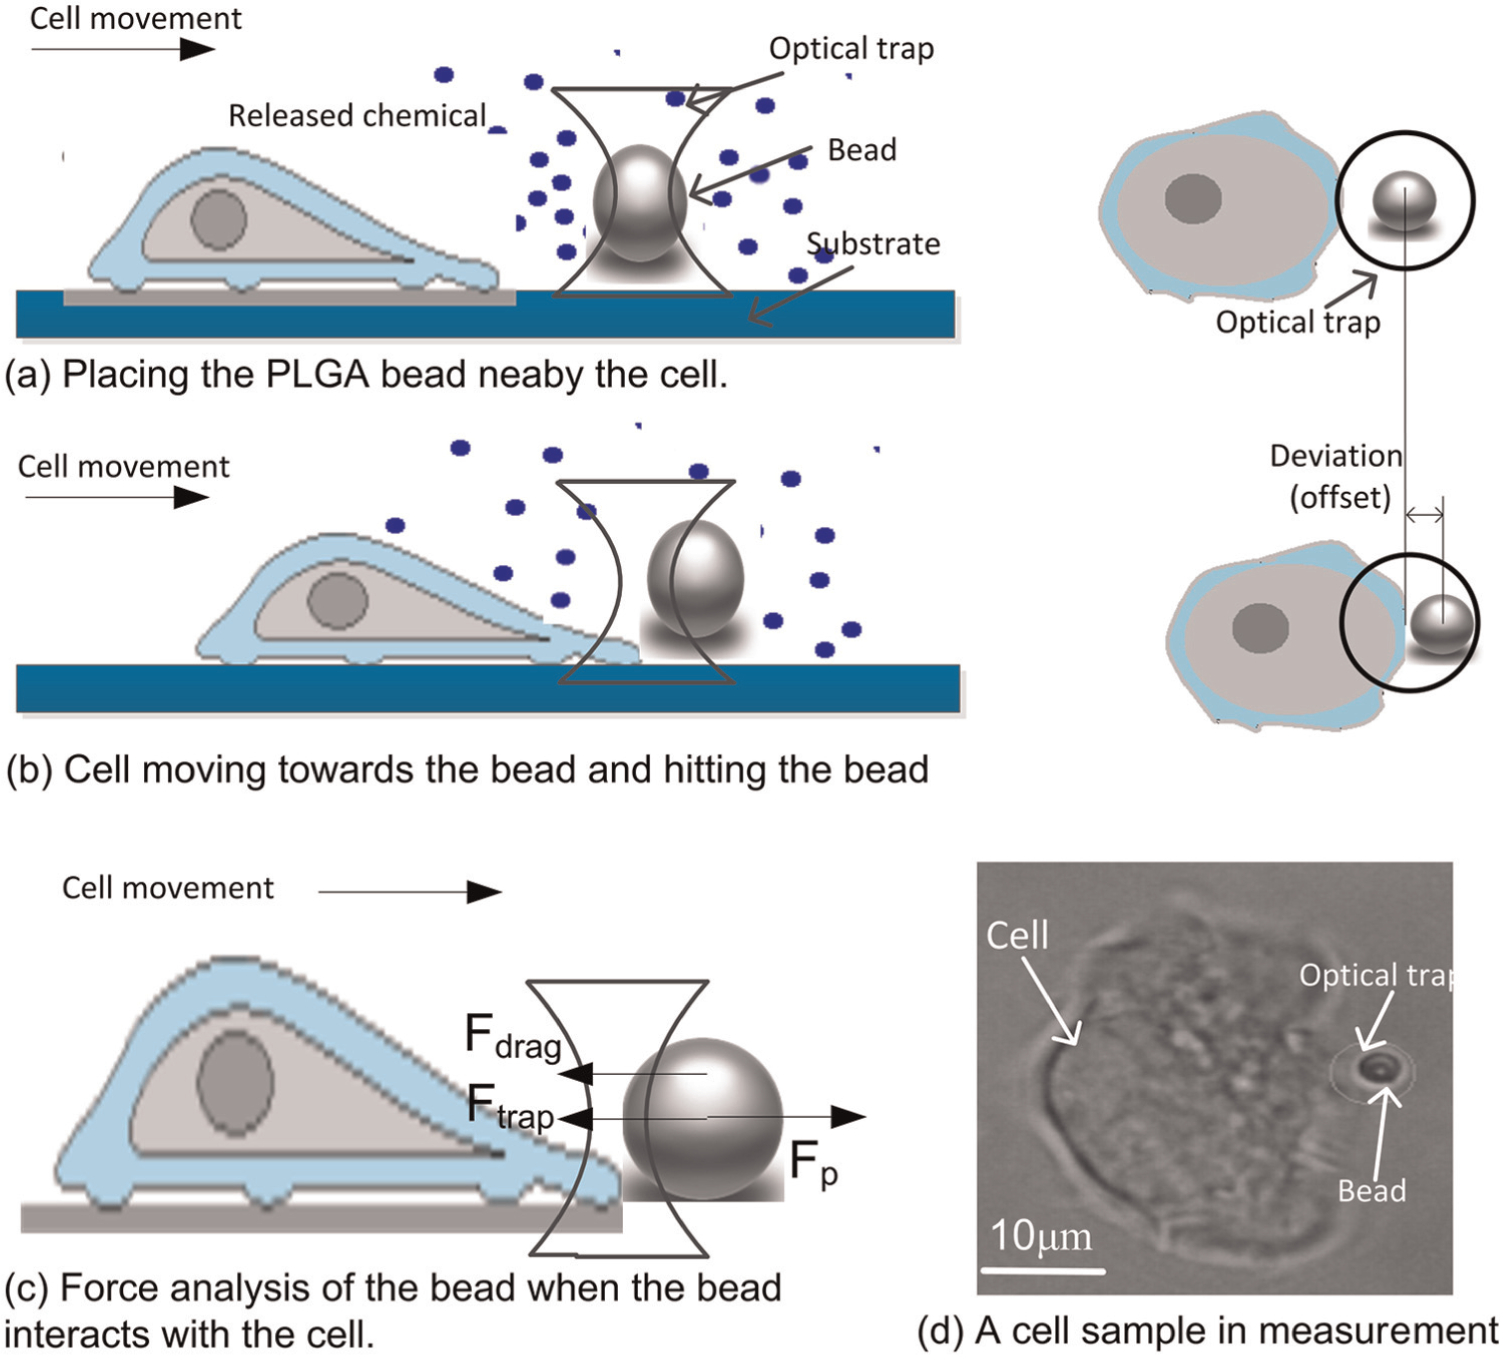
Schematic diagram of the protrusion force of the cell measured using the optical tweezer system.
The dynamics equation of the bead as it interacts with the cell is expressed as follows:
where mb is the mass of the bead, and
In an environment with low Reynolds numbers, the force of inertia can be disregarded (Gauthier and Wallace, 1995). In our experiments, the diameter of the bead was approximately 3 µm, and the velocity of the bead was <10 µm/s. As a result, the Reynolds number was small enough (Re < 10–4 < 1), and
Equations (1) and (2) can be substituted into Equation (4), yielding Fp as follows:
Considering that k can be obtained by optical force calibration (Wu et al., 2013) and x can be calculated by image processing, we can calculate Fp.
The proposed method was further extended to the multi-bead case to reveal the distribution of at the cell leading edge. Figure 4 shows that multiple beads can be placed at different positions around the cell to detect multiple Fpi values. For example, a total number of n beads are placed near a cell, and Fpi at each contact point can be calculated by using Equation (5) as follows:
where ki is the trapping stiffness of the ith trap; xi and λi are the offset and the drag coefficient of the ith bead, respectively; and
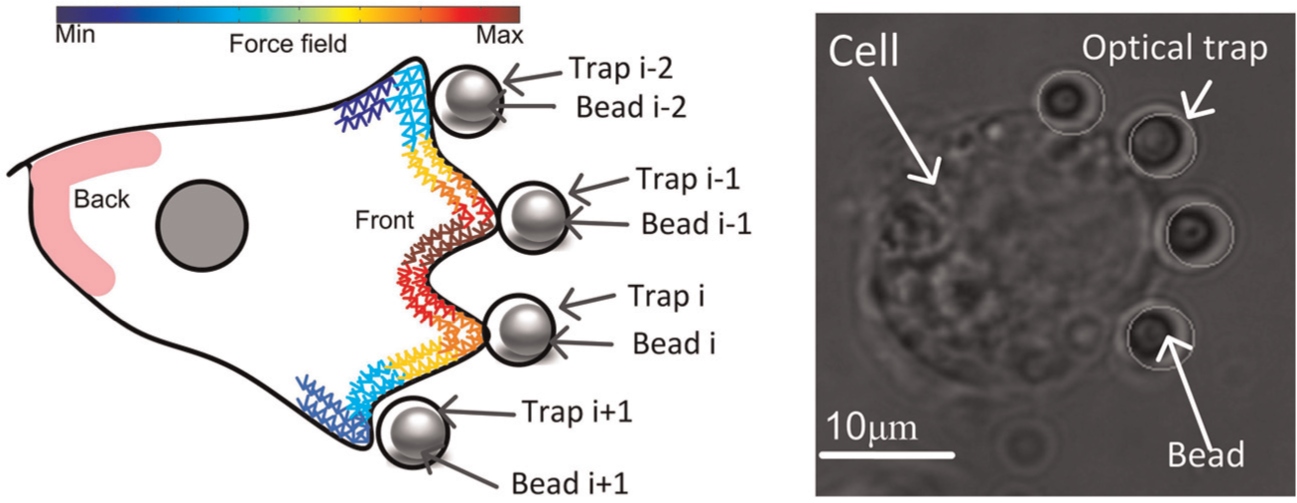
Schematic diagram and experimental setup of the multi-bead force detection.
The spatial and temporal distribution of Fpi can be analyzed by combining the measurements of multiple Fpi at different points around the cell. This procedure further helps elucidate the relationship between Fpi and the direction of cell migration.
3. Results
3.1. Cell culture
Jurkat cells, a kind of leukemia cancer cell, were selected for the investigation of cell motility in this study. The Jurkat cells were cultured in RPMI 1640 media with 10% (v/v) fetal bovine serum (FBS) (Invitrogen, Carllsba, CA, USA) and incubated under 5% CO2 at 37°C in a humidified atmosphere. During the experiments, a 35 mm Petri dish with a thin bottom (µ-dish) was used to culture the Jurkat cells. The culture dish was first coated with fibronectin (100 µg mL–1, from Invitrogen) overnight at 4°C, 1 d before the experiments. The fibronectin was aspirated the next day, and the dish was rinsed with phosphate buffered saline (PBS) and filled with RPMI 1640 medium, which was supplemented with 10% (v/v) FBS. Cells were seeded on the fibronectin layer and incubated for 2–3 h to enable attachment to the dish.
3.2. Calibration of optical trapping force
A preliminary experiment for the calibration of the trapping stiffness (k) was conducted. Numerous methods have been proposed to calibrate the trapping stiffness in the literature (Svoboda and Block, 1994; Wu et al., 2013). In our research, the widely used viscosity drag force method was used to calibrate the trapping stiffness under different laser powers. A bead was initially trapped in a suspending medium, and the center of the bead was coincident with the focus point of the trap. The computer-controlled motorized stage was then moved at a known rate to produce a stable flow over the bead. The effect of the drag force applied to the bead caused the bead to deviate from the trap center. At a position with balance, the trapping force was equal to the drag force, which can be calculated using Equation (3).
As shown in Figure 5, when the deviation was within the critical displacement (i.e., x0 = 2.3 μm, which was numerically calculated in our previous work (Hu and Sun, 2011)), the trapping force increased as deviation increased under a laser power (P) of 100 mW. The fitted line in Figure 5 represents the average stiffness, which is a function of the laser power and is expressed as k = (0.52 ± 0.02) P. Table 1 lists the values of the trapping stiffness under different laser powers.
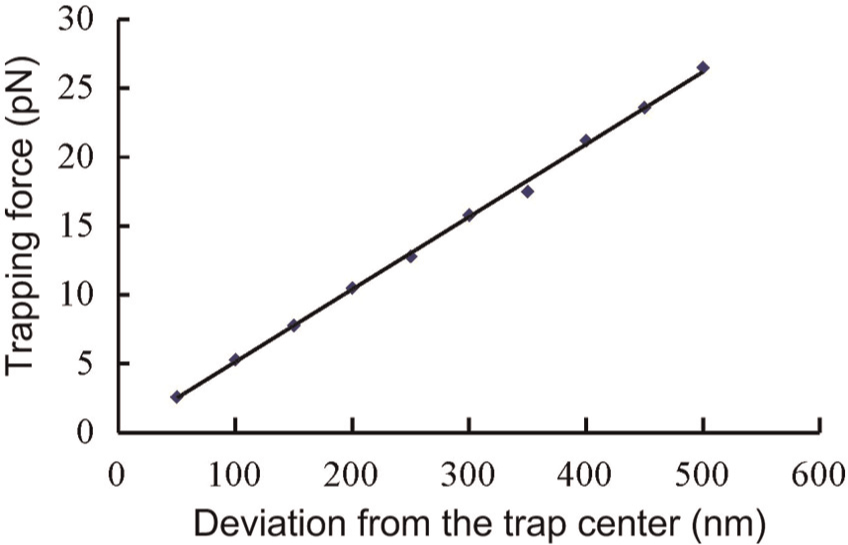
Trapping force increased as the deviation from the trap center increased.
Single-trap stiffness at different laser powers.
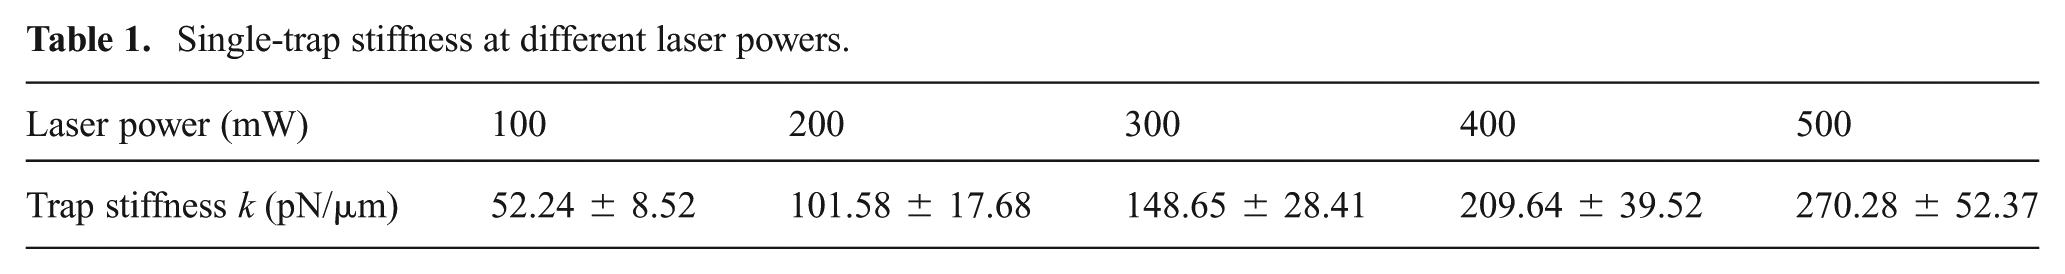
Table 2 shows the trapping stiffness of each trap when multiple traps were produced at a fixed laser power of 100 mW. Subjected to the constraint that the total power from the laser source was fixed, the trapping stiffness of each trap was reduced when more optical traps were used simultaneously. The trapping stiffness values of the traps were found to be similar when multiple traps were produced simultaneously.
Trap stiffness of multiple traps under a total laser power of 100 mW.
3.3. Gradient estimation
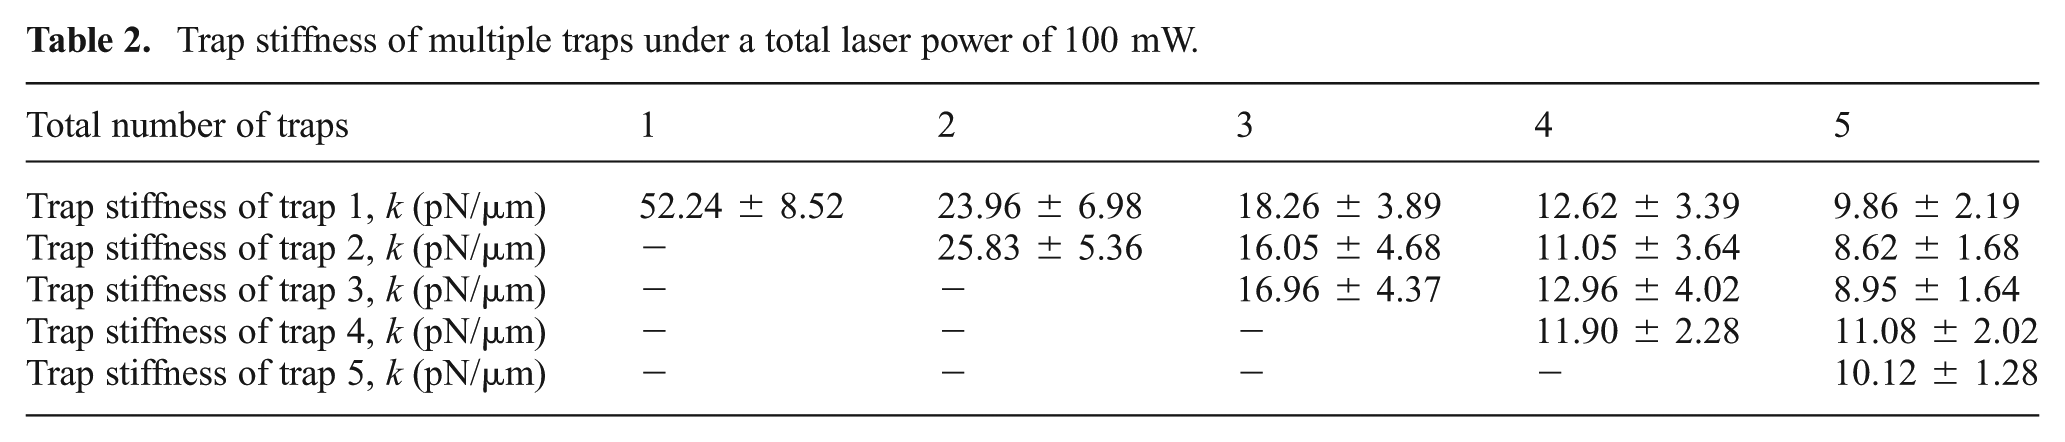
The PLGA beads used in our experiments were loaded with stromal cell derived factor 1a (SDF1a), a chemokine capable of stimulating leukemia cancer cells to migrate. The concentration profile of molecules released from a single bead can be calculated numerically (Kress et al., 2009). To estimate the concentration field produced by the chemical released from PLGA beads, a simulation was performed using COMSOL Multiphysics software. The concentration distributions of a single as well as multiple beads were analyzed based on the diffusion coefficient of SDF1a, which was 1.7 × 10⁻¹³ m2s–1 (Merks et al., 2008). Figure 6 shows the simulation results. The diameter of beads in the simulation was set as 3–5 µm. The scale bar was labeled with absolute concentrations, where the maximal concentration on the surface of the bead was 2.5 µM (presented as dark red), and the minimal concentration in the background was 0 µM (presented as dark blue). Figures 6(a) and (b) respectively show the lateral and top views of the chemical concentration distribution of a single bead. Figure 6(c) shows the chemical distribution of four beads from the top view. By controlling the positions of beads, different shapes of chemical gradients can be formed, implying that different concentration gradient fields can be generated by assembling multiple beads around the cell.
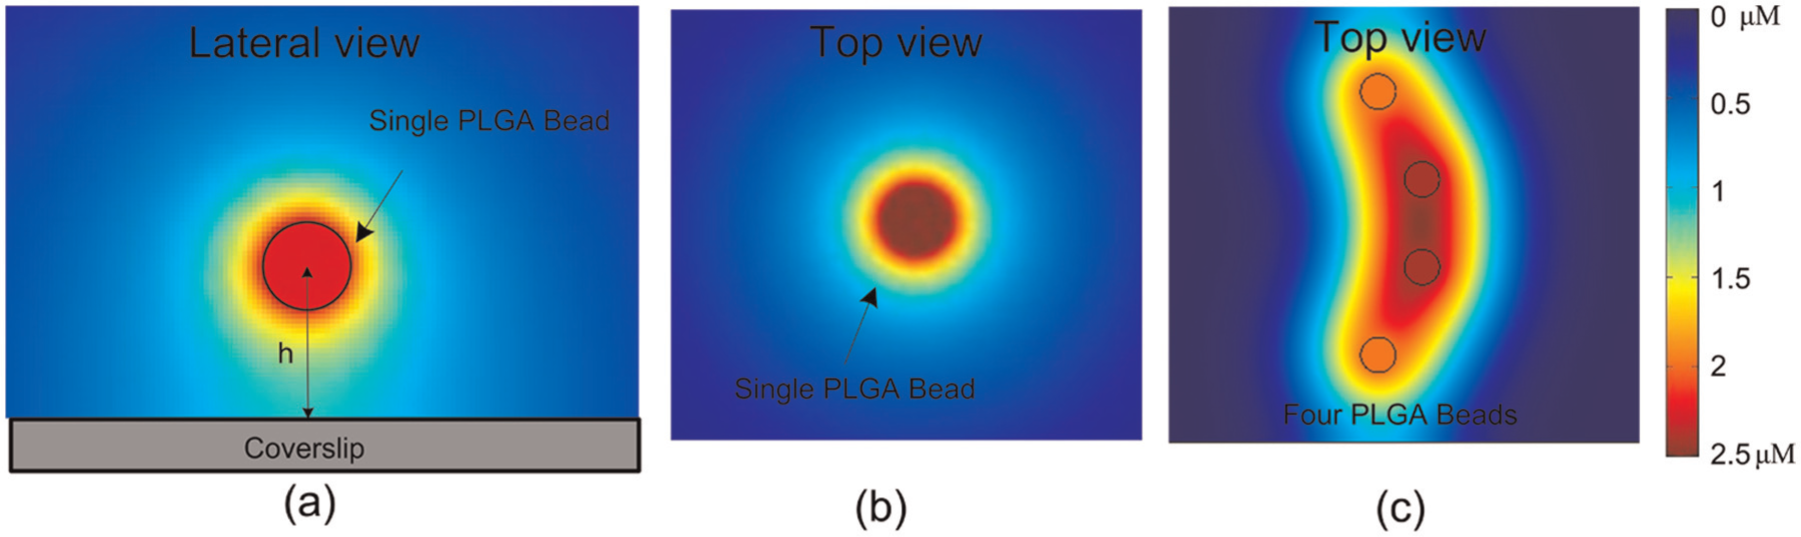
Simulation of chemical gradients.
3.4. Cell migration control
Once the cells were firmly attached to the bottom of the dish, the sample was placed on a microscope stage under 5% CO2 at 37°C, and the PLGA beads were optically trapped and placed in front of the cell at 3–5 µm. Figure 7 illustrates that the Jurkat cell polarized and migrated toward the PLGA bead. The cell polarized and formed a leading edge within 1 min.
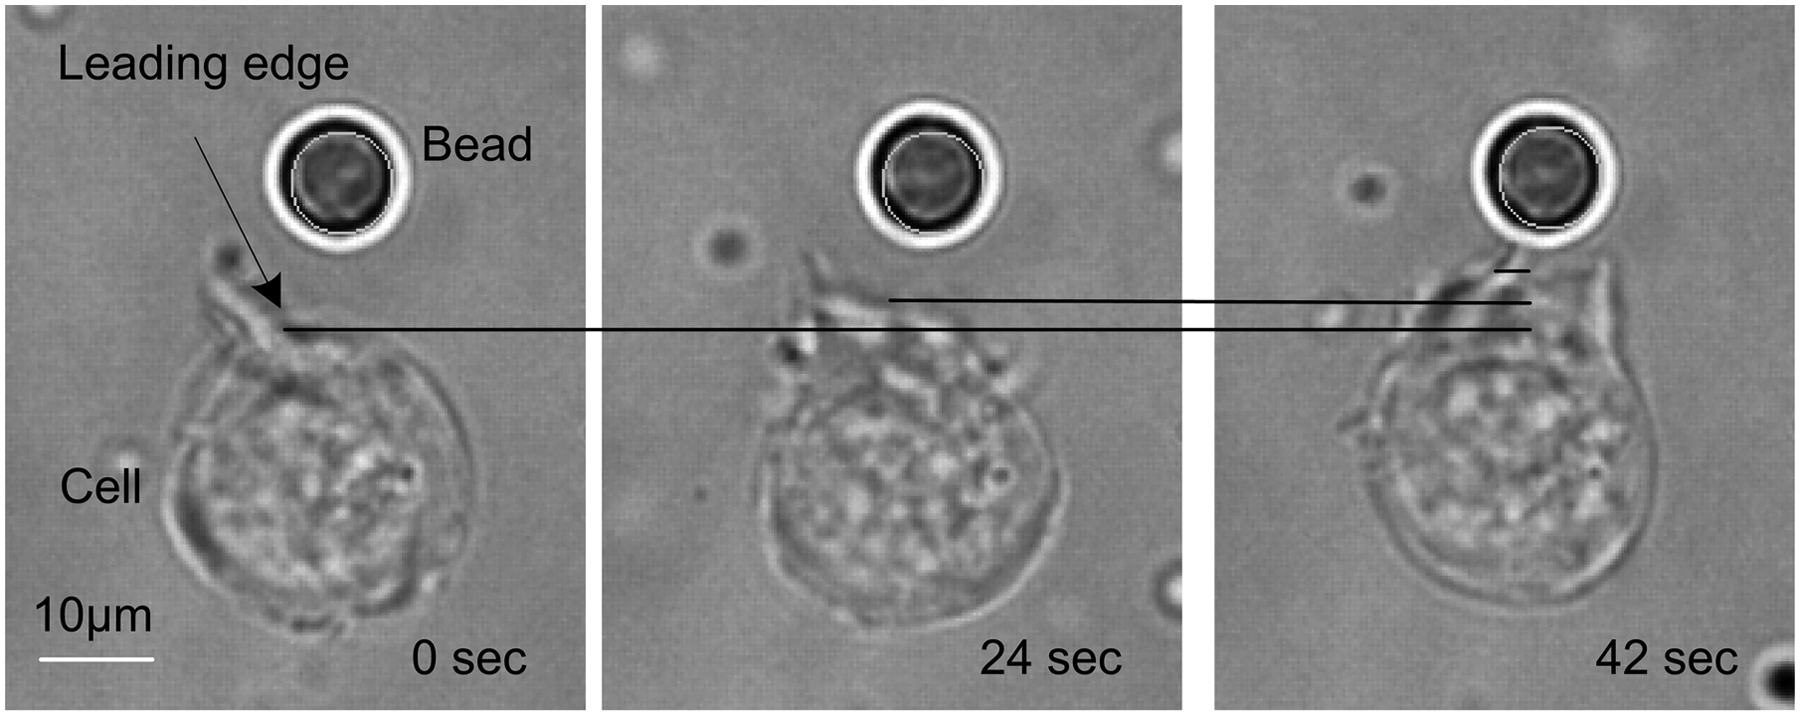
Jurkat cells polarize and migrate toward the SDF1a bead.
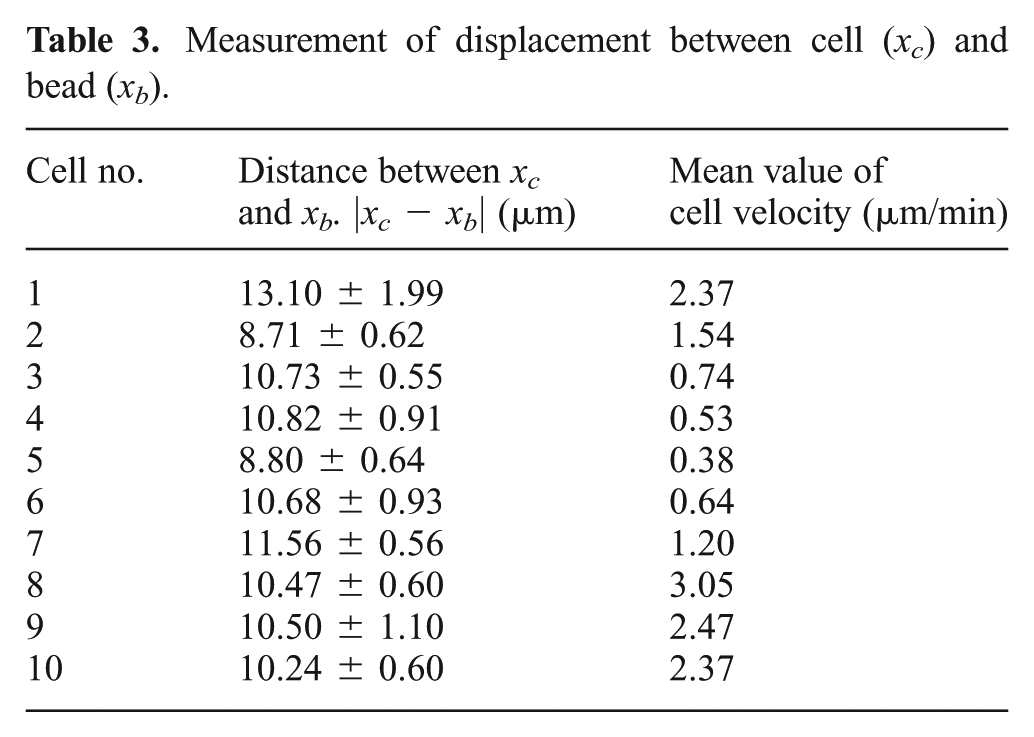
Experiments were performed to verify whether the diffused chemical from the PLGA beads can induce the Jurkat cell to migrate toward the beads. As shown in Figure 8(a), two PLGA beads were trapped by the robotically controlled optical tweezers and consequently moved to a particular destination in a synchronized manner. The use of two beads can help enhance the chemical concentration and better induce cell migration. The cell sensed the chemical gradients and moved toward the beads (see Extension 1). In this way, cell migration can be regulated by controlling the motions of the bead and the distance of the cell with respect to the bead. Through an image processing technique, the cell trajectory toward the chemical stimuli can be examined as shown in Figure 8(b). The cell migration speed and the distance between the cell and the beads can be determined, as shown in Figures 8(c) and (d). With repeated tests, as shown in Table 3, we found that the cell can well follow the motions of the robotically controlled beads, and the fluctuation range of the distance between the cell and the bead can be maintained within 2 µm. We also found that the migration speed of Jurkat cells under the stimulation of SDF1a was ranging from hundreds of nanometers to several microns per minute, as seen in Table 3. Due to variation amongst cells, the cell migration velocities can show large differences between each other.
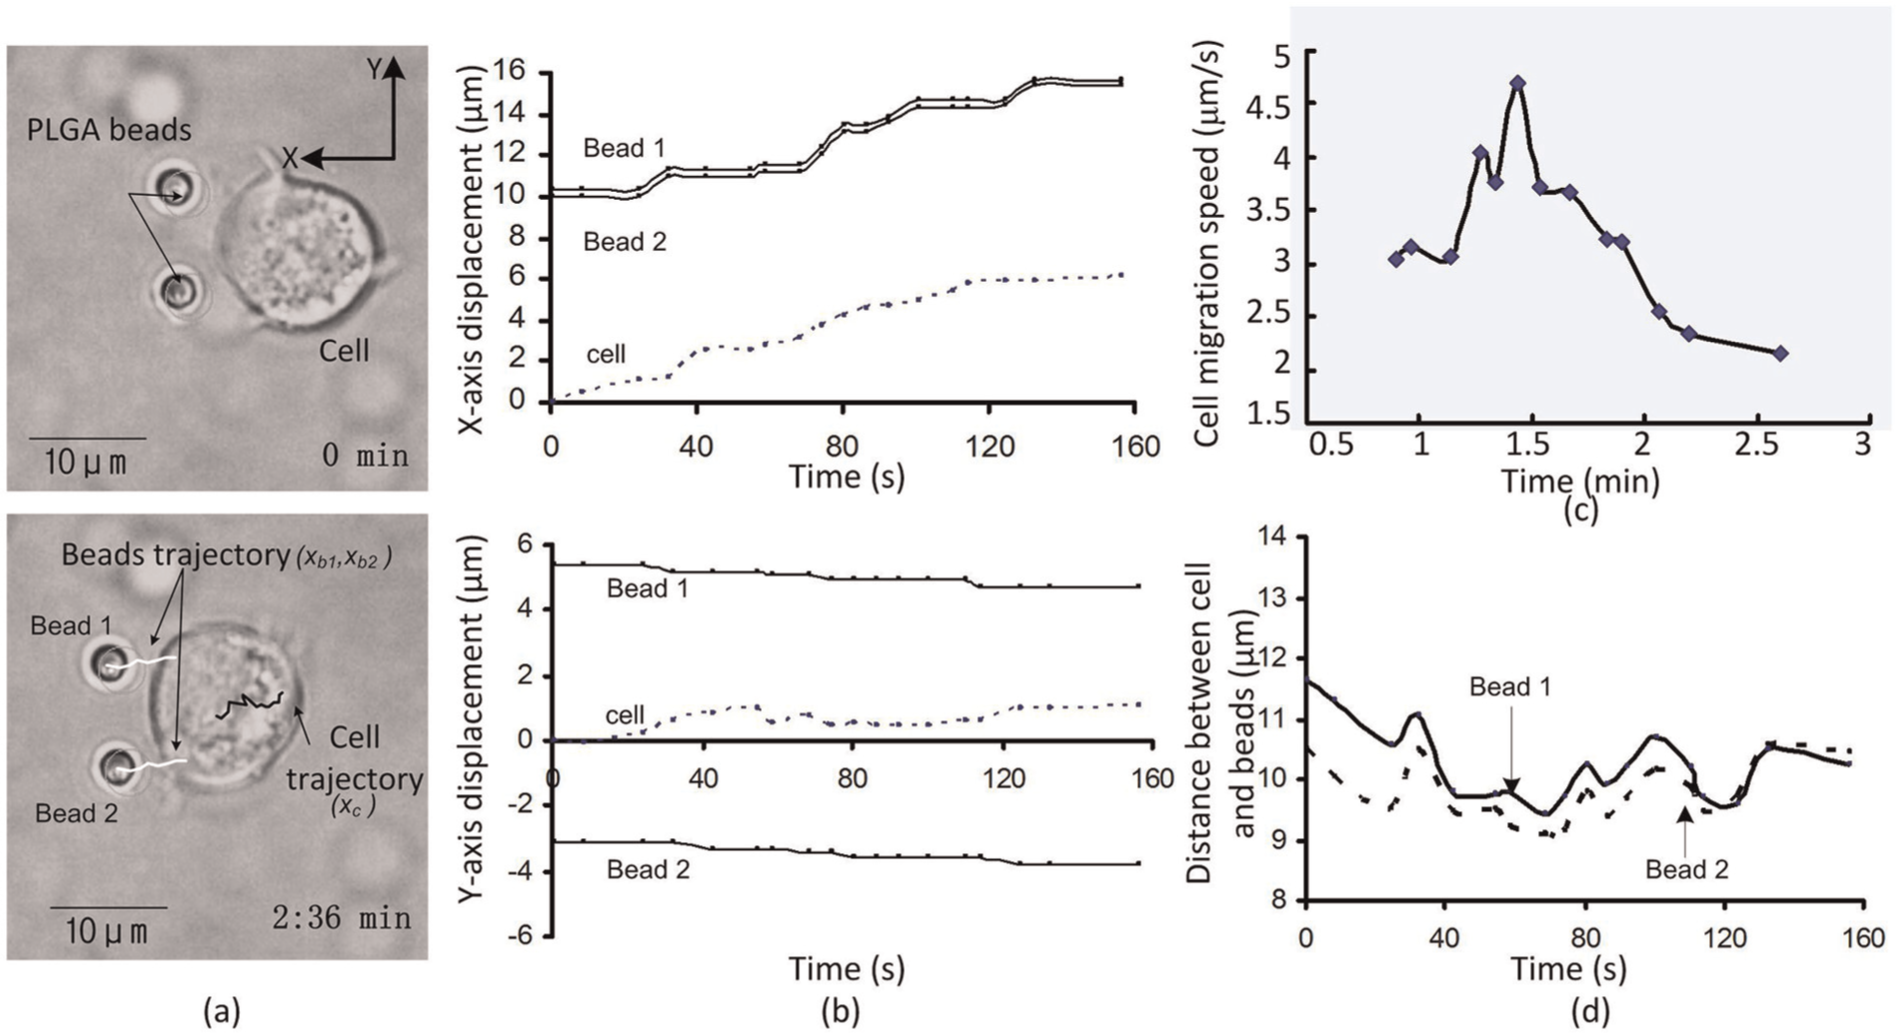
Jurkat cell migrated and followed the motions of the trapped beads.
Measurement of displacement between cell (xc) and bead (xb).
3.5. Measurement of protrusion force
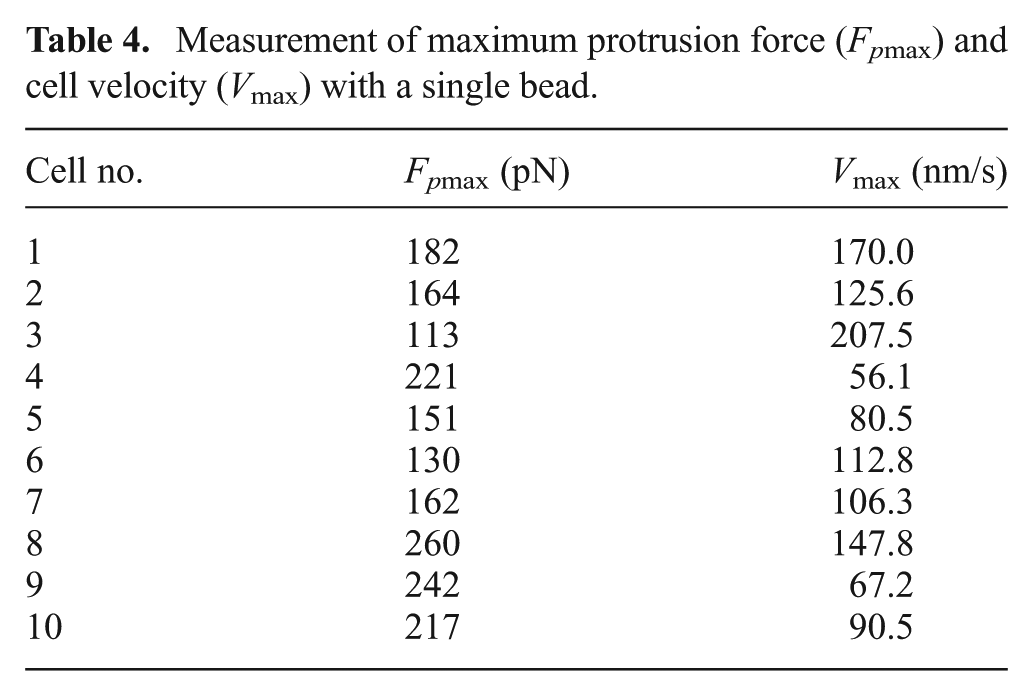
When the position of the optical trap holding the bead was fixed, the cell approached the bead and propelled it to deviate from the trap center. Under this condition, the bead served as a probe to measure the protrusion force at the cell leading edge. Figure 9(a) shows the method by which Fp was determined using a single bead. The cell pushed the bead to move away from the trap center when the cell came in contact with the bead. The offset x increased until the cell finally stopped moving. Figures 9(b) and (c) show the time courses of Fp and the cell velocity (V). Using a time-lapse video recorded during the experiment, we can determine the position of the cell and further calculate V. Table 4 shows the maximum Fp (Fpmax) and V (Vmax) of 10 Jurkat cell samples.
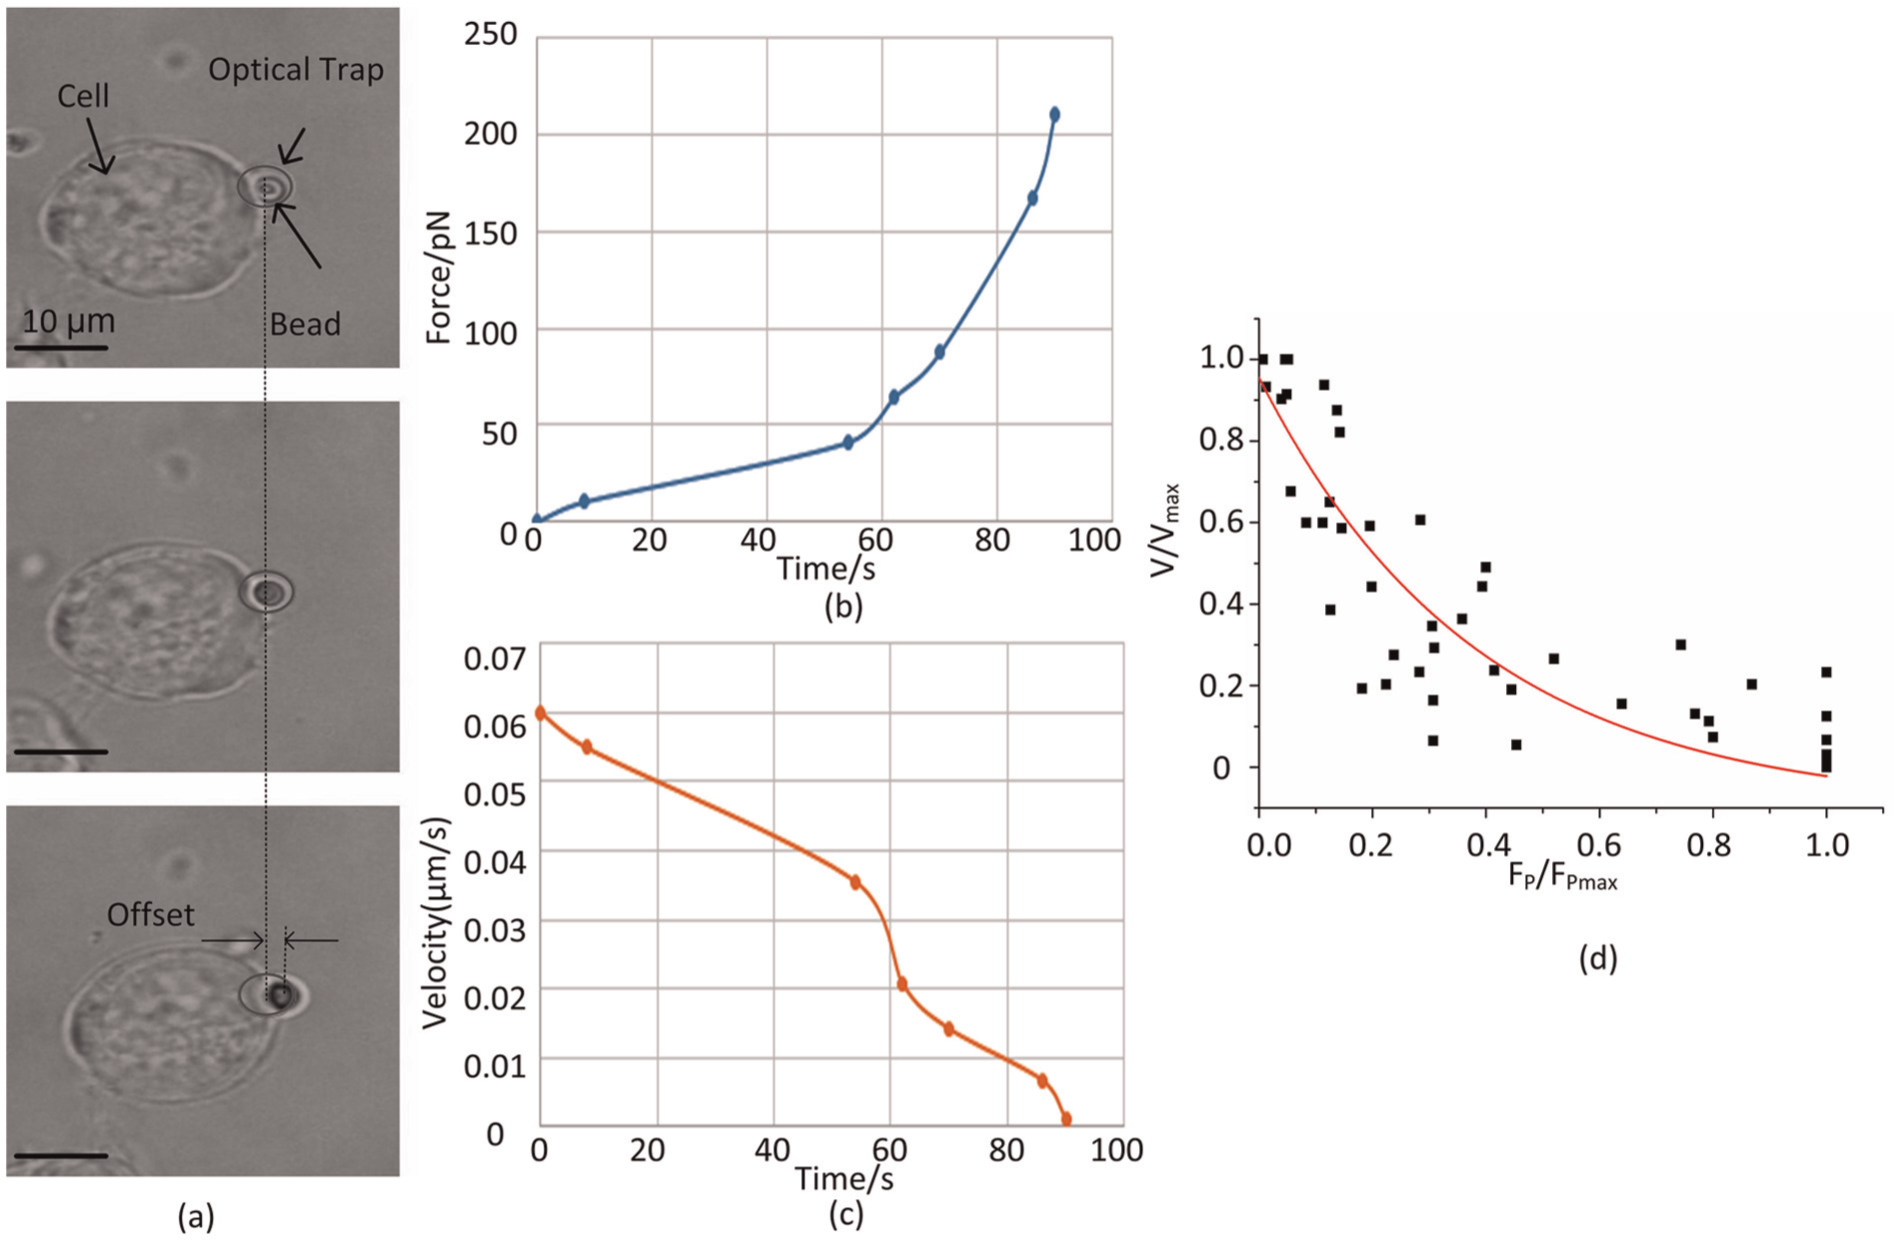
Experimental results: (a) images showing the method by which the protrusion force is calculated; (b) measured protrusion force; (c) measured cell velocity; (d) force–velocity relationship obtained from seven samples.
Measurement of maximum protrusion force (Fpmax) and cell velocity (Vmax) with a single bead.
The force–velocity relationship reveals the mechanism by which a cell sustains V at an external force; this mechanism can be used to probe actin-based cell motility (Parekh et al., 2005; Lee and Liu, 2009). In the proposed method, the bead functioned as an obstacle to block cell migration and exerted a resistance force on the cell (see Extension 2). Such a resistance force is numerically equal to Fp. Figure 9(d) illustrates numerous points of force–velocity pairs based on repeated tests, in which each sample test was repeated six times. The Vmax and Fpmax of each cell sample were used to normalize each result. Amongst some existing models for fitting the force–velocity relationship, such as the convex model (McGrath et al., 2003; Marcy et al., 2004), concave model (Parekh et al, 2005), and elastic model (Mogilner and Oster, 2003), we chose the elastic Brownian ratchet model to obtain the following force–velocity relationship for possible better performance:
where Y = V/Vmax and X = Fp/Fpmax. This equation can be used to draw the force–velocity curve, which is represented by a solid line in Figure 9(d). This solid line, which was obtained by using Equation (7), fitted the actual testing points, indicating that the force–velocity relationship measured in our tests matched the elastic Brownian ratchet model.
3.6. Determination of the protrusion force distribution
We further measured the distribution of Fp around the cell by using multiple beads (see Extension 3). Figure 10 shows the results when we used three and four beads. In Figure 10(b), Fpmax was obtained at the position of bead 1 at 47 s. Fp values at the positions of beads 2 and 3 were significantly smaller than that of bead 1. Figure 10(c) shows the force distribution at t = 47 s, at which the highest magnitude of the force along the cell migration direction was observed. Figures 10(d) and (e) show the case with four beads. Within the first 100 s, the cell did not exert a strong Fp. After 200 s, Fp at the positions of beads 1 and 2 increased significantly. Figure 10(f) shows the force distribution at 200 s, at which Fpmax was observed along the direction of cell migration.
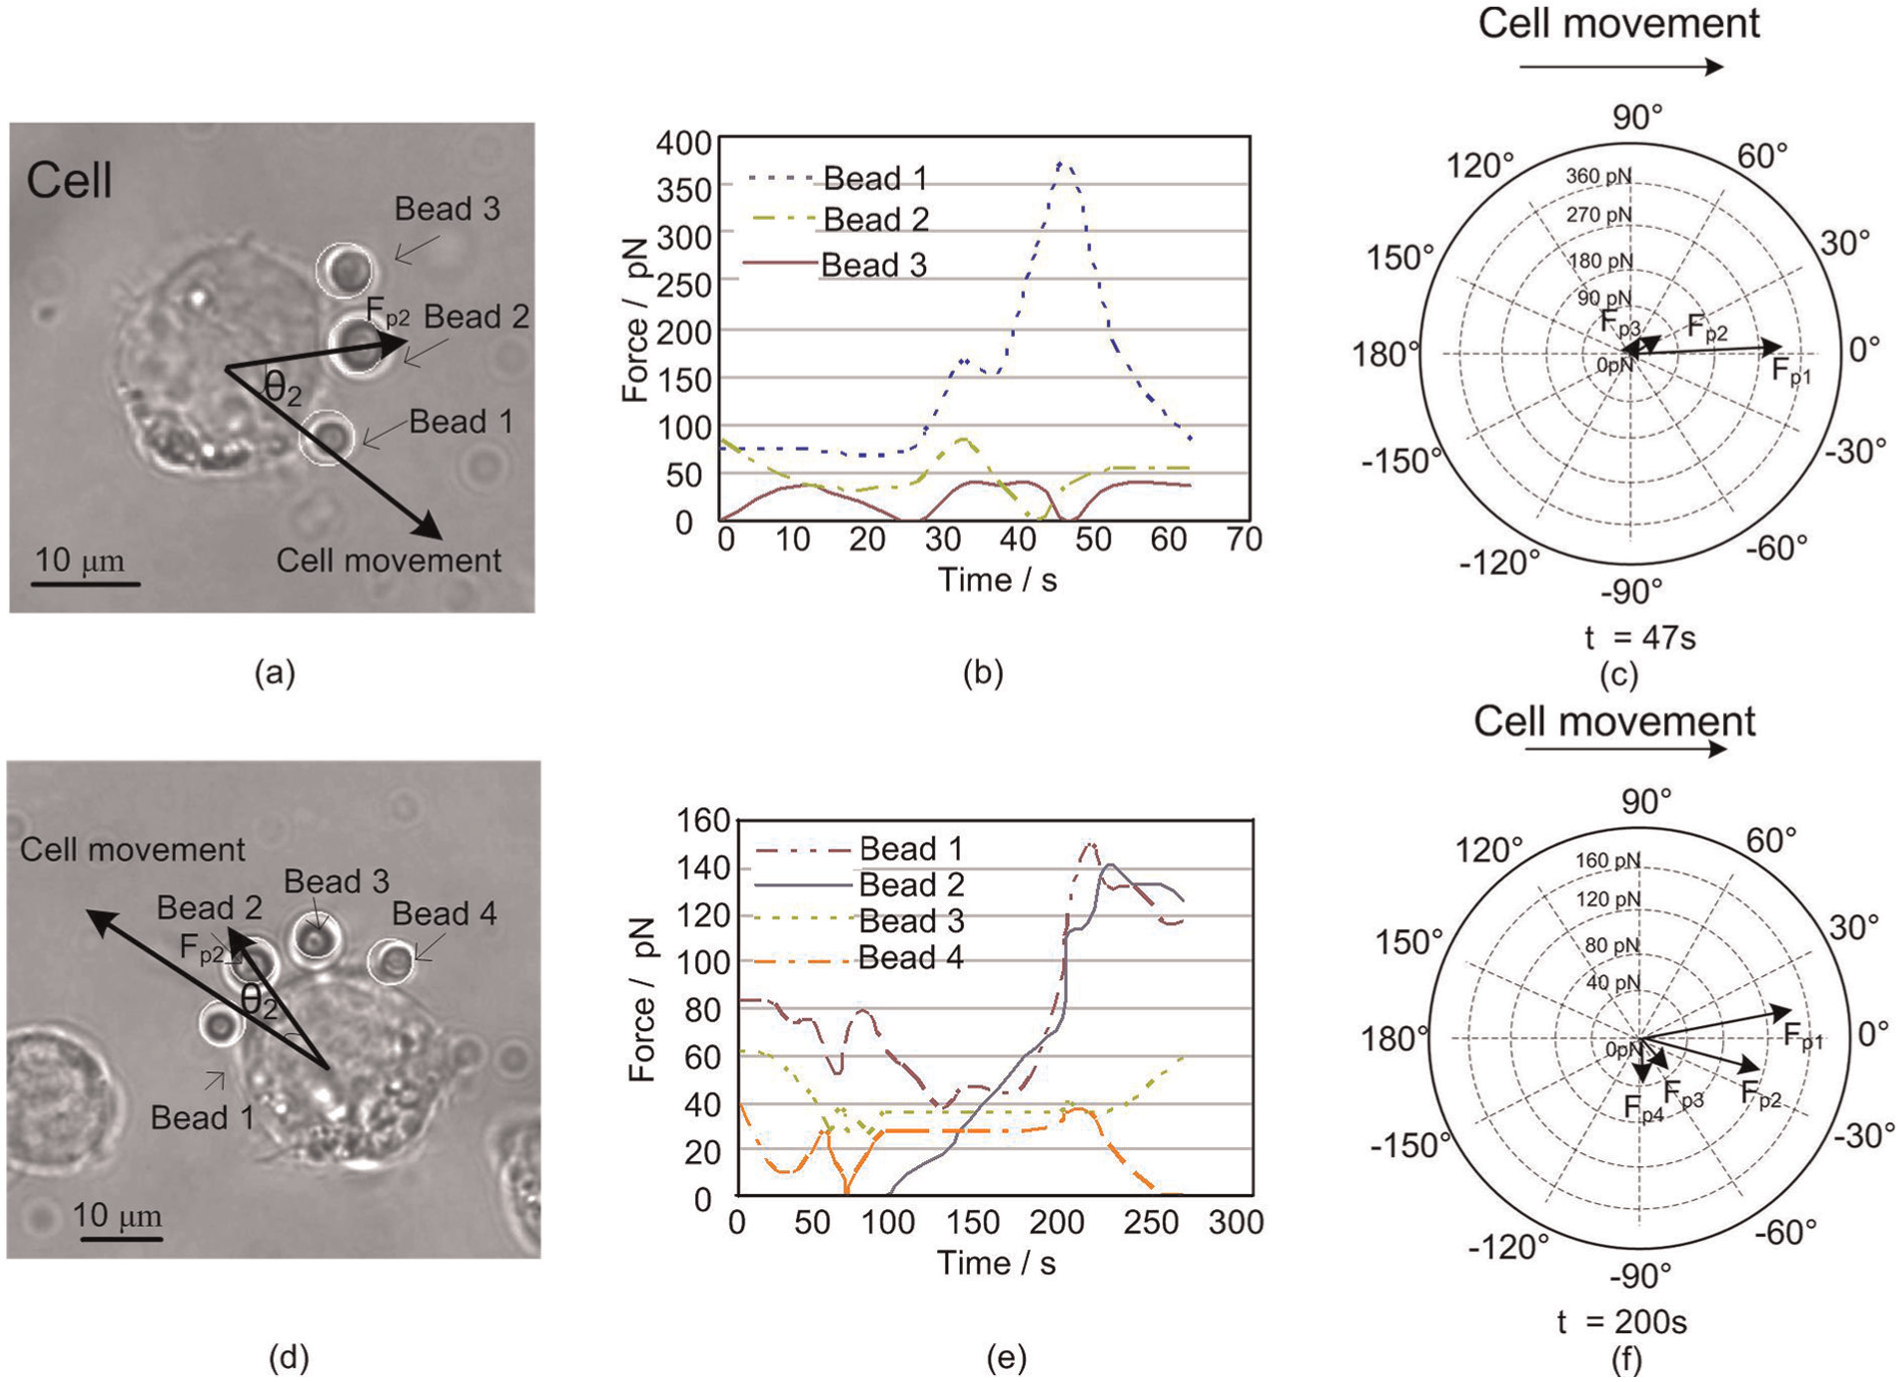
Protrusion force distribution. (a) Sample cell. θ i is the angle between Fpi and the cell movement direction. (b) Protrusion forces at different points of the cell leading edge. (c) Force distribution at t = 47 s, where each force has its angle with respect to the horizontal cell moving direction and its magnitude represented by the length of arrow. (d)–(f) Results of the second sample test.
Repeated tests were performed using more samples to verify this phenomenon. Table 5 shows Vmax and Fpmax of six cell samples measured using three and four beads. Figure 11 shows Fpmax at different positions, reflecting different angles with respect to the direction of cell migration. These results indicated that the Fpmax of the cell was observed along the direction of cell migration. In contrast to existing models used to estimate cell proliferation and migration that are based on the dynamics of cell adhesion and protrusion (Kim and Wirtz, 2013; Kim et al., 2013), we directly tracked the spatial and temporal distribution of Fp and calculated the direction of cell migration.
Measurement of the maximum protrusion force (Fpmax) and the maximum velocity (Vmax) with three and four beads.
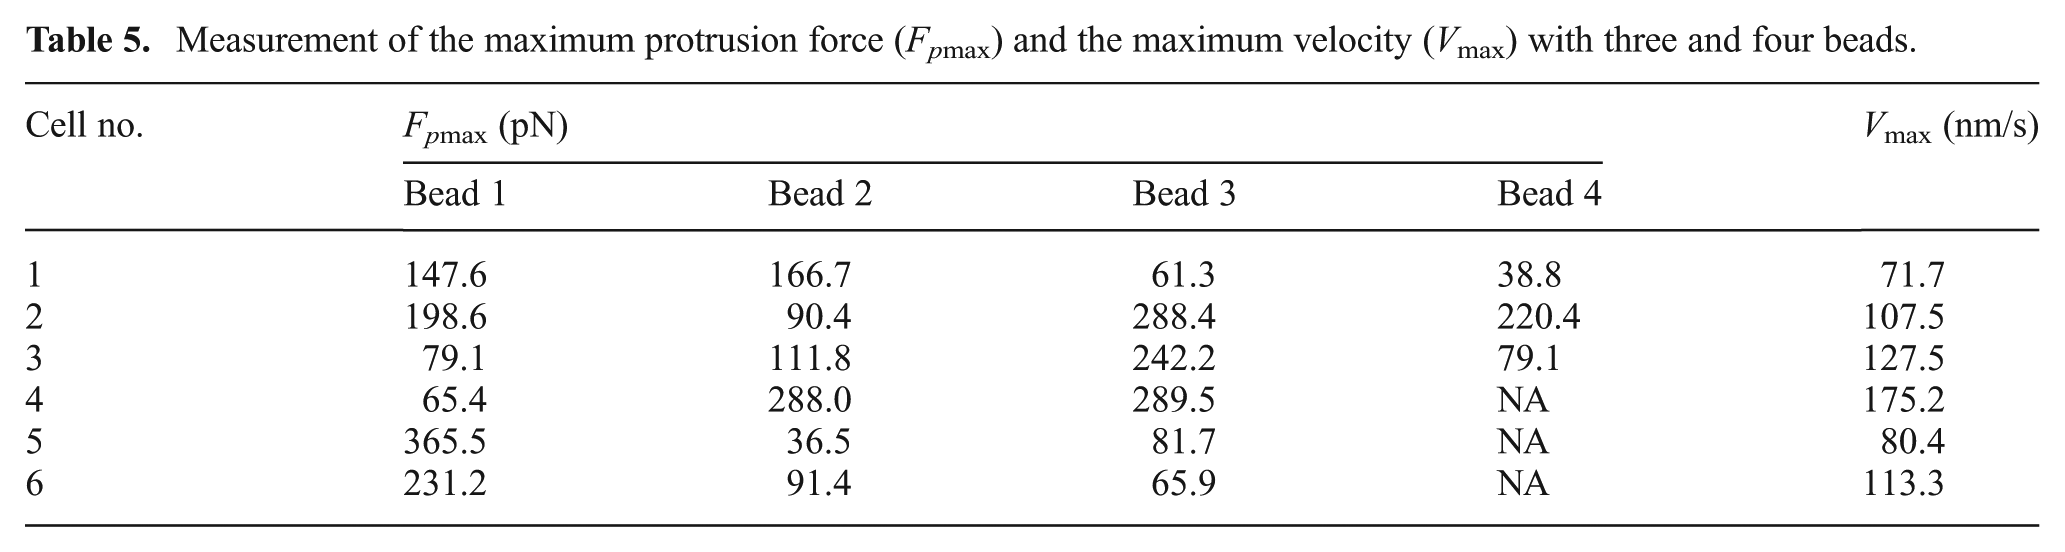
Maximum protrusion forces at different positions with different angles with respect to the direction of cell migration.
4. Conclusion
In this paper, we proposed a novel approach to studying cell migration control under a chemoattractant environment and directly measured cell protrusion force by using a robot-aided cell manipulation system equipped with optical tweezers. The chemoattractant environment was first created to simulate the in vivo condition, where the cell moved toward the stimuli. The PLGA beads were fabricated to contain specific chemicals, forming a certain chemical gradient to induce cell polarization and migration. Secondly, a new method that can quantitatively measure the protrusion force of the cell was developed, which was followed by experiments performed on migrating leukemia cancer Jurkat cells. The test results indicated that the protrusion force of a live cell to a chemoattractant was within the range of hundreds of piconewtons. We further probed the protrusion force distribution at the cell leading edge, which can enable the prediction of cell migration direction. Although the report was mainly based on leukemia cancer Jurkat cells, the generated research outcomes will also serve as important references for the migration of other cells. The research outcome will help us understand the force–velocity relationship and the influence of protrusion force on cell migration, thus benefiting future research on the proactive control of cell movement.
Footnotes
Appendix: Index to Multimedia Extensions
Archives of IJRR multimedia extensions published prior to 2014 can be found at http://www.ijrr.org, after 2014 all videos are available on the IJRR YouTube channel at http://www.youtube.com/user/ijrrmultimedia
Manipulation of PLGA beads to induce cell migration
Measurement of protrusion force field with single bead
Measurement of protrusion force field with multiple beads
Acknowledgements
We would like to thank Professor Anskar YH Leung of the Department of Medicine, The University of Hong Kong, for valuable suggestions and for providing the leukemia cells used in the experimental studies.
Authors’ note
The first two authors contributed equally to this paper.
Funding
This study was supported by the Research Grants Council of the Hong Kong Special Administrative Region, China (Reference No. CityU9/CRF/13G and City U 119612).