






Abstract
Accurate and robust localization is a fundamental requirement for service and inspection robots, particularly in feature-sparse indoor environments where traditional systems struggle due to a lack of distinct landmarks. While prior maps can enhance robustness, precise and compact maps capturing real-world details are often unavailable for new or frequently changing environments. This paper presents BIM-Loc, a novel discrepancy-aware LiDAR-based localization method that directly integrates Building Information Models (BIM) from the design phase. BIM-Loc simultaneously estimates trajectories aligned with the BIM coordinate system and identifies discrepancies between real-world observations and the as-designed BIM in an online fashion. Our core contributions include: (1) a novel multi-hit ray casting strategy for efficient BIM-point data association and projection of 3D observations into 2D texture space; (2) a pose graph optimization framework with BIM-integrated factors that enforces consistency among odometry, sequential scans, and BIM structures; and (3) a hierarchical Bayesian inference module that incrementally updates a continuous 2D surface representation for discrepancy detection, propagating updates from the pixel to the structure level. Extensive evaluations in both simulation and real-world applications demonstrate that BIM-Loc significantly outperforms state-of-the-art map-based methods in localization accuracy and robustness. More experimental results are available at our project website: https://bim-loc.github.io/bim-loc.
Keywords
1. Introduction
Accurate localization is crucial for applications in extreme environment exploration, remote sensing, and service robotics (Cadena et al., 2016; Chen et al., 2025; Ebadi et al., 2024; Yarovoi and Cho, 2024). For robots acting as service providers or inspectors in indoor settings, robust localization is essential throughout a building’s life cycle, from construction sites to completed structures. However, ensuring stable localization for inspection and service tasks presents significant challenges. Indoor environments often exhibit repetitive, human-designed geometric configurations that lack sufficient distinctive features for robust localization under varying conditions. Furthermore, unlike outdoor scenarios where GNSS provides a stable global reference (Wang et al., 2022), GNSS-denied indoor environments lack equivalent signals to correct the accumulated drift errors inherent in long-term navigation.
To enhance indoor localization robustness, one common approach uses global place descriptors (Yin et al., 2024) to construct loop closures. Coupled with pose-graph optimization (Grisetti et al., 2010; Koide et al., 2024b) or bundle adjustment (Liu et al., 2023a, 2023b; Li et al., 2024a), these methods can reduce drift within closed loops. However, they require active loop-closure detection and are ineffective in one-way scenarios like long corridors or tunnels. Another line of research leverages map priors, with the specific approach varying by sensor modality. For example, radio-frequency-based sensors (e.g., WIFI, BLE, RFID) can create reference sensor network maps (Roohi and Fekr, 2025). While robust, these methods require pre-deployed anchor sensors and typically offer insufficient accuracy for precise robotic inspection in dynamic environments.
Topological and structural metric maps have also been extensively investigated. Recent studies utilize point-cloud-based maps (Hu et al., 2024; Koide et al., 2024a) to bound localization errors. However, raw point clouds are not scalable for large buildings. Within the Architecture, Engineering, and Construction (AEC) industry, 2D floor plans (Gao and Kneip, 2022; Li et al., 2024b; Xie and Schwertfeger, 2023) and 3D BIM models (Torres et al., 2023) are used throughout the building life cycle. Unlike raw point clouds, the high-level semantic and geometric abstractions in BIM and floor plans significantly reduce memory consumption, making them ideal for edge computing devices. While 2D floor plan localization requires additional height estimation, BIM’s comprehensive 3D descriptions naturally support 3D localization in multi-floor buildings. A critical challenge, however, is that BIM models are typically “as-designed” and do not reflect the actual, often divergent, state of construction sites or renovated buildings. This BIM-reality discrepancy severely hinders BIM integration for localization, a problem that remains an open research question explored by only few researchers.
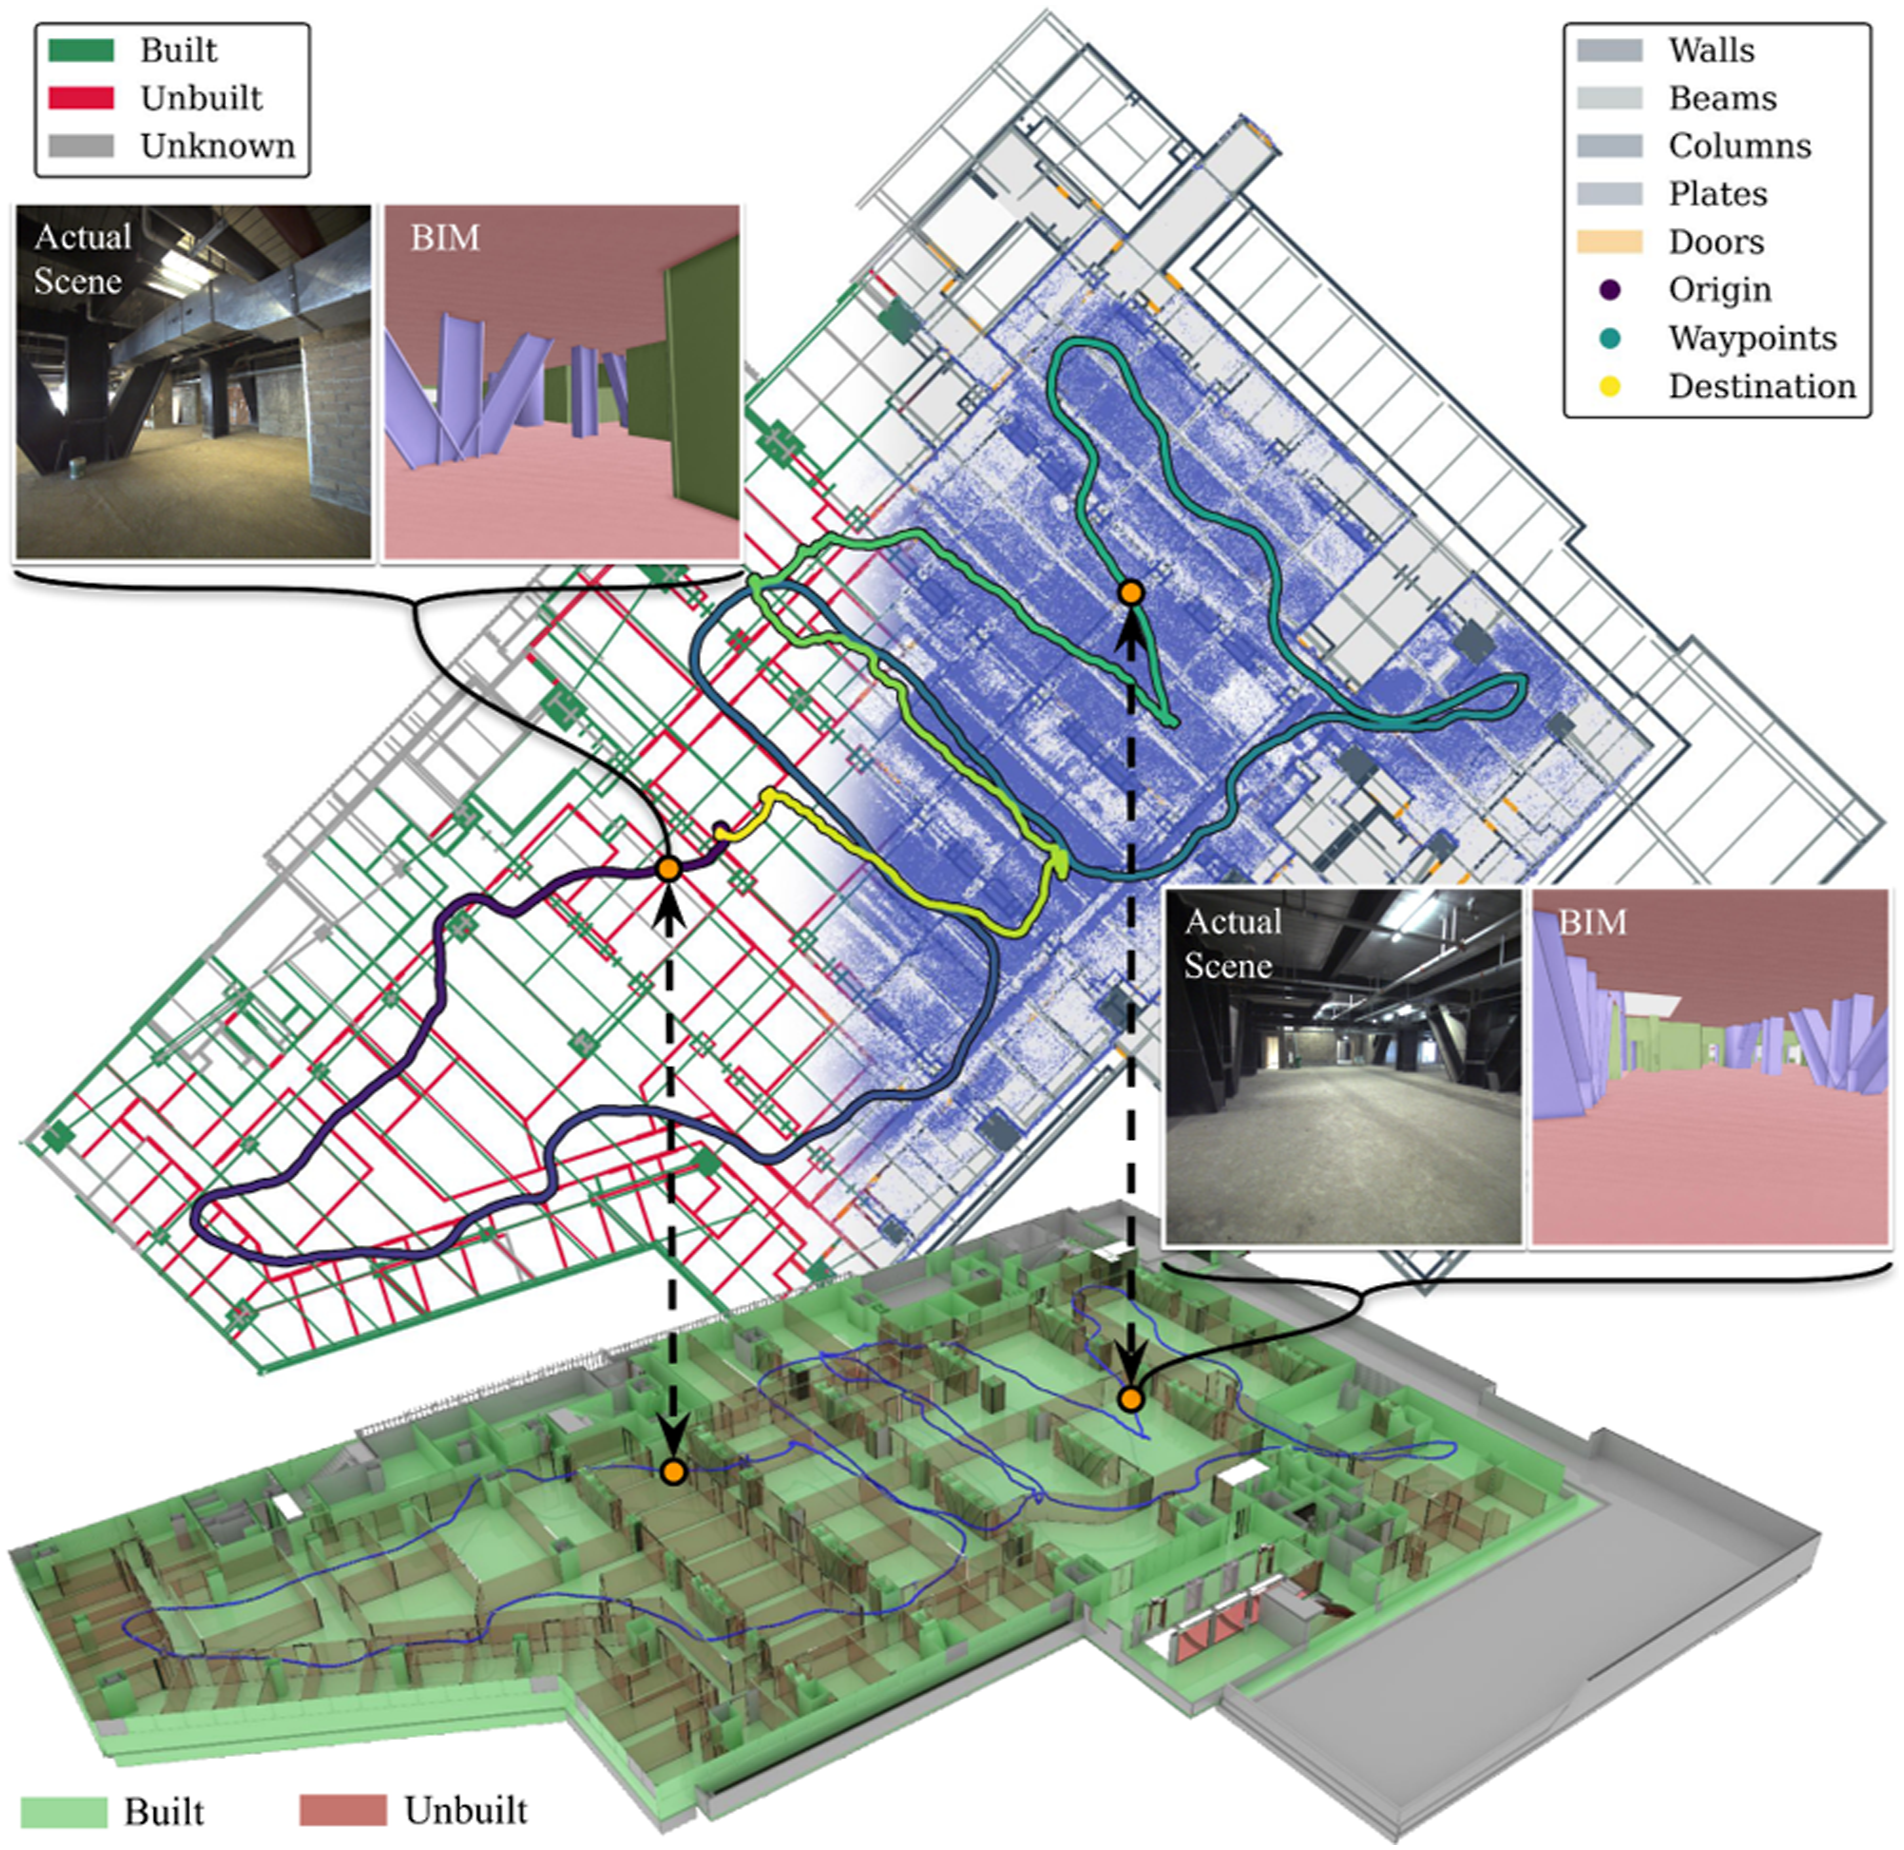
Driven by these challenges and the advantages of BIM, this paper proposes BIM-Loc, a BIM-integrated, discrepancy-aware method for robust 3D LiDAR-based indoor localization. BIM-Loc effectively bounds accumulated drift even under significant discrepancies between the BIM model and the real world. Instead of relying on point-based maps, it uses only the as-designed BIM. We reformulate the map-discrepancy-affected localization problem into two coupled subproblems: BIM-aided trajectory optimization and hierarchical discrepancy detection. A novel multi-hit ray casting strategy enables efficient ray-BIM association for deep BIM integration. By iteratively solving these subproblems, BIM-Loc simultaneously estimates a BIM-aligned trajectory and identifies the current BIM status online. The visualization of BIM-Loc’s outputs are illustrated in Figure 1. Our core contributions are: • A novel multi-hit ray-casting module that establishes data association for both local surface sampling and texture-space mapping, underpinning trajectory optimization and discrepancy detection. • A BIM-aided trajectory optimization module that ensures consistency between the BIM and real-world coordinate systems through a pose graph framework with custom factors. • An online BIM status update module for discrepancy detection. Using sparse scan data, it employs Bayesian kernelized inference to incrementally update a 2D texture-space representation of discrepancies, which are then propagated to the structure level via a hierarchical Bayesian network. • Extensive validation on a custom BIM-robot simulation platform and real-world datasets from both construction sites and building interiors, demonstrating superior performance over state-of-the-art methods. Visualization of BIM-Loc’s outputs. The right panel displays blue reconstructed points aligned with a projected 2D BIM model. The left panel and bottom 3D meshes show the discrepancy map generated from localization. Two snapshots demonstrate localization performance by comparing actual scenes with corresponding BIM rendering.
The remainder of this paper is structured as follows: Section 2 reviews related work on SLAM optimization, map-aided localization, and AEC applications. Section 3 details the BIM-Loc framework. Section 4 presents experimental results. Section 5 discusses the design and advantages of our approach, and Section 6 outlines limitations and future work.
2. Related work
2.1. LiDAR localization and mapping
LiDAR-based SLAM provides centimeter-level localization for autonomous vehicles and UAVs, a capability critical in GNSS-denied indoor environments. Typically, LiDAR SLAM systems comprise a front-end for odometry (via scan matching) and a back-end for map optimization that enforces consistency among scans (Cadena et al., 2016; Ebadi et al., 2024).
For robust scan matching, various geometric features are used within the Iterative Closest Point (ICP) paradigm. For example, KISS-ICP (Vizzo et al., 2023) uses point-to-point ICP with adaptive thresholds, while other works employ point-to-plane metrics (Ferrari et al., 2024) or combine them via covariance matrices (Koide et al., 2021). Feature-based methods like LOAM (Zhang and Singh, 2014) and Lego-LOAM (Shan and Englot, 2018) extract corner and planar features for improved performance. FAST-LIO2 (Xu et al., 2022) enables direct plane matching using an iKd-Tree for efficient search. NV-LIOM (Chung and Kim, 2024) incorporates surface normal vectors for better indoor performance. BIM-Loc is agnostic to the front-end odometry, allowing it to seamlessly integrate with various algorithms to bound their drift.
For consistency-oriented map optimization, Pose-Graph Optimization (PGO) and Bundle Adjustment (BA) are standard techniques. Factor graphs are widely used in PGO; for instance, LIO-SAM (Shan et al., 2020) formulates LiDAR-inertial odometry within a factor graph using GTSAM (Dellaert and Contributors, 2022). For multi-session SLAM, LAT-OM (Zou et al., 2024) uses STD (Yuan et al., 2023) loop detection for long-term mapping. In contrast, BA achieves finer feature-level consistency. Works like Zhou et al. (2021) and Liu et al. (2023b) proposed global plane adjustment to refine plane parameters and keyframe poses jointly, later extended to lines, cylinders, and curves (Li et al., 2024a; Zhou et al., 2022). The hierarchical framework HBA (Liu et al., 2023a) balances real-time performance and precision in large-scale tasks by combining the idea of PGO and BA. Following this paradigm, BIM-Loc designs novel graph factors to tightly integrate as-designed BIM models into a PGO framework, enforcing both inter-scan and scan-BIM consistency constraints from the front-end odometry.
2.2. Indoor localization with map priors
Prior maps serve as a reliable reference in localization. While high-definition maps with GNSS are well-established in autonomous driving, various map types are used indoors due to the absence of satellite signals. Schematic floor plans are a common choice for indoor localization. Wang et al. (2019) proposed a factor graph-based global localization method that utilizes wall intersections as features, incorporating robust data association through pairwise measurement consistency checks and a max-mixtures error model. FP-Loc (Gao and Kneip, 2022) uses a custom nearest-neighbor search for efficient wall and column lookup from floor plans, while AG-Loc (Xie and Schwertfeger, 2023) leverages area graphs extracted from floor plans for lifelong localization given a broad initial pose estimate. Compared to schematic floor plans, prior maps reconstructed from recorded point clouds provide more direct geometric information for map-based localization. 2D grid maps have been utilized for global localization and trajectory refinement (Hess et al., 2016). More recently, research has increasingly focused on pre-built 3D point cloud maps that offer rich geometric constraints for 6-DoF localization. For instance, Koide et al. (2024a) use reconstructed point clouds as reference maps for a range-inertial localization with a sliding-window factor graph. PALoc (Hu et al., 2024) utilizes point-cloud-based prior maps to generate ground-truth-level trajectories with uncertainty estimation in degraded indoor environments. Other works use representations like normal distributions (Einhorn and Gross, 2015) or meshes (Dreher et al., 2021; Mock et al., 2024) to reduce memory footprint of the prior maps.
In the AEC industry, several works have been proposed to integrate BIM into localization. Torres et al. (2023) project BIM into 2D occupancy grid maps for particle-filter-based robust localization. An extension, BIM-SLAM (Vega-Torres et al., 2024), supports multi-session tasks by exploiting loop detection, pose-graph optimization, and change detection. LIO-BIM (Stührenberg and Smarsly, 2025) couples LiDAR-inertial odometry with BIM through dual scan-to-BIM matching. The BIM/IFC files are processed to generate plain and corner features from point clouds. Another approach converts BIM into semantic-enhanced point clouds to keep both geometric and semantic information so that a coarse-to-fine semantic localization can align laser points to the map via ICP (Yin et al., 2023). While these works demonstrate feasibility of BIM-aided SLAM, they do not fully and directly integrate BIM into the SLAM framework. Instead, they rely on points sampled from BIM surfaces, which incurs significant memory overhead that hinders deployment on resource-constrained devices. More importantly, these methods largely overlook the substantial BIM-reality discrepancies prevalent in construction and renovation scenarios, limiting their practical applicability in real-world settings where design models diverge from as-built conditions. Recent efforts address such discrepancies through either continuous deviation estimation (Shaheer et al., 2025), which excels in structured environments via global graph matching and hierarchical semantic scene graphs, or probabilistic dynamic object removal (Jia et al., 2025).
2.3. Discrepancy-aware mapping
Identifying and managing discrepancies in sensor measurements across multiple sessions has been widely investigated. While several studies provide multi-modal datasets for change detection (Lambert and Hays, 2021; Park et al., 2021), applying these techniques to robot localization remains challenging. The primary sources of discrepancies include dynamic objects and environmental changes. To distinguish dynamic objects from static backgrounds, a popular solution is employing set difference operations through map-to-map complement extraction (Wellhausen et al., 2017). Visibility-based approaches prove more robust against localization errors. For example, Removert (Kim and Kim, 2020) uses multi-scale range images to reconstruct static maps. Extending this to multi-session mapping, LT-mapper (Kim and Kim, 2022) provides a modular framework for dynamic change detection and multi-layer map management without requiring perfect initial alignment. For highly dynamic environments, DynamicFilter (Fan et al., 2022) combines visibility-based and map-based approaches for dynamic object removal, with subsequent extensions enabling long-range open-world navigation in fully dynamic settings (Fan et al., 2025).
Recent research has also addressed map comparison challenges. Holoch et al. (2022) proposed creating, comparing, and merging new maps upon re-localization to handle lifelong localization failures in dynamic environments, by detecting invalid merges caused by perceptual aliasing. Rozsa et al. (2020) introduced a feature-based, comparison-free change detection method for SLAM maps that uses ICP-like frame matching and pose graph optimization to identify alterations through residual analysis. For dynamic environment modeling, Nobre et al. (2018) enhanced traditional sparse maps by incorporating feature persistence and spatio-temporal correlations. This probabilistic framework captures relationships between nearby features to compute joint posteriors over feature persistence, improving online data association for localization.
Recent work on self-updating HD maps demonstrates the limitations of binary discrepancy detection, modeling changes instead as atomic operations, such as geometry edits (e.g., boundary vertex shifts) and marking edits, rather than simple existence checks (Wild et al., 2025). In the AEC industry, discrepancy checking is essential for construction progress monitoring (Huang et al., 2022; Meyer et al., 2022; Zhang et al., 2025). Existing methods for verifying discrepancies between BIM models and real scenes typically rely on dense 3D point clouds and spatial voxelization. For instance, Meyer et al. (2022) model laser range impacts on spatial occupancy using belief functions, while Huang et al. (2022) extend this framework by integrating semantic information with UAV-acquired photogrammetric point clouds. In contrast, our BIM-Loc method introduces a novel ray-casting strategy that performs discrepancy detection directly in surface texture space, which significantly reduces memory overhead compared to point cloud or 3D voxel representations.
3. Methodology
3.1. Problem formulation
For a sensor suite containing a LiDAR sensor and an Inertial Measurement Unit (IMU), we define a sensor frame whose pose is iteratively estimated by front-end odometry. The sensor’s pose at time step k is denoted as
As map priors, we use as-designed Building Information Modeling (BIM) models
This paper tackles the challenge of localization when map discrepancies exist. Our approach simultaneously estimates the motion trajectory


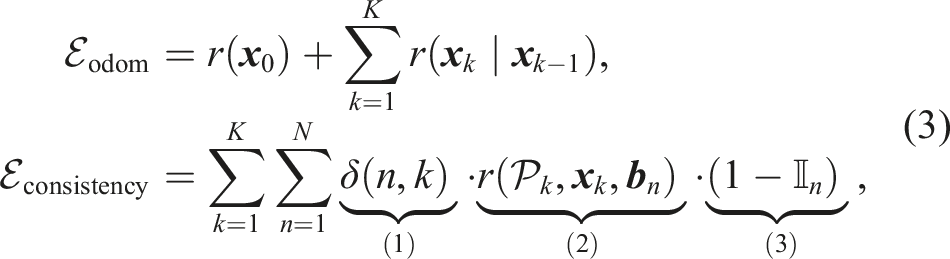
Maximizing this likelihood is equivalent to minimizing the residual error
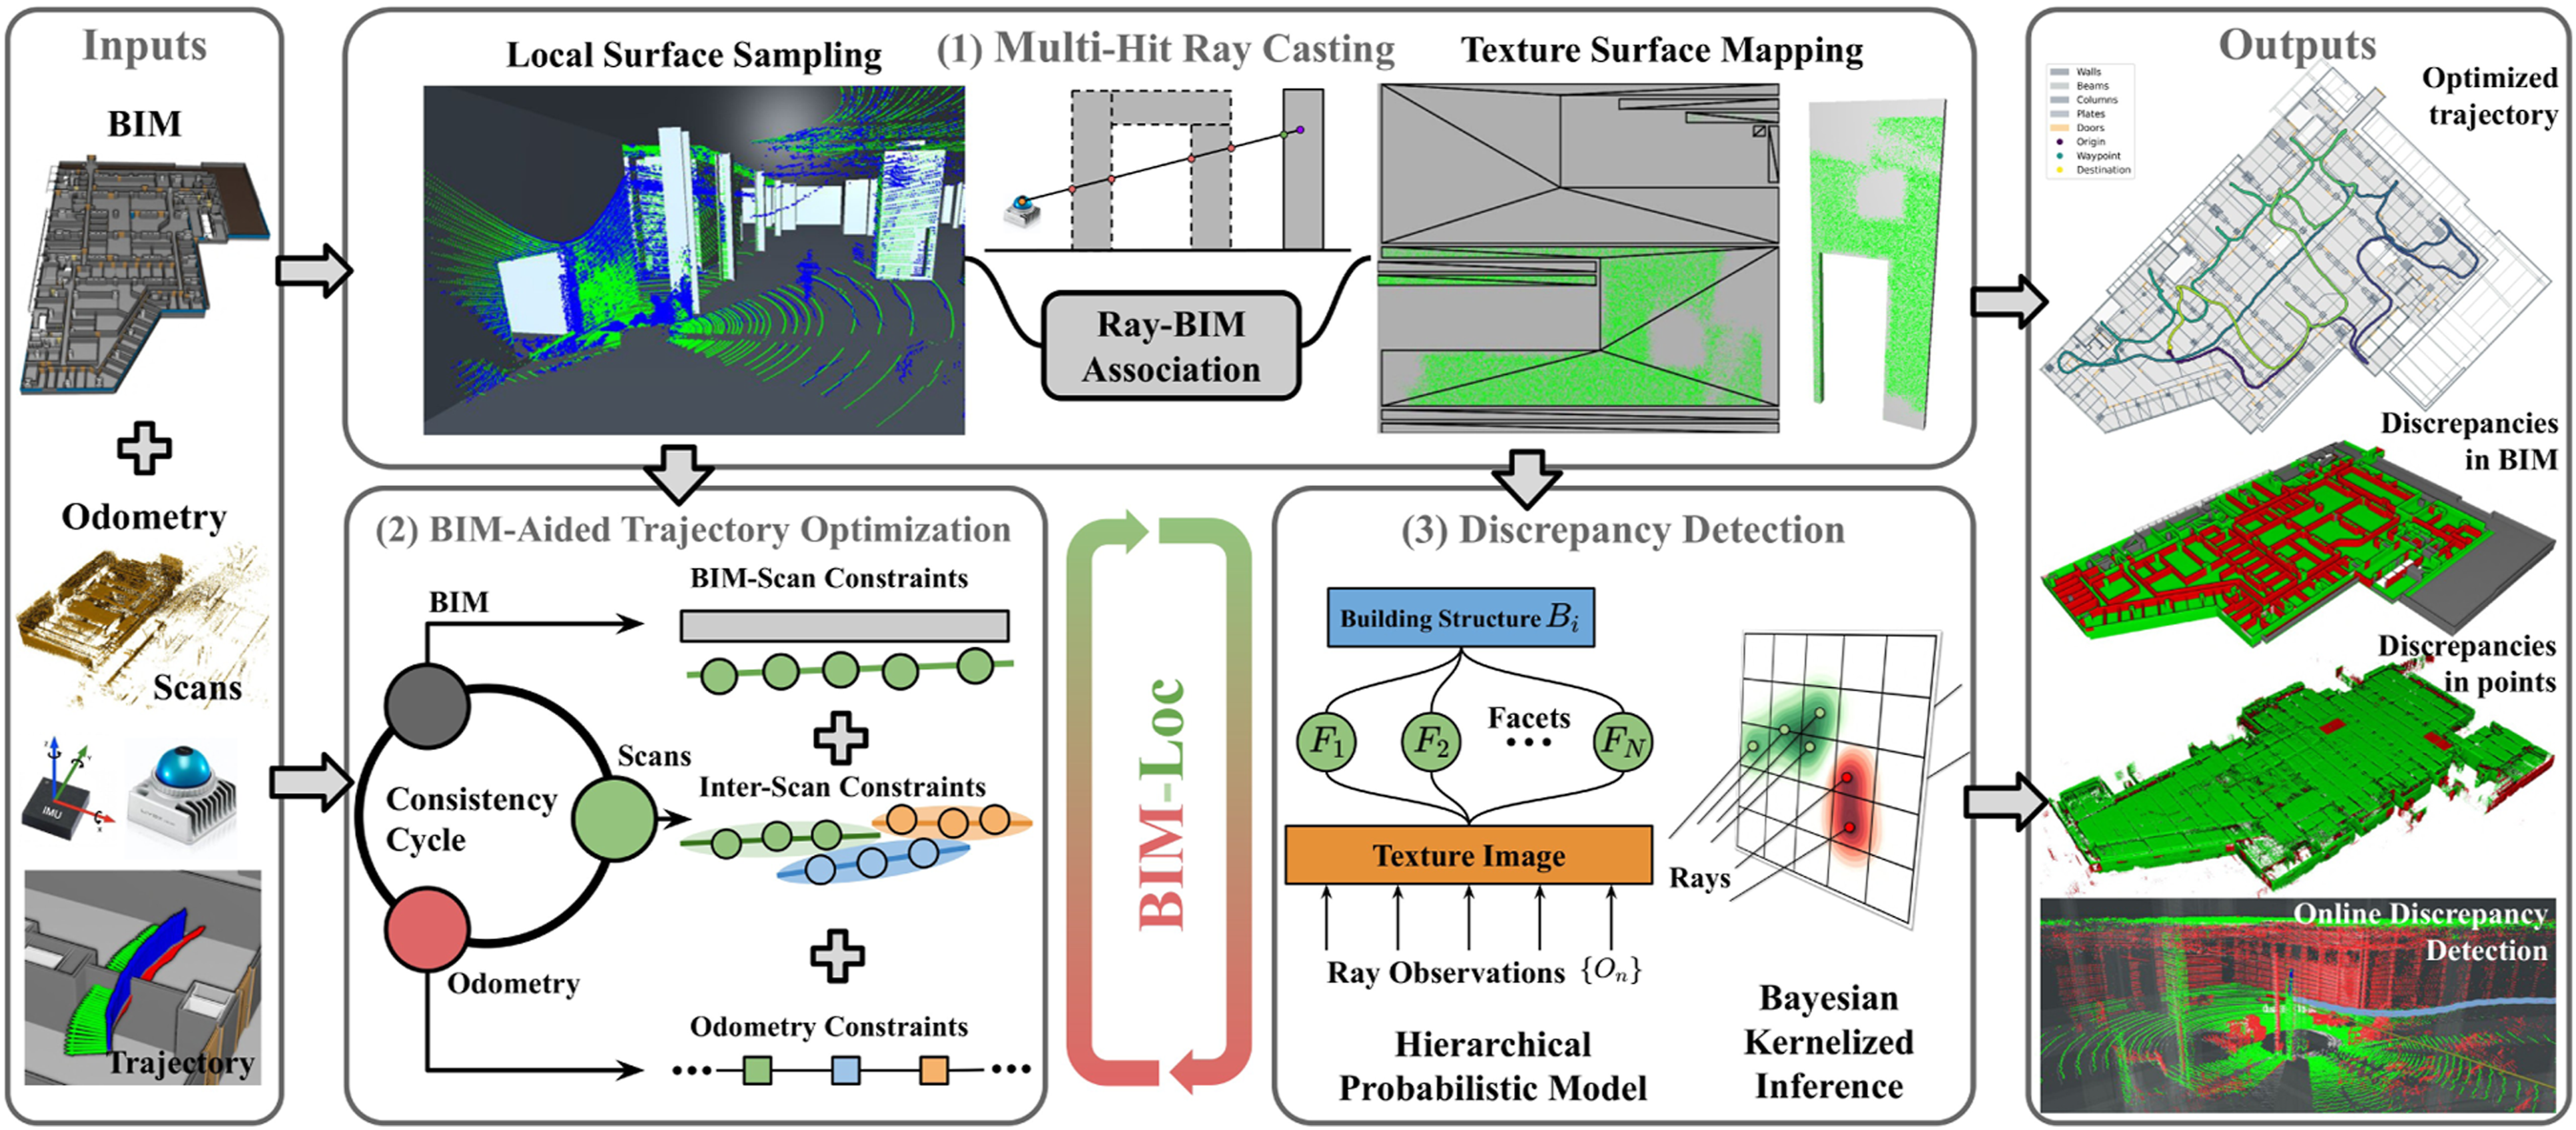
Framework of the proposed BIM-Loc method. The system processes as-designed BIM models and front-end odometry measurements through three core modules: (1) multi-hit ray casting for BIM-observation association, (2) BIM-aided trajectory optimization, and (3) BIM-observation discrepancy detection. Using an iterative strategy, the method outputs an optimized trajectory and discrepancy maps, relying solely on design-phase BIM models.
3.2. Multi-hit ray casting
The paths of casted rays reflect real-world surface conditions, making them ideal for associating sensor observations with BIM models. Building on this principle, we propose a novel multi-hit ray casting model, illustrated in Figure 3. Multi-hit ray casting in BIM coordinate frame. The process transforms real-world point clouds into the BIM frame and performs ray casting until reaching each point’s measured position. This provides local surface samples and texture mappings to BIM-Loc.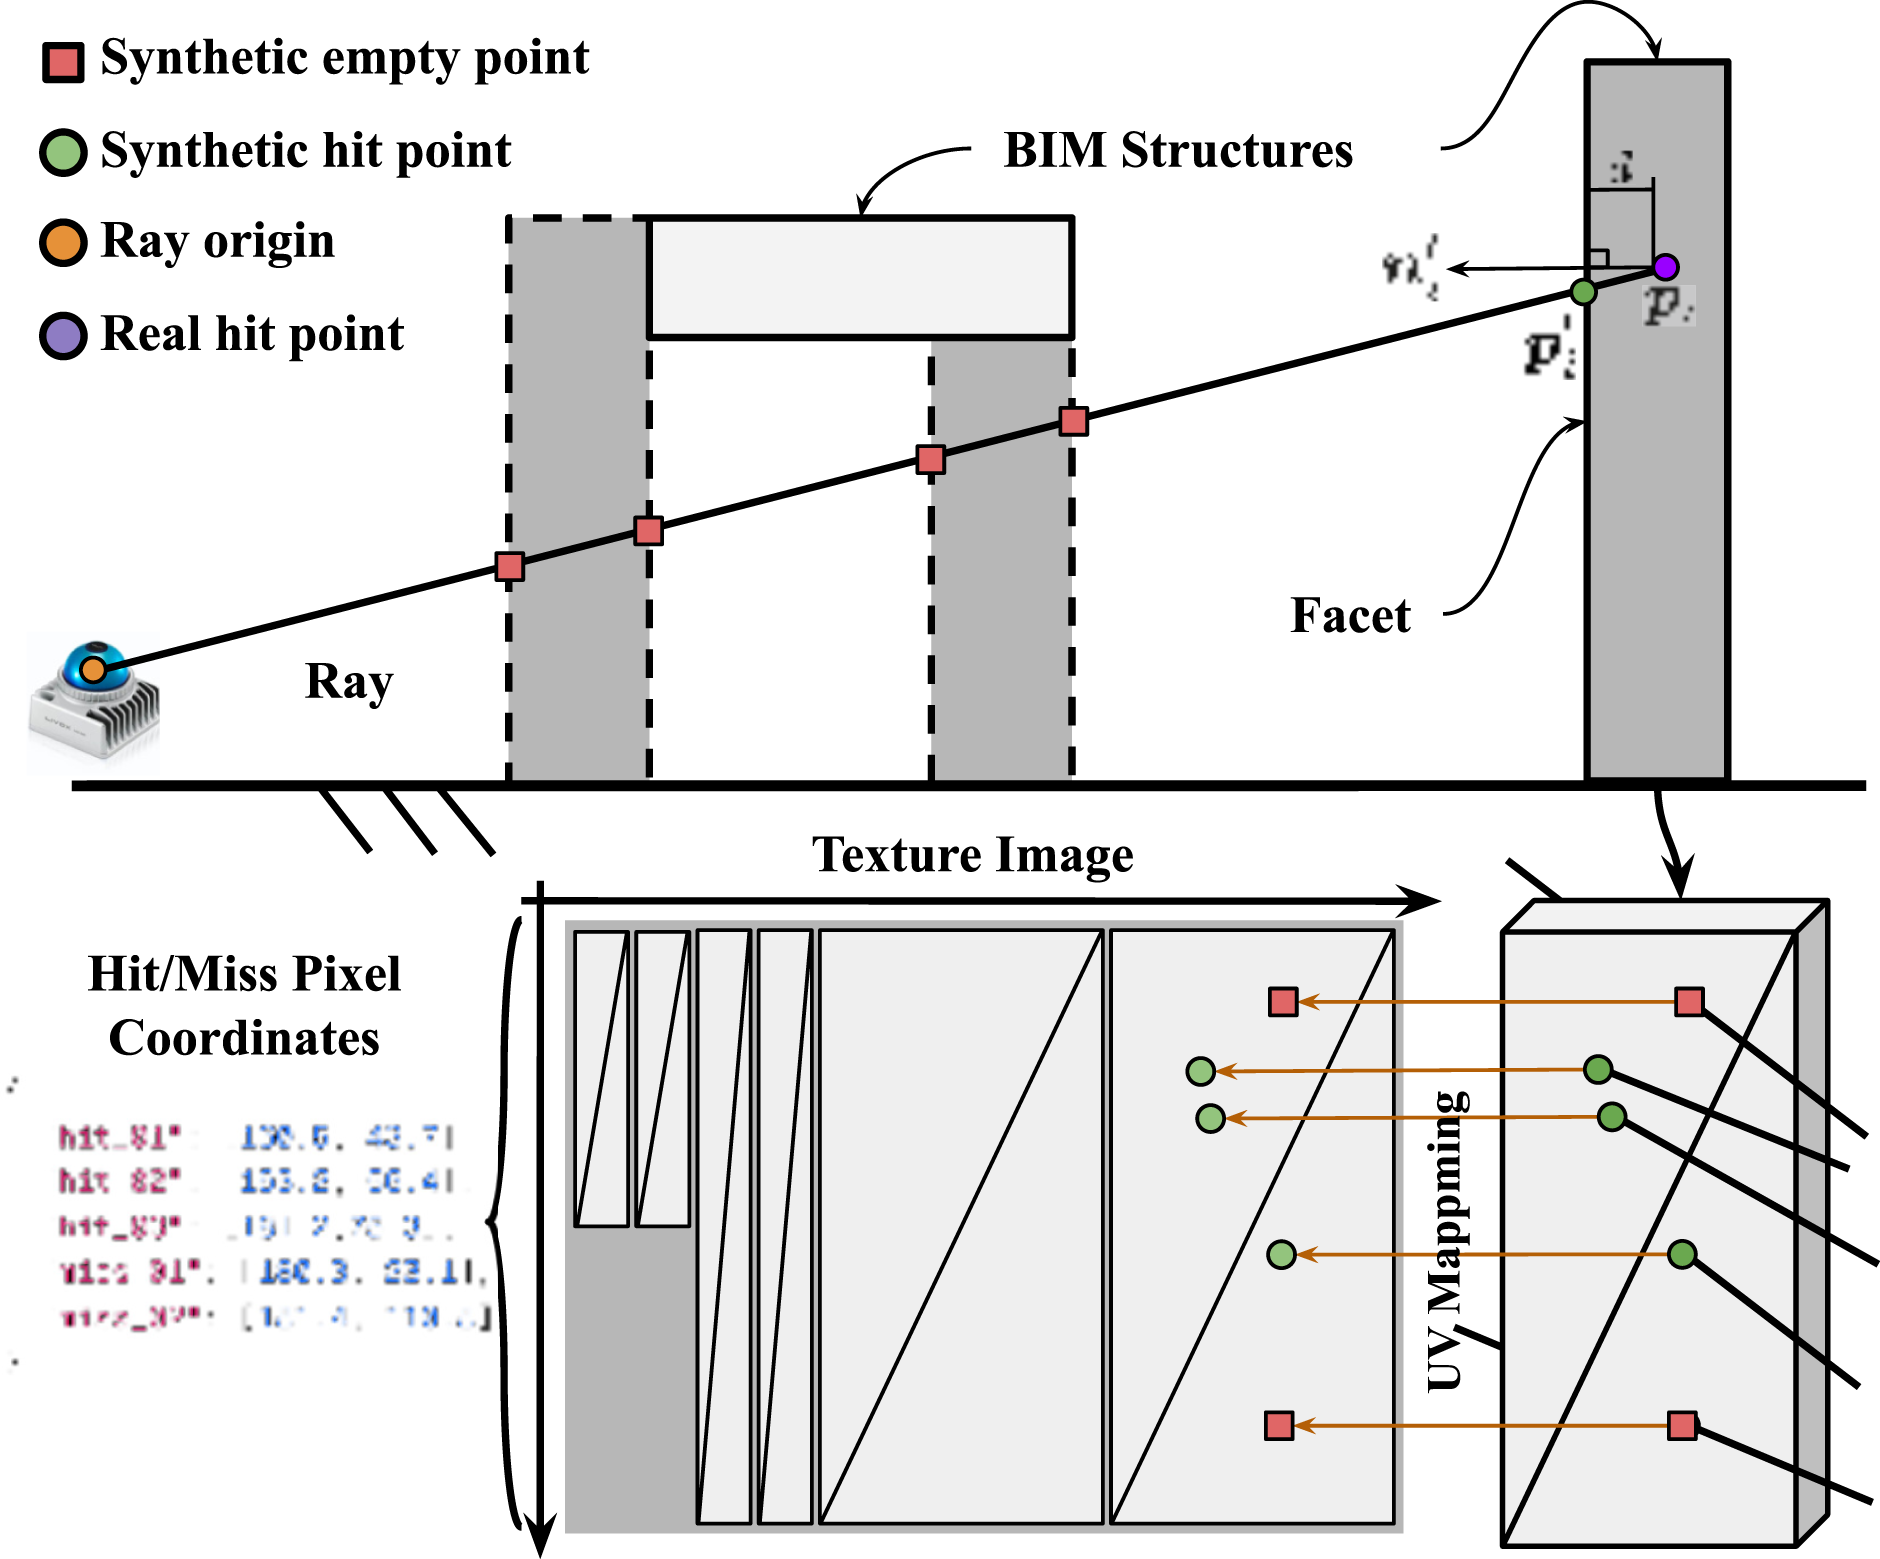
For a given point cloud (omitting time subscript k), each point is treated as a ray defined by its origin, measured distance, and unit direction vector. We first transform these rays into the BIM coordinate system. A ray casting operation then simulates each ray’s path through the BIM model, starting from the sensor origin and terminating slightly behind the real-world measured endpoint with an extended length to deal with sensor noise. Under this setting, even the ray would normally stop slightly before the BIM surface, the designed extended length forces an intersection.
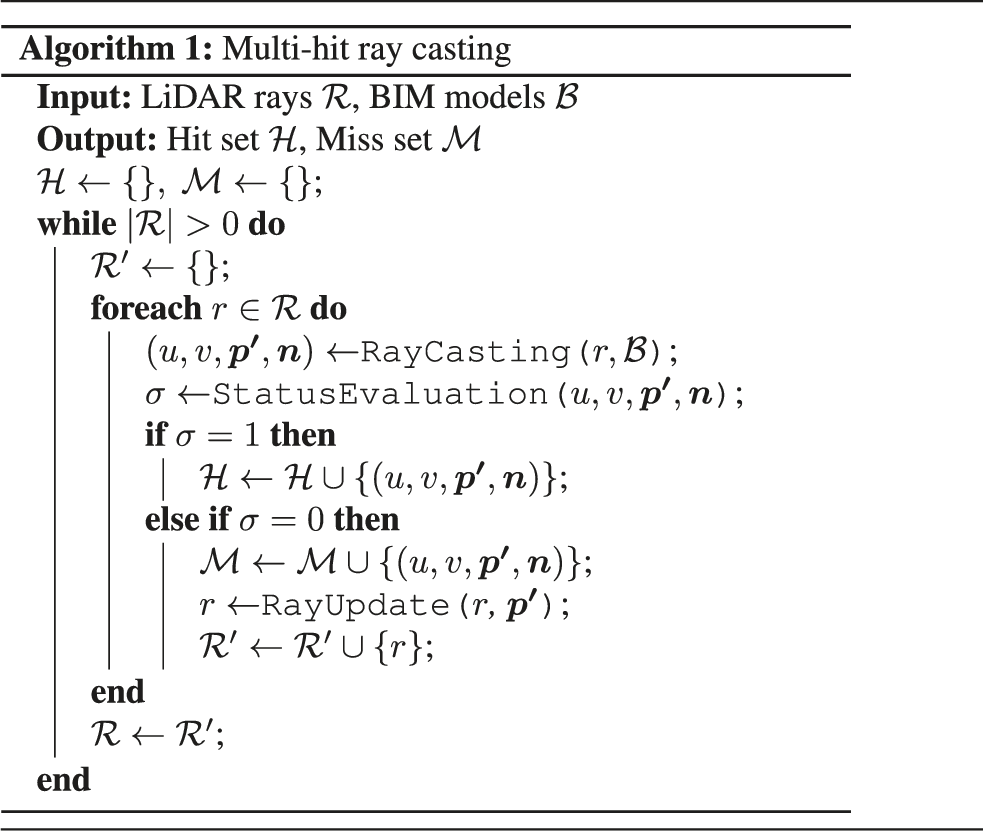
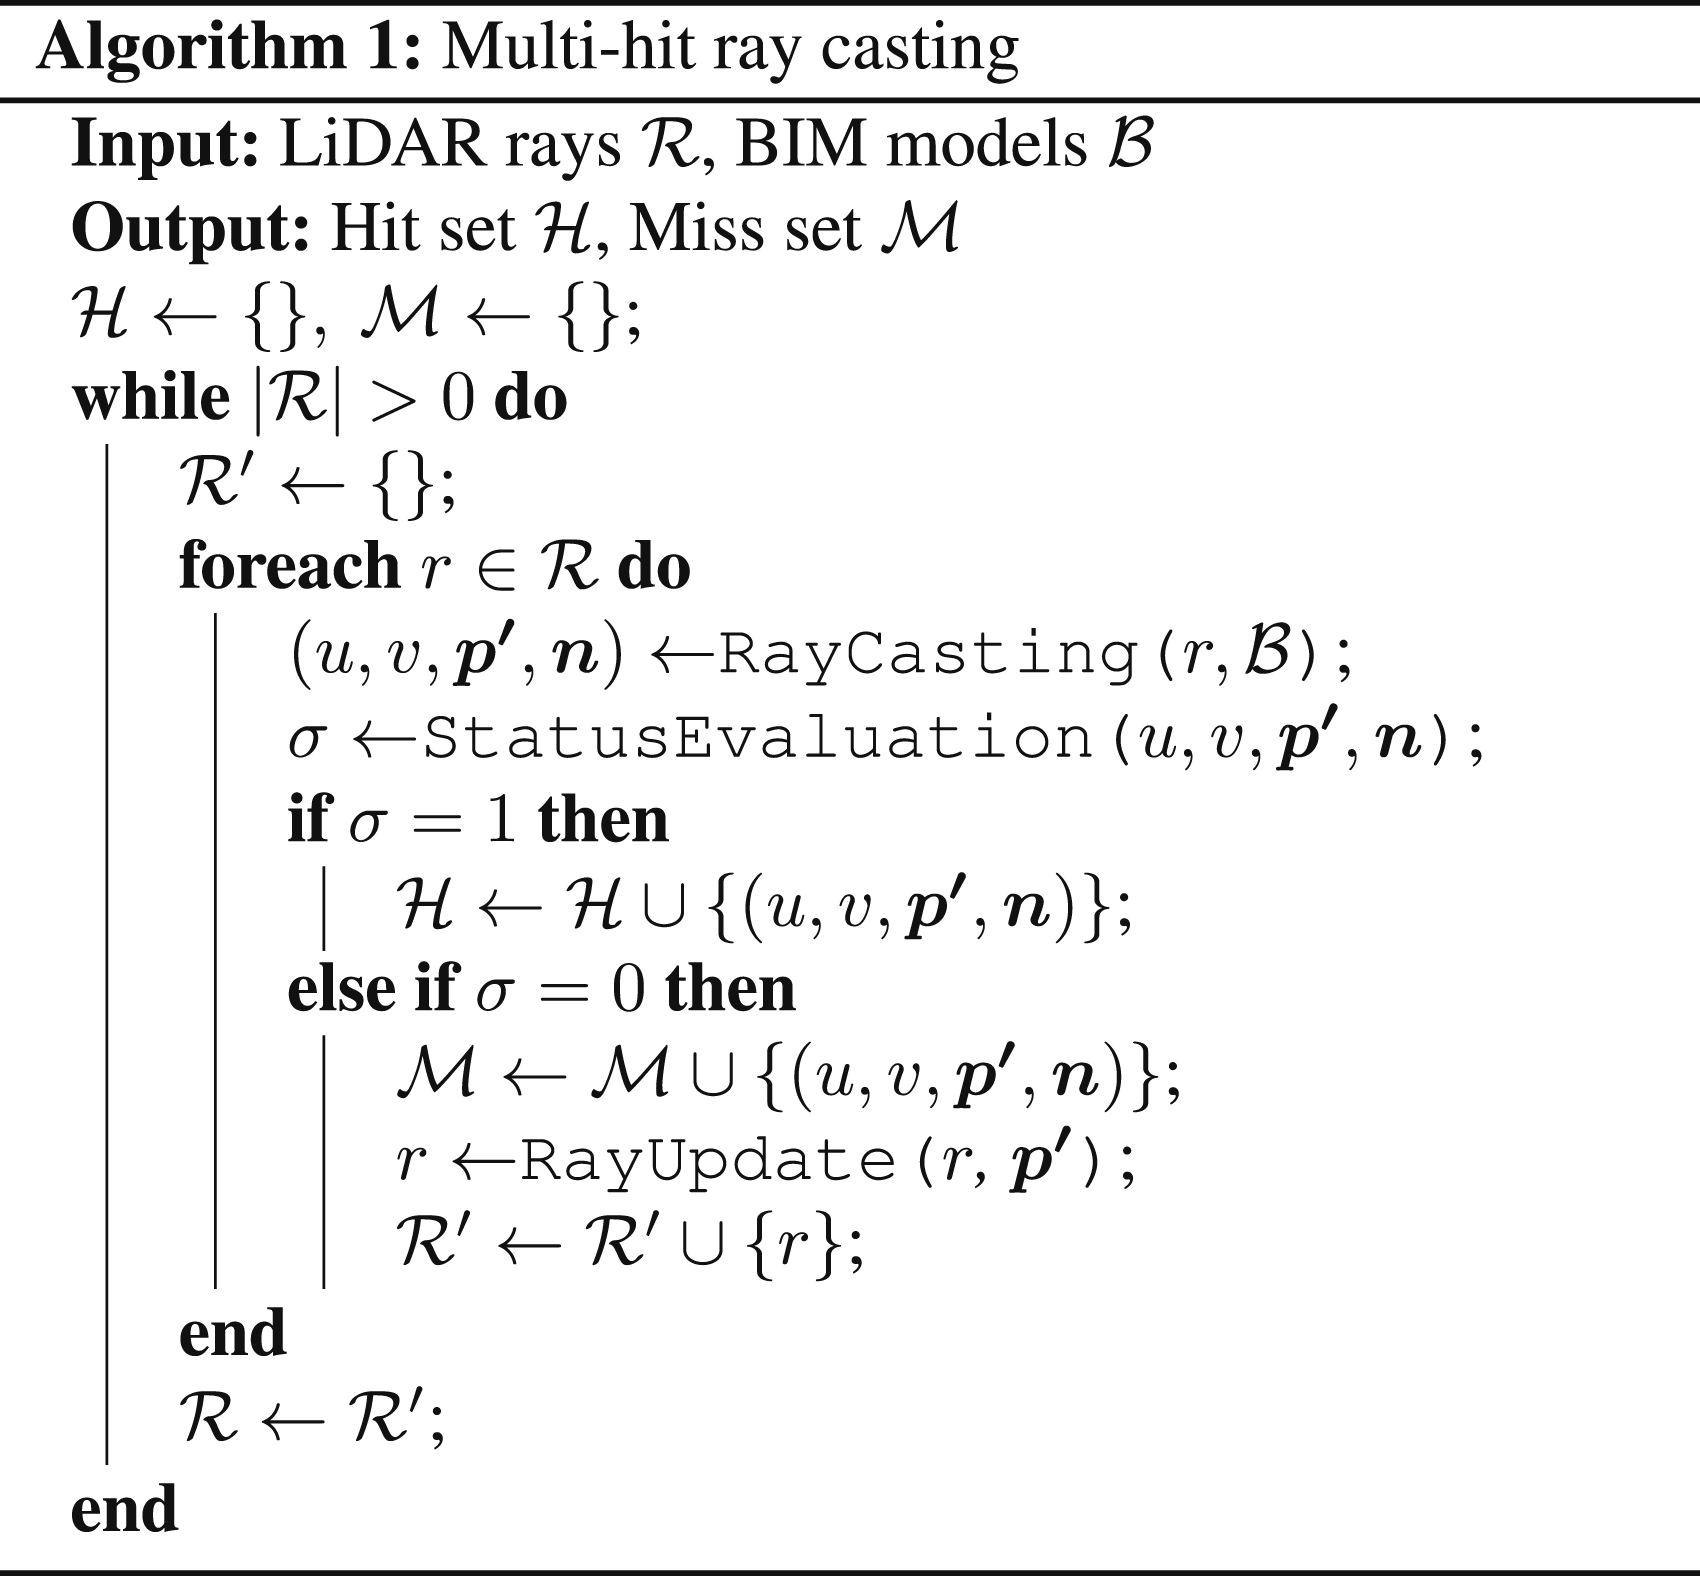
Unlike standard methods that stop at the first intersection, our strategy evaluates multiple intersections along the ray’s path until it reaches the neighborhood of the endpoint. This process is detailed in Algorithm 1. For each intersection with a BIM surface (facet), the
For each intersection, the
In summary, the multi-hit ray casting module contributes to the BIM-Loc framework in three critical ways. First, it establishes an efficient and accurate association between BIM structures and point clouds, which is comparable with traditional nearest-neighbor search. Second, the synthetic hit points with normals in
3.3. BIM-aided trajectory optimization
This section describes the trajectory optimization that maintains consistency between sensor observations and the BIM model. We formulate the residuals from equation (3) as a pose factor graph. This graph combines two components: (1) motion priors from front-end odometry
For the trajectory optimization sub-problem, the association indicator δ(k, n) is provided by the multi-hit ray casting module (Section 3.2), while the discrepancy indicator
The multi-hit ray casting operation establishes data association by assigning each point in the hit set Definition of constraints for BIM-aided trajectory optimization. Multi-hit ray casting associates scans with BIM structures. The optimization incorporates three constraints: front-end odometry, inter-scan consistency, and scan-BIM alignment, which jointly determine the trajectory estimation.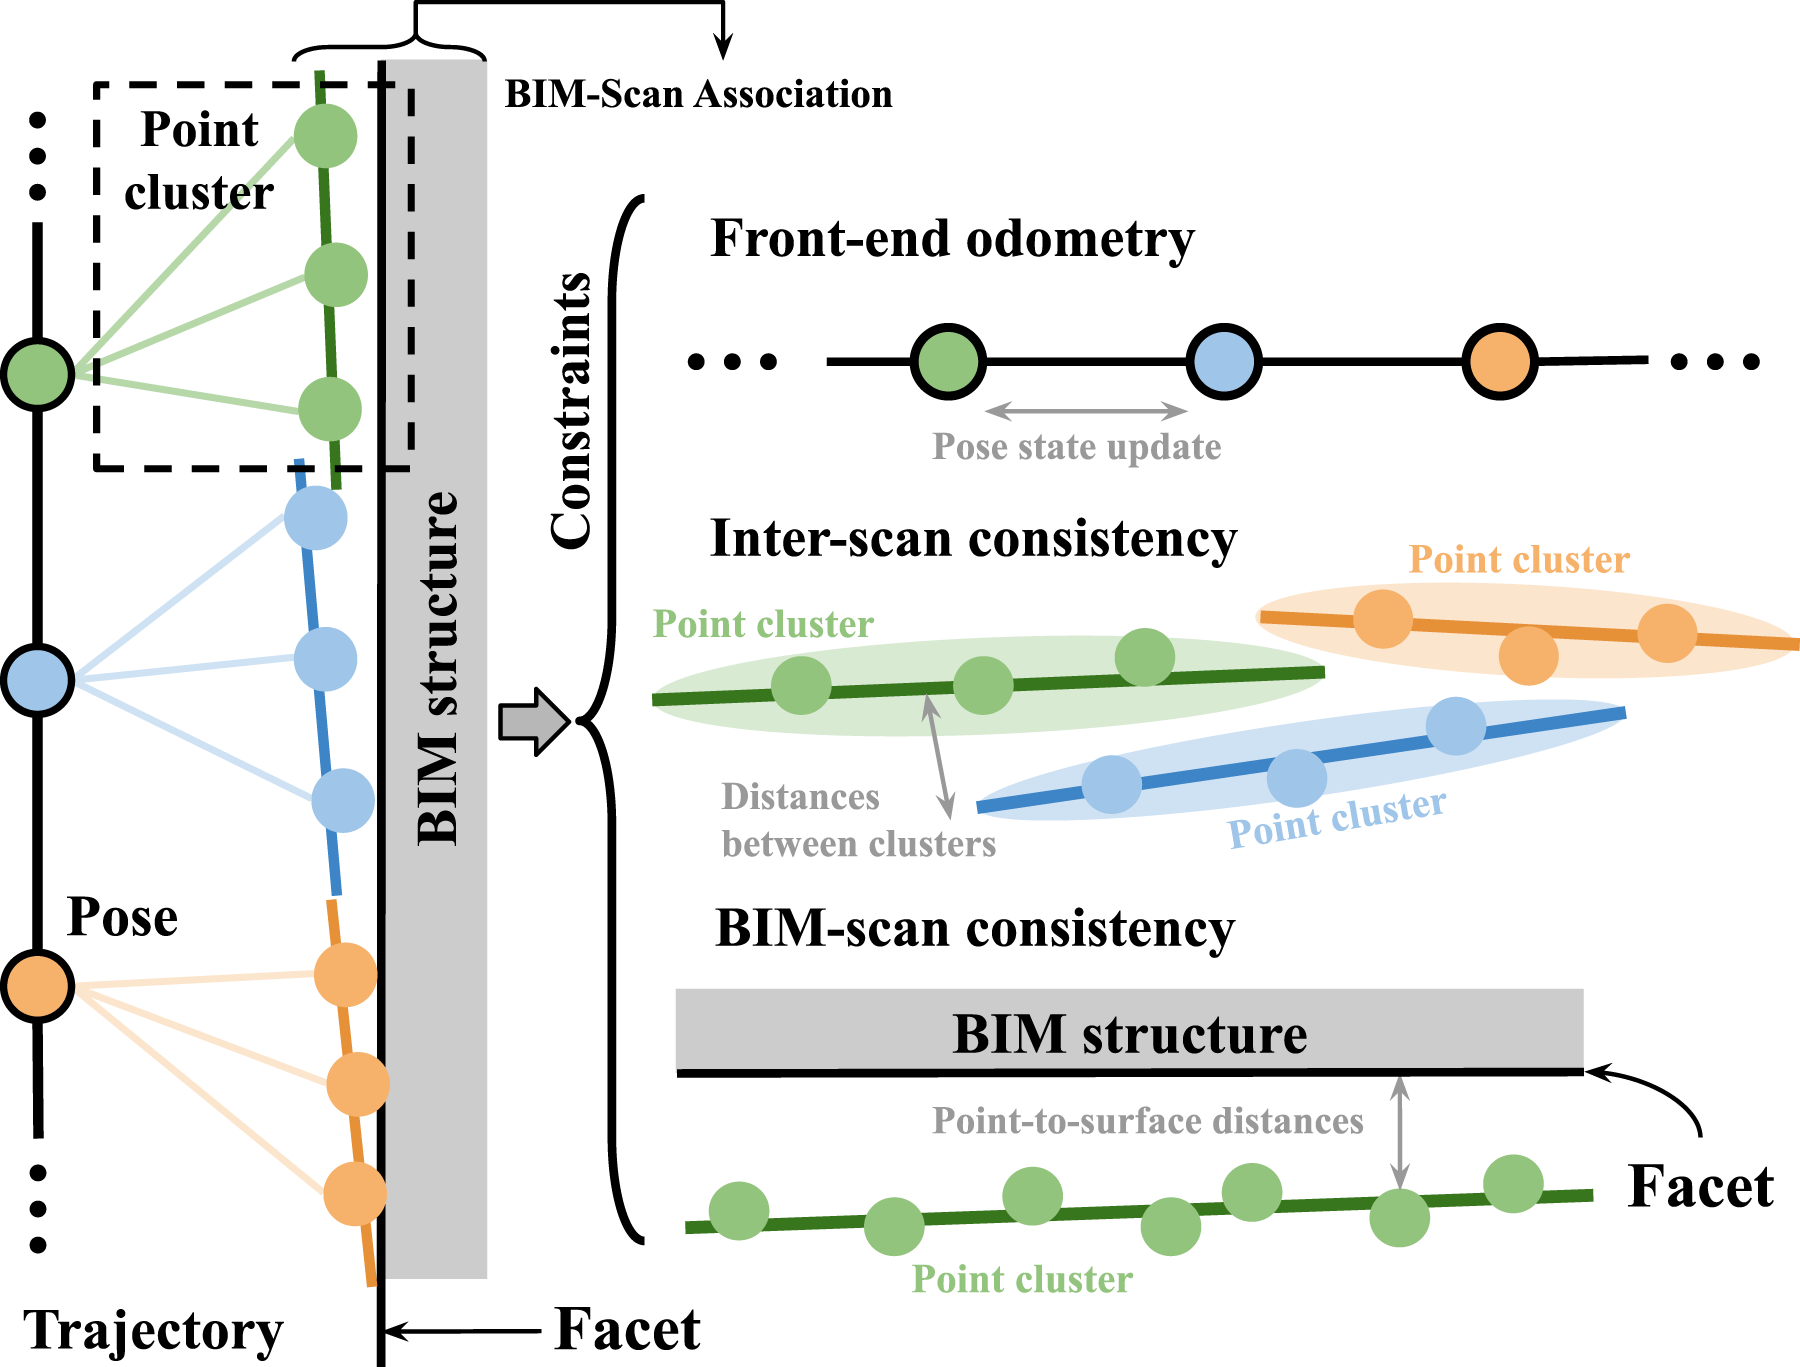
Given C point clusters and F facets from a sequence of K poses and N BIM structures, the number of association pairs equals the number of point clusters C. The number of clusters associated with a specific facet f is C
f
, where 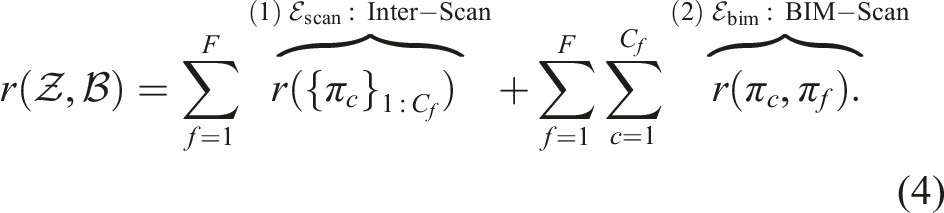
This formulation separates the residual into two components: (1)
3.3.1. Inter-scan consistency
To formulate the constraints among the C
f
point clusters associated with the same facet f, we design a multi-way factor, with the residual representation as illustrated in Figure 4. Inspired by Huang et al. (2021), we frame the bundle adjustment of point clusters as an eigenvalue minimization problem. For a point cluster c, the point distribution can be mostly captured by a mean vector 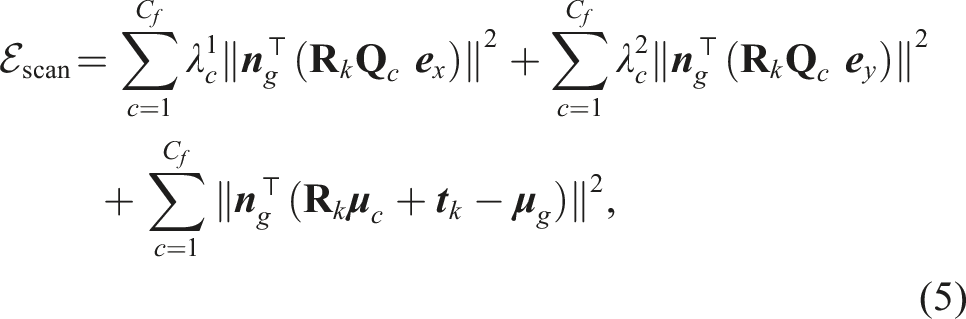
Equation (5) is designed to reformulate inter-scan consistency problem into the thickness of the aggregated point distribution along
3.3.2. BIM-scan consistency
This factor enforces consistency between associated BIM structures and point clusters. Using the synthetic points sampled from BIM surfaces via multi-hit ray casting, the BIM-scan residual is defined by the point-to-surface distance between real-world scan points and the local BIM surfaces. This is illustrated on the right side of Figure 3. The residual is formulated as:
Here, each point index by i in a point cluster is associated with a BIM facet. The variables
3.3.3. Factor graph representation
The previously defined constraints and their residual formulations deeply integrate the BIM model into pose estimation. The resulting factor graph for trajectory optimization is illustrated in Figure 5. It incorporates the following factors: (1) odometry factor that provides motion priors from the front-end module; (2) inter-scan consistency factor (Section 3.3.1) that unifies point clusters from sequential scans into a single optimization target, represented by the dark gray region; (3) BIM-scan consistency factor (Section 3.3.2) that aligns scans with the BIM model. It first transform and accumulate scans into a temporary sub-map and then uses multi-hit ray casting to generate associations between this sub-map and the BIM structures, as shown in the light gray region. Combined with a prior on the initial state, these factors optimize the trajectory and align it with the BIM coordinate system. Schema of the factor graph for trajectory optimization. Scans are transformed into a common temporary state, then processed via batch multi-hit ray casting. Synthetic points are represented in the BIM coordinate system. The pose graph incorporates three types of constraint factors to balance inter-scan consistency and BIM-scan alignment during online optimization.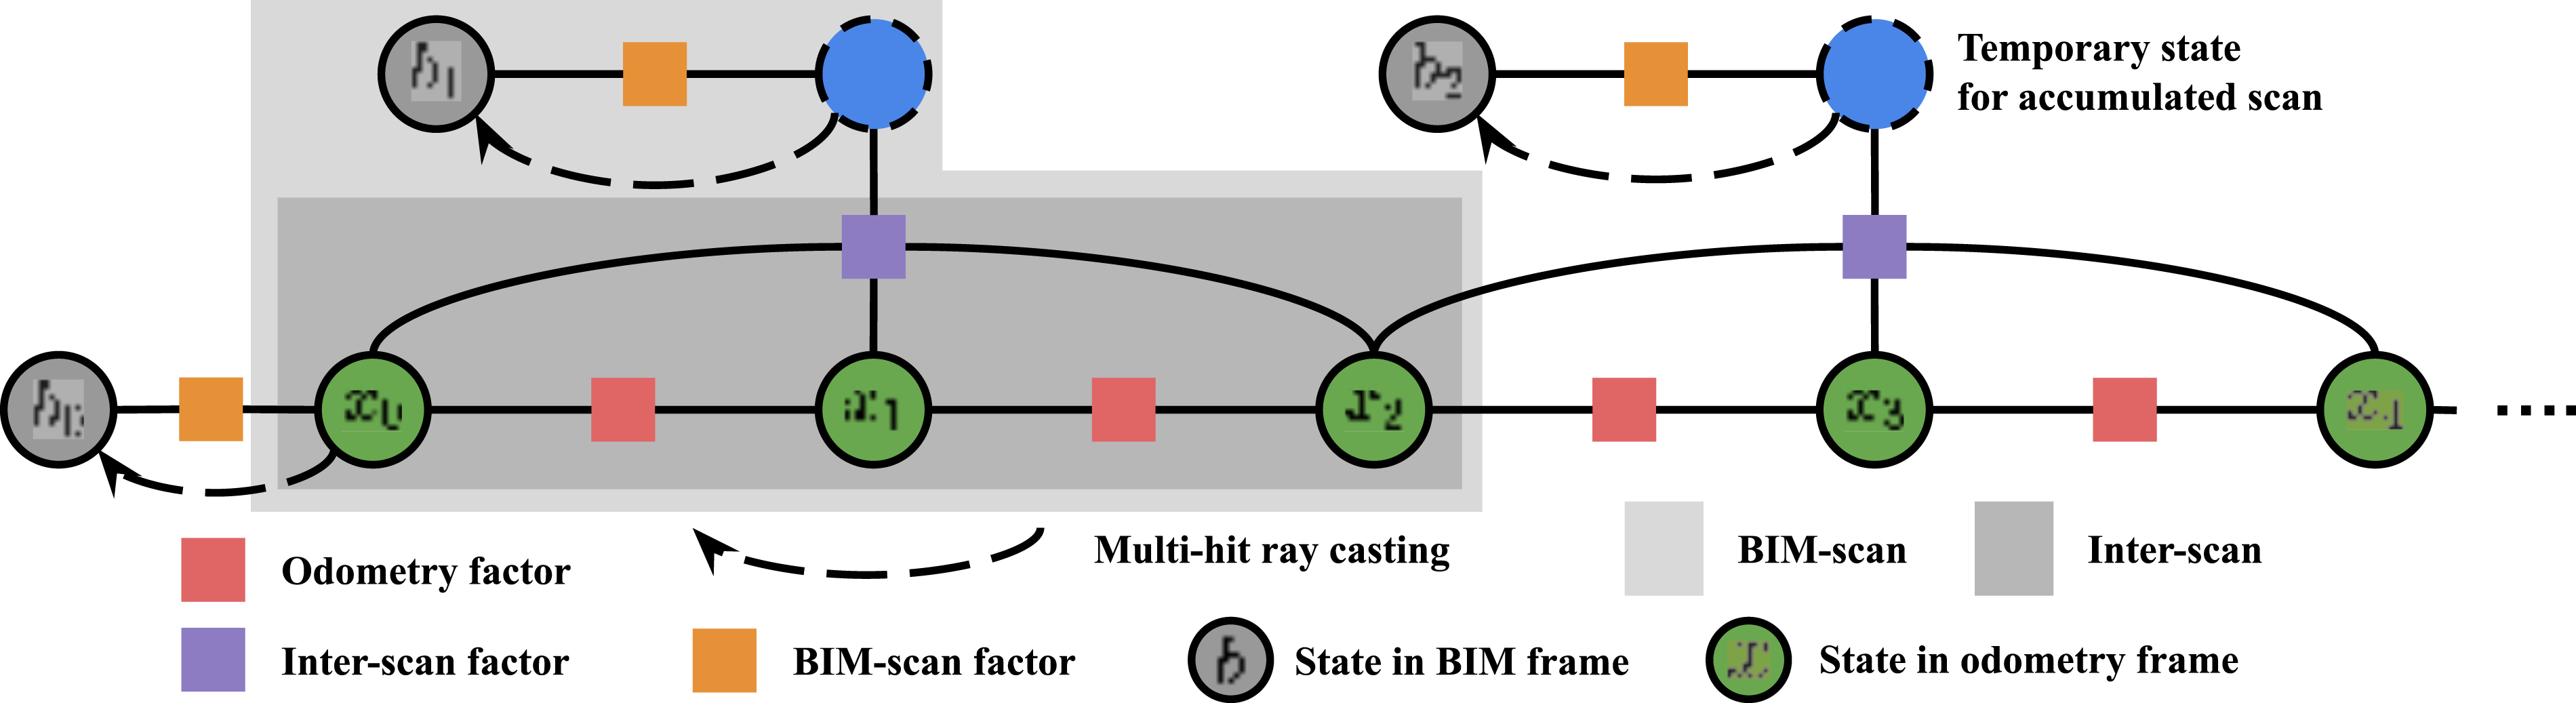
Furthermore, integrating BIM models through these constraints provides richer geometric knowledge of the environment. As shown in Figure 6, indoor scenes often contain thin walls (bottom left). Because our method uses the explicit boundaries defined in the BIM, the boundaries of these thin walls can be clearly recovered by accumulated point clouds. In contrast, methods like HBA (Liu et al., 2023a) and BALM2 (Liu et al., 2023b) fail to distinctly separate the two sides of a thin wall. Challenge of voxel-based data association with thin wall structures. Walls measuring 7.5 to 10 cm in thickness are comparable to typical voxel resolutions used in large-scale buildings, leading to ambiguous data associations.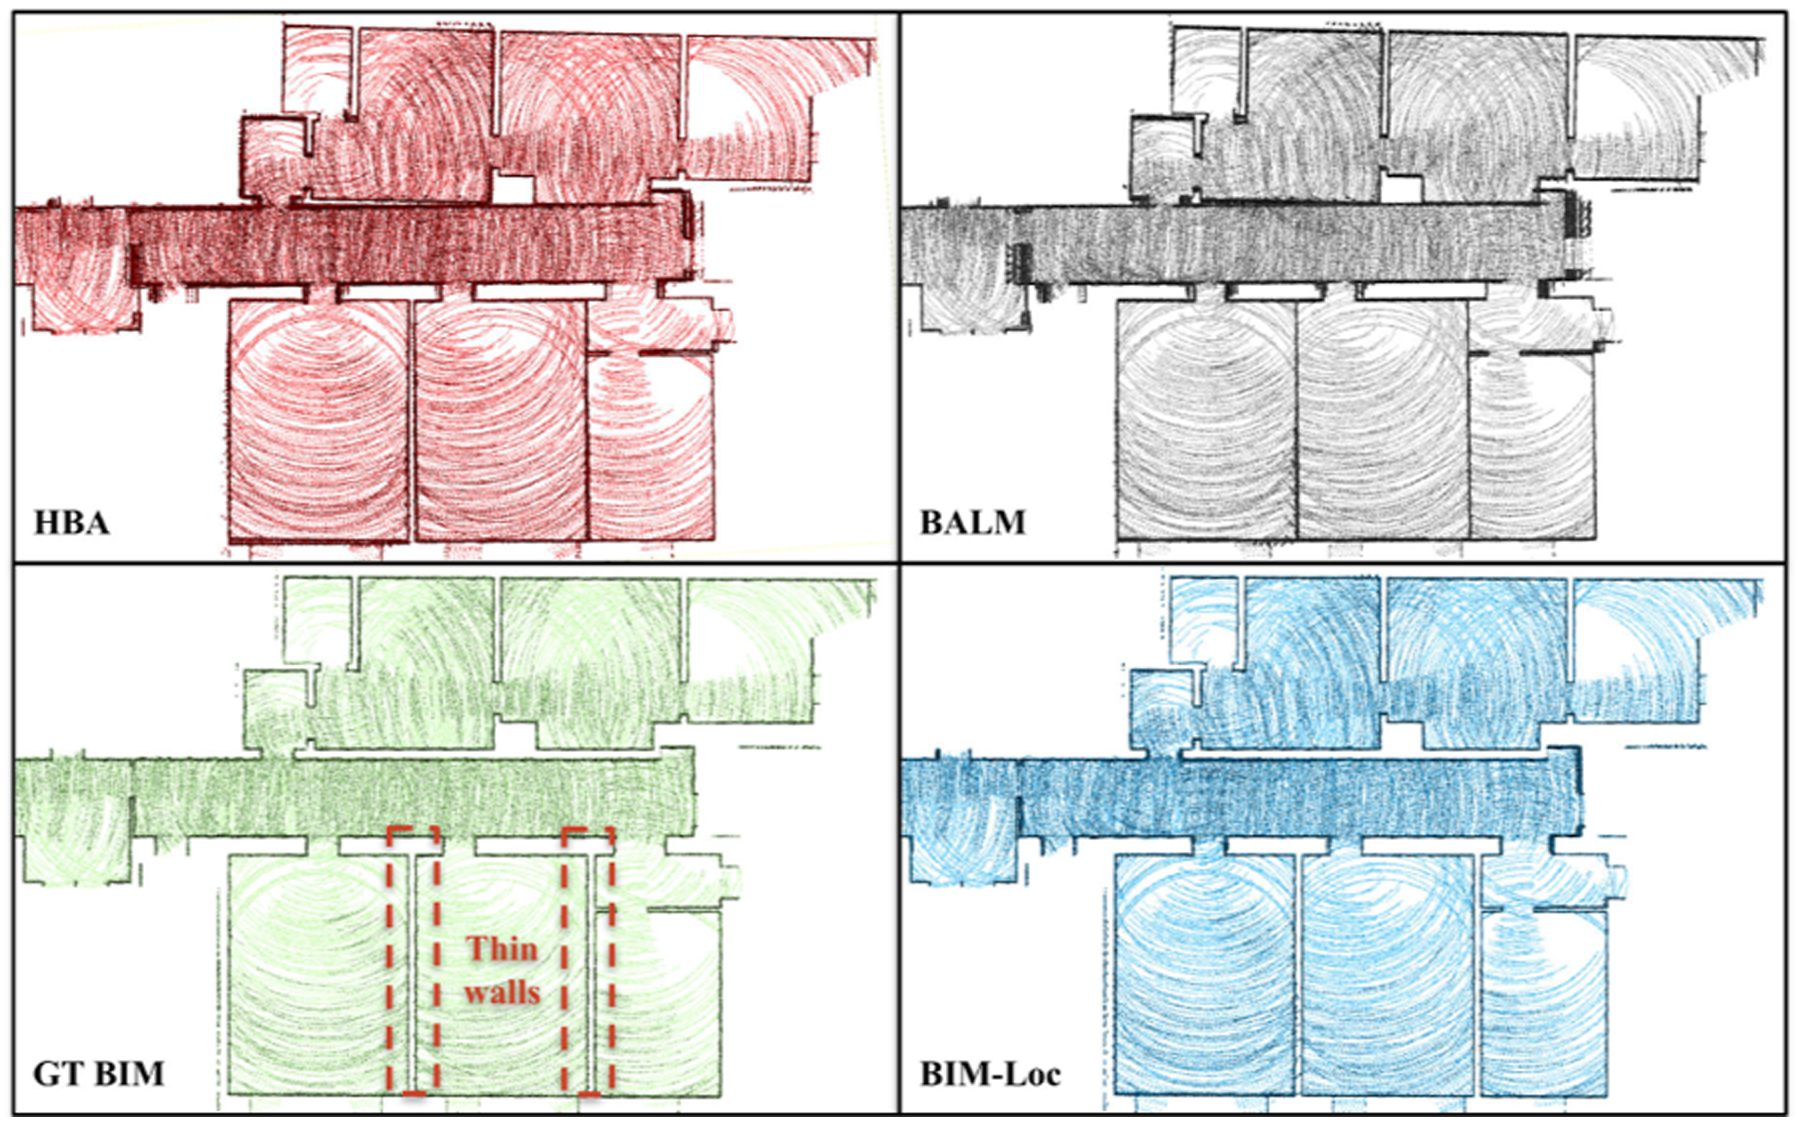
3.4. Discrepancy detection
This section addresses the subproblem of detecting discrepancies in BIM structures. As shown in equation (3), the status of each structure is represented by a discrepancy indicator, denoted here as
The goal of discrepancy detection is to estimate the posterior distribution Hierarchical Bayesian model for online discrepancy detection. The model infers structural discrepancies from sparse ray-casting observations using a multi-stage Bayesian inference pipeline. Sparse observations are first processed through kernelized Bayesian inference to predict pixel status in texture images, then propagated through pixel-facet-structure hierarchies to estimate BIM structure discrepancy indicators.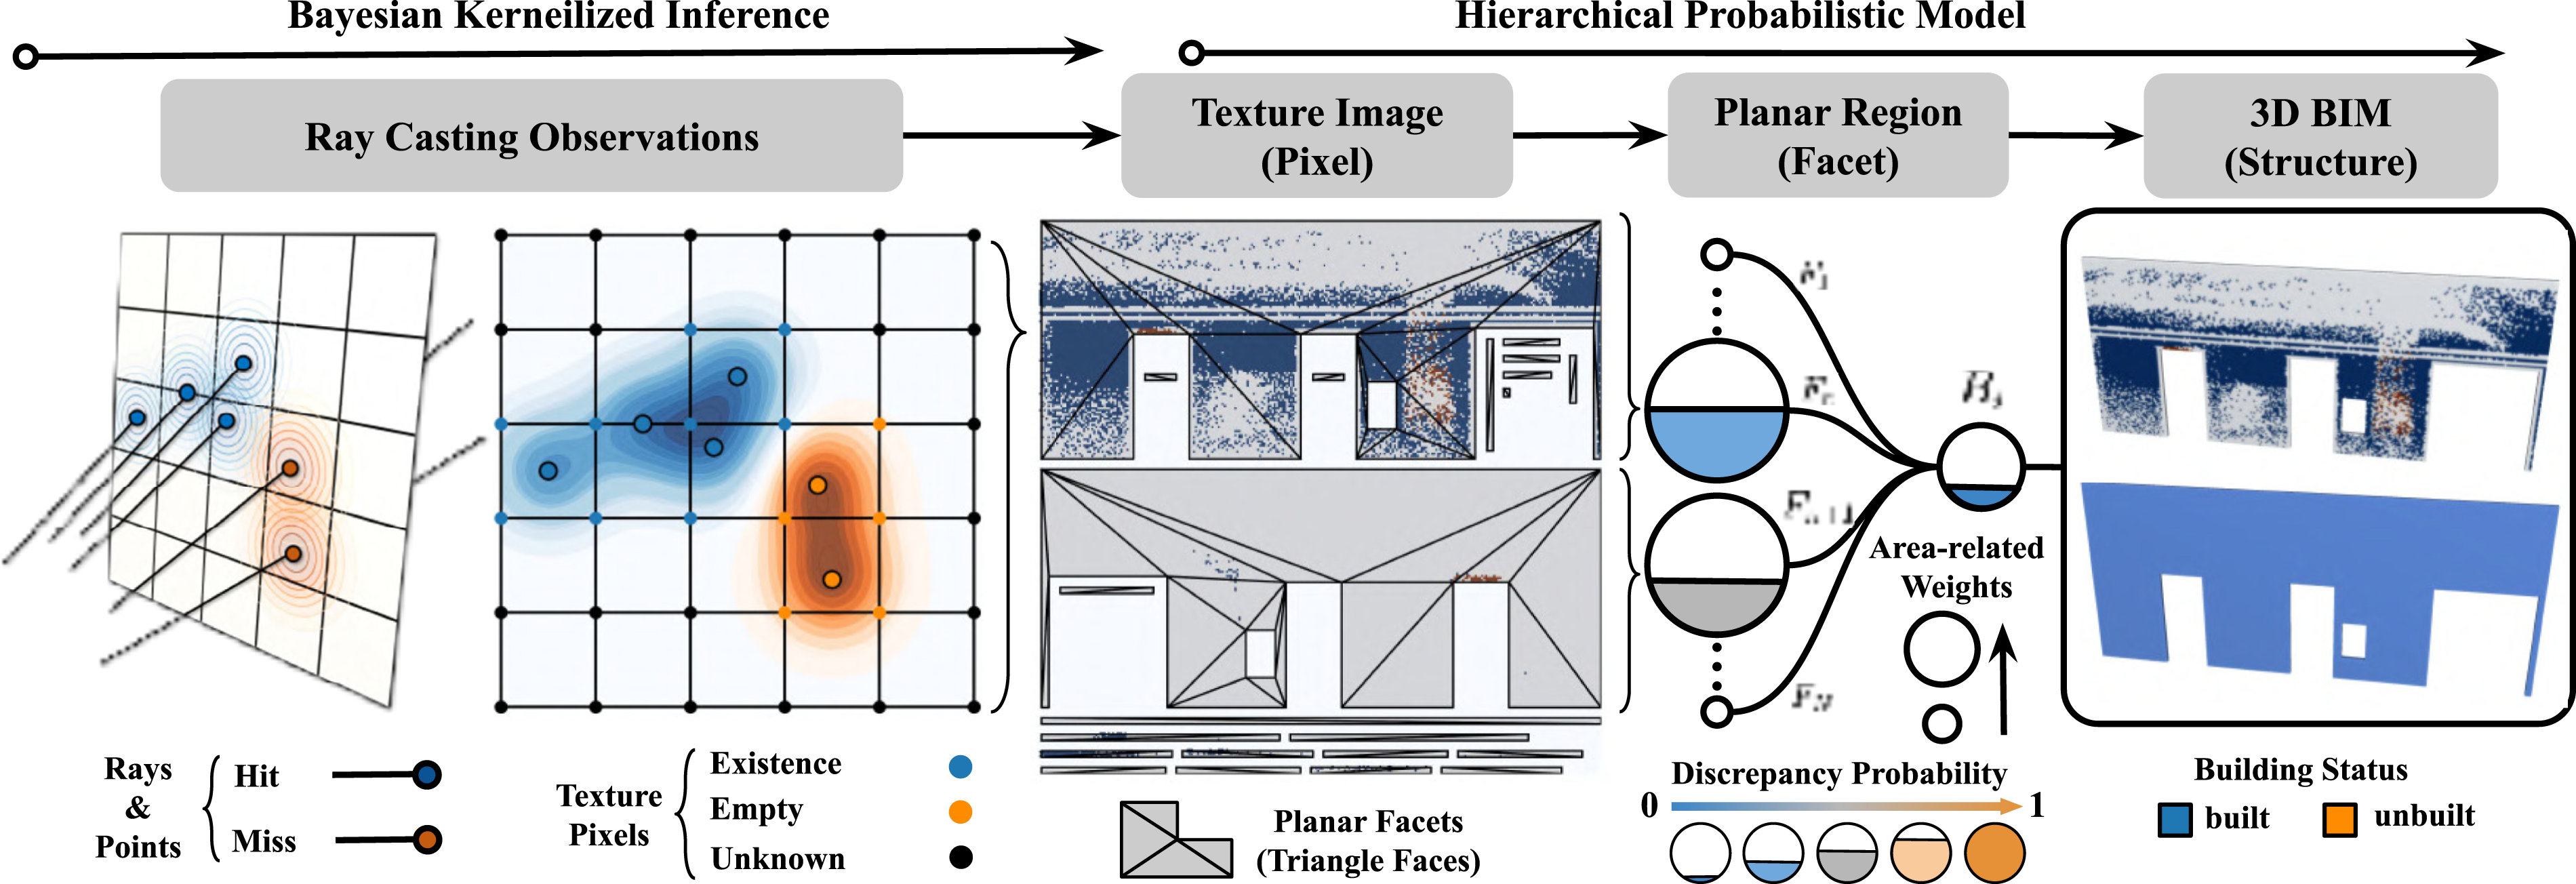
3.4.1. Hierarchical discrepancy modeling
To bridge this representation gap, we design a probabilistic model based on the hierarchical architecture of BIM models: structure, facet, texture pixel, and observations 


3.4.2. Bayesian kernelized inference
Building on the hierarchical probabilistic model, this section describes a continuous texture mapping strategy using sparse point cloud observations to establish the relationship
As noted in Section 3.2, laser rays are organized into hit 
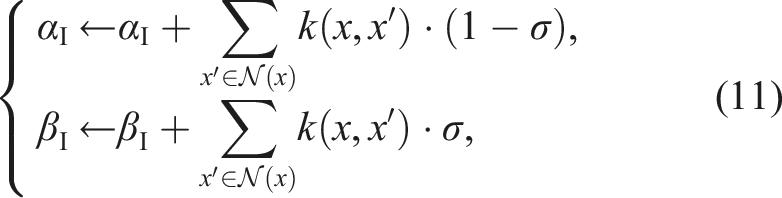
3.4.3. Discrepancy status propagation
The hierarchical model and kernelized inference establish a complete chain for discrepancy propagation: 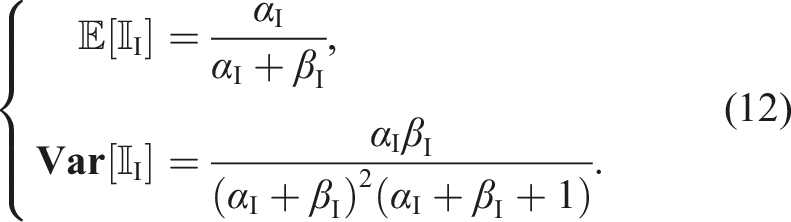
These pixel-level estimates are then propagated upward. For the facet-level indicator 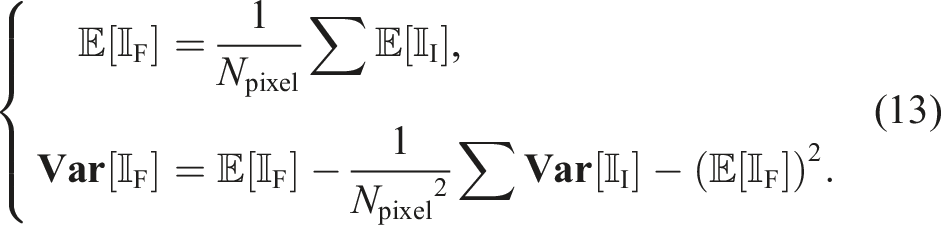
Finally, the structure-level estimates are computed from the facet-level indicators using the weighted union from equation (8):
The definitions in equations (13) and (14) enable the propagation of discrepancy estimates from point cloud observations across all levels, from individual pixels to entire BIM structures. The final discrepancy indicator 
For a BIM structure,
The effectiveness of this module is shown in Figure 8. For instance, in case (c), the module correctly distinguishes completed H-shape beams from nearby walls, while in case (d), a square beam is identified as completed, while the H-beam inside it is labeled “unknown” due to lack of observations. Texture mapping visualization for discrepancy detection. Cases (a) and (b) show wrapped BIM models aligned with texture maps, highlighting discrepancies from elevator and roller doors. Cases (c) and (d) show H-shape beam detection behind unfinished and finished walls. Color coding indicates alignment status: blue for consistent, orange for discrepant, and gray for unknown regions.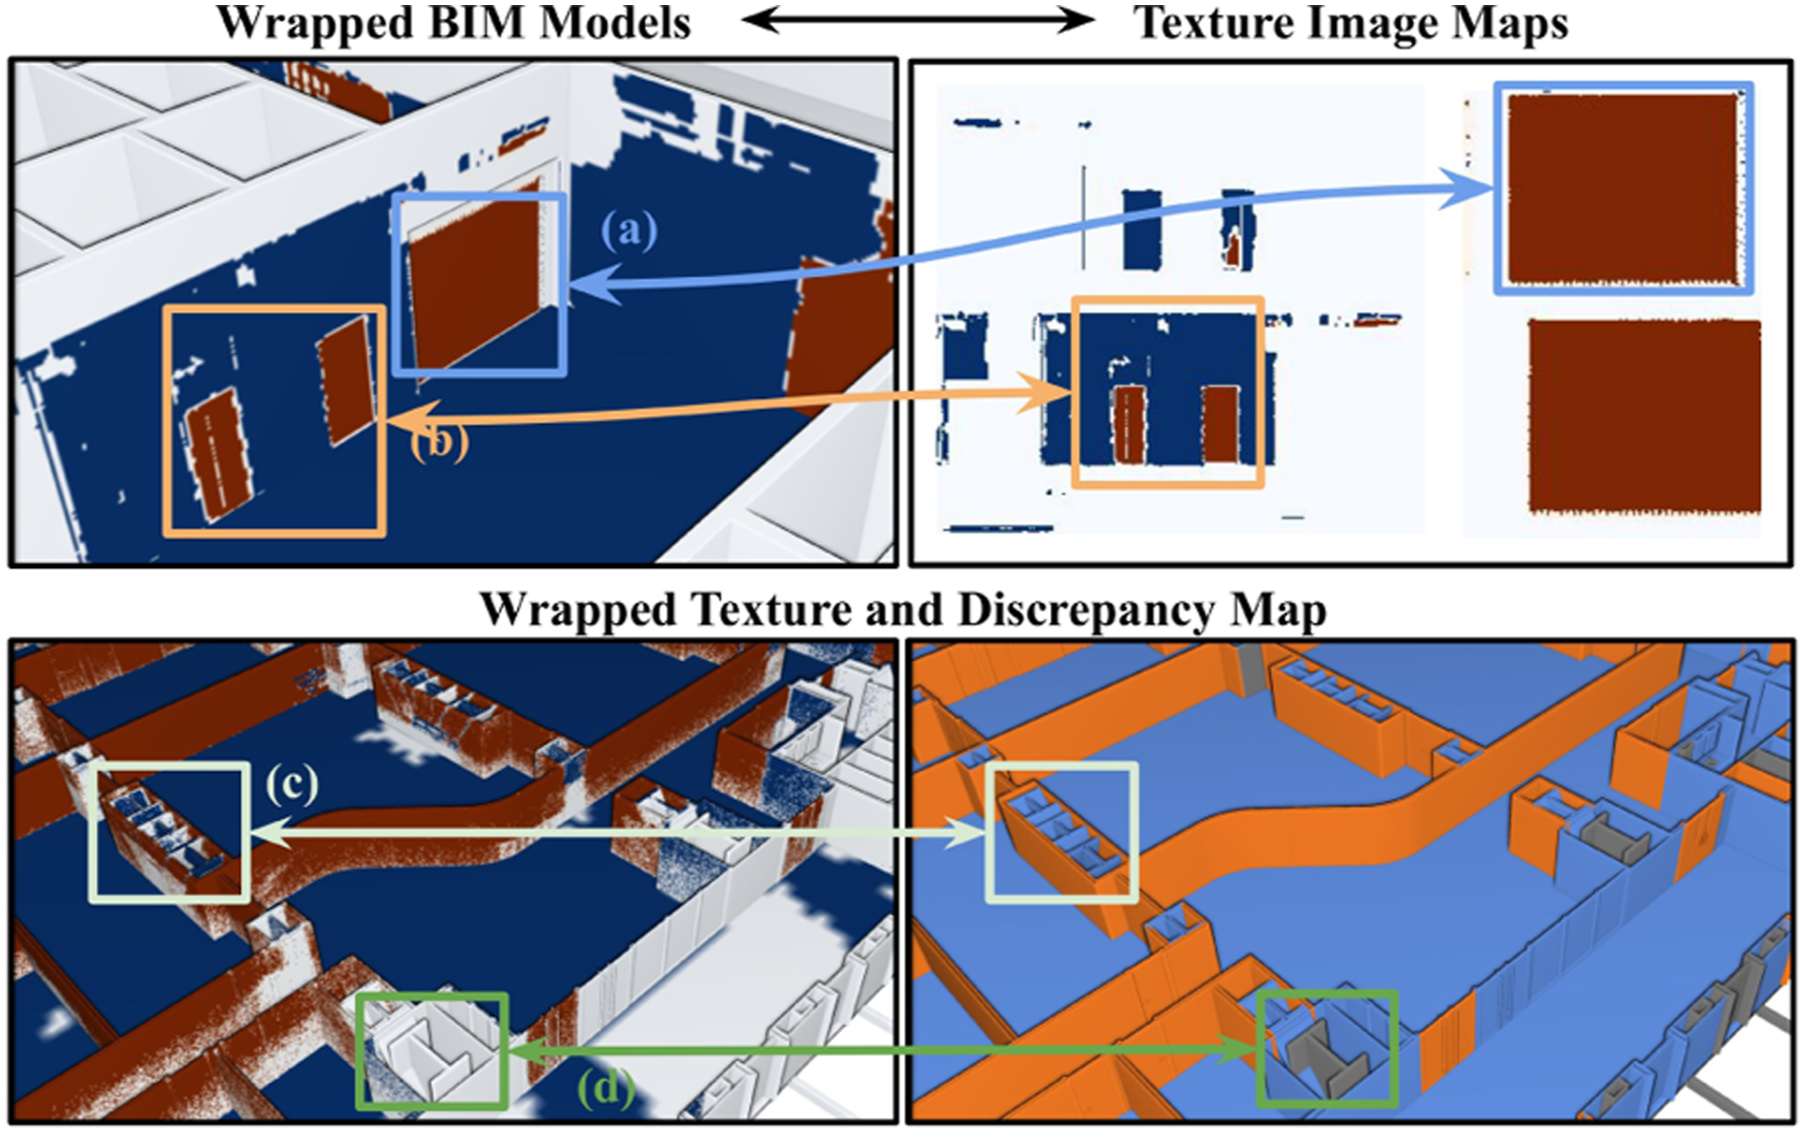
Each indicator in the hierarchy serves a distinct purpose:
4. Experiments
Our BIM-Loc method is evaluated across three distinct environmental settings: a BIM-robot simulation platform, the open-source SLABIM dataset (Huang et al., 2025), and a dataset collected from a real-world construction site (Zhang et al., 2024). Each setting serves as a separate benchmark, with comparisons made against several state-of-the-art approaches. All experiments were executed on a Mini-PC integrated with the sensor suite, utilizing an Intel® CoreTM i9-12900 CPU for computation. Notably, all evaluated algorithms rely solely on CPU-based processing, with no NVIDIA GPU acceleration required. As depicted in Figure 2, the inputs to BIM-Loc consist of sensor data sequences (including scans and IMU measurements) and BIM models. For other algorithms requiring point-based prior maps, these were uniformly sampled from the surfaces of the same as-designed BIM models used by our method.
To comprehensively assess BIM-Loc’s performance, five evaluation metrics are employed. For trajectory accuracy, we use Absolute Trajectory Error (ATE), calculating the Root Mean Square Error (RMSE) for both translation and rotation components:
Additionally, Mean Map Entropy (MME) (Hu et al., 2025; Kornilova and Ferrer, 2021) is used to evaluate the local spatial consistency of the aggregated point cloud map 
To account for variations in MME values across different BIM models, we normalize the results to get the MME ratio for fair comparison, which is computed as MMEagg/MMEbim ∈ [0, 1], which represents the ratio between the MME of the aggregated map and that of the sampled BIM surface map.
Beyond trajectory errors, we evaluate BIM-observation consistency using another two metrics. The scan-to-BIM distance metric assesses per-scan consistency by computing distances between points and BIM surfaces. To reduce noise impact, only distances below a predefined threshold (0.2 m in all experiments) are considered for RMSE computation. For global consistency evaluation, we employ the Wasserstein Distance (WD) metric proposed by Hu et al. (2025). The ground truth map and estimated aggregated map are first voxelized. The voxel-wise WD error is computed according to the distribution of the inside points: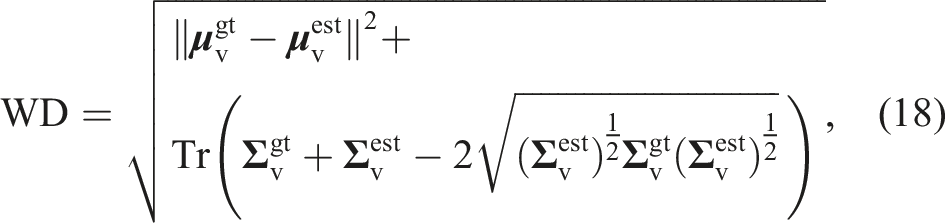
The BIM models used in the work are all with LOD 300 (i.e., Levels of Details) and come from the International Foundation Classes (IFC), which is a popular in AEC fields for efficient building data sharing. To interpret the BIM model into the objects of building structures in robot application and simulation platforms, a series of tool chain is designed focusing on two functionalities: (1) transfer the raw IFC files into meshes of building elements, and (2) generate URDF files for usage in simulation platforms. In BIM/IFC files, the building structures are organized. Please refer to Appendix E for more information.
4.1. Simulation platform
The initial evaluation targets indoor environments that are free of temporary objects not captured in the BIM models. To facilitate this, we developed a BIM-robot simulation platform built upon an autonomous exploration framework (Cao et al., 2022). As illustrated in Figure 9, BIM models are converted into .stl format and imported into the Gazebo simulator (Aguero et al., 2015). A mobile robot equipped with a Velodyne VLP-16 LiDAR sensor navigates through the virtual building along trajectories generated by an exploration algorithm (Cao et al., 2021), producing synthetic LiDAR scans. The resulting synthetic data sequences, along with the BIM models, serve as inputs for all evaluated algorithms. Simulation benchmark structure, comprising a Gazebo simulator with BIM models and an exploration algorithm. Five BIM model groups generate test data: four unmodified models (CaseStudy, CityU-01, Office-01, Office-02) evaluate localization without BIM-reality discrepancies, while a synthetic model (CityU-02) focuses explicitly on such discrepancies.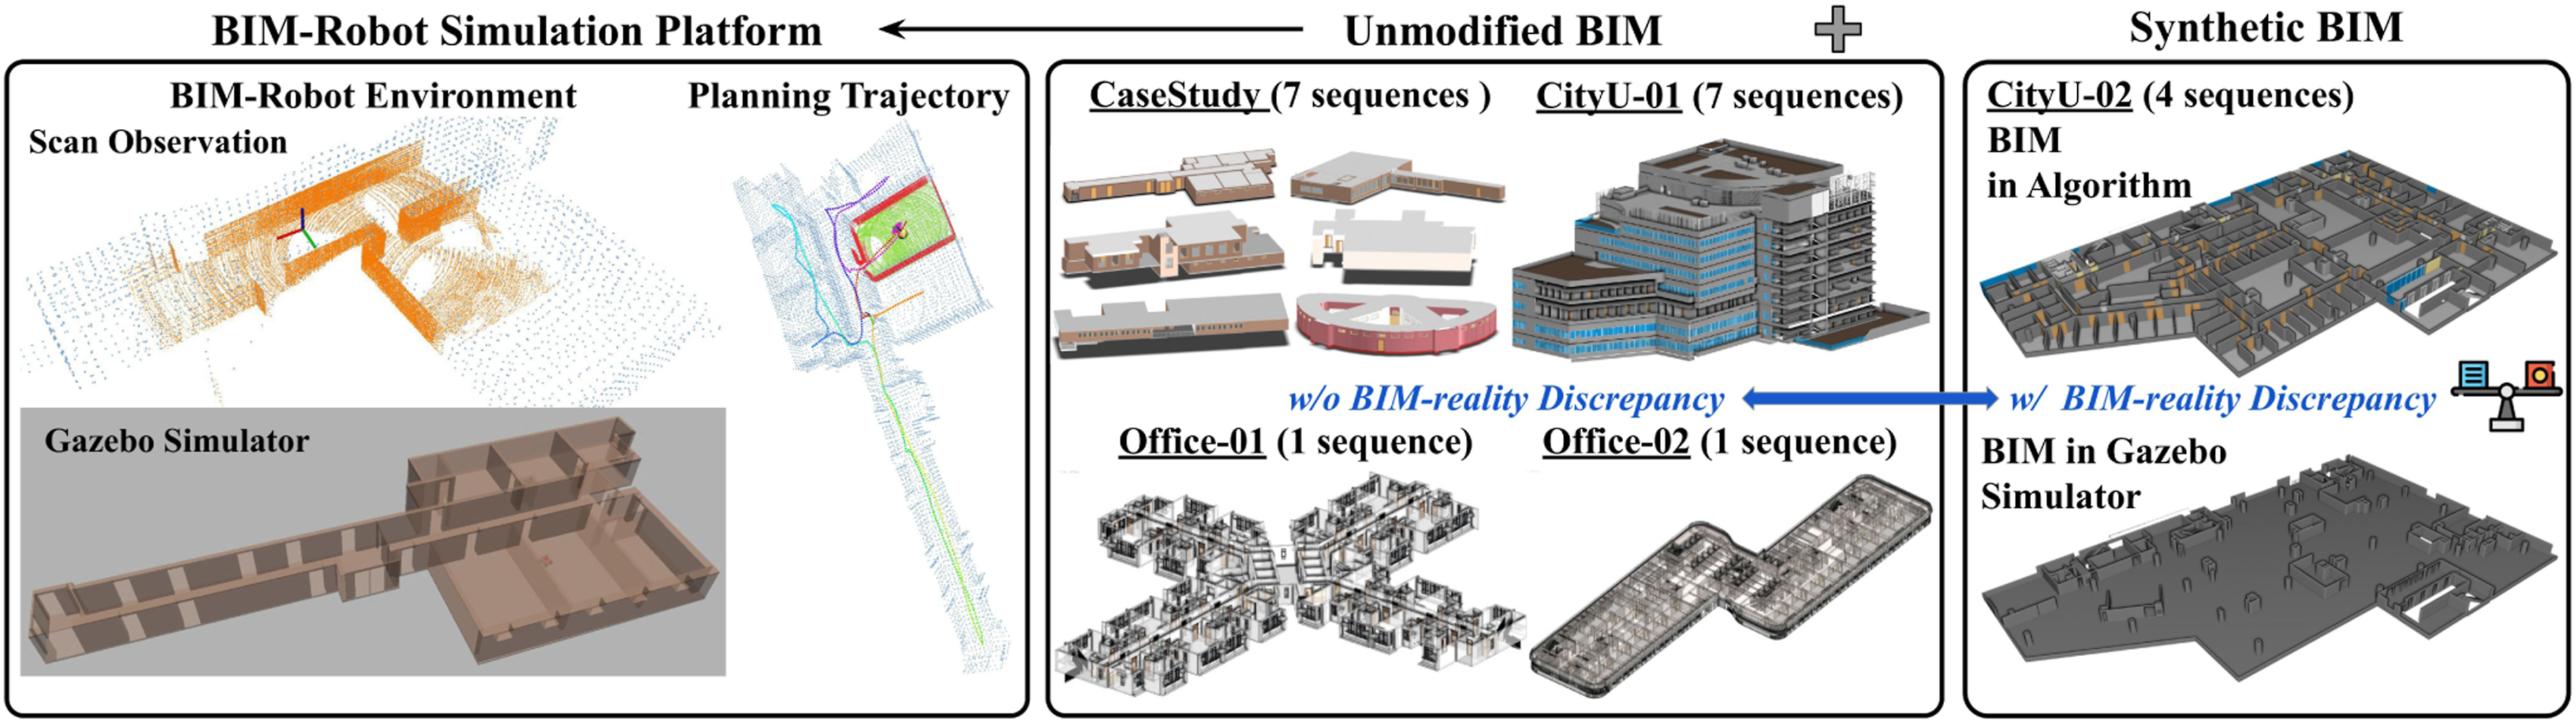
4.1.1. Benchmark
Leveraging the BIM-robot simulation platform, we designed a comprehensive simulation benchmark that incorporates a variety of as-designed BIM models to test localization performance across different levels of difficulty, scale, and consistency. As shown in Figure 9, the benchmark includes five BIM model types: (1)
4.1.2. Baselines
Six state-of-the-art pure LiDAR-based methods are included for comparison: (1) offline Bundle Adjustment (BA) methods BALM2 (Liu et al., 2023b) and HBA (Liu et al., 2023a); (2) an online pose graph optimization method using global place descriptors: Scan Context (Kim et al., 2022) integrated with pose graphs; (3) a map-based localization approach: HDL-Localization (Kenji et al., 2019); (4) the DLO algorithm (Chen et al., 2022), which serves as the front-end module for BIM-Loc and is included as a standalone baseline; (5) an offline point cloud-to-BIM comparison method BIM-Reg (Zhang et al., 2024) as a baseline for discrepancy detection evaluation. Note that HDL-Localization is used solely in its local prior-map-based pose correction mode, with global initialization disabled. The initial pose is provided in advance to ensure a fair comparison of prior-based pose optimization among all algorithms.
4.1.3. Metrics
Localization performance is evaluated using the following metrics: Absolute Trajectory Error (ATE), Mean Map Entropy (MME), RMSE of scan-to-BIM distances, and RMSE of Wasserstein Distance (WD) errors. For discrepancy detection, precision, recall, and F1-score are employed.
4.1.4. Result analysis
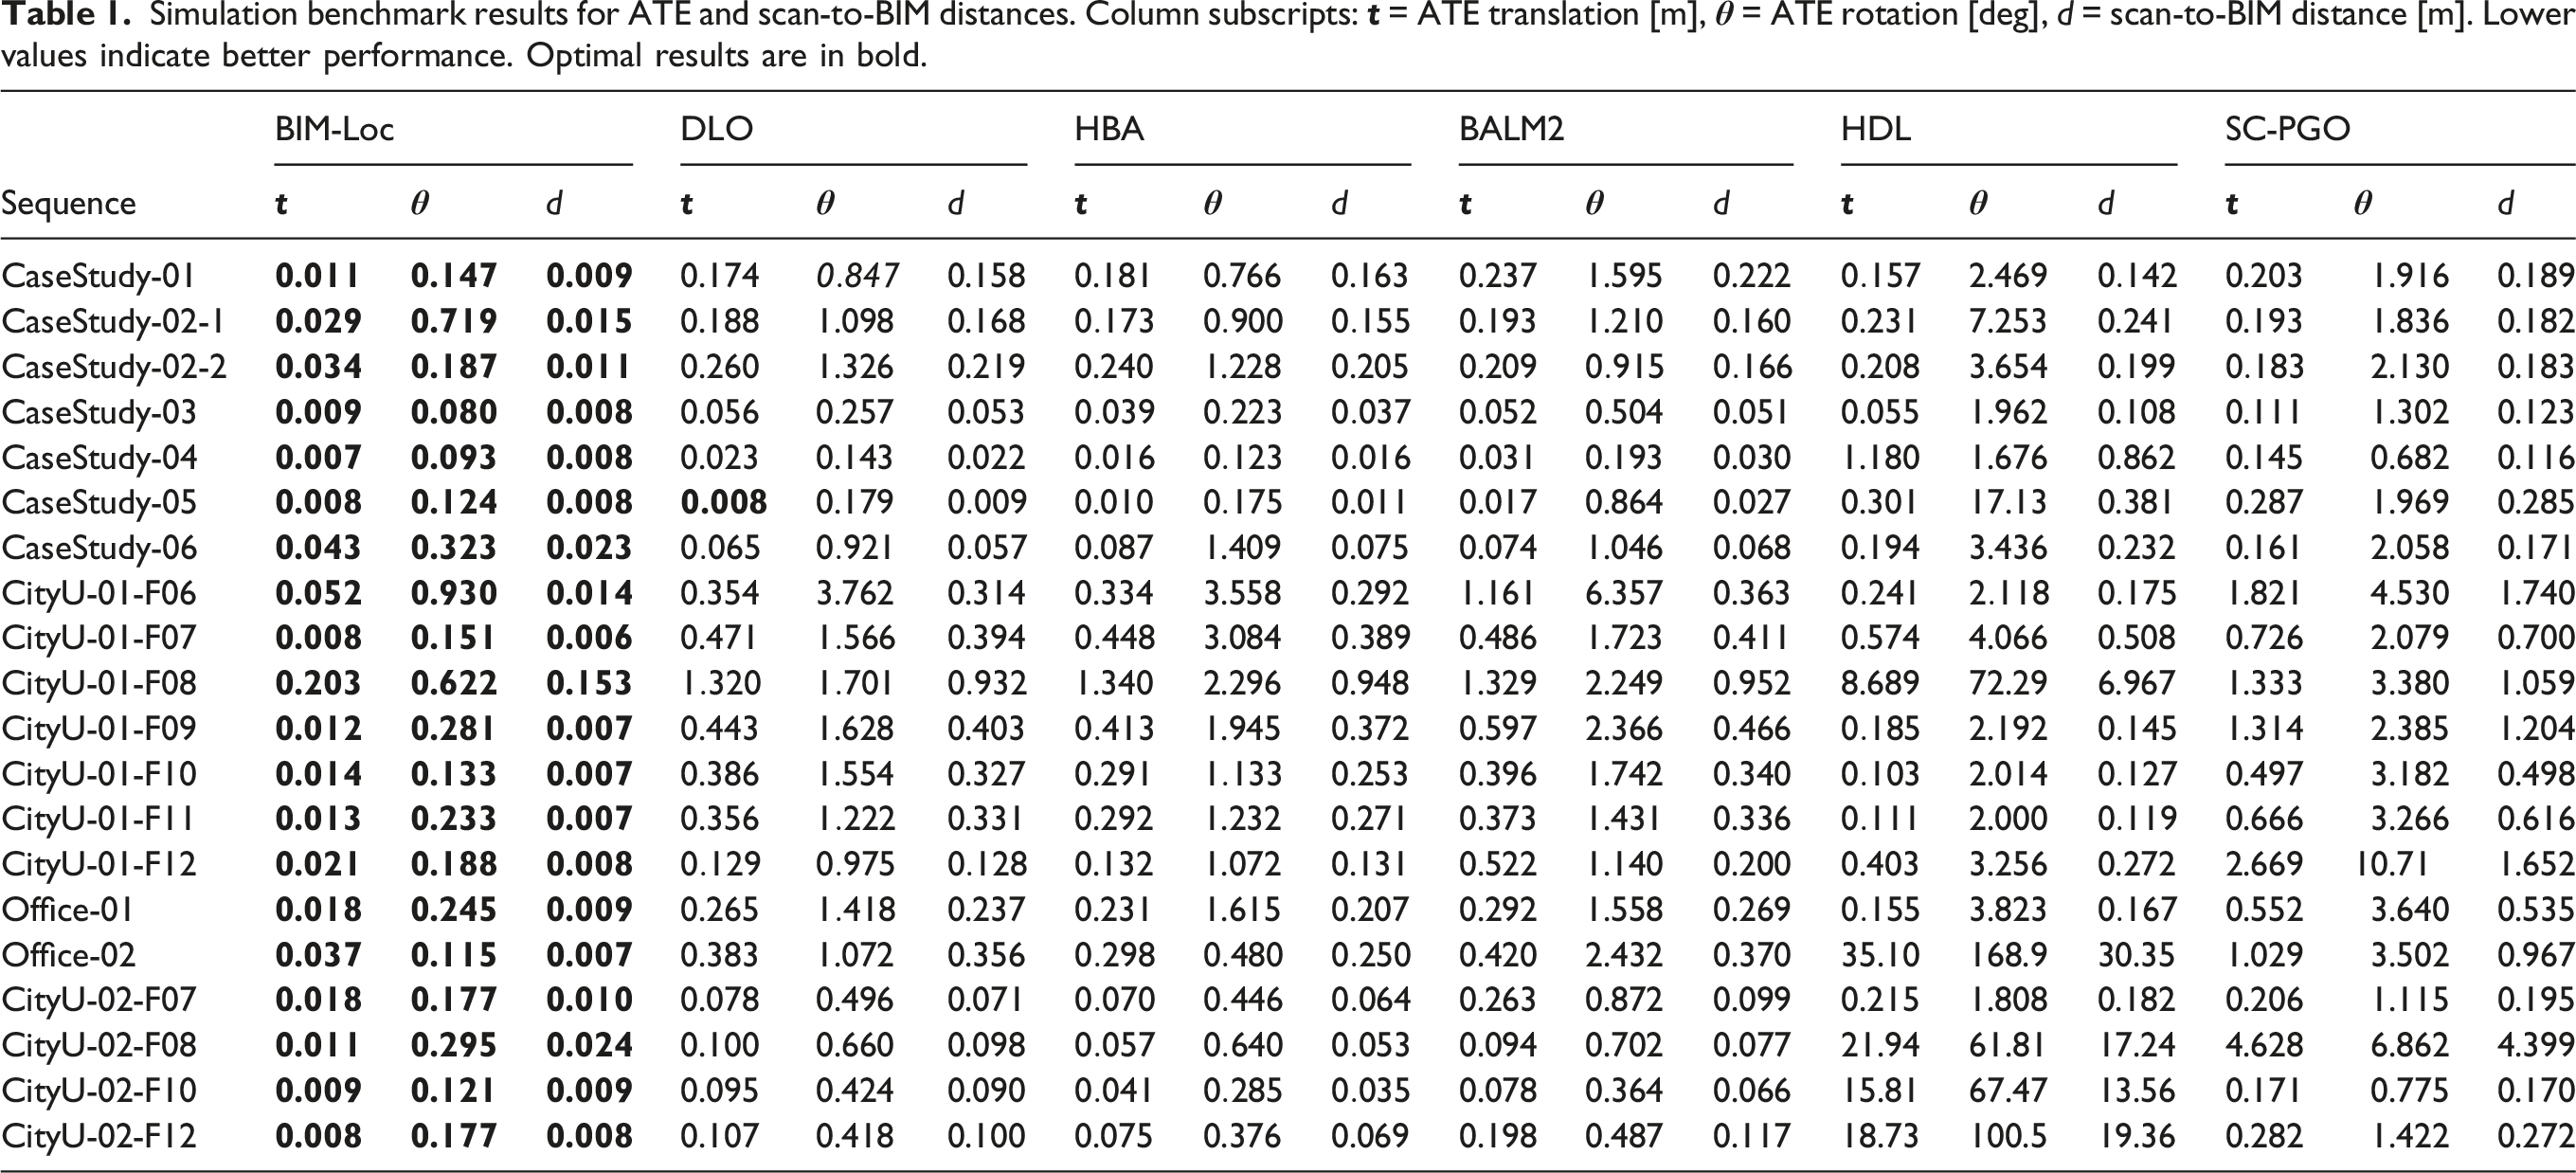
Simulation benchmark results for ATE and scan-to-BIM distances. Column subscripts:
In Figure 10, the MME ratios are divided into three performance tiers. BIM-Loc alone occupies the top tier with a ratio of 95.73 ± 0.99%, significantly outperforming the DLO odometry (91.79 ± 1.17%) in the second tier. HBA and BALM2 also fall into the second tier (90.71 ± 1.03% and 91.03 ± 1.37%, respectively). The substantial gap between the first and second tiers underscores the impact of incorrect data association in HBA and BALM2, reducing their performance to the level of DLO odometry. SC-PGO and HDL belong to the third tier. BIM-Loc’s superior MME ratios reflect excellent local spatial consistency in the aggregated map and, according to Kornilova and Ferrer (2021), indicate the lowest relative pose errors among all methods, confirming its overall advantage. MME ratios for evaluated methods across data sequences in the simulation benchmark. Performance is grouped into three tiers, with BIM-Loc consistently ranking first.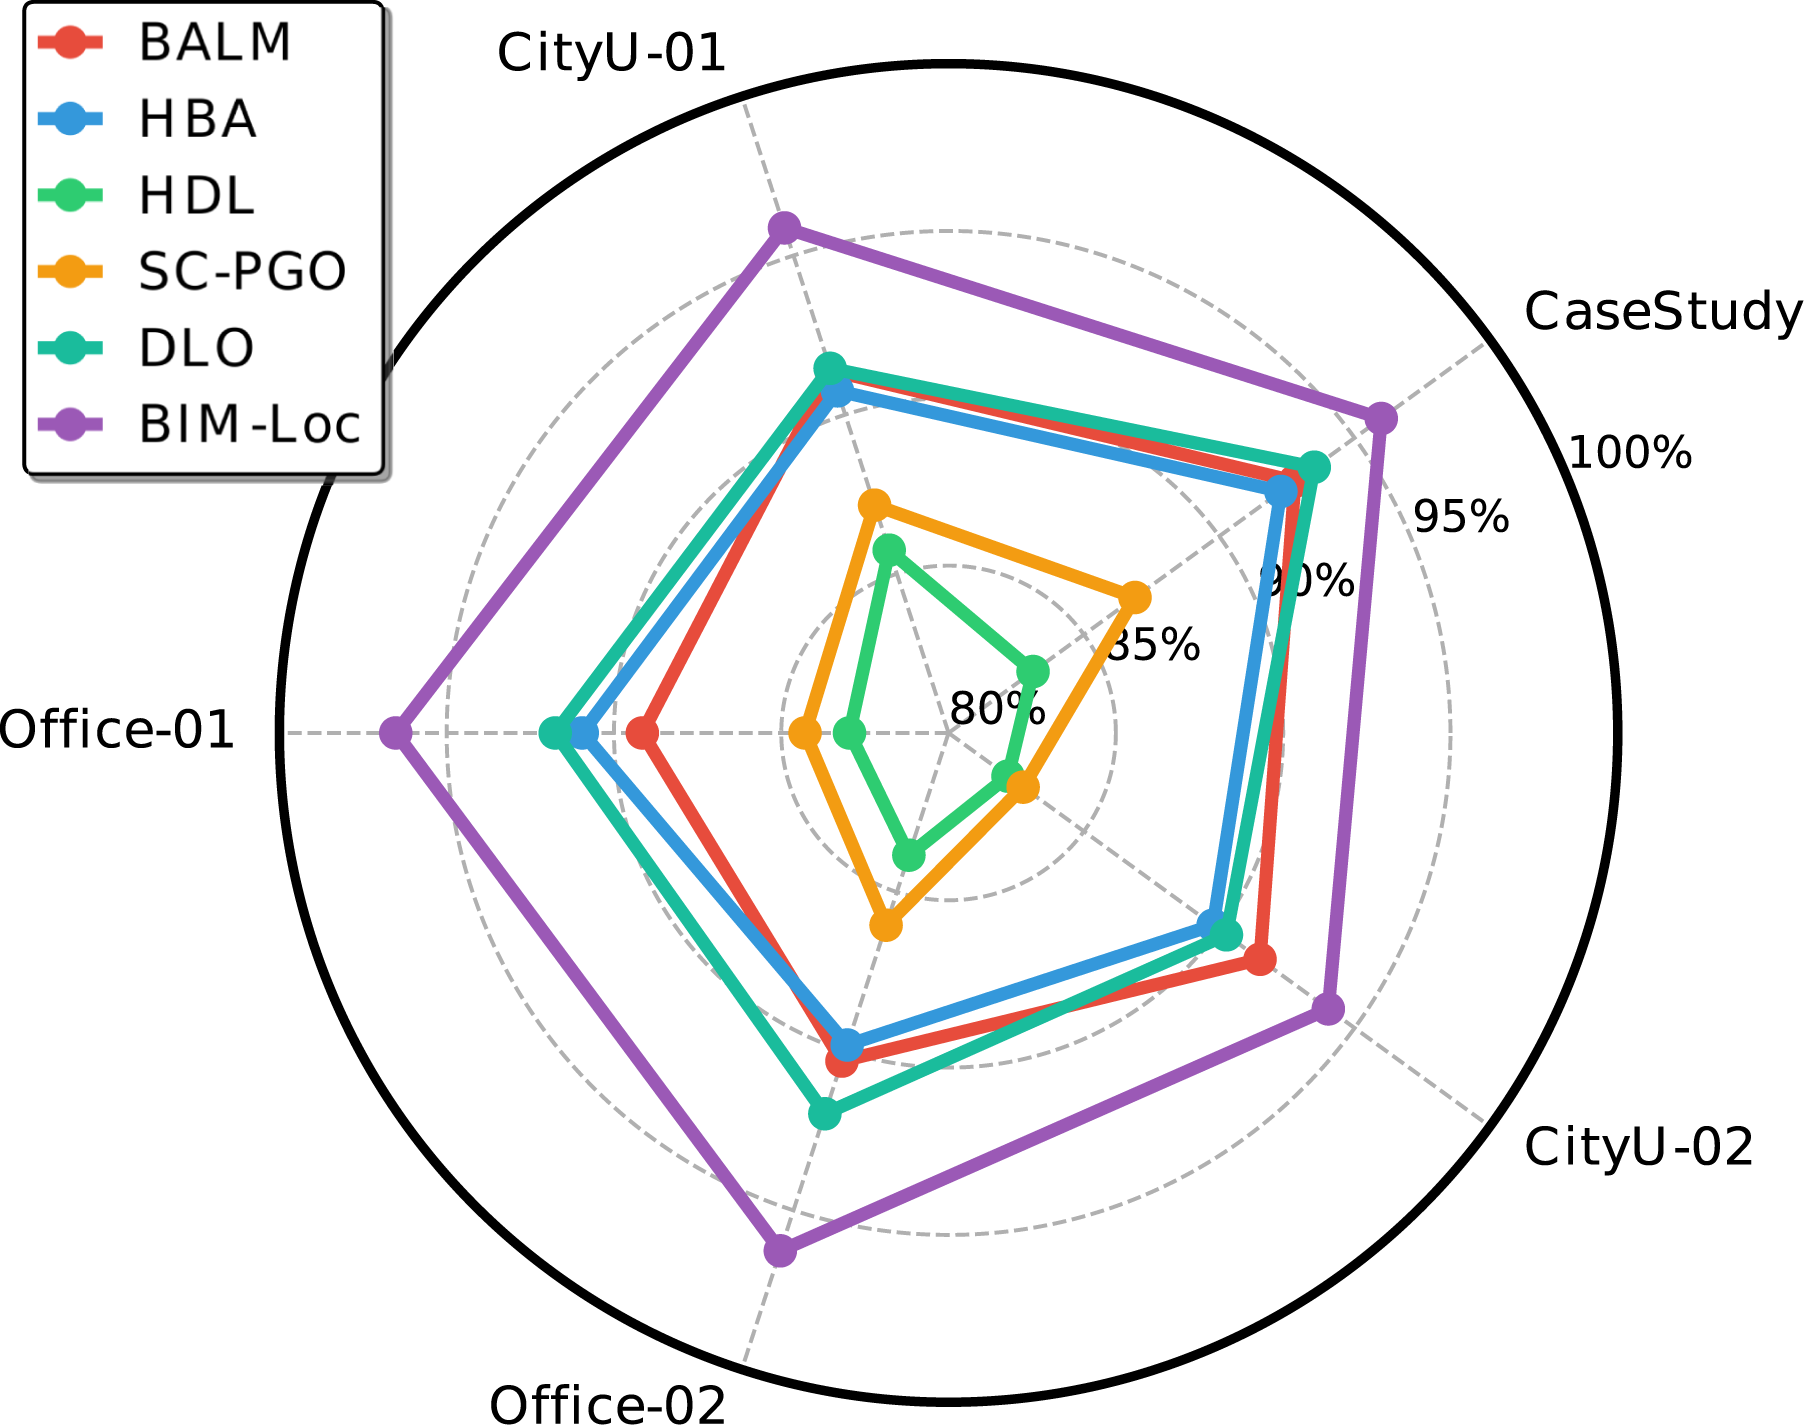
Figure 11 presents box plots of Wasserstein Distance (WD) errors, evaluating global consistency between the aggregated and BIM maps. BIM-Loc achieves the lowest WD errors by effectively integrating BIM models. As with the ATE and MME evaluations, the complex layouts of CityU-01 degrade the performance of offline BA-based methods (HBA, BALM2) compared to CityU-02. Conversely, HDL benefits from map priors and performs better in CityU-01, confirming that map priors can enhance indoor localization accuracy. Overall, BIM-Loc maintains strong performance across all sequences by deeply integrating BIM models into a pose graph optimization framework, effectively bounding localization errors and ensuring tight consistency within the BIM coordinate system. Wasserstein distance errors for evaluated algorithms in the simulation benchmark. Box plots show median WD values (logarithmic y-axis). Results for unmodified BIM models (left of dashed line) and synthetic BIM models (right) are grouped separately.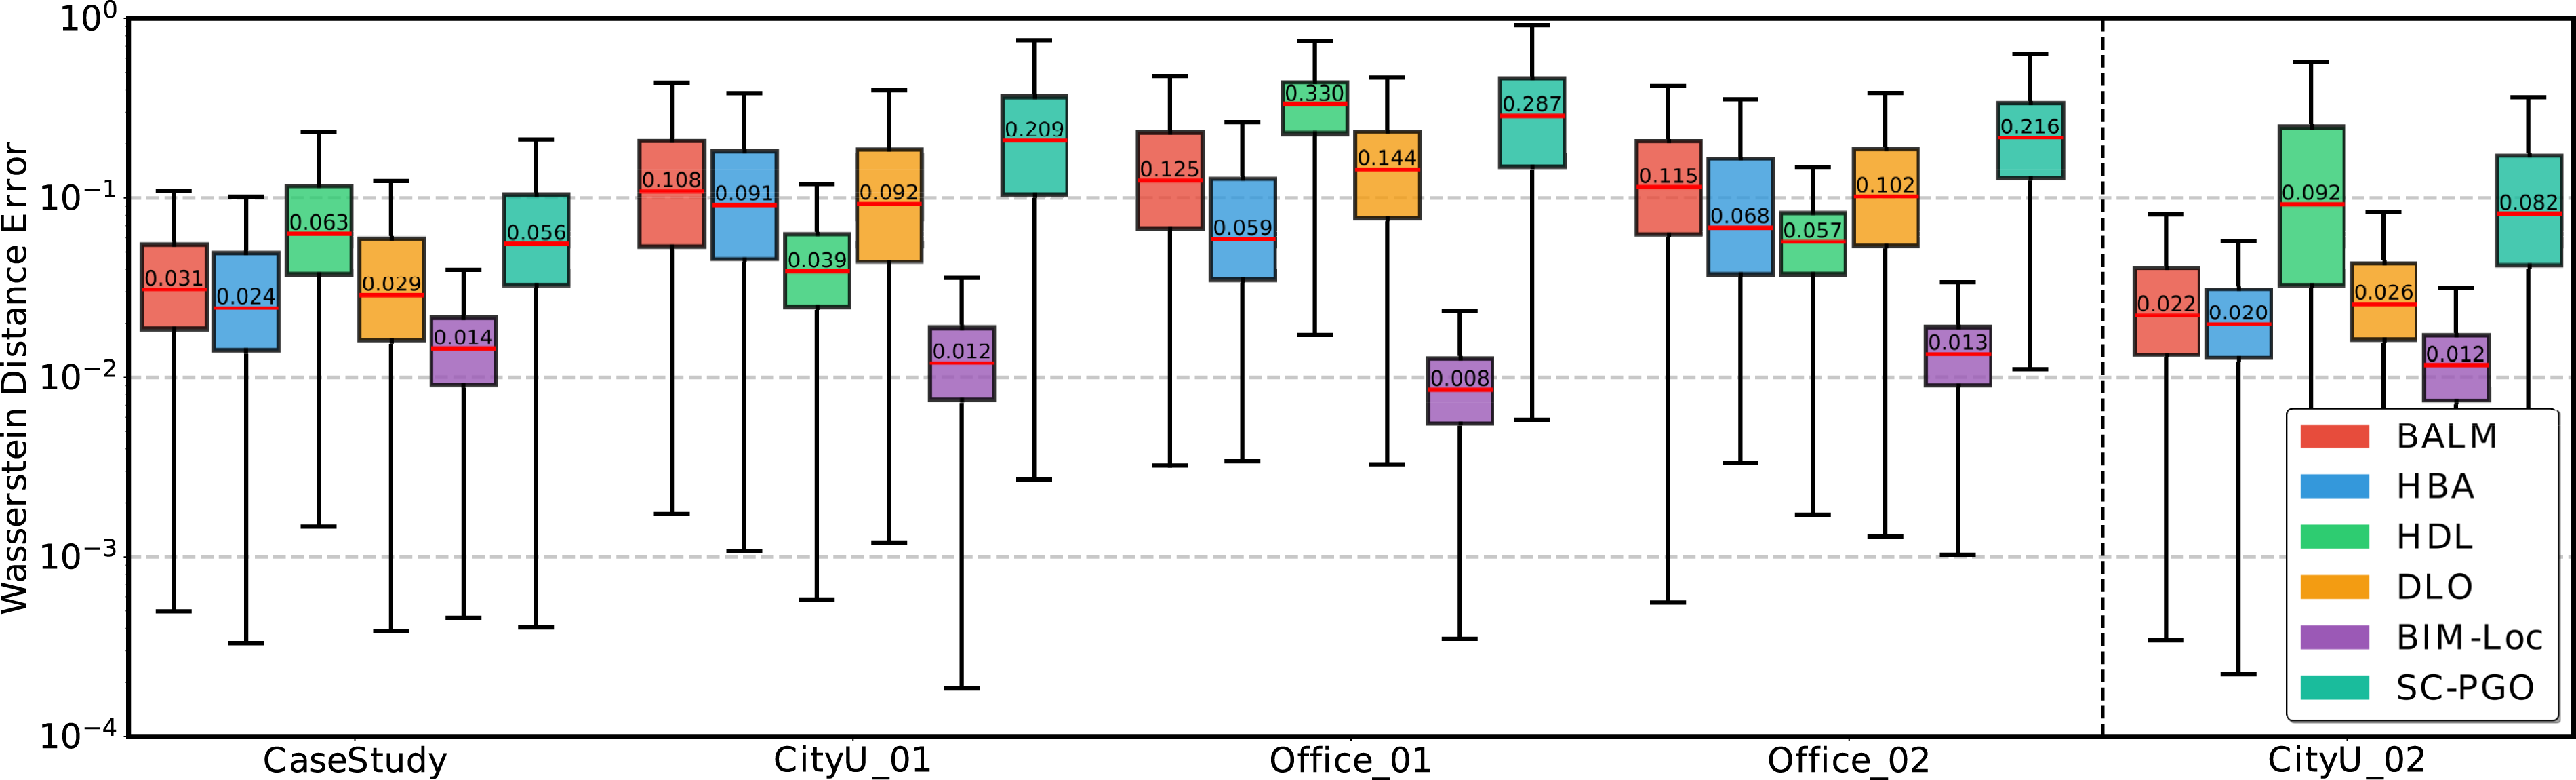
Precision, recall, and F1-score values of discrepancy detection performance in four CityU-02 sequences in simulation benchmark.
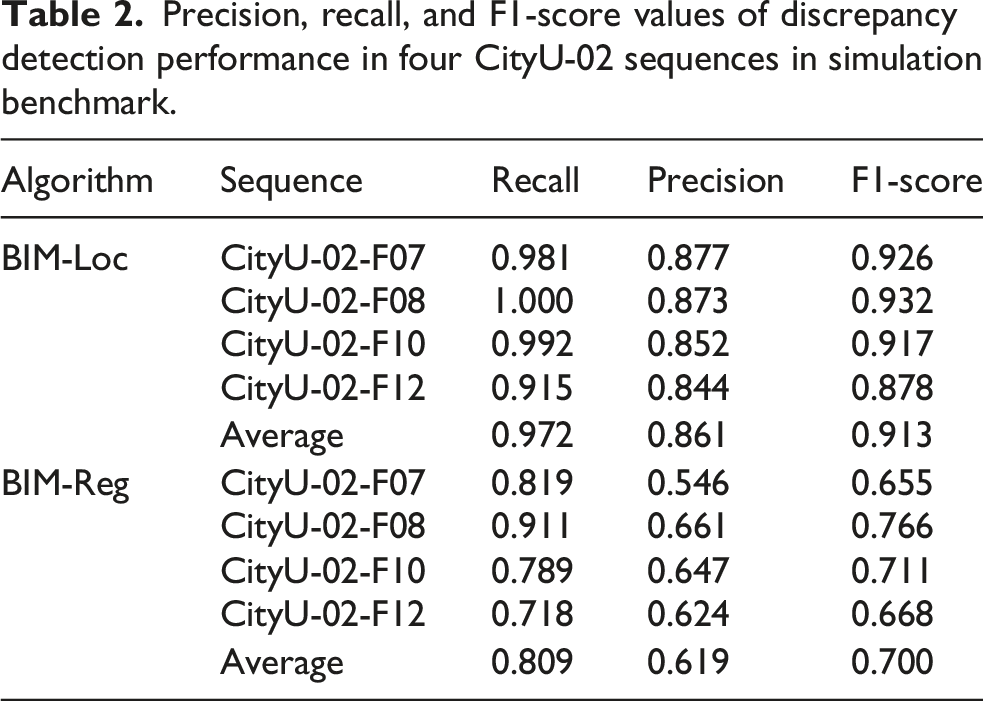
Such conservative estimates have minimal negative impact in practice, as shown by the visualization of discrepancy detection results for the four CityU-02 sequences in Figure 12. The wrapped texture maps (first row) demonstrate the performance of BIM surface mapping via Bayesian kernelized inference. As described in Section 3.2, hit and miss statuses from multi-hit ray casting are recorded on the texture maps. The pixel-level details in these texture images clearly distinguish decorative walls from surrounding structures, corroborating the high recall values in Table 2. Using the hierarchical probabilistic model (Section 3.4.1), discrepancy predictions for each structure are generated and displayed as discrepancy maps (second row). These maps use a three-color scheme: blue for finished structures, orange for unfinished structures, and gray for unknown regions due to insufficient observation. Discrepancy detection results for CityU-02 data group. Top row: texture maps for Floors 07, 08, 10, and 12. Bottom row: corresponding discrepancy maps showing built (blue) and unbuilt (orange) structures.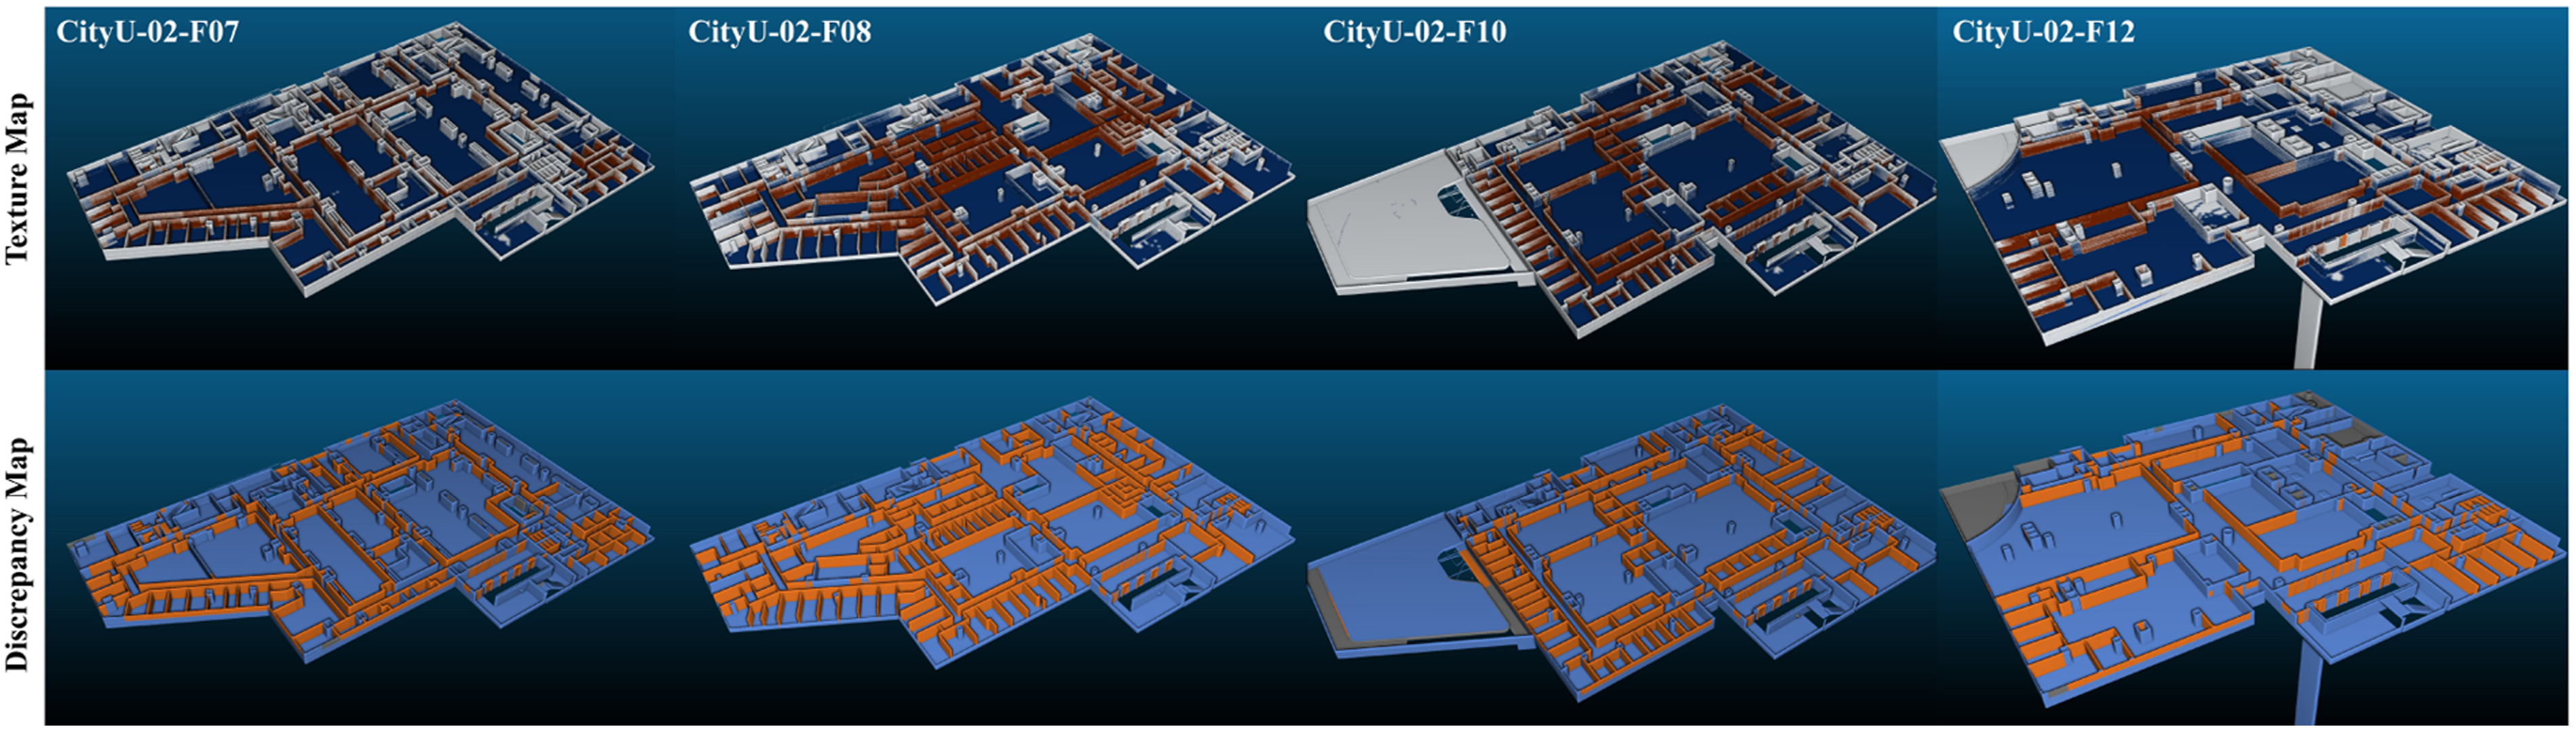
4.2. Real-world application
To complement the simulation benchmark, we conducted a series of real-world experiments. A key distinction from simulation is that real-world scans often contain significant occlusions from objects not represented in the BIM models. These occlusions can mislead algorithms, leading to incorrect data association and degraded localization performance. Additionally, similar to the CityU-02 simulation scenario, unfinished building structures further challenge localization accuracy. To fully evaluate the impact of BIM-reality inconsistencies throughout the building lifecycle, we selected two distinct environmental settings with corresponding BIM models: one representing the construction phase and another representing the usage phase.
The first set of experiments utilizes the SLABIM dataset (Huang et al., 2025), which includes BIM models of a multi-floor office building at the Hong Kong University of Science and Technology (HKUST). Data were collected using a handheld sensor suite featuring a Livox Mid-360 LiDAR sensor with a built-in IMU. This dataset captures typical office environments including corridors, rooms, lobbies, and lounges. As shown in the upper part of Figure 13, discrepancies between the BIM and reality primarily stem from interior decorations, furnishings, and other office elements not modeled in the BIM, which contains only structural components (walls, floors, columns, doors). This setup provides a realistic testbed for evaluating localization adaptability in operational settings and assessing potential for service robot applications. Real-world evaluation benchmarks representing different building lifecycle phases. The HKUST office benchmark assesses localization in a completed building using a handheld Livox Mid-360 sensor with built-in IMU. The CityU construction benchmark evaluates performance in an active construction environment with significant BIM-reality discrepancies, using both Ouster OS0-128 and Livox Mid-360 sensors to enhance evaluation diversity.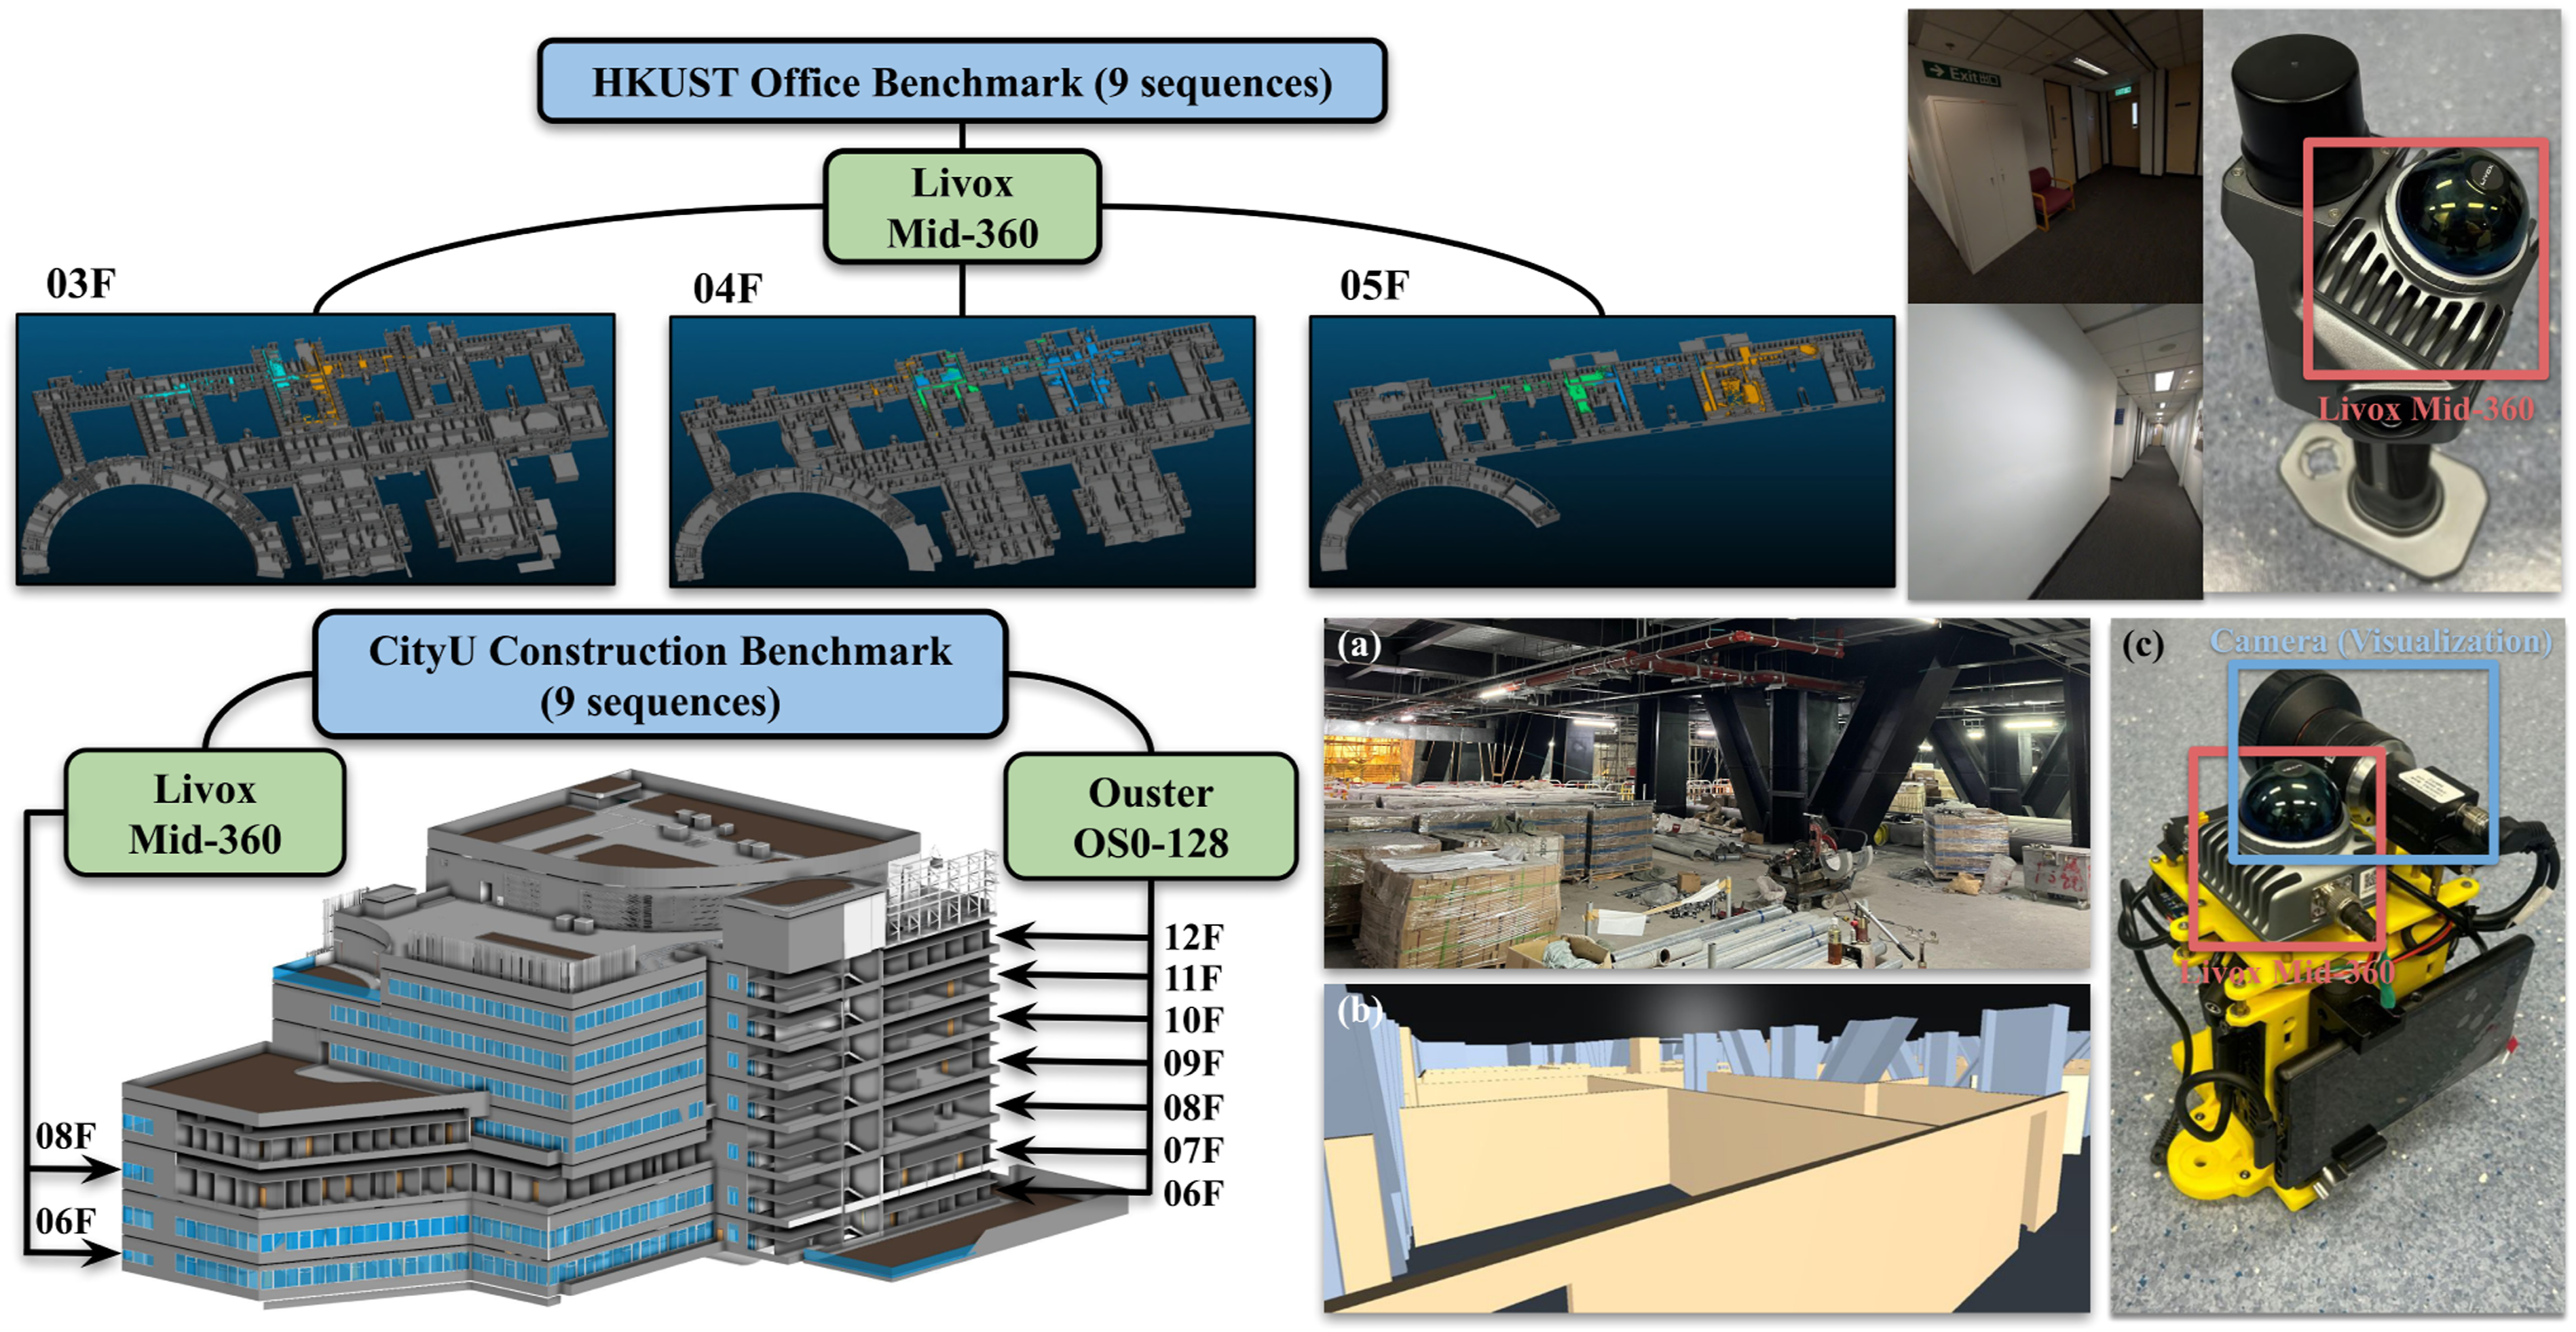
The second set of experiments focuses on the construction phase, using the same CityU BIM models from the CityU-01 and CityU-02 simulation benchmarks. Unlike the synthetic data, these sequences were recorded directly at active construction sites using two different LiDAR sensors (Ouster OS0-128 and Livox Mid-360) to enhance data diversity. Each data sequence includes LiDAR scans and synchronized IMU measurements. As illustrated in the bottom part of Figure 13, the CityU construction sites exhibit significant BIM-reality discrepancies arising from unfinished structures, construction materials, and temporary equipment (e.g., ladders, pipes, trolleys). This scenario validates localization performance under challenging conditions and demonstrates the method’s potential for construction inspection tasks.
4.2.1. Benchmark
Using the available BIM models and sensor data, we established two distinct real-world benchmarks: an office benchmark (HKUST) and a construction benchmark (CityU). The data organization for both is illustrated in Figure 13. For the office benchmark, data from Floors 03 to 05 of the SLABIM dataset were selected. Each floor includes three sequences corresponding to different regions (01, 02, and 03), resulting in a total of 9 sequences with a combined path length of 1920 m. For the construction benchmark, data were organized by floor and sensor type. Seven sequences were collected using a handheld Ouster OS0-128 sensor suite, covering construction sites from Floor 06 to Floor 12. Additionally, data sequences from Floor 06 and 08 were recorded using a Livox Mid-360 sensor. A camera was included in the sensor suite for visualization purposes only. In total, 9 data sequences with a combined path length exceeding 3.5 km were used for evaluation.
4.2.2. Baselines
Two state-of-the-art map-based algorithms utilizing both LiDAR and IMU data were evaluated in these real-world scenarios: (1) Fast-LIO-Localization (Fast-Loc) (HViktorTsoi, 2021), which extends the original Fast-LIO with a global alignment operation between map priors and the locally accumulated map; (2) the recently published PALoc (Hu et al., 2024), a state-of-the-art map-based localization approach. Additionally, CAD-Mesher (Jia et al., 2025) and LIO-BIM (Stührenberg and Smarsly, 2025) are included to evaluate localization performance under different map representations. BIM-Loc utilizes the raw BIM data directly, while for the other two methods, point cloud maps were generated by sampling points from the BIM model surfaces. All algorithms were evaluated on the same data sequences. Note that point clouds reconstructed from real-world observations were not available for any of these methods.
4.2.3. Metrics
For the office benchmark, which possesses ground truth trajectories, localization performance was evaluated using ATE, MME, scan-to-BIM distance errors, and Wasserstein distance errors. For the construction benchmark, where ground truth trajectories were unavailable, performance was assessed using MME, scan-to-BIM distance errors, and Wasserstein distance errors. In addition, the discrepancy detection results of BIM-Loc were visualized, then its localization performance was further validated qualitatively by comparing images from the actual scenes with corresponding renderings from the BIM model based on the estimated poses.
4.2.4. Result analysis
The experimental results from the two benchmarks are organized and presented below according to the evaluation metrics. We first describe the results from the office benchmark, followed by those from the construction benchmark.
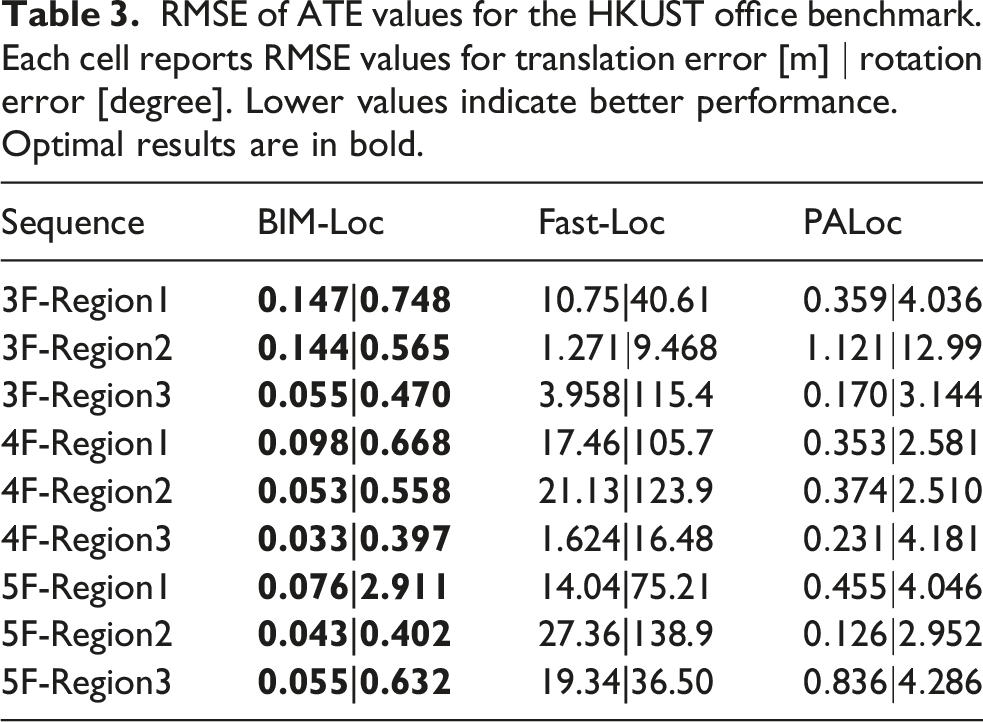
RMSE of ATE values for the HKUST office benchmark. Each cell reports RMSE values for translation error [m] ∣ rotation error [degree]. Lower values indicate better performance. Optimal results are in bold.
As shown in Figure 14(a), a significant gap in MME ratios exists between BIM-Loc (93.13 ± 2.94%) and the other two methods (Fast-Loc: 84.82 ± 0.94%, PALoc: 85.10 ± 2.55%). This gap is consistent across all test sequences. Although Fast-Loc and PALoc alternate in securing the second place across individual sequences, their average MME ratios are nearly identical (84.82% vs 85.10%). MME ratios for evaluated methods in two real-world benchmarks. BIM-Loc achieves the highest ratios, with a substantial performance gap in the HKUST office benchmark and a smaller but consistent lead in CityU construction benchmark.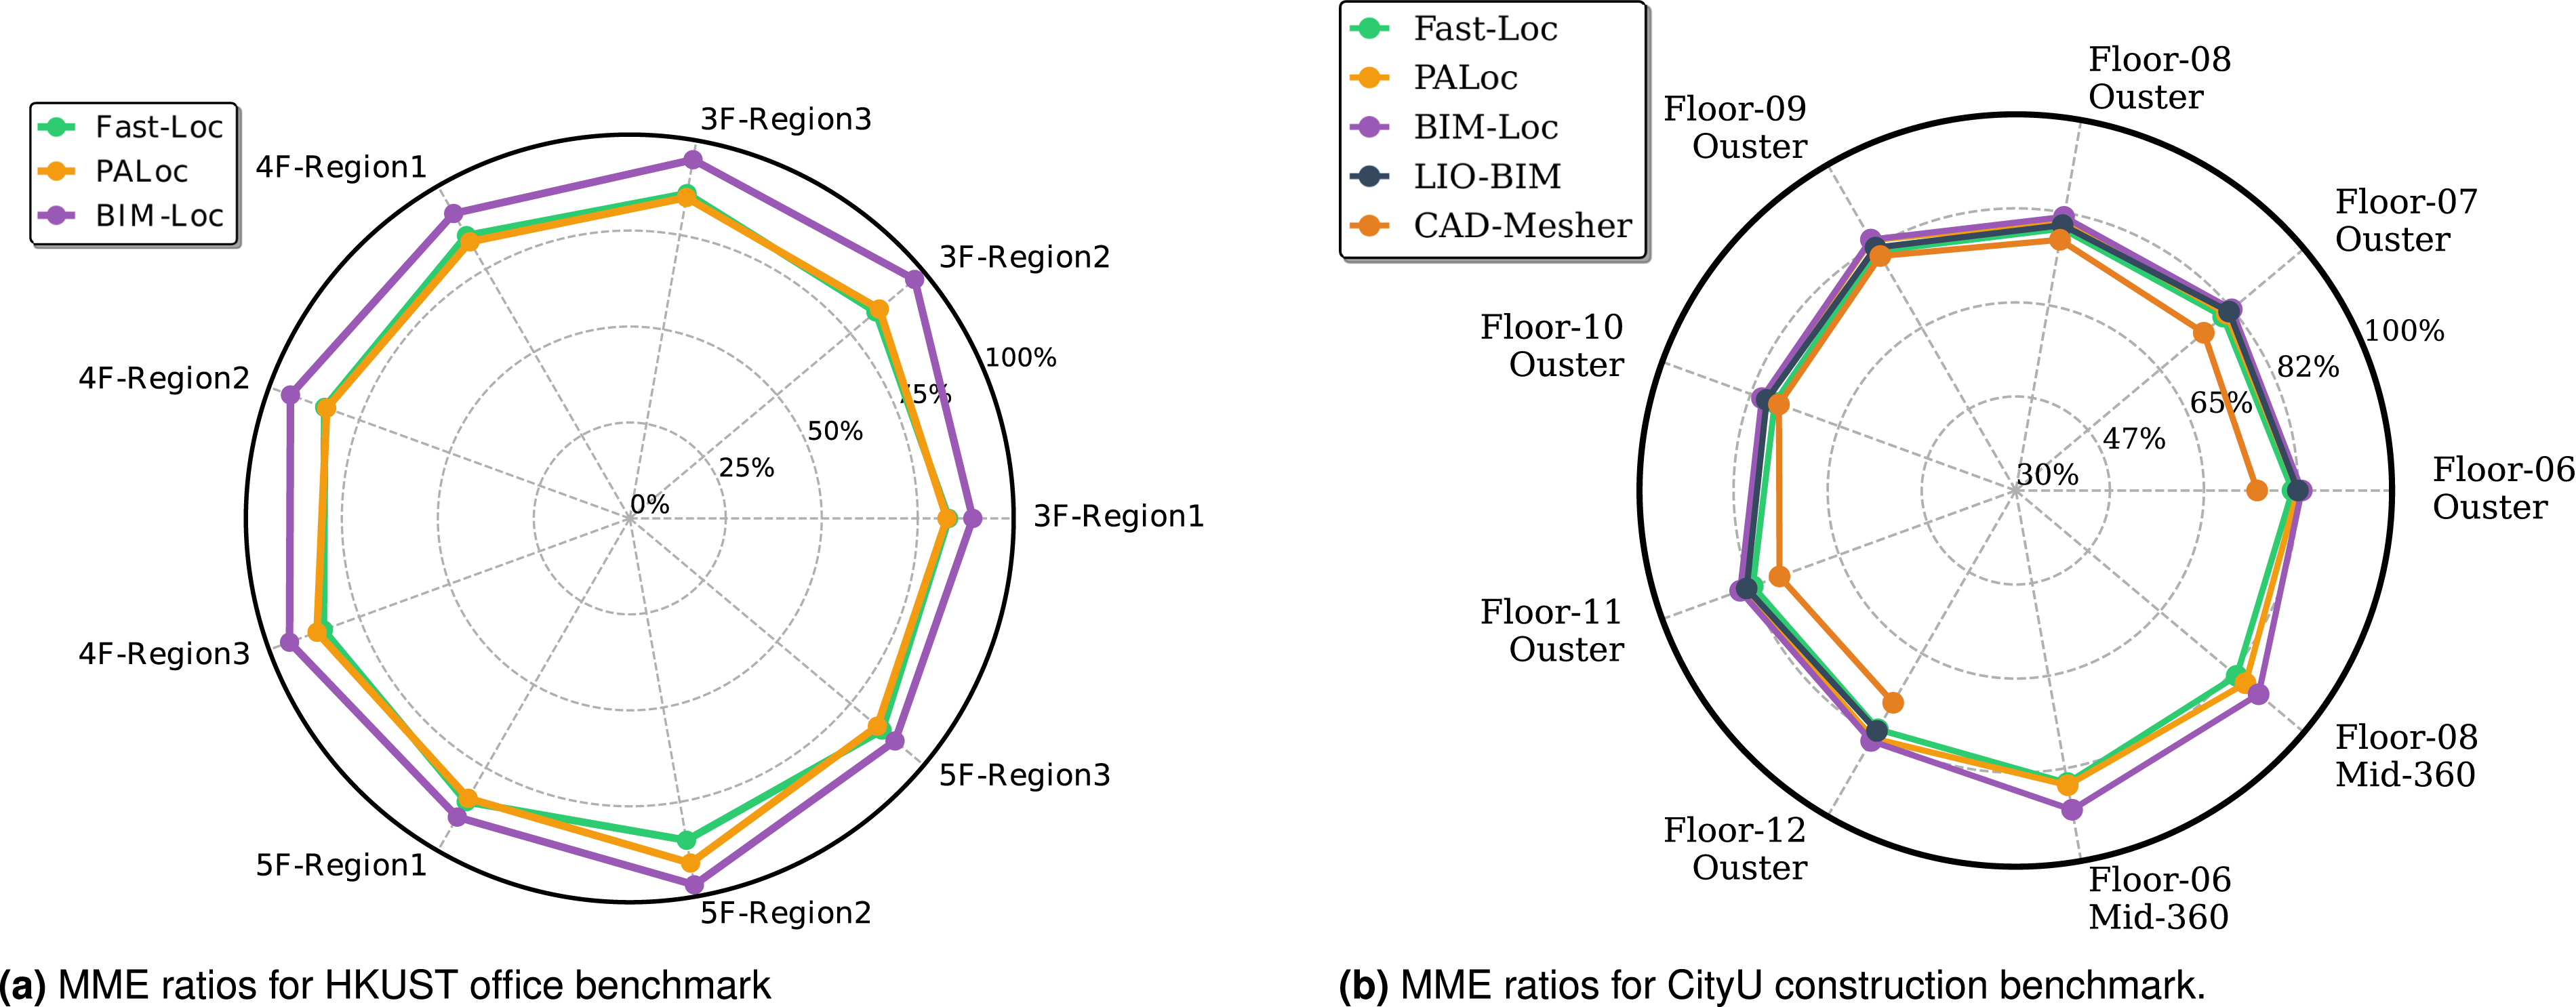
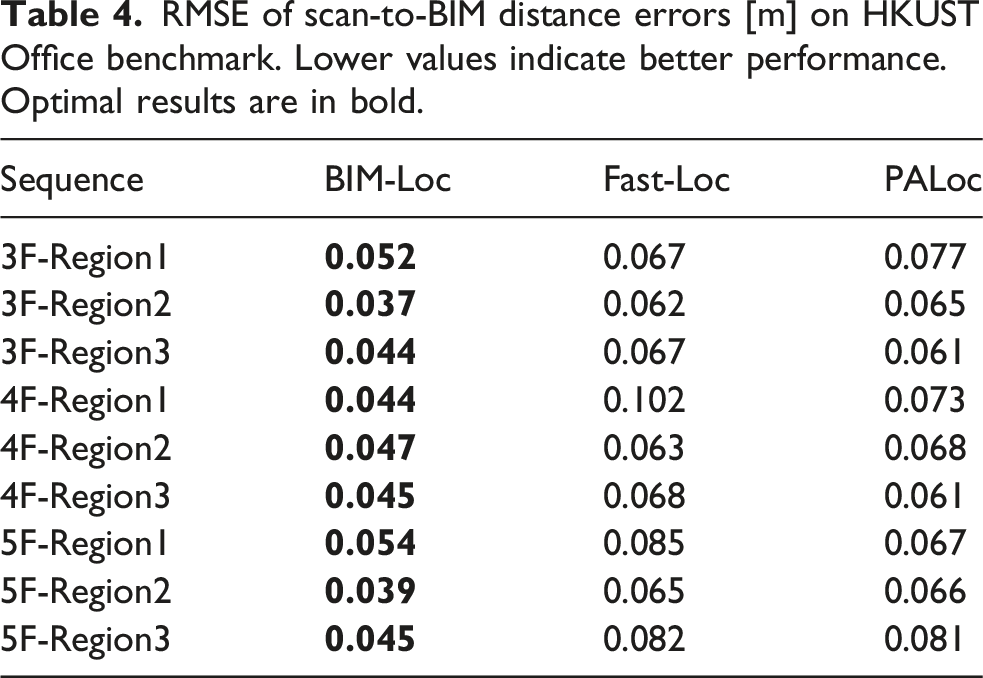
RMSE of scan-to-BIM distance errors [m] on HKUST Office benchmark. Lower values indicate better performance. Optimal results are in bold.
Similar trends are observed in the WD errors (Figure 15). BIM-Loc consistently shows the lowest first quartile (Q1) values and maintains smaller error magnitudes, reflecting its stable performance when using BIM as a reference. The median error values (represented by the red line in the box plots) also highlight BIM-Loc’s advantage across regions. Additionally, BIM-Loc’s error spread is narrower in most sequences, with no extreme high-error outliers that may appear in Fast-Loc or PALoc, further proving its resilience to environmental variations across different floors and regions in complex office scenarios. Wasserstein distance errors for evaluated methods in the HKUST office benchmark. Red lines indicate median WD errors within each box plot.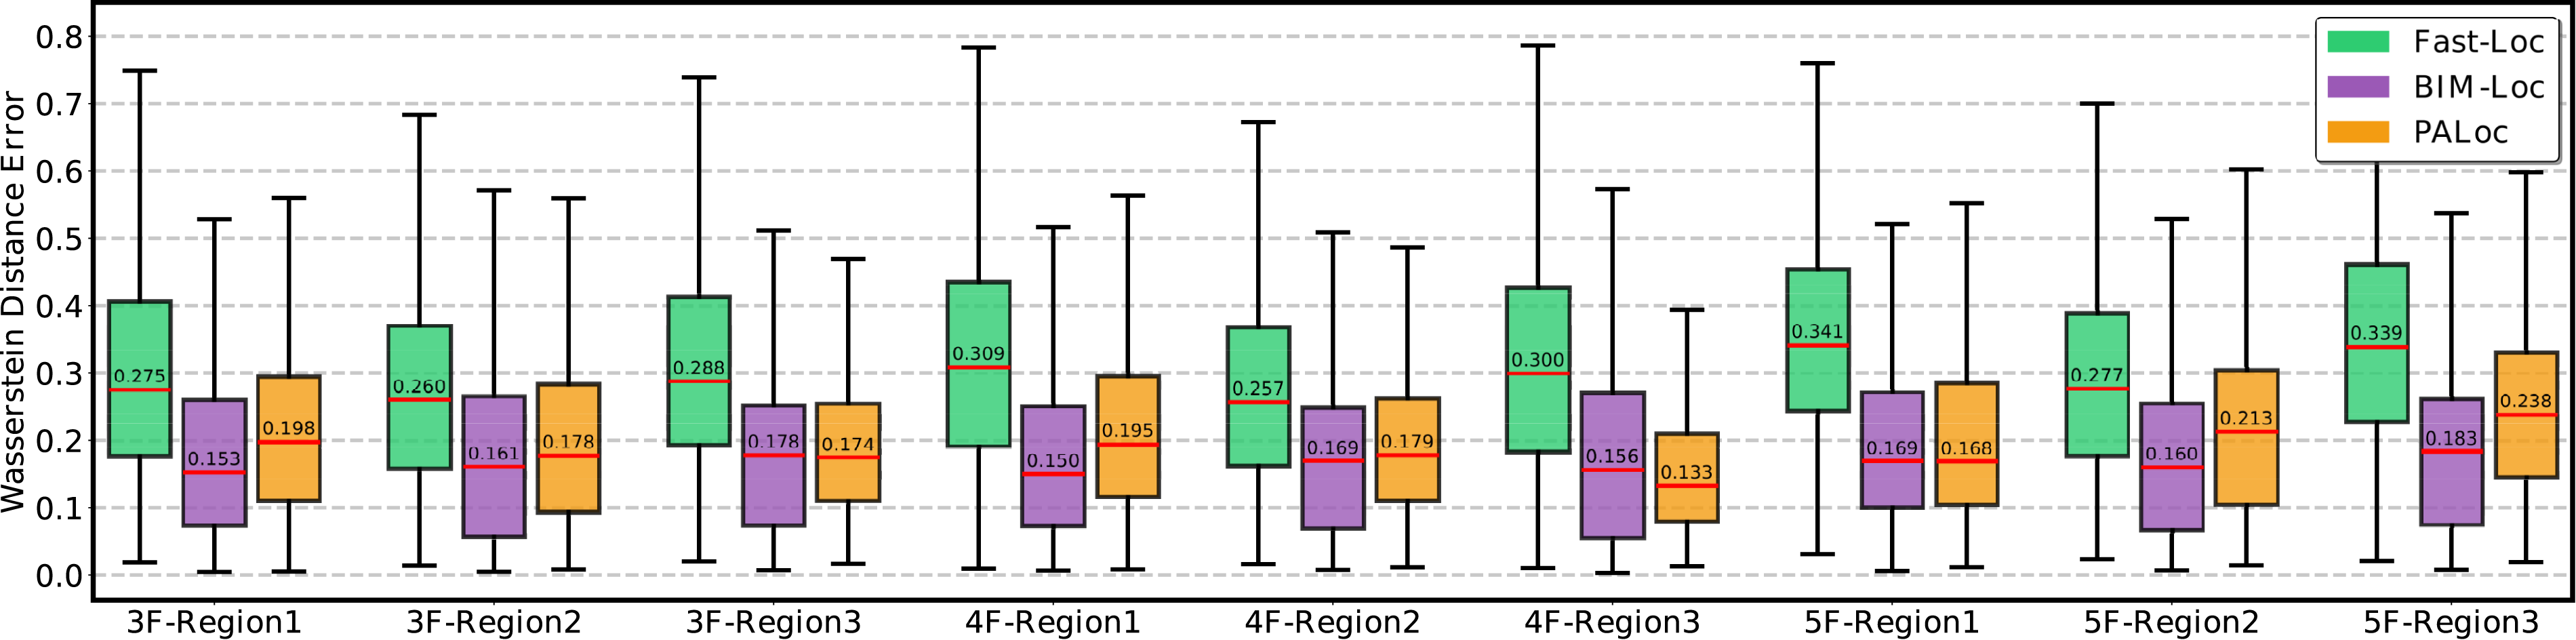
RMSE of scan-to-BIM distance errors [m] on CityU Construction benchmark. Lower values indicate better performance. Optimal results are in bold.
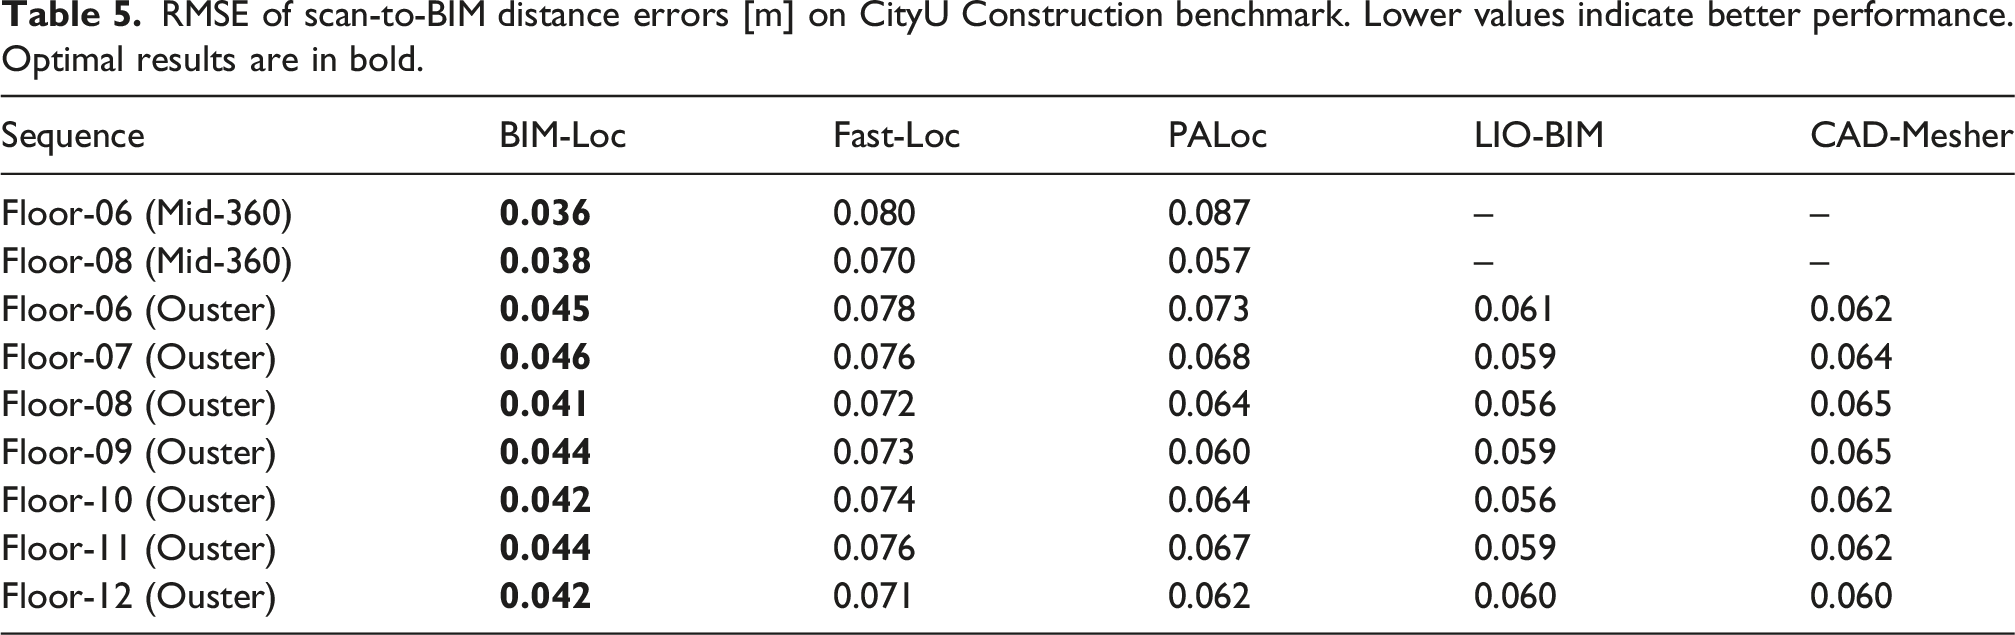
WD errors (Figure 16) show that BIM-Loc maintains the best overall performance in terms of global consistency between aggregated maps and BIM models. For Ouster sequences, its errors cluster tightly between 0.119 and 0.150 (e.g., 0.119 on Floor-09 vs PALoc’s 0.126). For Livox sequences, it retains an edge with values of 0.145 (Floor-06) and 0.128 (Floor-08). The narrow data range of BIM-Loc’s errors further confirms the consistency between BIM and accumulated scans. Wasserstein distance errors for evaluated methods in the CityU construction benchmark. Results left of the dashed line correspond to Ouster OS0-128 sensor data; right side corresponds to Livox Mid-360 sensor data. Red lines indicate median WD errors.
Furthermore, localization performance is visually validated through camera imagery. Using the sensor suite from Figure 13, we compare real-world footage from CityU construction sites with BIM-rendered images from the same camera poses. As shown in Figure 17 (rows 2–5), six image pairs (A–F) are presented for each floor. Each pair includes a real scene image (A, C, E) and a blended image overlaying the BIM rendering (B, D, F). For clarity, only structures present in the real scenes are included in the BIM renderings, with color coding for different types (e.g., walls: olive green, floors: red, H-shape beams: purple). In Floors 06 and 08, the purple H-shape beams in the BIM renderings show perfect overlap with their real-world counterparts throughout the localization tasks. Localization and discrepancy detection results of BIM-Loc in the CityU construction benchmark. Top row: estimated trajectories in BIM coordinates for Floors 06 and 08. Middle rows: real construction site images (A, C, E) and corresponding BIM-rendered overlays (B, D, F). Bottom row: texture maps and discrepancy maps generated during localization.
The final row of Figure 17 illustrates the wrapped texture and discrepancy maps. Due to incomplete scan coverage, the texture maps use three colors to represent status: miss (orange), hit (blue), and unknown (white). These maps reflect data coverage during inspection. Decoration walls are accurately recorded and labeled in both texture and discrepancy maps. For example, in Floor 06, an H-shape beam embedded in a concrete column is not observed during inspection but is correctly labeled as unknown. Additionally, triangular H-shape beams behind tightly covered decoration walls are clearly distinguishable.
5. Discussion
In our BIM-Loc method, BIM prior is the dominant contributor: by constraining estimates to structurally plausible configurations, it yields the largest quantitative gains in accuracy and long-term robustness. Discrepancy handling provides a secondary yet essential improvement: its primary role is defensive, refining residuals arising from unmodeled variations and preventing false constraints from degrading performance. Data association operates as an algorithmic enabler: it establishes reliable BIM-to-sensor correspondences in real time without introducing computational overhead. Thus, the quantitative performance gains stem mainly from the BIM prior and discrepancy handling, while data association preserves the real-time capability that makes these gains practically attainable. A few details of BIM-Loc method will be discussed in the following sections.
5.1. Computational scalability
In design, BIM-Loc is computationally scalable despite the seemingly intensive components (multi-hit ray casting, facet-based clustering, and hierarchical Bayesian updates). BIM-aided trajectory optimization uses iSAM2 in GTSAM for incremental inference with partial relinearization and variable reordering, so the per-step cost grows only with the locally affected region rather than the full trajectory. Second, multi-hit ray casting relies on a BVH built once offline with O(N log N) complexity in the number of BIM triangles; at runtime, the cost is dominated by the number of rays and their maximum range and is effectively decoupled from global mesh size. Third, facet-based clustering exploits a precomputed dictionary from (Geometric ID, Primitive ID) to facet IDs, allowing O(1) lookups. Hierarchical Bayesian updates are also applied incrementally on this sparse factor graph, supporting deployment in large, complex buildings. For details of runtime analysis, please refer to Appendix D.
5.2. BIM map for localization tasks
BIM models play a pivotal role in our BIM-Loc method. Their technical characteristics align deeply with the requirements of practical indoor localization, offering significant advantages over traditional 3D representations like point clouds and voxels.
First, the lightweight nature of BIM effectively addresses storage and computational challenges. While point clouds accurately capture spatial morphology, their massive data volumes impose high memory and computational burdens during data loading. In contrast, BIM employs structured geometric topology and parametric attribute information (e.g., for walls and beams) to compress data volume, making it more suitable for mobile or embedded devices with limited computing resources. For example, in the construction benchmark, the BIM models for Floors 06 and 08 consume approximately 12.0 MB and 10.8 MB, respectively, whereas point clouds sampled from the same surfaces require 168.4 MB and 152.7 MB.
Second, BIM provides more stable geometric benchmarks for positioning. Point clouds are susceptible to scanning noise and occlusions, leading to uneven density and feature loss that can compromise the accuracy of normal vectors and other reference features. BIM, however, is built on design specifications or reconstructed structured models, ensuring clear topological relationships and consistent surface normals and corner features. This results in a more reliable positioning reference. Furthermore, BIM’s practicality extends across the entire building lifecycle. For new constructions, BIM is inherently available from planning and design phases, eliminating the need for additional modeling costs. For existing buildings, although laser scanning is required for reconstruction, the resulting BIM model supports long-term reuse, significantly reducing the storage and update overhead for spatial data in localization systems.
5.3. Texture map for discrepancy mapping
We selected texture mapping as the foundation for discrepancy detection due to its advantages in representation directness, storage efficiency, and resolution adaptability, which are superior to voxel-based association methods.
For information representation, texture maps directly encode the physical coverage status of building surfaces without requiring complex data association or feature mapping. Point clouds need interpolation to form continuous surfaces, a process prone to errors, while voxel methods rely on 3D grid discretization and filling rates, which struggle to accurately capture local surface discrepancies.
In terms of storage efficiency, the difference between 2D texture maps and 3D voxel data is substantial. For a 4000 m2 space like Floor 06 of the CityU construction benchmark, a texture map consumes approximately 5.0 MB, whereas a Truncated Signed Distance Function (TSDF) voxel representation requires about 823.4 MB. This demonstrates that texture maps significantly reduce the storage and transmission costs of discrepancy detection systems.
Additionally, texture maps support adaptive resolution automatically, enhancing both flexibility and accuracy. Under this setting, the texel size (
5.4. Impacts of real-world BIM imperfections
The practical deployment of BIM-Loc must account for imperfections commonly present in real-world BIM models. A primary category is as-designed versus as-built discrepancies, where the constructed facility deviates from the design model. These represent the core challenge that BIM-Loc is specifically designed to address. By explicitly modeling which BIM surfaces are confirmed as built versus un-built through the discrepancy detection module, BIM-Loc treats these deviations as structured priors rather than sensor noise. This capability has been validated on the real-world CityU dataset, which contains real as-built conditions. These considerations demonstrate the practical boundaries within which BIM-Loc is expected to perform reliably.
Beyond as-built deviations, LOD also governs localization performance. BIM-Loc defaults to LOD 300 because this level provides sufficient geometric accuracy for primary structural elements and their topological relationships. Higher LODs (
6. Limitations and future works
While the proposed BIM-Loc system demonstrates reliable indoor localization performance by leveraging BIM’s structural advantages and discrepancy detection capabilities, several limitations affect its broader applicability. First, the method requires an approximate initial position to initialize localization, restricting deployment in scenarios lacking prior positional information, such as initial exploration of unfamiliar buildings or emergency response missions. Second, the environment exploration process remains passive. During human-operated inspections, the absence of real-time density visualization prevents operators from intuitively assessing whether a surface has been sufficiently scanned in large scale environments. This lack of immediate feedback often results in either incomplete coverage requiring rework or unnecessary redundant sampling, compromising both operational efficiency and the feasibility of full automation.
Furthermore, BIM-Loc is a domain-specific localization framework applied in BIM-available buildings. Meanwhile, we fully take advantages of BIM models in localization tasks instead of fine-level mapping. The design of discrepancy detection relates to the only presence or absence of building elements. The geometric modifications of existing elements, such as shape changes, boundary shifts, thickness variations, or partial deformations are not considered. BIM-Loc achieves higher precision and robustness in construction monitoring scenarios at the cost of dependency on BIM models. Although BIM-Loc localization capability is designed to be robust under missing/extra building structures with random shifts shown in Table 9, BIM-Loc only provides structure-level existence checking instead of accurate mapping. It cannot provide quantitative analysis for amount of deviations. Instead, BIM-Loc focuses on robust localization under large real-BIM discrepancies.
To address these limitations, future work will pursue three possible directions. First, we will develop a global localization method using BIM models alone, integrating topological structures with multi-sensor data (visual features, inertial measurements) to estimate absolute positions without initial guesses, expanding applicability to new environments. Second, we will create a BIM-adapted exploration algorithm that autonomously plans optimal inspection paths based on BIM geometry, dynamically adjusting via real-time coverage feedback to align algorithmic assessment with operational needs. These enhancements will significantly improve BIM-Loc’s robustness and autonomy, better supporting applications in intelligent building maintenance, automated structural inspection, and autonomous patrols, advancing fully automated BIM-integrated structural health monitoring. Finally, not only BIM models, the scope of prior-map based localization can be extent to more general representation, such as triangle meshes. Under this setting, the ray casting strategy can also be utilized and the limitations of application domains by reconstructed mesh prior maps.
7. Conclusions
This paper presents BIM-Loc, a novel approach for accurate and robust localization in feature-sparse indoor environments where precise prior maps are unavailable. By using only as-designed BIM models, BIM-Loc overcomes the limitation of lacking pre-built maps through three key contributions: a multi-hit ray casting method for reliable online association between point clouds and BIM structures in 3D Cartesian and 2D texture spaces; a unified pose graph optimization framework integrating odometry, inter-scan consistency, and BIM-scan constraints to produce real-time BIM-aligned trajectories; and a Bayesian kernelized inference approach with hierarchical networks for incremental discrepancy identification from pixel to structural levels. Extensive evaluation on a custom BIM-robot simulator and real-world datasets shows that BIM-Loc significantly outperforms offline bundle adjustment methods and point-map-based approaches across five metrics. The results validate its robustness in sparse environments and effectiveness in providing both reliable localization and actionable discrepancy insights. BIM-Loc represents substantial progress toward practical BIM-integrated localization systems that operate throughout the building life cycle, from construction to completion, delivering both precise positioning and valuable structural monitoring capabilities (Supplemental material).
Supplemental material
Footnotes

Funding
The authors disclosed receipt of the following financial support for the research, authorship, and/or publication of this article: This work was supported by the Natural Science Foundation of China (62461160309), the NSFC-RGC Joint Research Scheme (N_HKU705/24), Hong Kong RGC (GRF 17201025, GRF17200924).
Declaration of conflicting interests
The authors declared no potential conflicts of interest with respect to the research, authorship, and/or publication of this article.
Supplemental material
Supplemental material is available online.