
Abstract
The U.S. buyout programs relocate households out of hazard-prone areas to mitigate future risk by converting developed land into open space. The open space is managed as a public resource by local government and can offer benefits to the community beyond flood risk reduction, such as ecosystem services, recreational activities, and social interaction. Although federal agencies’ funding buyout programs encourage communities to develop open space into an amenity for residents’ use, there exist minimal guidance, tools, and resources to help land managers identify uses that best meet community needs. Additionally, there remains minimal analysis of how residents use the acquired lands to help guide practitioners. Yet, existing scholarship encourages community engagement to identify postbuyout open space management needs and the use of empirical evidence to support land management decisions. To help meet these goals, we use the System for Observing Play and Recreation in Communities (SOPARC), to examine patterns of open space use, activity levels, and user demographics across five target areas within a buyout area along with Rush Creek in Arlington, Texas. Over a two-week period, we conducted 196 nonparticipant observations documenting patterns in recreation, time of use, and user characteristics. We found areas of the buyout with minimal or hidden amenities were underused, while areas with active recreational amenities, such as paved trails, dog parks, and playgrounds, had higher and more diverse use patterns. We also found that some groups, including Black and Asian residents, were underrepresented relative to nearby neighborhood demographics. These findings suggest that land managers can use the SOPARC method to identify where and what types of amenities to provide, guide outreach efforts to underrepresented groups, and prioritize ecological restoration in underused areas. This case study demonstrates the potential for extending the SOPARC method beyond parks and recreation studies to inform postbuyout open space management decisions.
Introduction
To mitigate against chronic and repetitive flood hazards, an increasing number of U.S. communities implement household relocation programs known as buyouts (Greer, Binder and Zavar 2021). Households that participate in buyout programs sell their homes to local governments, who then demolish the structures and maintain the land as open space in perpetuity. Most U.S. buyout programs are funded in part through federal grants from agencies, such as the Federal Emergency Management Agency and the Department of Housing and Urban Development, but some programs are solely funded by local governments as capital improvement projects. Regardless of funding source, deed restrictions are placed on acquired properties to prevent future structural development and to preserve the newly created open space.
As local governments assume ownership of the properties, they also take responsibility for management of the open space. Who manages the postbuyout open space varies by community; in some places, the acquired land becomes part of the responsibilities of emergency managers, while in others, departments of parks and recreation, public works, conservation, or flood control boards may serve as the land managers (Smith et al. 2023). Regardless of department, managing the postbuyout open space becomes an additional responsibility for often overextended local governments whose roles are expanding, especially those who carry emergency management titles or responsibilities (Siebeneck et al., 2022; Stehr 2007; Williams 2023). Moreover, there exist a range of open space management options (Shi et al. 2023). This variety ensures different communities can meet different needs, but it leaves a lot of choice to local governments on how to best manage the open space.
Communities can manage the open space via a range of land uses that provide utility and function for residents. Higher utility open space uses include ecological restoration (e.g., wetlands and prairies), recreation (e.g., playgrounds and athletic fields), and hazard mitigation (e.g., detention and drainage basins) Dascher et al., 2023. However, due to limited resources, many communities manage postbuyout open space for passive use by maintaining the land as mowed, vacant lots, which offer fewer services to the adjacent neighbors (Binder et al. 2020). Federal Emergency Management Agency encourages higher utility uses for buyout open space (FEMA 2008), especially the integration of nature-based solutions into management strategies that enable environmental processes to address societal issues, such as rain gardens to capture stormwater and mitigate urban flooding during heavy rains (FEMA 2021).
Although a growing body of work has examined land use and landscape design on postbuyout open space (Dascher et al., 2023; Rohmer 2017; Smith et al. 2023; Vanucchi et al. 2025; Zavar, 2015; Zavar, 2016; Zavar et al., 2023), very little empirical work assesses how residents passively and actively use postbuyout open space. Active leisure encompasses a range of physical activities, such as playing sports, while passive leisure include sedentary activities, such as reading a book or listening to music (Cetinkaya, Nese Sahin and Yariz 2017). Active leisure, especially when performed outdoors, has been shown to have positive impacts on physical and mental health across all age groups (Cetinkaya, Nese Sahin and Yariz 2017; Holder, Coleman and Sehn 2009). Moreover, spaces designed with multiple opportunities for active and passive leisure also increase local property values (Crompton 2001). Due to these benefits, urban planners, land managers, and local governments are increasingly incorporating spaces for active leisure and recreation in their communities (Daumann et al. 2015; Devarajan, Prabhakaran and Goenka 2020).
Buyouts provide one source of open space that can be managed for both active and passive leisure activities. However, little is known about how people use postbuyout open space, which leaves land managers with minimal data to inform design and management decisions. Given resource constraints, including time and funding, many land managers lack opportunities to collect empirical data on open space use. Despite leisure and recreation studies offering robust research on park land management strategies, which can guide the management of cultural and natural resources (Aly and Dimitrijevic 2022; Ferretti-Gallon et al. 2021; Winkler-Schor et al. 2024), buyout open space is characterized by ad hoc management and frequently lacks land use planning given the acquisition process (Greer, Binder and Zavar 2021). Therefore, the unique nature of how buyouts are created, their proximity to remaining housing stock, frequency of flooding, and the restrictions on their use, generate the need to examine these properties’ management independently of other types of open spaces.
To address this need, we propose the nonparticipant observation model, the System for Observing Play and Recreation in Communities (SOPARC) (McKenzie et al. 2006), as an effective tool for local governments to identify how residents use postbuyout open space and determine opportunities for improved land use, whether through increased amenities or ecological restoration. Therefore, in this study, we tested the use of the SOPARC method to understand its effectiveness for identifying postbuyout open space use and to gather empirical data on how people use postbuyout open space. Specifically, we analyzed five distinct locations, referred to as target areas in the SOPARC method, within a postbuyout open space to examine active and passive leisure activities, timing of use, and demographic characteristics of users at each location. Finally, we considered how active and passive land uses influence leisure activities in each target area. From this analysis, we offer recommendations for how local governments can use the SOPARC method and its data to inform open space management decisions.
Literature Review
Open space is a broadly used term that describes unbuilt areas of various sizes across many different ecosystems and environments (Maruani and Amit-Cohen 2007). The management of open space varies greatly, and the type of management directly affects the associated benefits the open space provides to the community. Management strategies range from passive to active approaches, or a mix of the two (Shi et al. 2023). Both passive and active management of buyout open space require local government maintenance and operation; however, passive management often includes fewer amenities and less formal land uses than active open space. For example, active management includes amenities, such as athletic fields, skateboard parks, or paved trails, while passive management includes wetlands, detention basins, or picnic tables in a mowed lot. Even though both management strategies can preserve natural areas, manage resources, reduce hazard risk, and offer recreational opportunities, active management is often associated with more positive resident perceptions as the purpose and amenities are more easily observed (Zavar, 2015). Although residents may appreciate the benefits associated with passive open space, such as ecological preservation or improved water quality, the aesthetics of these landscapes, including wetlands and grasslands, are often viewed negatively by nearby residents (Cottet, Piégay and Bornette 2013; Dias and Belcher 2015; Kaplowitz and Kerr 2003). Specifically, landscapes featuring more unkept features, such as longer prairie grasses or wetlands, are cited as less desirable from residents. This necessitates land managers to understand resident perspectives when designing postbuyout open space and the need for data and education outreach to combat misgivings about the open space.
To implement and upkeep both active and passive management approaches, local governments require funding; however, the timing of funding and amount can vary significantly. Federal assistance for buyout programs only includes the acquisition phase, and there is very limited assistance available for postbuyout open space management (Curran-Groome et al. 2022). For instance, the regular maintenance and mowing of open space requires on-going costs to the local government (BenDor et al. 2020). Additionally, active open space amenities require start-up funds to develop the project. Especially for smaller communities, these initial and on-going costs can present a financial burden (Salvesen et al. 2018). Some potential sources communities use to assist with the long-term management include partnerships with state parks (Zavar and Hagelman III, 2016), participation in grants or programs, such as the National Park Service Rivers, Trails, and Conservation Assistance program (National Park Service 2024), or allowing residents to lease and care for the buyout open space (BenDor et al. 2020). Yet these programs are very limited and cannot address the growing need for postbuyout open space management costs. Therefore, the management costs are mostly assumed by local governments who may not have the resources, especially financial, to develop more active open space land uses (Zavar and Hagelman III 2016).
Many communities also lack the technical capacity to develop long-term open space management practices (Hall 2008). This is especially true in communities where the buyouts occur in the aftermath of a disaster, which is when most federal funding is available for these types of mitigation projects (Dascher et al., 2023). Therefore, communities often delay open space planning as they face more pressing issues of recovery and reconstruction. Even when conditions are favorable, many communities lack the capacity to find, apply for, and manage grants to develop postbuyout open space (Shybalkina 2024). This is especially true in smaller communities that may only ever implement and manage one buyout program. Additionally, emergency managers often have multiple responsibilities, reducing the time available for hazard mitigation and open space management planning (Siebeneck at al. 2022). Moreover, the limited grants available that could offer communities assistance with planning and funding postbuyout open space often require evidence-based support or empirical data to make the grant proposal competitive (Gitlin, Kolanowski and Lyons 2020). In emergency management, these proposals often require data to demonstrate the need for the project as well as to identify the proposed impact of the project. Empirical evidence can be time-consuming and difficult to collect for an emergency management office, or in many cases, an individual, already operating over capacity.
Successful postbuyout open space development also requires community engagement, land use planning, and on-going assessment (Balachandran, Olshansky and Johnson 2022; Green and Olshansky 2012; Shi et al. 2023; Zavar and Hagelman III, 2016). Without these, postbuyout open space often remains as mowed, vacant lots with minimal amenities for the community (Zavar and Hagelman III, 2016). For example, when community engagement is lacking, postbuyout open space management can result in inefficient projects that residents do not value and may even reduce community support for future mitigation efforts (Zavar and Hagelman III, 2016).
Therefore, to meet these needs, we propose the use of the SOPARC method as an effective tool for open space land management. Given SOPARC collects observational data on how people use various areas of the open space, it provides critical data that can inform postbuyout land management strategies. The SOPARC can be a valuable option for local governments that require less training, time, software, and funding to implement than other data collection procedures, such as surveys and interviews. Data collected during SOPARC observations can identify how (or if) residents use the open space, the timing of use, and user demographics. These data can support grant proposals, as well as land management decisions, to provide evidence-based approaches for managing postbuyout open space.
Methods
We examined residents’ recreation and use of buyout open space at five target areas located across an acquired landscape in Arlington, Texas. Arlington, situated in the Dallas–Fort Worth Metroplex in north central Texas, had an estimated population of 393,469 (U.S. Census Bureau 2022). The city is prone to flooding in low-lying areas and in areas near creeks and streams. As such, city staff actively identifies and evaluates properties with repetitive losses in an effort to reduce flood losses (City of Arlington 2025). Part of the city's flood mitigation strategy is to acquire and demolish high-risk properties. For this case study, we selected the Rush Creek Property Acquisition Project. This buyout program was locally funded and initiated by flooding from Tropical Storm Hermine in 2010. The City of Arlington acquired 49 households along with 14 condominium complexes (Naturally Resilient Communities 2017). These acquired properties are located along with North Rush Creek and are adjacent to a preexisting linear park with a playground. The City of Arlington used the acquired properties to expand the park and increase amenities, including paved trails, benches, exercise equipment, tennis courts, and dog parks. However, roads and houses disconnect sections of the open space, resulting in a checkerboard pattern of land use. The five target areas span the entire open space and encompass a range of opportunities for active and passive recreational activities (Figure 1; Table 1).
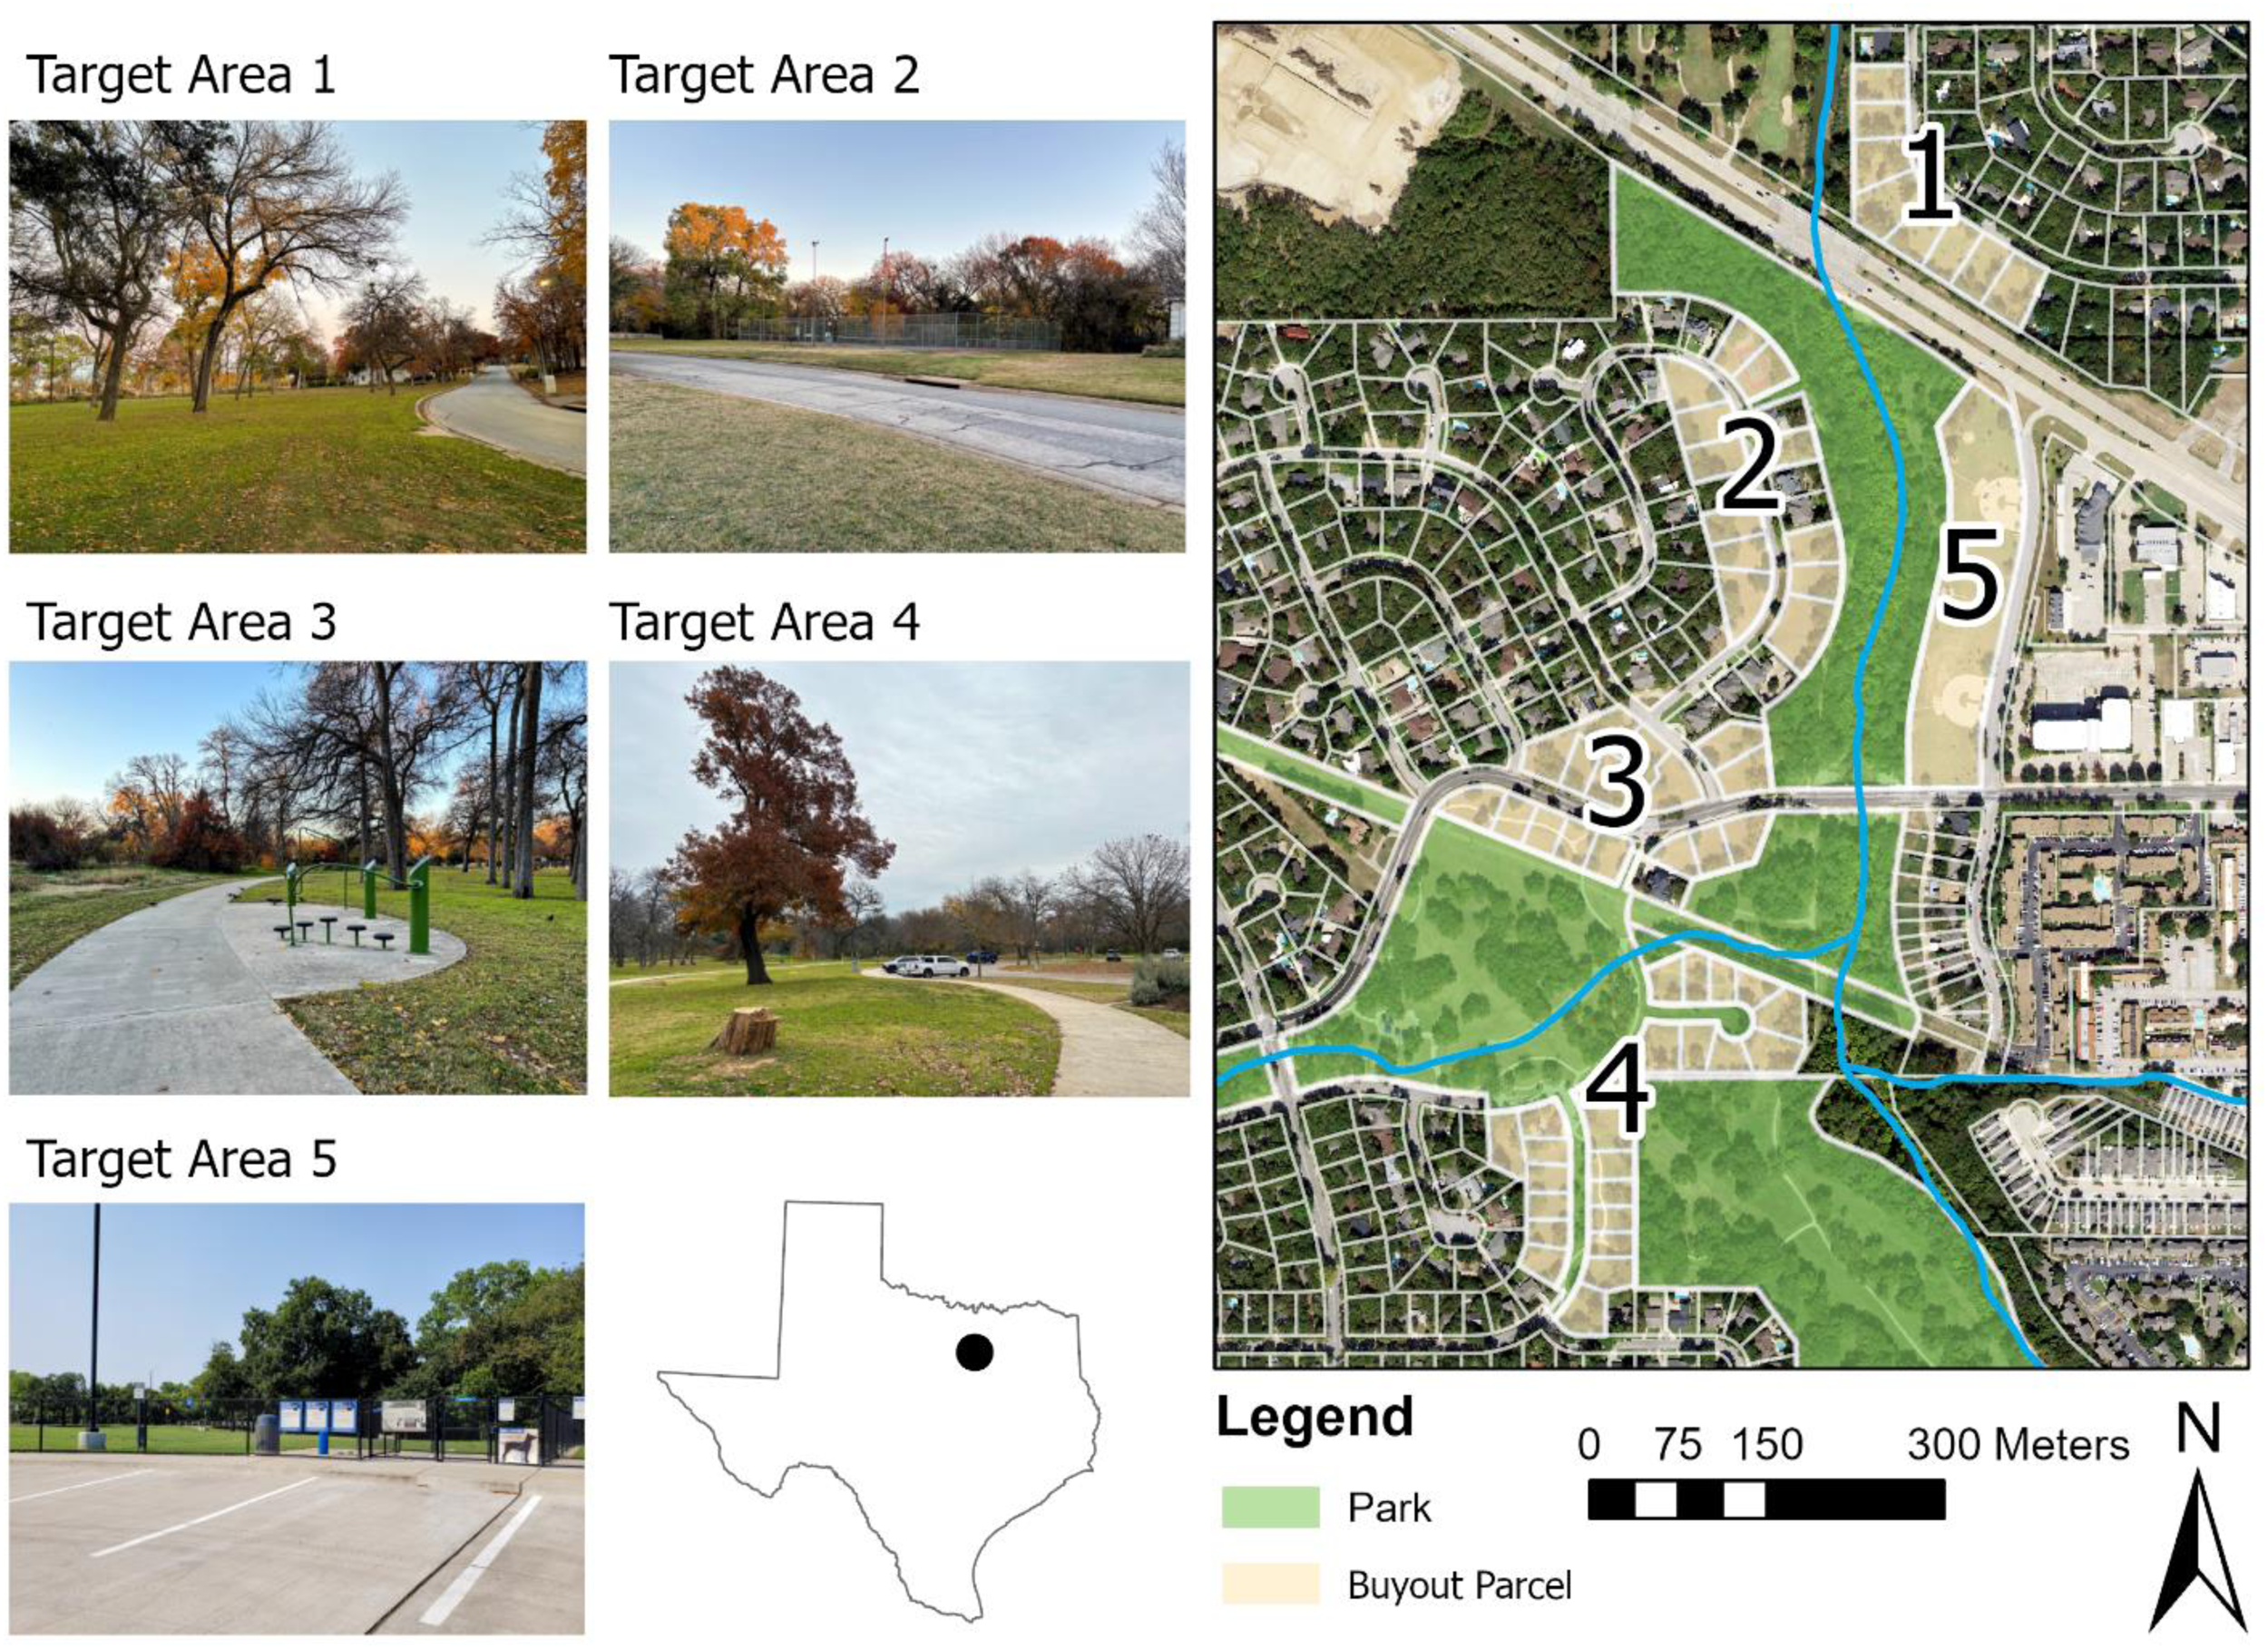
Buyout open space and target areas along with rush creek in Arlington, Texas.
Description of SOPARC Target Areas, Including Their Uses and Features, Within the Postbuyout Open Space.
Using McKenzie et al.'s (2006) SOPARC method, we conducted nonparticipant observations at the five target areas (two observations per area during four time periods each day) across five days over a two-week period in December 2023, resulting in 200 scans. However, two morning scans (four total observations) were skipped at Target Area 5 due to the closure of the area resulting in a total of 196 observations for analysis. December is typically cool, but mild in north central Texas with high daily temperatures averaging between 13°C and 17°C, making outdoor activity common in the region (National Weather Service 2024). It is important to note, our observation period occurred before the December holiday closure, where schools, businesses, and government offices were still open, suggesting routine activities were performed. Previous research testing the validity and reliability of the SOPARC method suggests that conducting visual scans at four times per day across four days with both weekday and weekend observations, will provide robust estimates of park use and characteristics (Cohen et al. 2011). Our observations mirror these timeframes but feature an additional day.
To conduct the SOPARC observations, the procedure includes visual scans, moving from left to right, of people's activities at four times each day (early morning, late morning, afternoon, and evening), including both weekdays and weekends at each target area. These visual scans provide an estimate of the current park conditions and use at the time of observation. The method includes information on current park conditions, such as the accessibility and usability of the target area, as well as if supervised or organized activities are occurring at the time of observation. The method also collects some demographic information along with the activity level of people in each target area. For each scan, we recorded the number of users and described: gender (male/female), race/ethnicity (Asian, Black, Hispanic, White); age group (children, teens, adults, and seniors); and activity level (sedentary, walking, and vigorous). To improve data reliability, two researchers completed each visual scan. All but a few instances had full inter-rated agreement; those instances of disagreement were discussed in the field until consensus was achieved.
Given that this research focuses on how local land managers can gather empirical data to inform postbuyout open space design and management based on resident use with limited resource investment, we chose to organize our observational data into spreadsheets and analyze it using Microsoft Excel. We selected Excel since it is standard software that would be available to emergency managers and other land managers. We calculated descriptive statistics and compared the total observed users per observation with day of the week (weekday or weekend), activity level, and time of day (early morning, late morning, afternoon, and evening). We also incorporated publicly available census data through the U.S. Census Bureau. Specifically, we used the 2022 American Community Survey data at the block group level (U.S. Census Bureau 2022) to compare demographics from the surrounding neighborhood with our observations. We selected block groups intersecting a 0.8-km (0.5-mile) buffer around the center of the postbuyout open space given that most park users reside within a 10- to 15-min walk of the parks they use (Harnik and Simms 2004).
Although the accuracy of the SOPARC method is well established in the field of park management and leisure studies (Evenson et al. 2016), we want to emphasize that all recorded demographics are based on inferences made by our research team, and we recognize more social identities exist than categorized in the SOPARC method. We acknowledge this as a limitation of this observation technique and study. Given that SOPARC field observations are conducted in public spaces, and they are not classified as human–subjects research (Hitch et al. 2021), we therefore cannot ask study participants to provide their identities. The frequency and duration of the visual scans require the use of few demographic categories to avoid overwhelming the data collector (Evenson et al. 2016). However, research indicates high reliability of identifying racial/ethnic groups, specifically Asian, Latino, and Black populations (Marquet et al. 2019) and suggests the SOPARC observations can provide critically needed data in lower-income communities serving large populations of racial and/or ethnic minority residents (Banda et al. 2014). Therefore, despite these limitations, the SOPARC observations provide a systematic and robust account for park use that can help guide land managers in open space decision-making.
Results
We conducted a total of 196 scans across the five target areas for five days (three weekdays and two weekend days), spanning two weeks in mid-December. For clarity, we refer to individuals observed at the target areas as users hereafter. Of these, 81 scans (41%) recorded no observed users. During the other 115 scans (59%), we observed 853 users. Target Areas 1 and 2, which offered the fewest amenities, had the lowest usage. We observed a total of four users at Target Area 1 and 20 users at Target Area 2. Surrounded by houses in a single-family residential neighborhood, Target Area 1, a passively managed portion of the buyout, contains mowed, open space with some tree coverage. It lacks amenities, and a major road separates it from the other target areas. Because of its location and separation from the other target areas, we expected user activity would be low. All the observed activity in this area consisted of cyclists or walkers traveling the adjacent street, rather than within the open space. A more actively managed space within the buyout, Target Area 2 consists of mostly open space with some sparse tree coverage and a fenced tennis court. We observed most of the users in this area at the tennis court. Located between two existing single-family homes, the tennis court is designated for public use; however, its location within the buyout matrix may limit access for nonresidents, while others may assume it is a private facility. Together, these factors may contribute to the low number of users observed in Target Area 2.
Comparatively, we observed 196 users at Target Area 3, 417 users at Target Area 4, and 217 users at Target Area 5 across the same observation period. These target areas are actively managed and include several amenities (Table 1). Target Area 3 is bifurcated by a minor arterial road. The north side of this area has sparse tree cover and lacks amenities. The south side of this area possesses a paved trail system that connects to Target Areas 2, 4, and 5. We frequently observed users running, walking, or cycling the paved trail in this area. Target Area 4, which had the highest number of users, offers the most amenities, including an adjacent playground, exercise equipment, paved trails, and a circular parking lot. The paved trails in this area connect to Target Areas 2, 3, and 5, as well as the trail network traversing the larger linear park system. At this target area, we observed users walking, running, cycling, reading, and using the exercise equipment. Target Area 5 consists of two dog parks with parking areas, as well as sidewalks that connect to the paved trails in Target Areas 3 and 4. This area also saw elevated use, especially on weekends and evenings; however, one of the dog parks was closed during all observations, whereas the other was closed on the morning of Wednesday, December 13, and all day Saturday, December 16, which affected user activity. Accordingly, observations of users at Target Area 5 varied based on whether the dog park was open or closed. Of note, none of the target areas had organized activities occurring during the observation period.
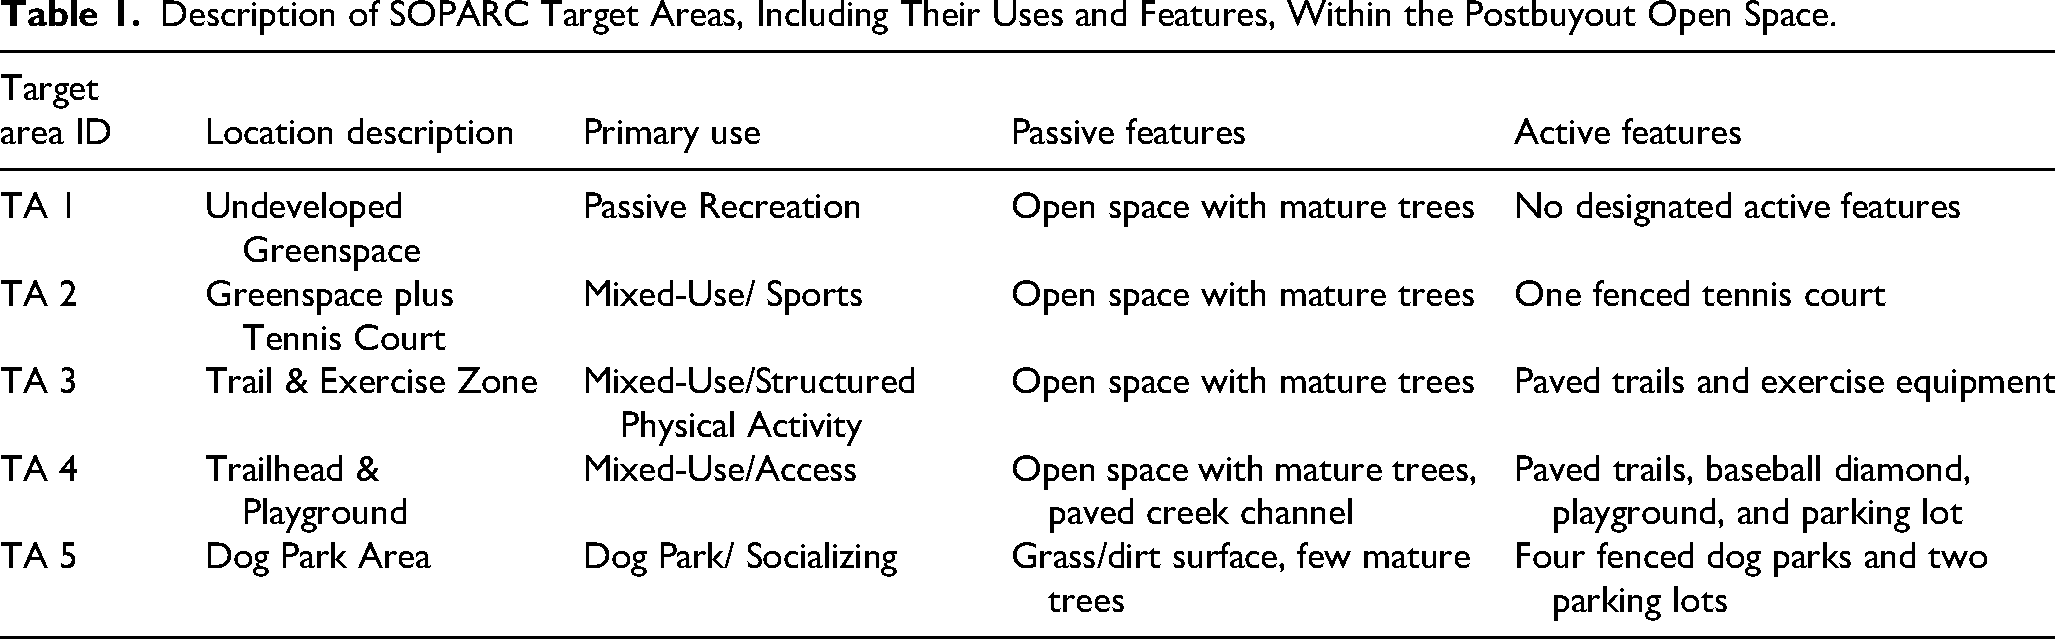
Users were fairly consistent across target areas on both weekend and weekdays. We observed the most total people on Sunday, December 10 (26.1% of all observed users; Figure 2). Despite similar weather conditions throughout the two-week observation period, park use decreased on Saturday, December 16 (17.6% of all observed users), because both dog parks at Target Area 5 were closed. We observed 56 users at Target Area 5 on Sunday, compared to three on Saturday. Users in Target Area 3 also slightly decreased (n = 56 vs. n = 41, respectively) between Sunday and Saturday. User numbers were consistent across the other target areas over the weekend observation days.
Total number of people (n = 853) observed at all target areas combined by date.
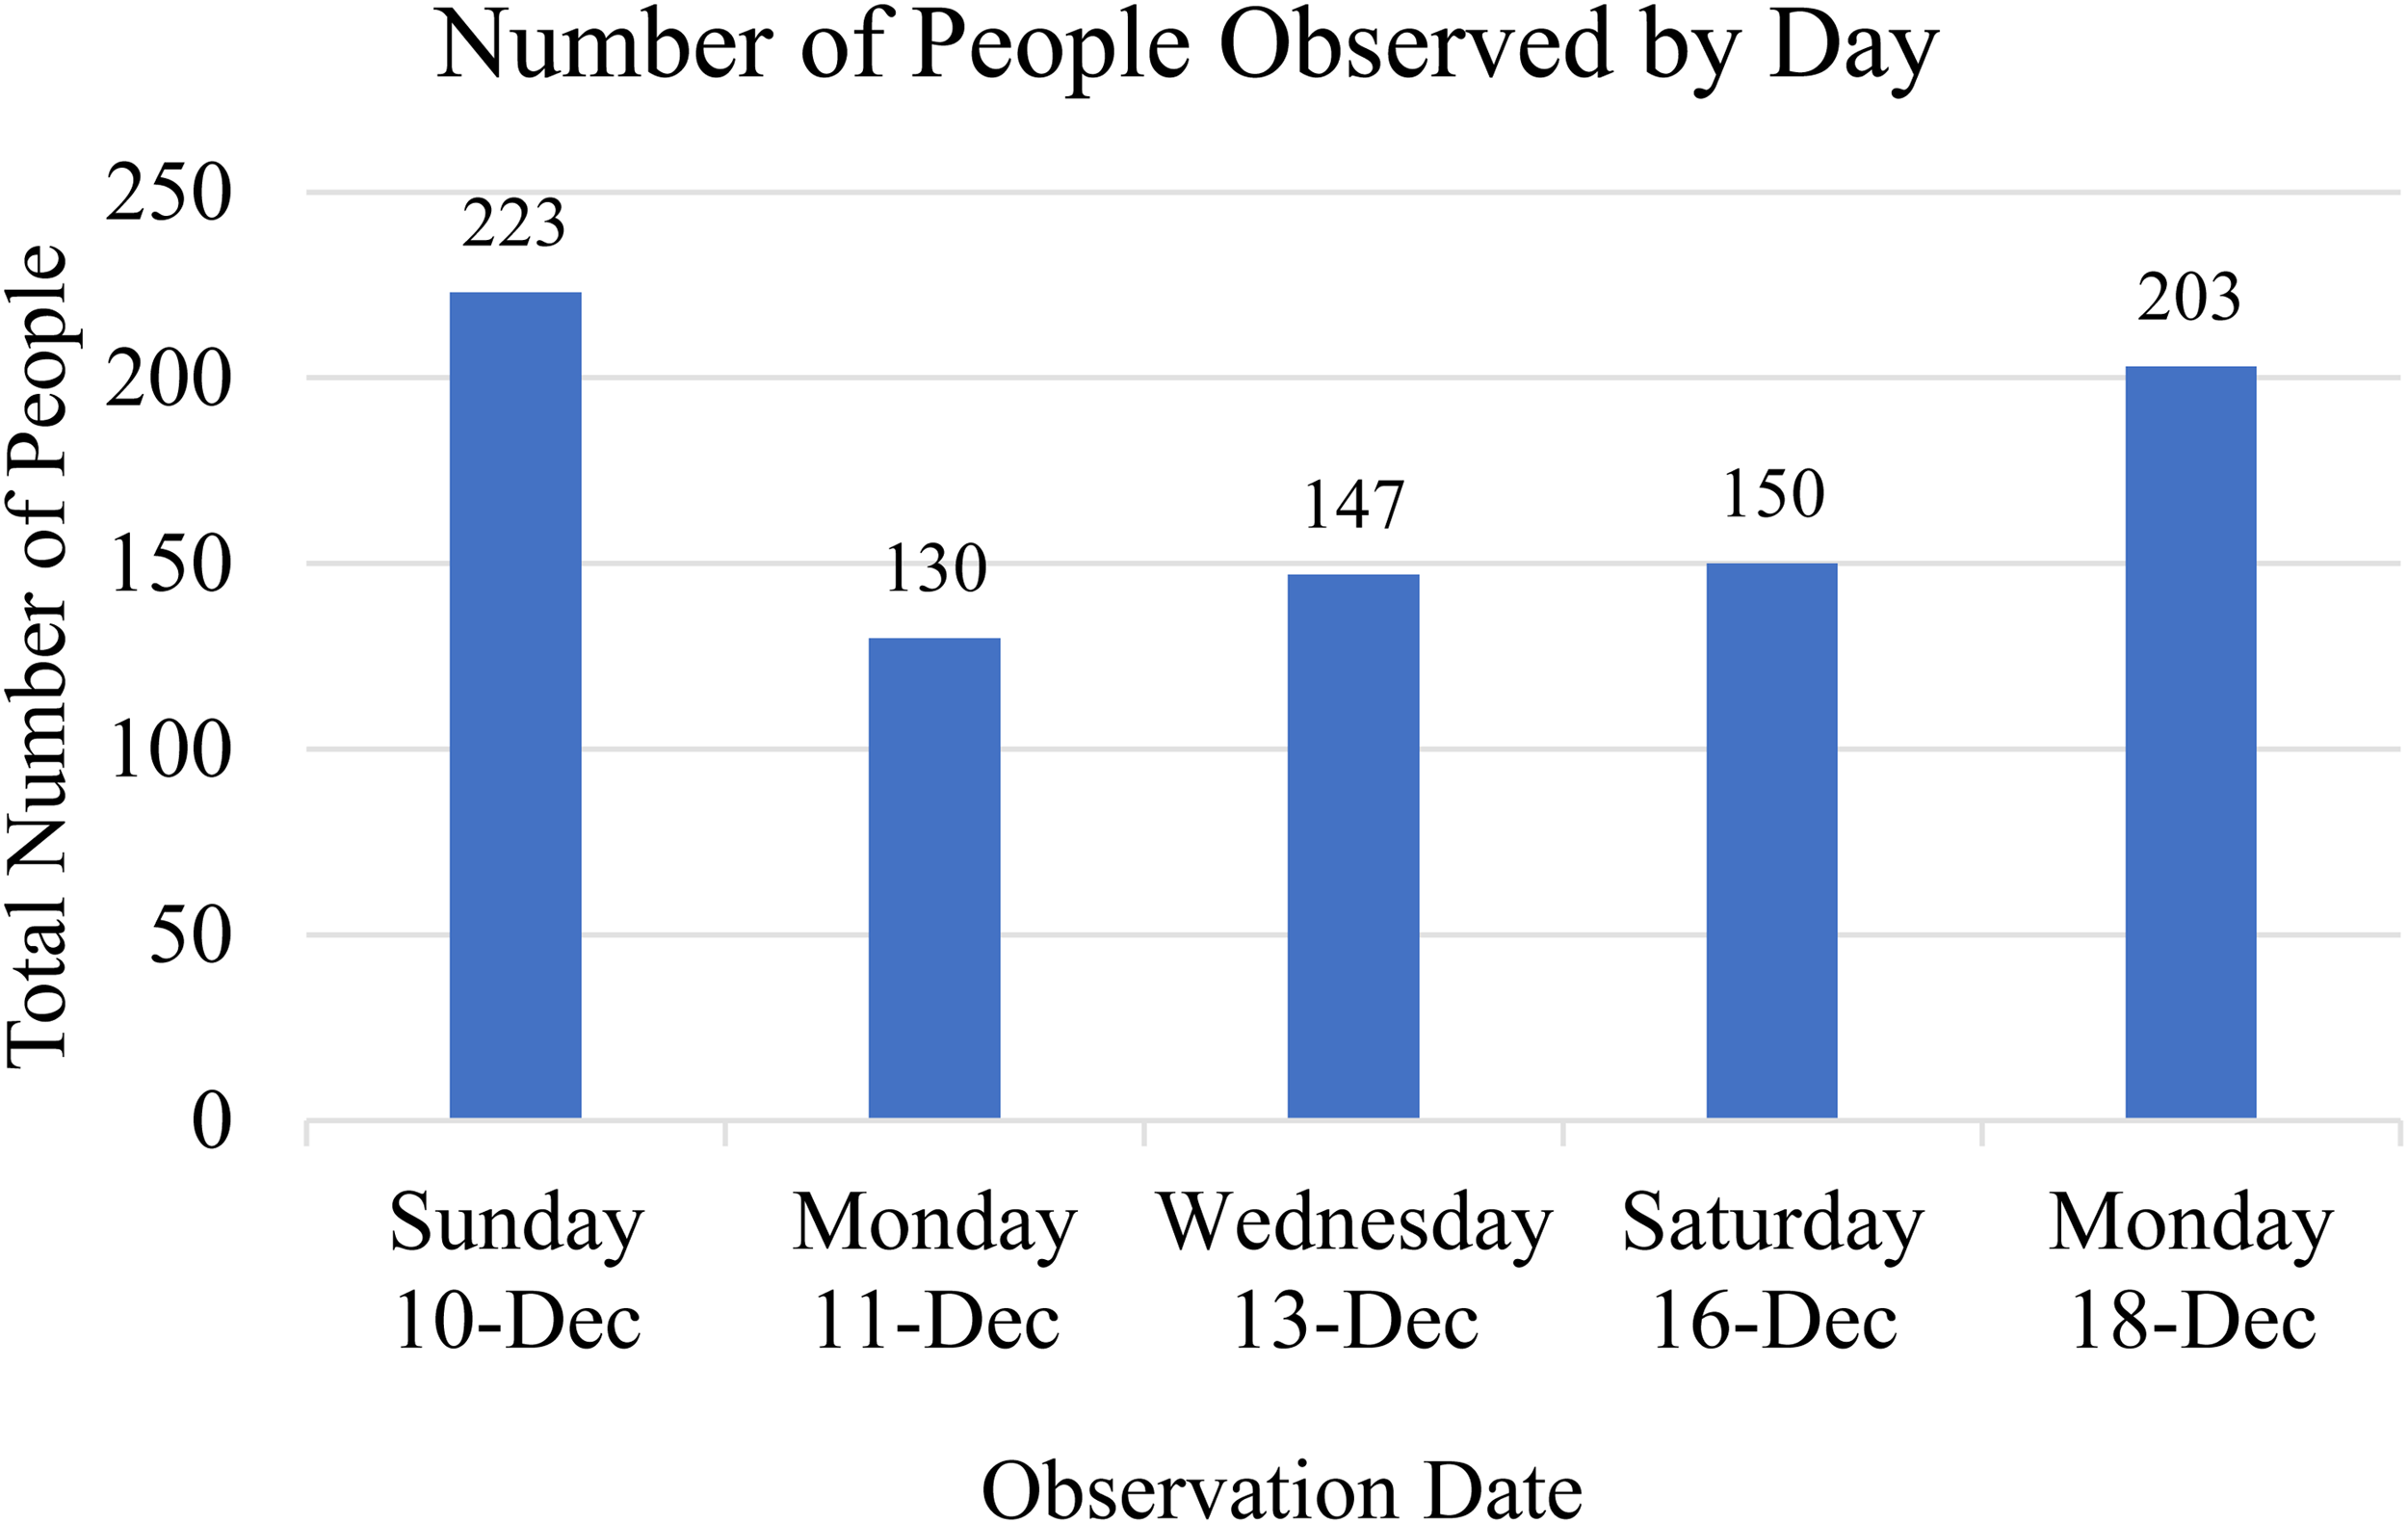
Weekday observations were generally lower than weekends (Figure 3). On Monday, December 11, and Wednesday, December 13, we observed the lowest number of users (15.2% and 17.2% of all observed users); however, on Monday, December 18, we observed the second-highest use rate (23.7% of all observed users). Users to Target Area 5 primarily accounted for the increase on this Monday. We observed 65 users in the reopened dog park in Target Area 5, representing the highest number of users at Target Area 5 during our observations. In contrast, we observed the lowest number of users in Target Area 3 on this day (n = 28).
Total observed people at all target areas by day and time.
Use varied by time of day across target areas (Figure 3). Overall, we observed the lowest number of users (10.2%) across all target areas in the morning. In contrast, we observed the majority of users in the afternoon and evening hours (66.4% of all observed users) across all target areas, driven by high use in Target Areas 4 and 5. Additionally, playground usage was high during the afternoon and evening periods. This time correlates to after-school hours, and we observed children with backpacks walking through the park both in the early morning and afternoon on their way to and from the nearby elementary school. Target Area 4 also experienced the highest use during the noon period (13.4% of all observed users). Target Area 5 had slightly higher user numbers during the evening compared to Target Area 4 (13.4% vs. 11.8% of all observed users). These patterns show subtle but distinct spatial and temporal patterns in users at these two high-use target areas.
Except for Target Area 1, the buyout open space provided opportunities for both passive and active leisure activities. Opportunities exist for walking, as well as for sedentary and vigorous activities. Across all target areas, we observed users walking (43%), sedentary (33.9%), or engaged in vigorous activity (21.7%; Figure 4). Walkers mostly used the paved trails in Target Areas 3 and 4. While we observed sedentary or passive activities, such as sitting and standing, at all target areas, most sedentary activity took place within Target Area 5 (23.2% of all observed activity), where most dog park users were observed in conversation with others. Additionally, we also observed people engaged in other sedentary activities at Target Areas 3 and 4. For example, during one afternoon observation period, we observed a group of adults reading, talking, and lounging in hammocks attached to trees in Target Area 3. In Target Area 4, we observed users in conversation, as well as sitting on park benches. Target Areas 3 and 4, which contain paved trails, sidewalks, and exercise equipment, had the most users engaged in moderate to vigorous exercise. Here we observed runners, dog walkers, and people using the exercise equipment. Target Areas 3 and 4 had a similar number of observed walkers (n = 163 vs. n = 174). Target Area 4 had the highest number of users engaged in vigorous activity (20.4% of all observed activity). Most were runners.
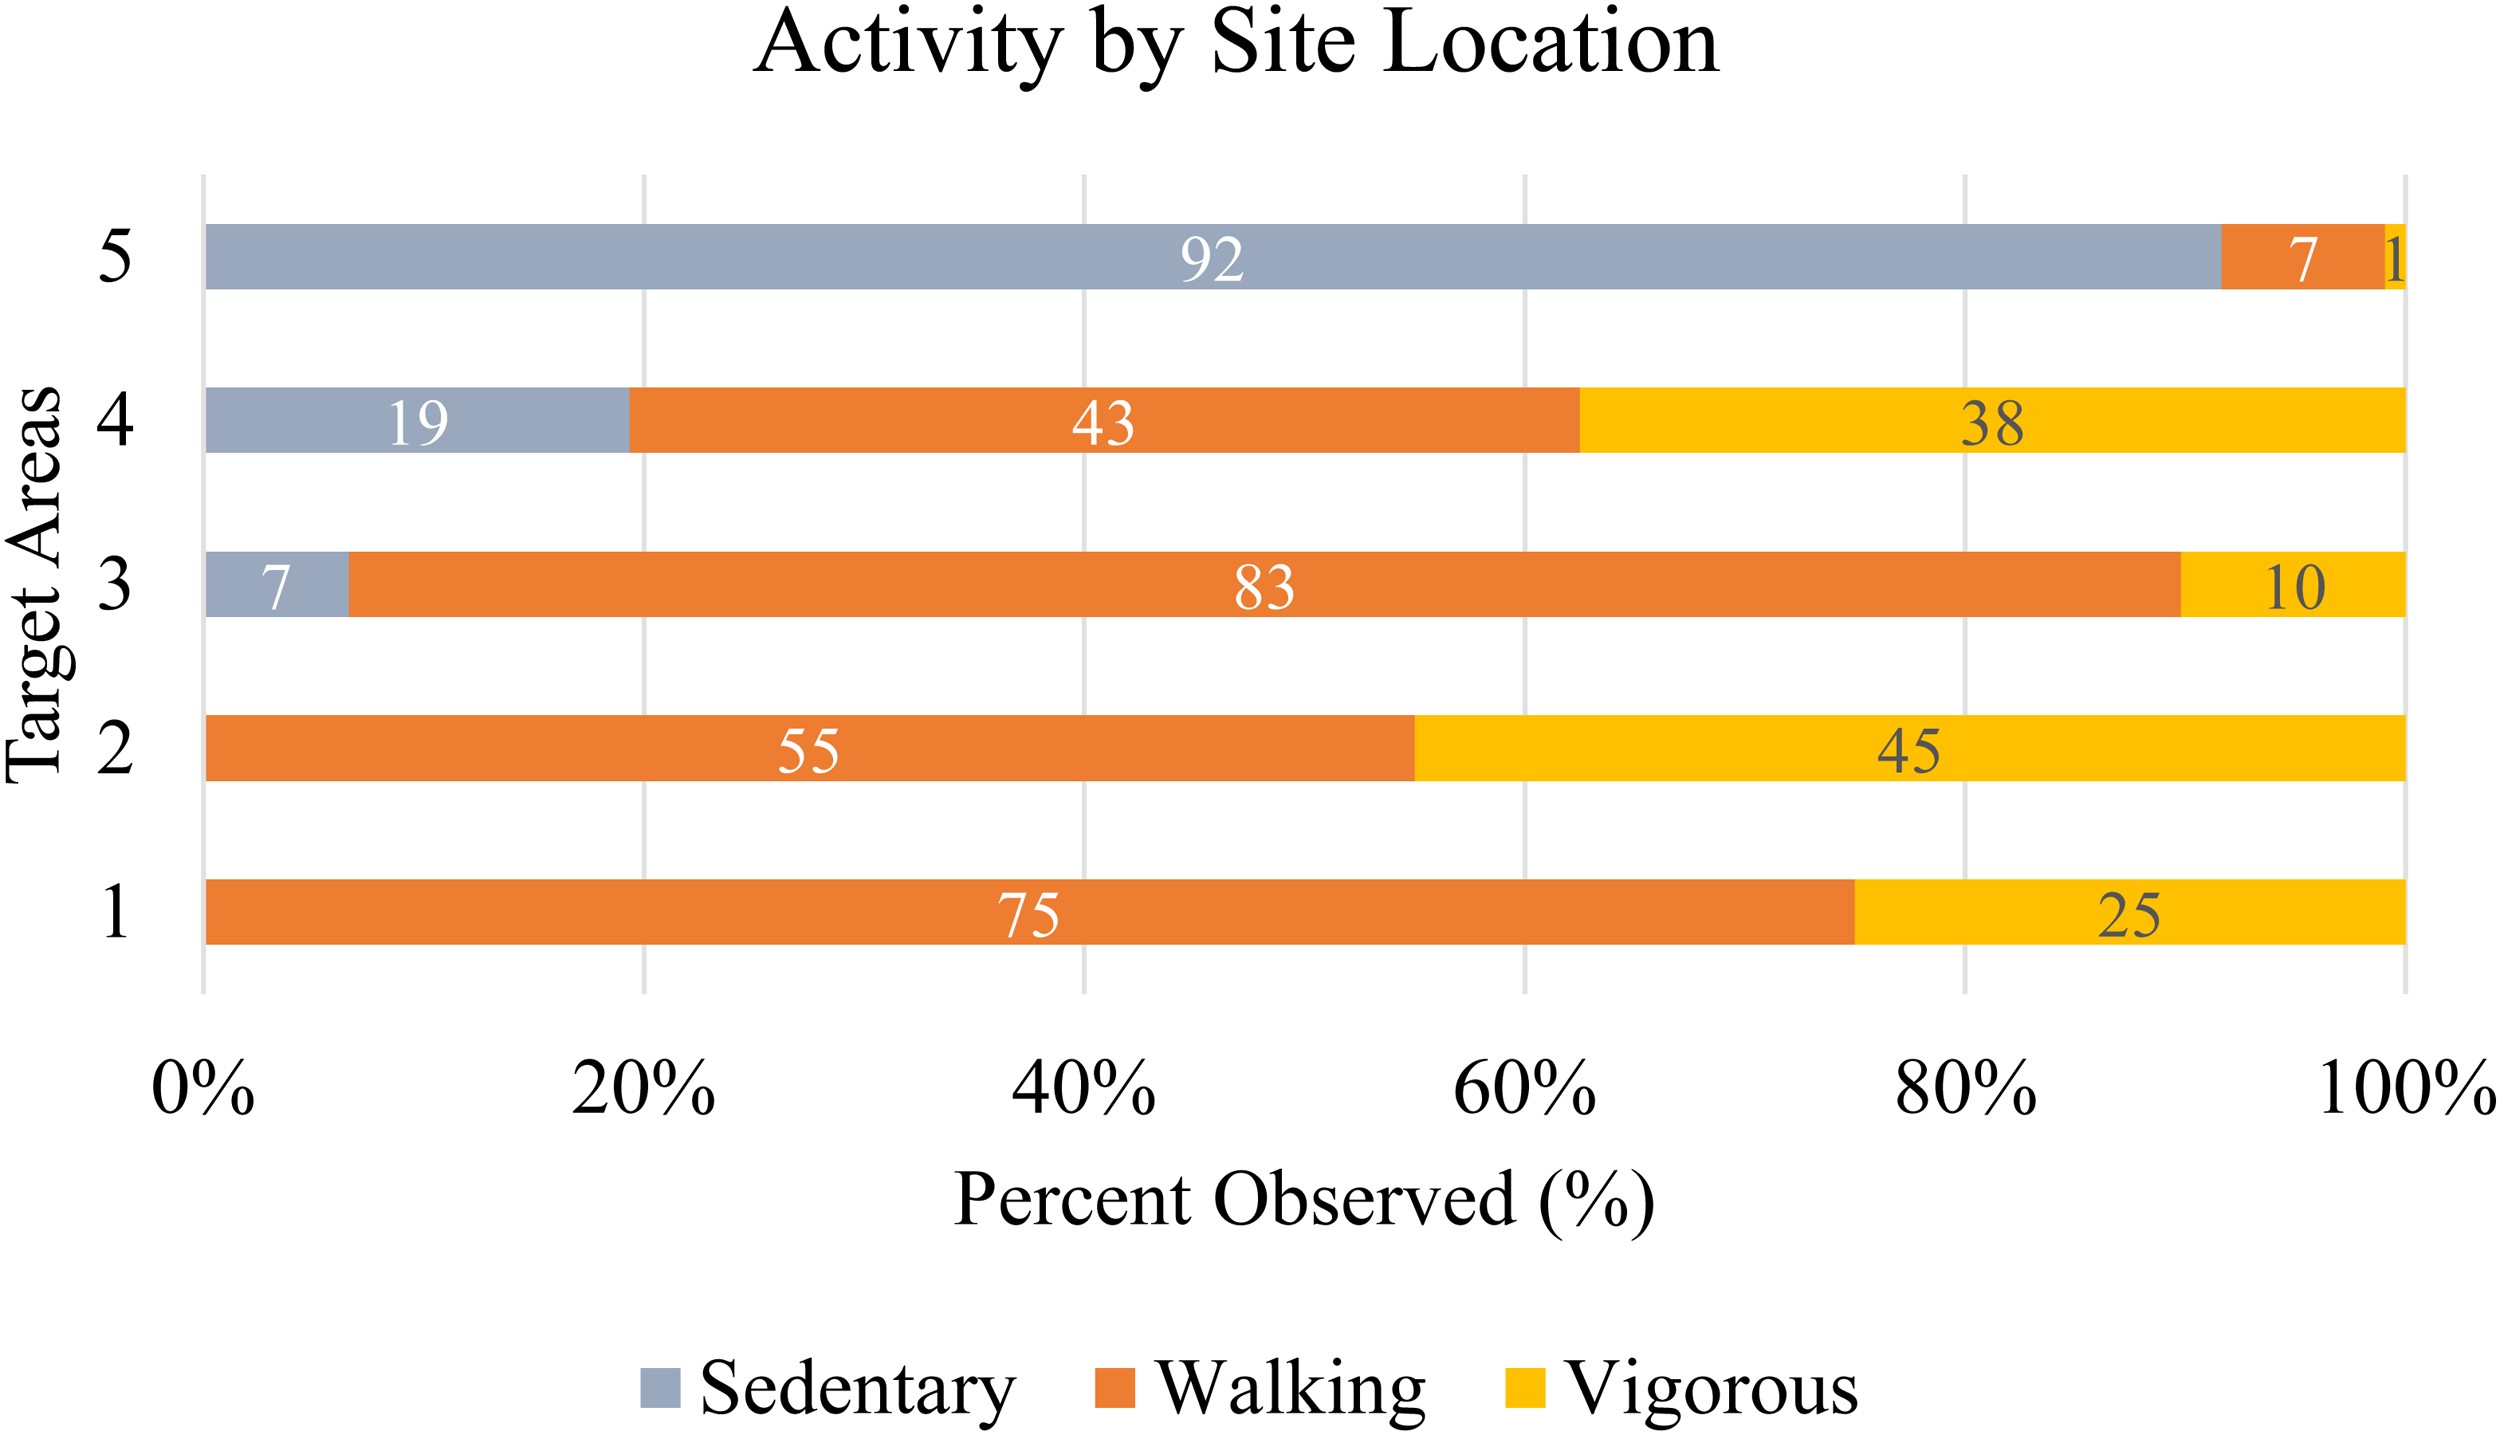
Observed activities of users at each target area.
Demographic observations of users, including gender, race/ethnicity, and age, revealed several patterns across the buyout open space and target areas. Across all scans, we observed slightly more male users (51.5%) than female users (44.0%). Gender distributions were generally similar across all target areas, except for Target Area 2, where we observed a higher proportion of male users (75%) compared to female users (25%; Figure 5). We observed more white users than any other racial group or ethnicity across all five target areas (72.8%; Figure 6). We observed Black (10.2%) and Hispanic/Latino (6.9%) users less frequently across all target areas. At Target Areas 3 and 5, we observed the most Black users (14.4% and 12.2%, respectively), while at Target Area 2, we observed the most Hispanic/Latino users (25.0%). Whereas, we observed Asian users even less frequently across all target areas (0.9%). Target Area 2 accounted for most of the observed Asian users (15.0%) with minimal to no observations in other target areas (0–1.3%). Finally, we observed adults more frequently across all target areas than any other age group (55.9%), followed by children (20.4%), senior adults (11.3%), unidentifiable individuals (9.2%), and teens (2.9%; Figure 7). We observed higher proportions of children, however, at Target Areas 3 and 4, likely reflecting the proximity of these target areas to the playground and exercise equipment.
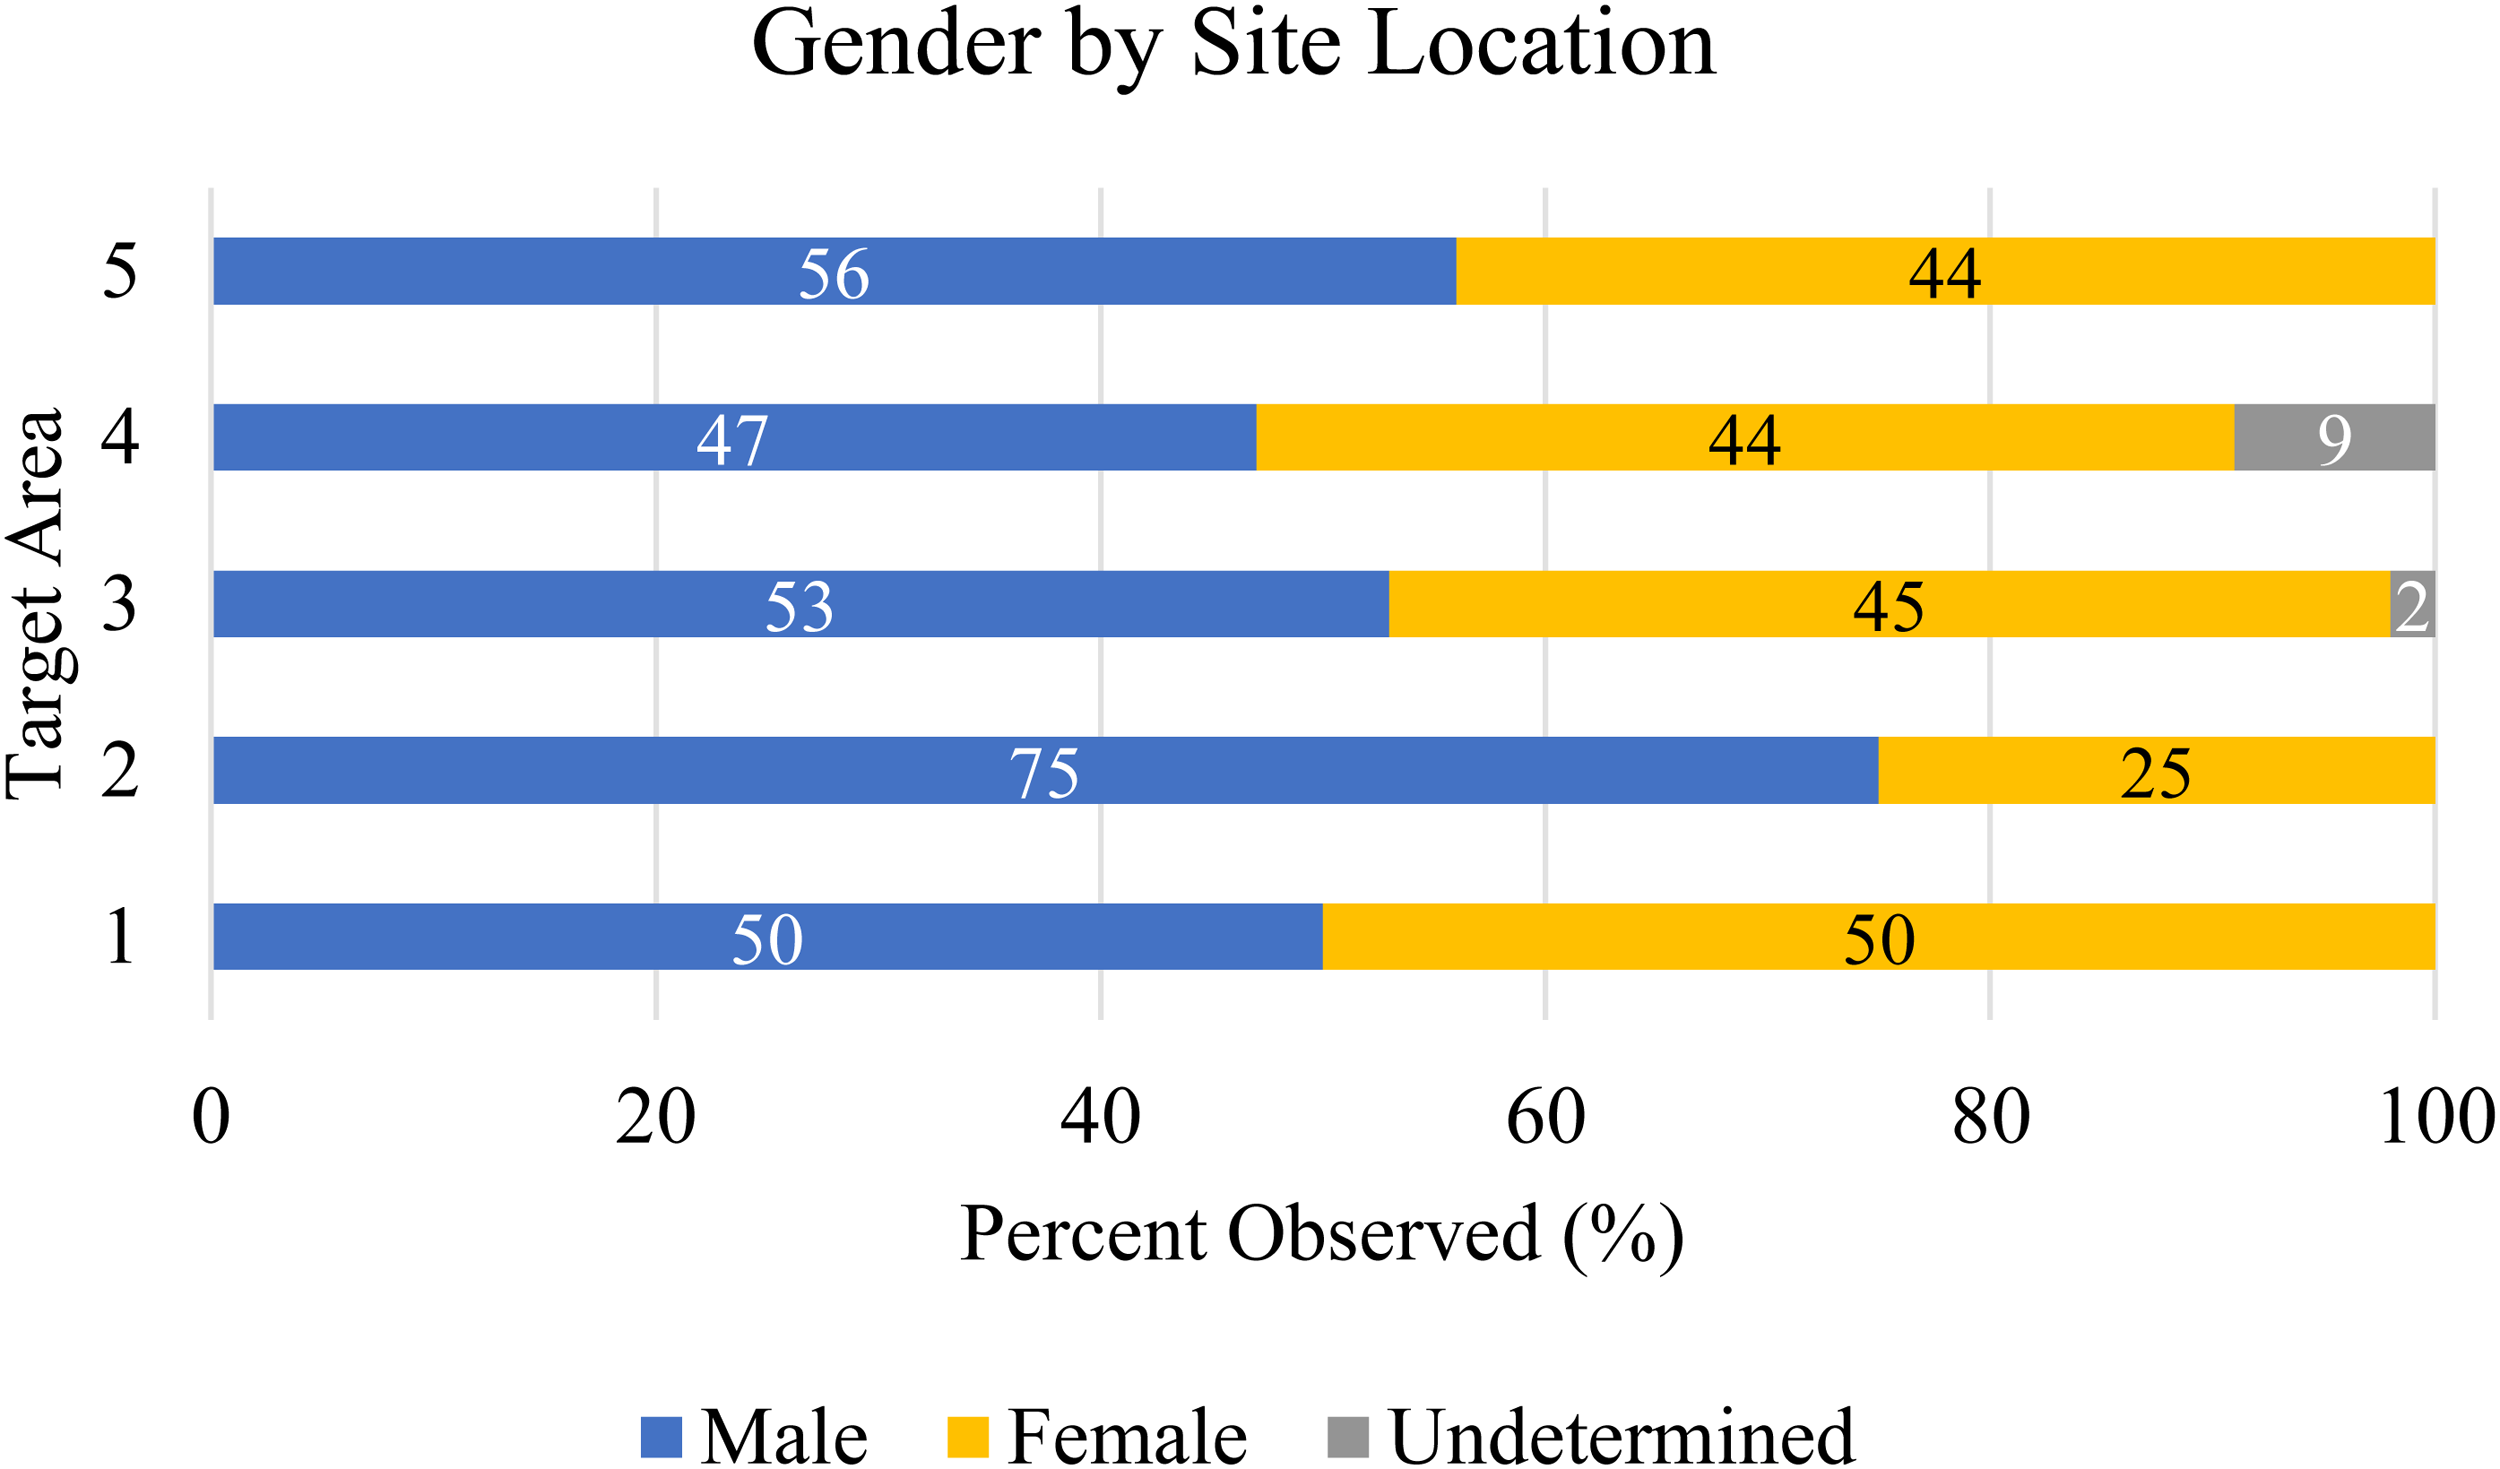
Observed gender of users at each target area.
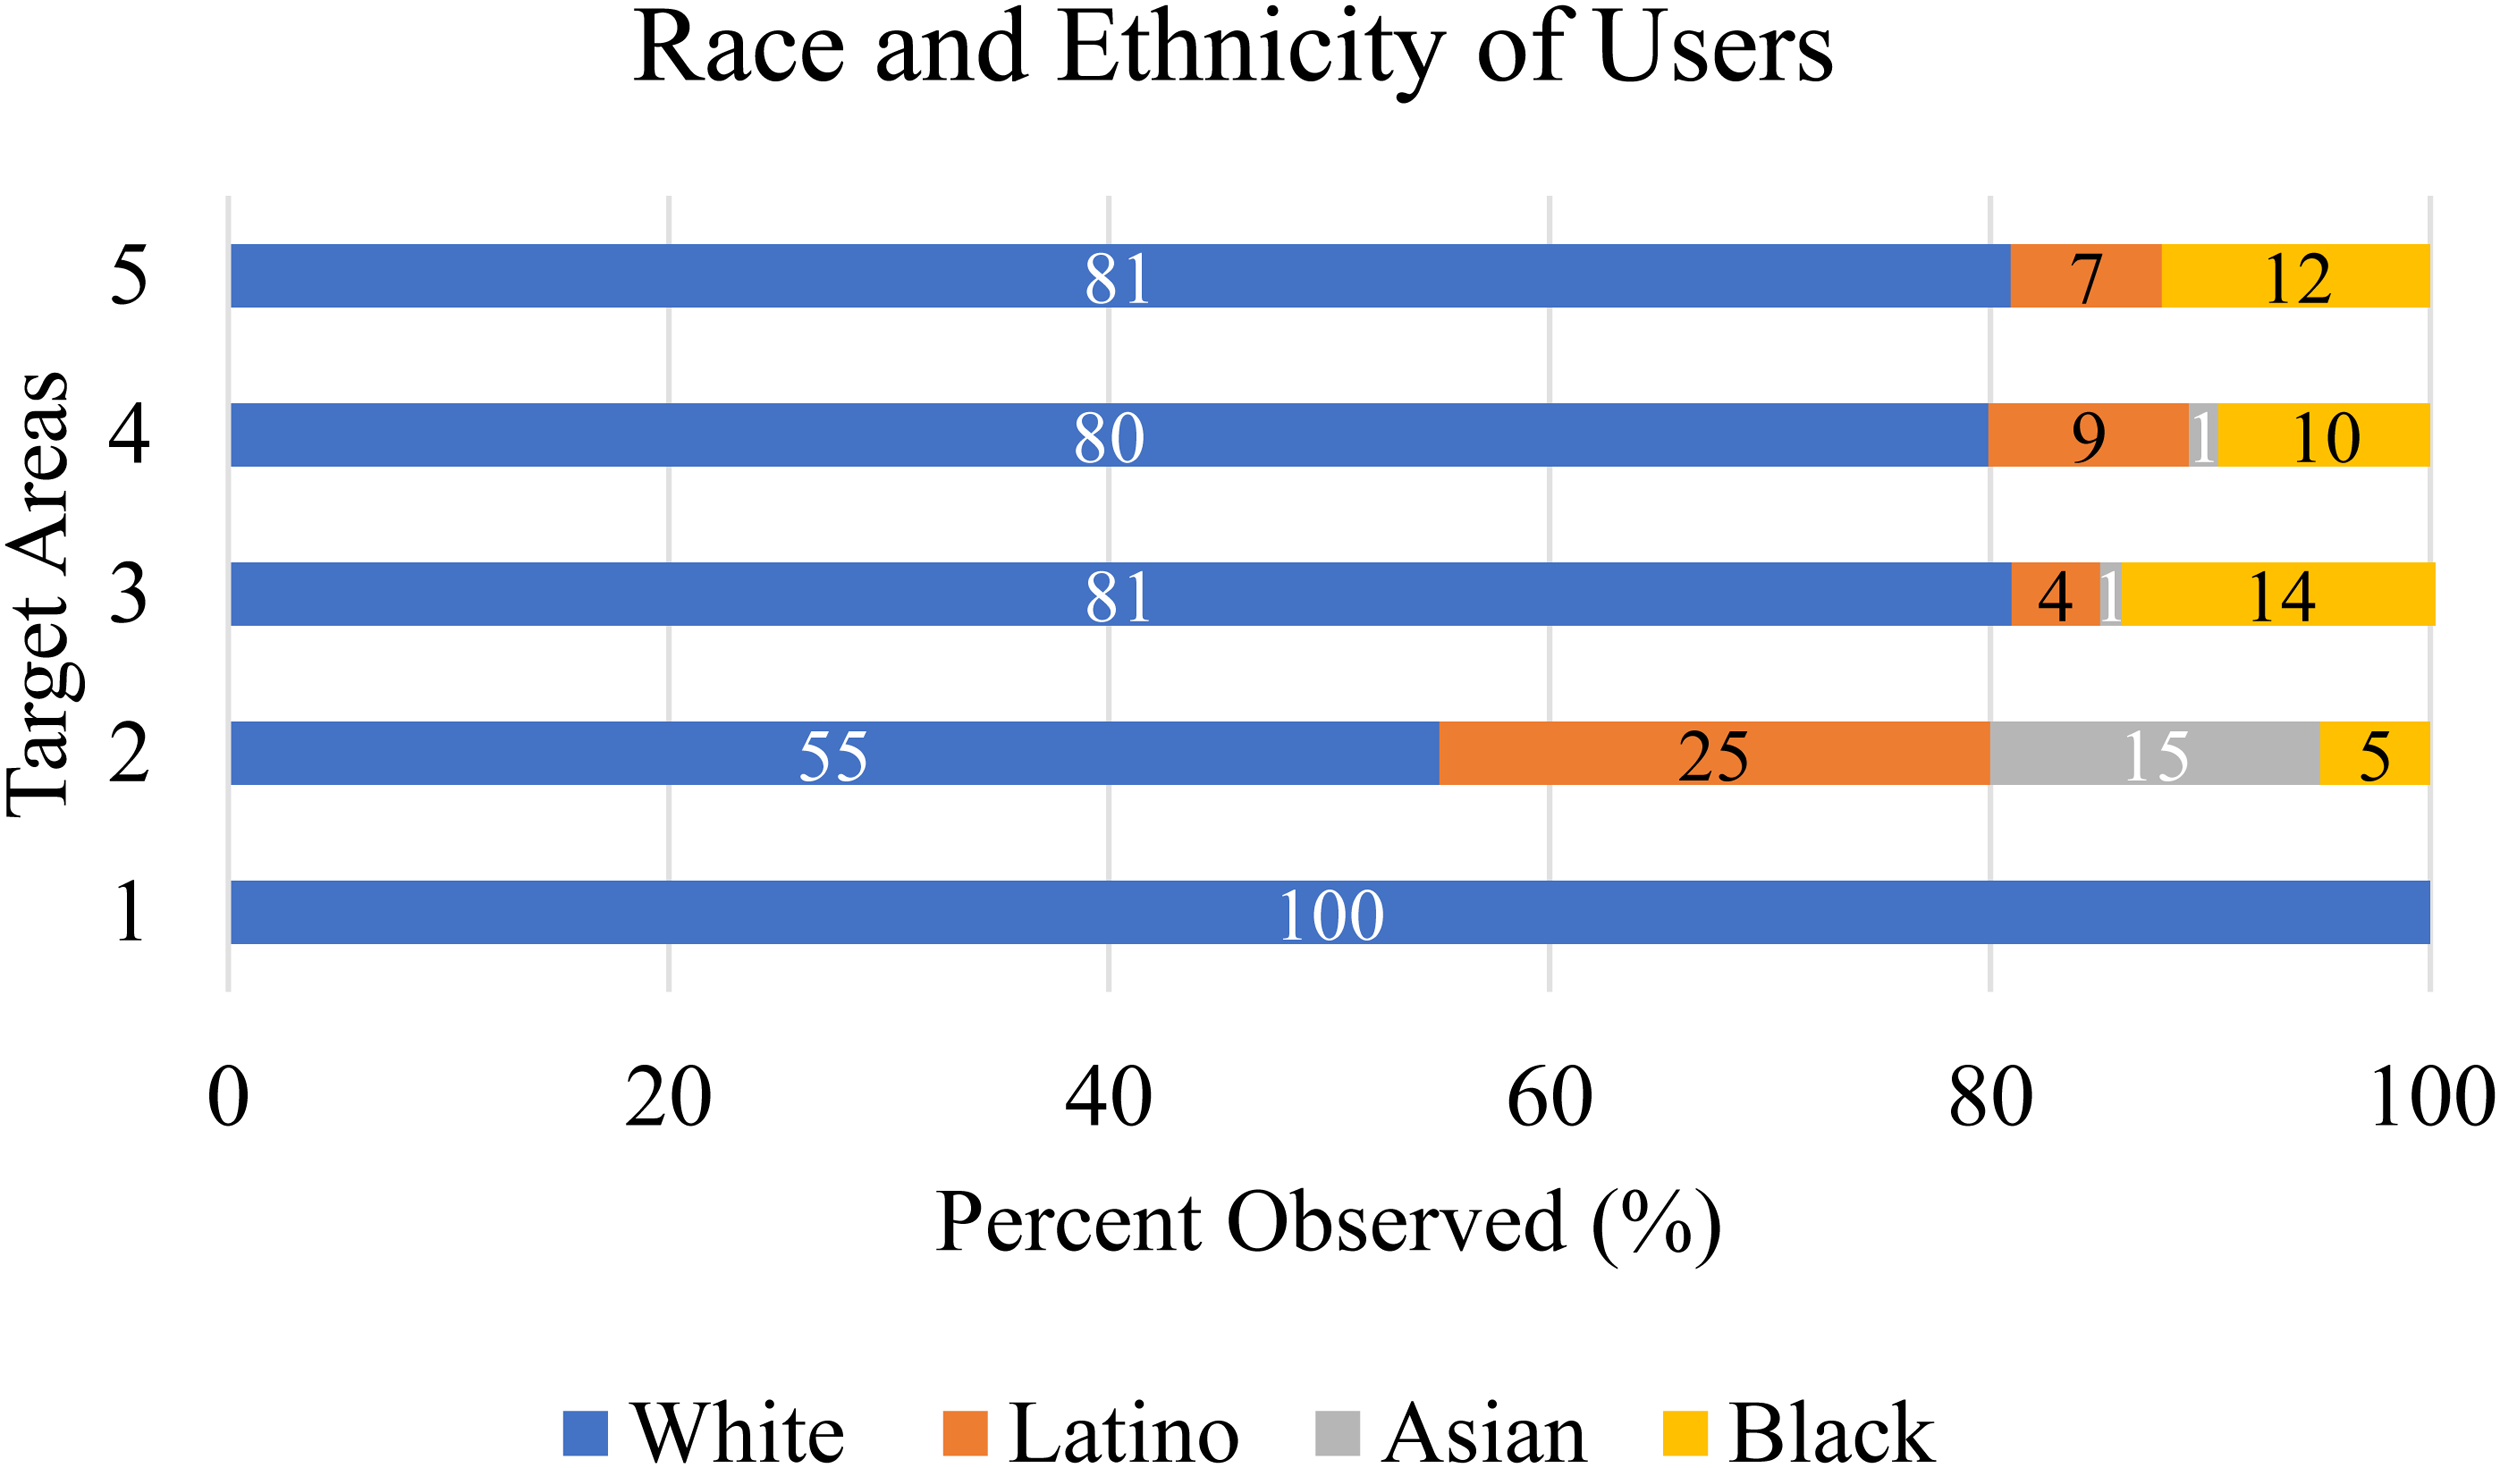
Observed race and ethnicity of users at each target area.
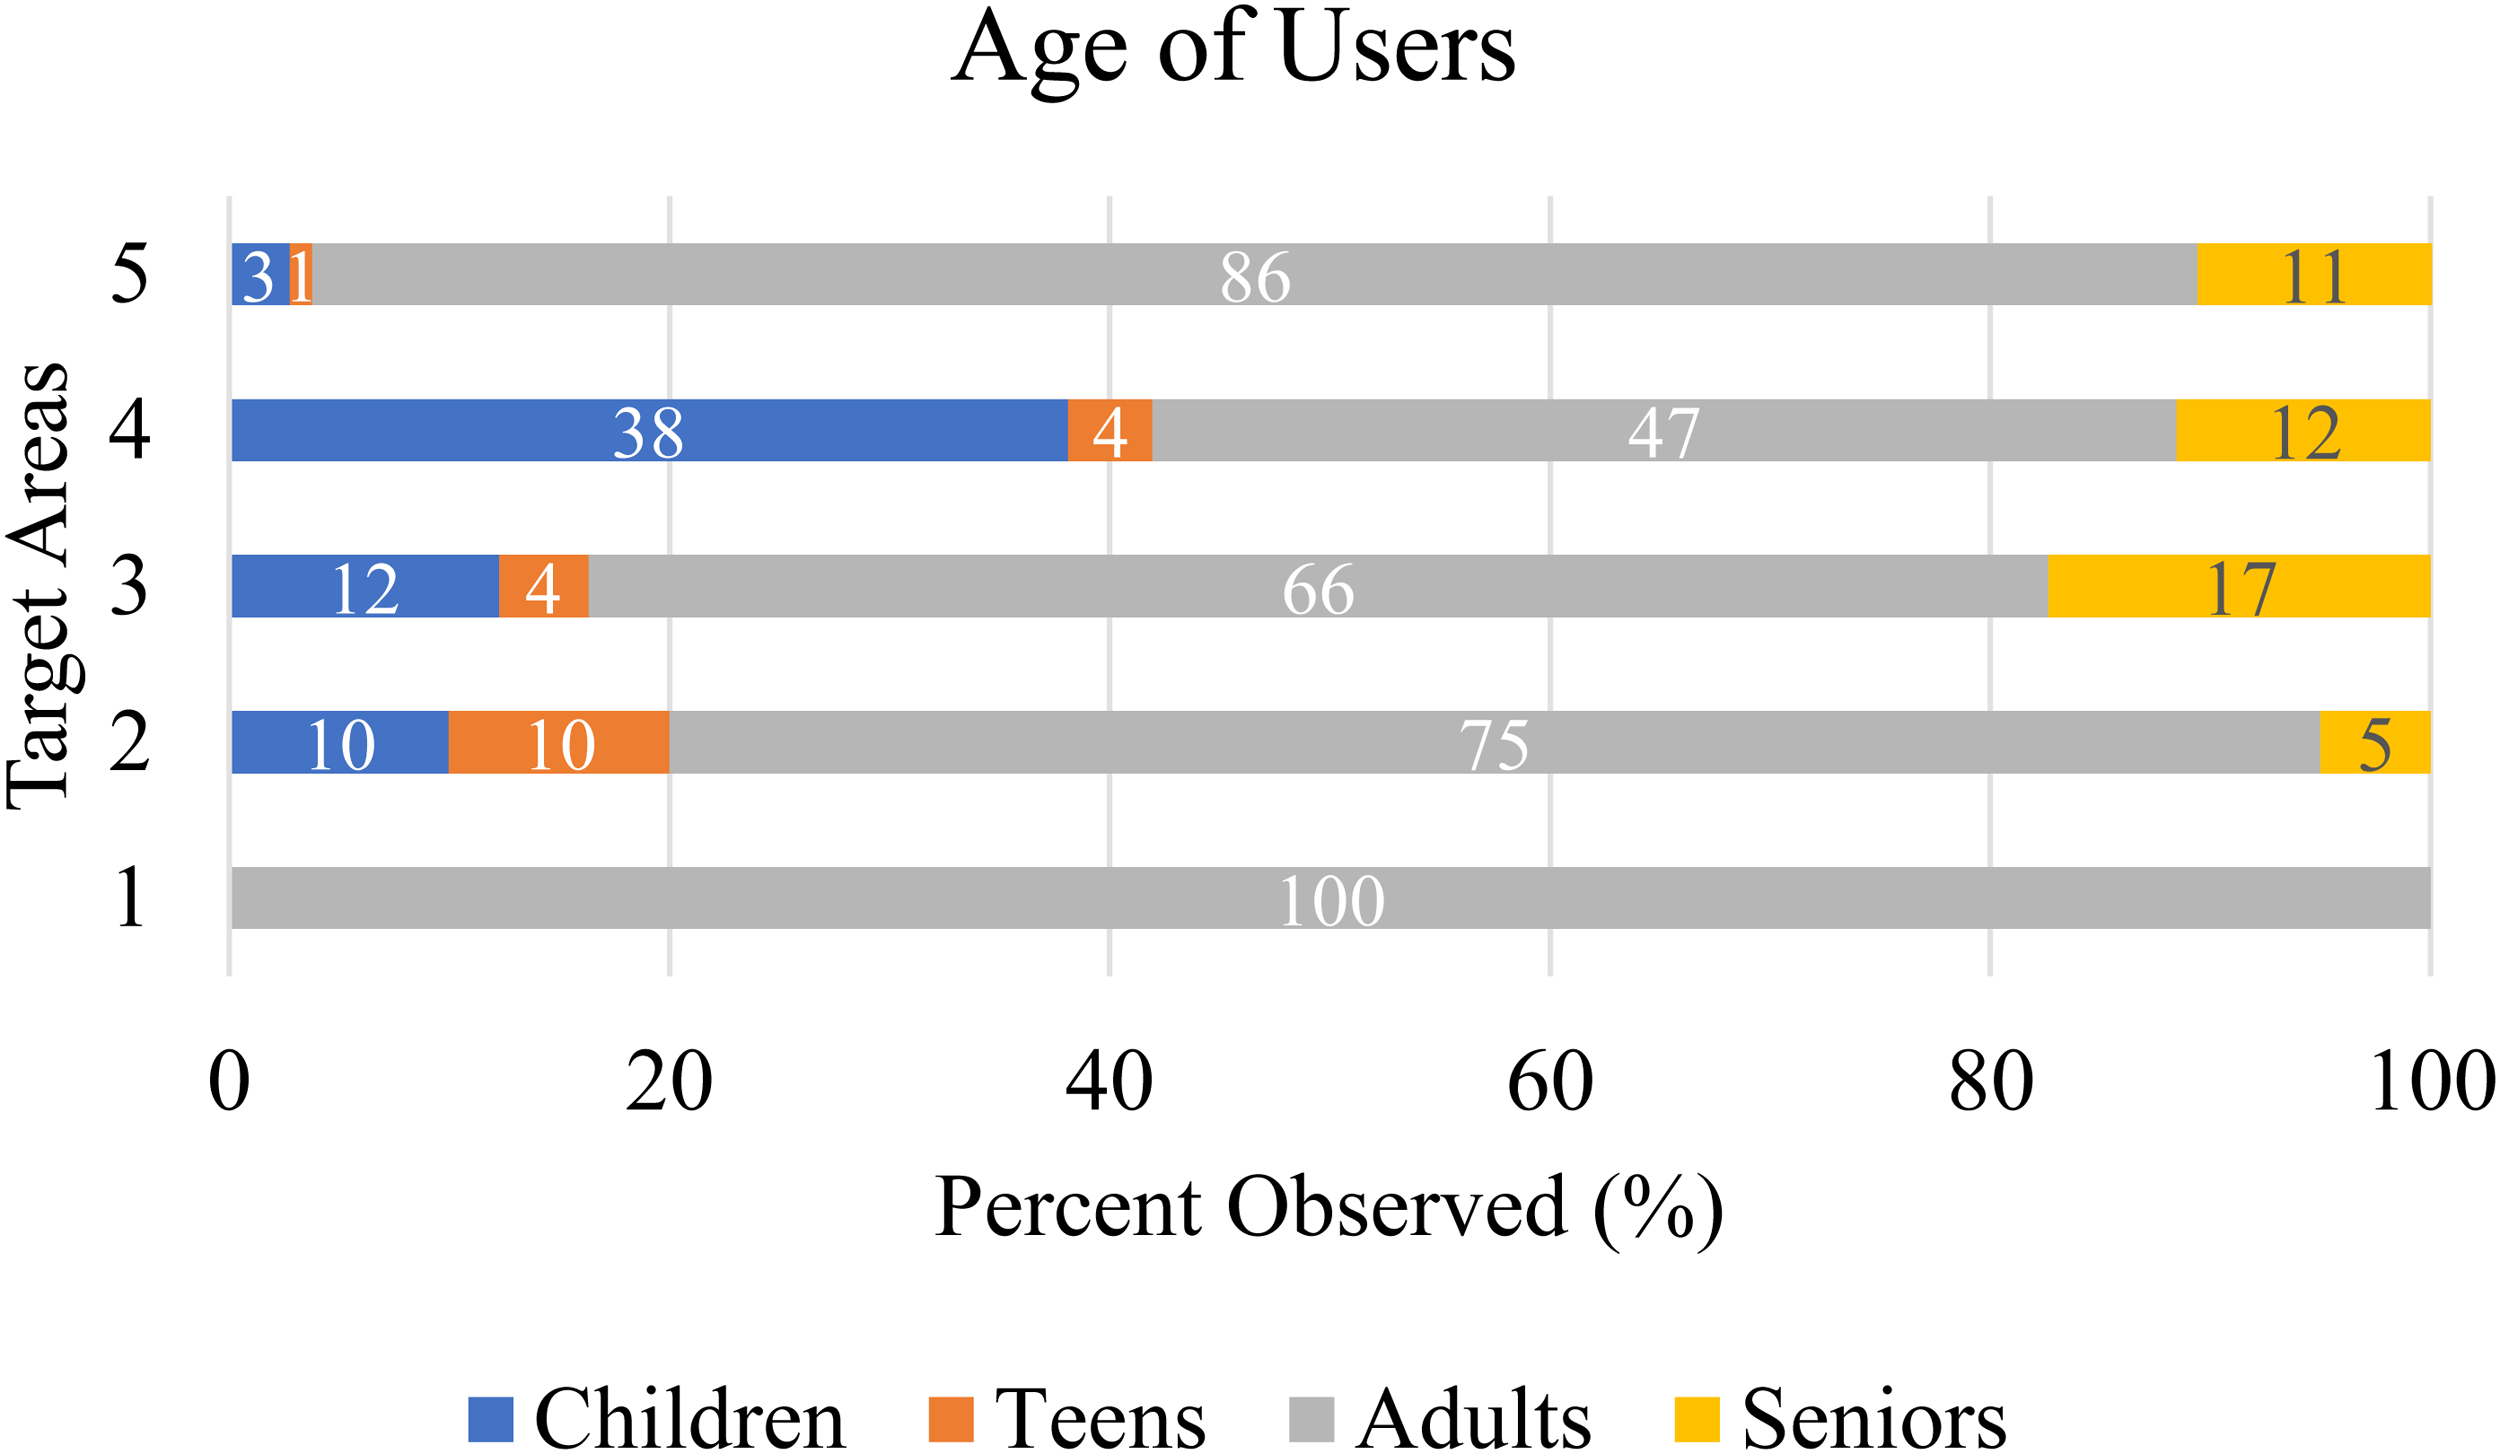
Observed age of users at each target area.
Comparing our park user observations with census demographics of surrounding neighborhoods and citywide estimates for Arlington, Texas (Table 2; Figure 8), we found several differences across gender, race/ethnicity, and age compositions. For gender, neighborhood averages indicate a slightly higher proportion of female residents (56%) than male residents (44%), which is similar to Arlington's citywide gender distribution (51% female, 49% male; U.S. Census Bureau 2022). Yet, we observed more male users overall, particularly in Target Area 2, relative to both the surrounding neighborhood and citywide demographics.
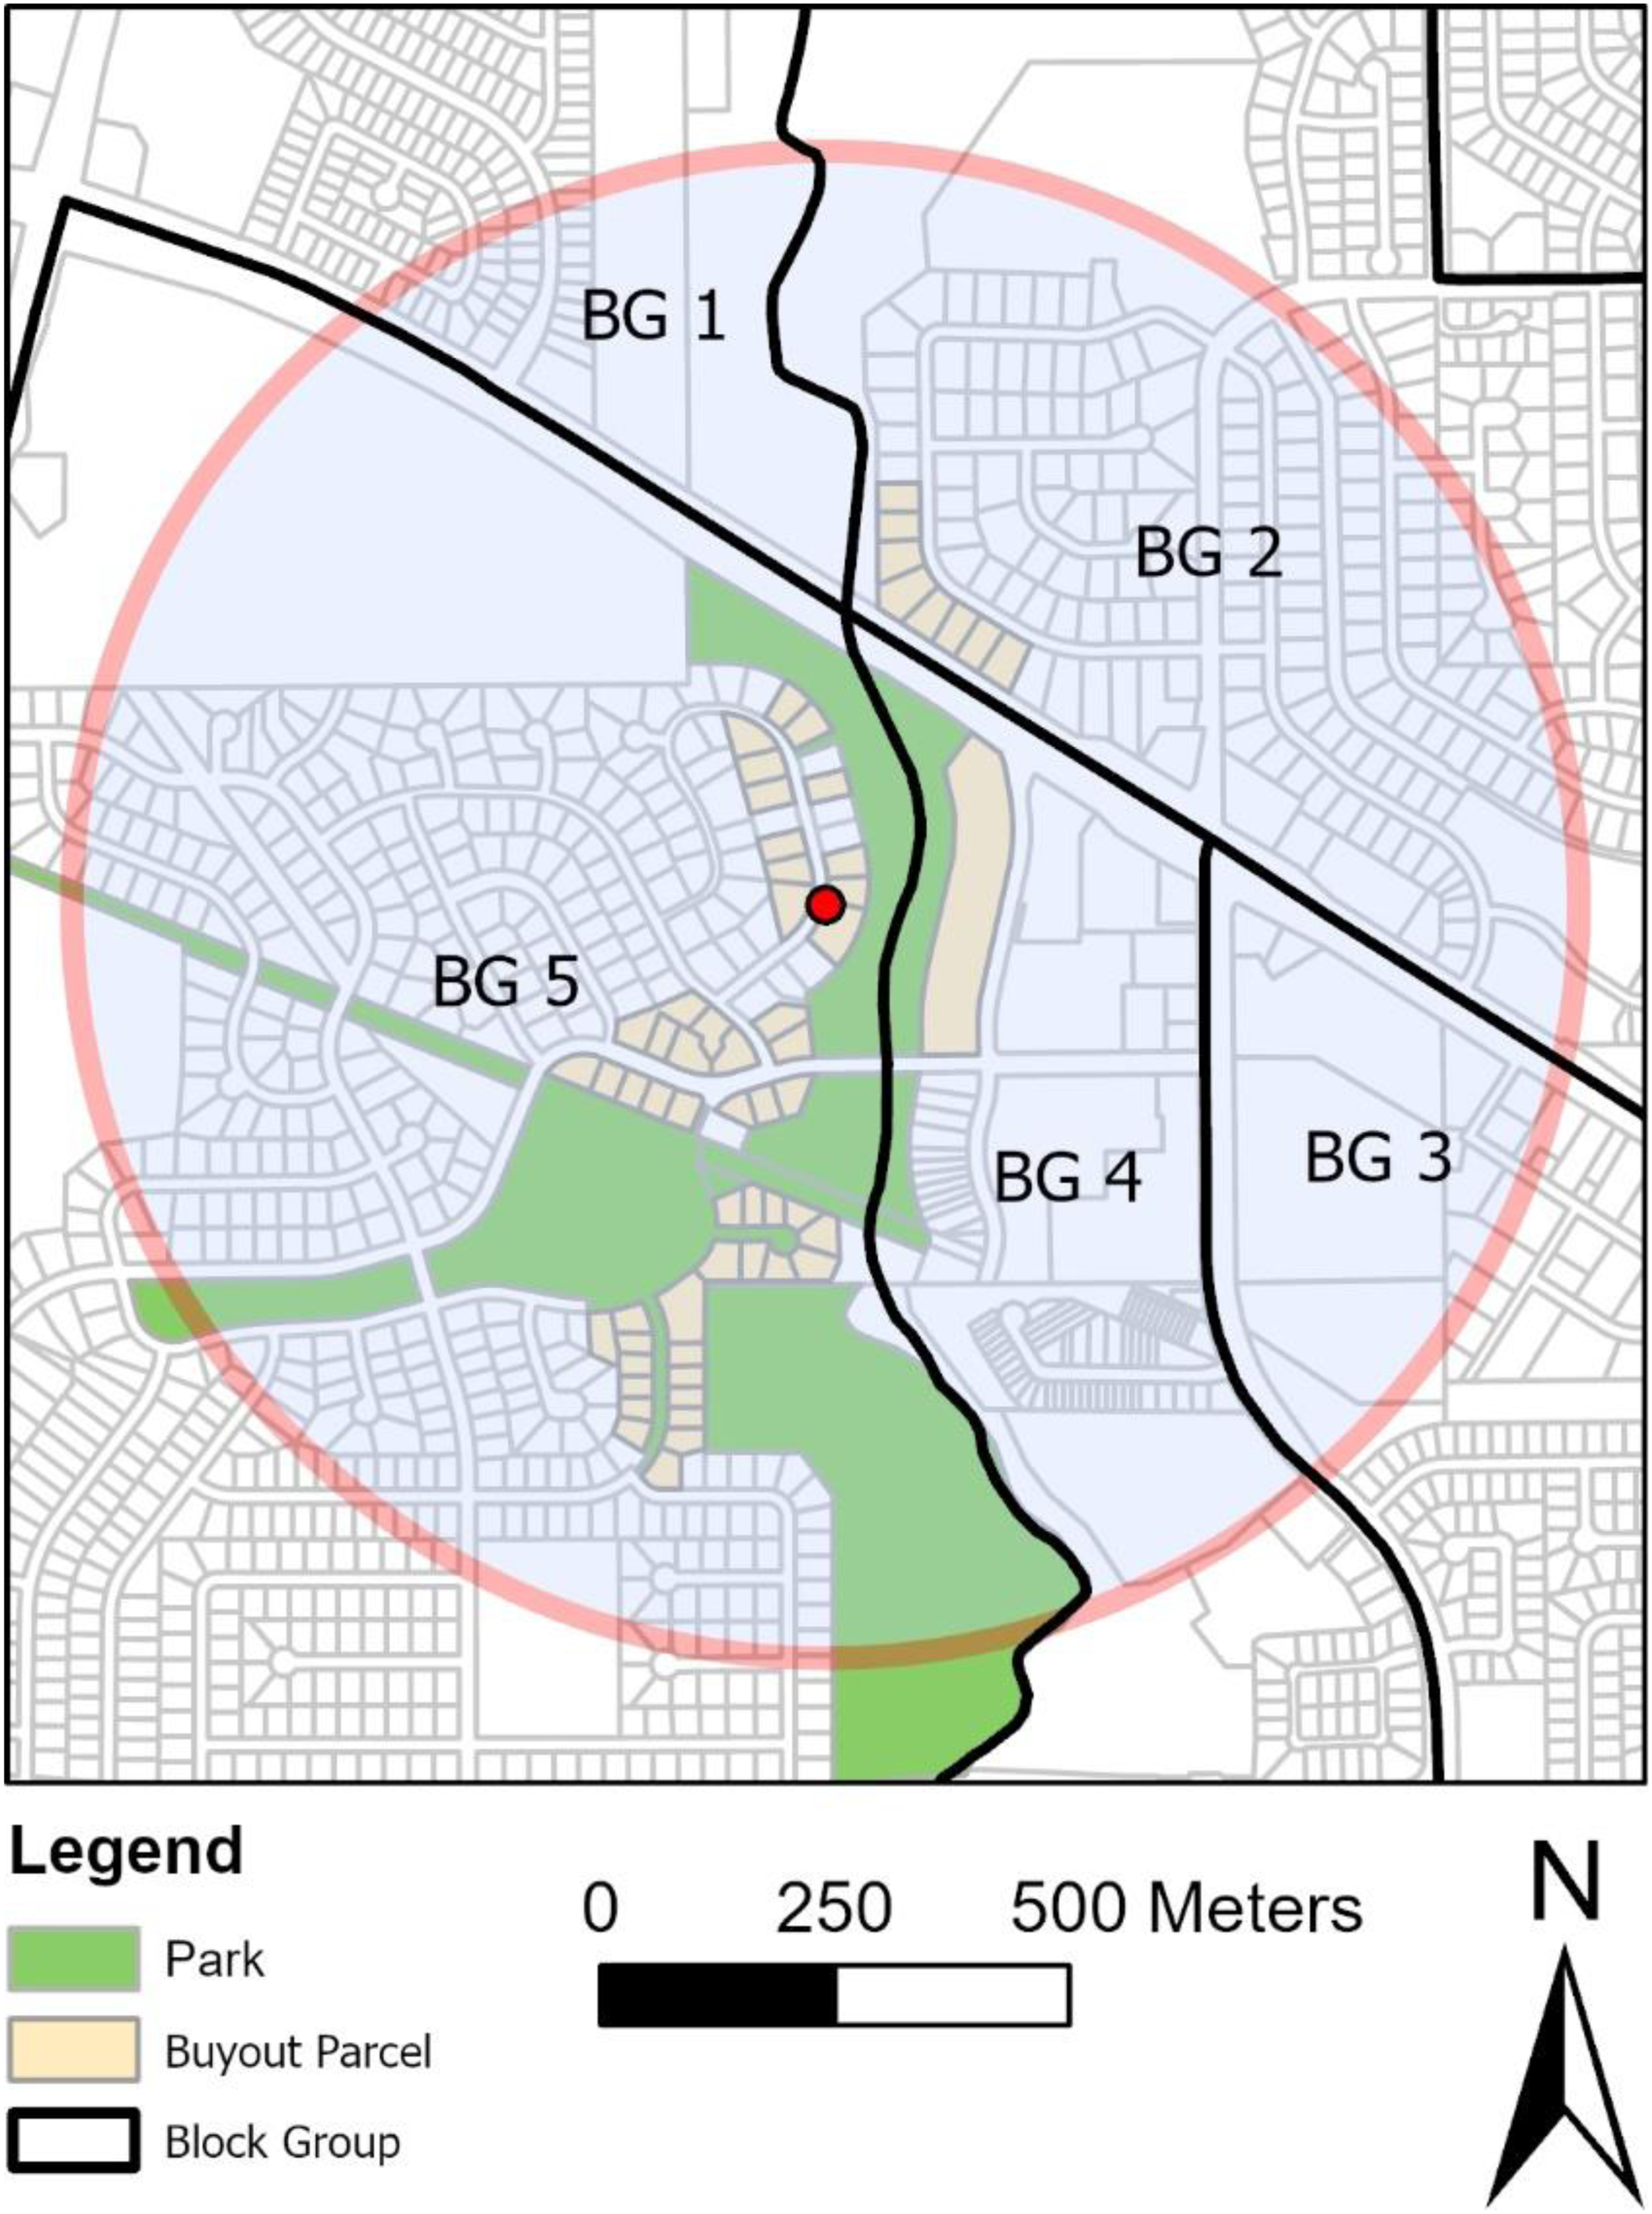
The U.S. Census block groups intersecting the 0.8-km (0.5-mile) buffer around the center of the postbuyout open space. Demographic characteristics for each numbered block group are provided in Table 2.
Demographic Composition of U.S. Census Block Groups Surrounding the Study Area and Citywide Totals for Arlington, Texas (U.S. Census Bureau 2022).
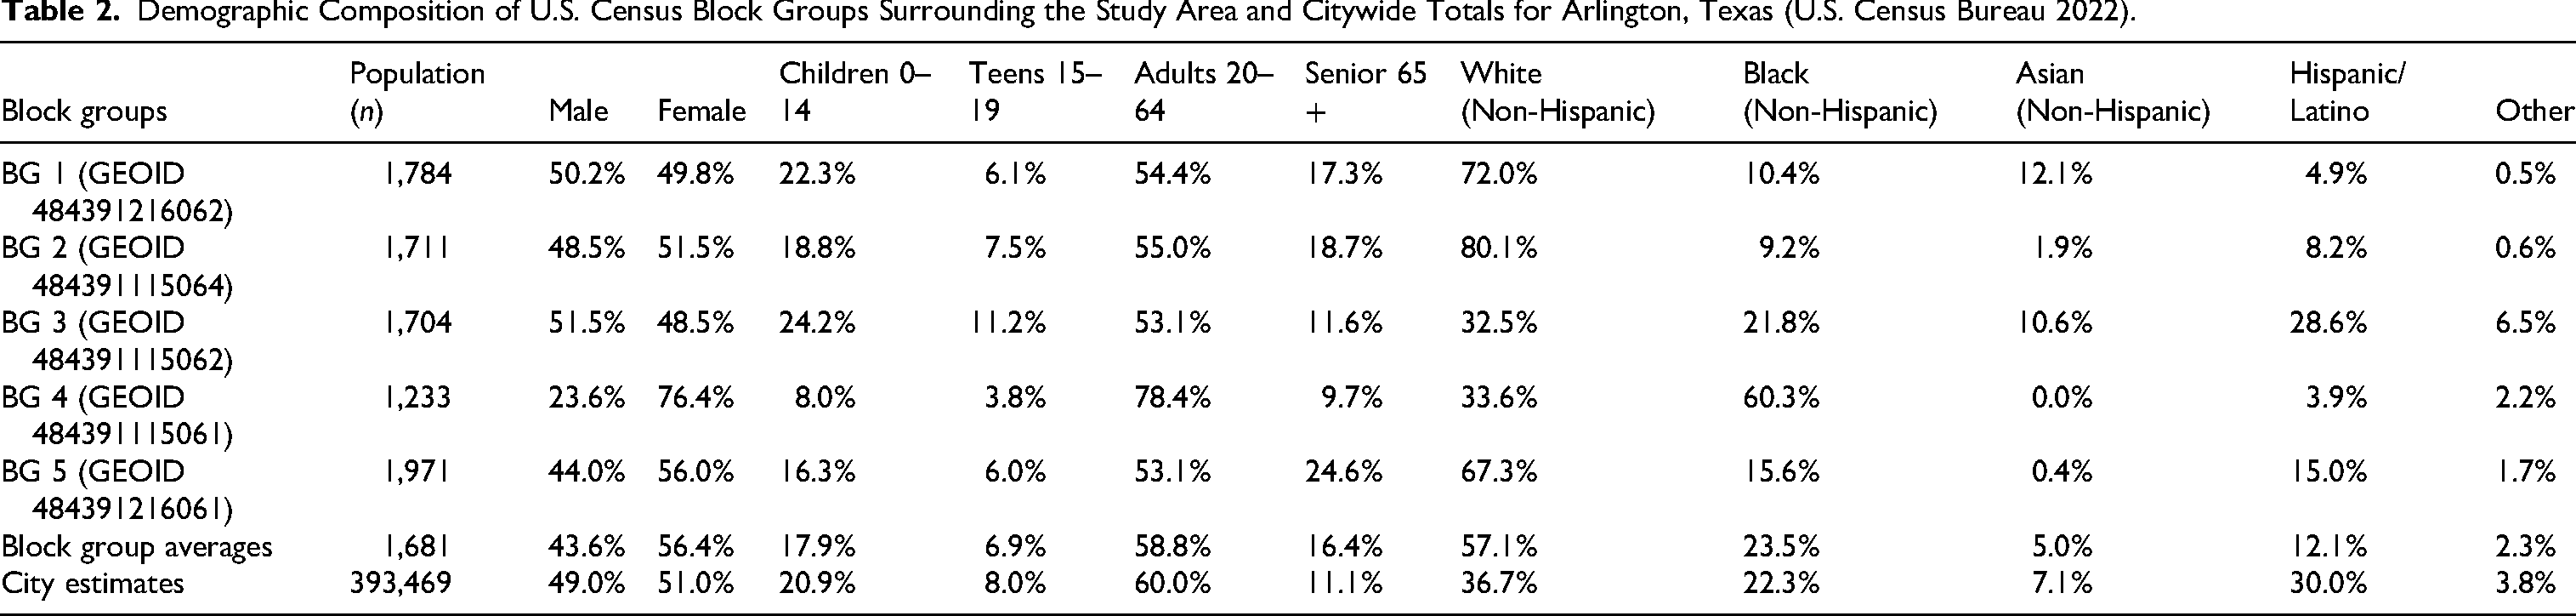
Similarly, the racial and ethnic composition of adjacent block groups also differs from observed park user patterns and citywide totals. The predominance of observed white users (Figure 6) is consistent with neighborhood-level demographics and citywide population patterns. White residents comprise the largest proportions of populations in block groups north (80.1%) and west (67.3%) of the buyout open space, as well as Arlington's overall population (36.7%) (U.S. Census Bureau 2022; Table 2). In contrast, one neighborhood east of the buyout open space has a higher proportion of Black residents (60.3%) compared to the citywide estimate (22.3%). Similarly, two adjacent neighborhoods have higher proportions of Asian residents (12.1% and 10.6%) than Arlington as a whole (7.5%). Despite these neighborhood-level demographics, we observed Black and Asian users less frequently than would be expected based on the racial composition of the surrounding area. This indicates that these groups are underrepresented among observed users. Conversely, Hispanic/Latino populations in the block groups surrounding the buyout open space are lower (3.9%–28.6%) than the Arlington estimate (30%; U.S. Census Bureau 2022). Yet, like Black and Asian residents, we observed Hispanic/Latino users less frequently relative to their representation in the surrounding block groups.
Finally, the age composition of surrounding neighborhoods is mostly characteristic of observed park user patterns and of Arlington. Most observed users were working-age adults (ages 20–64; Figure 7). This is consistent with the makeup of residents in adjacent block groups (53.1%–78.4%) and Arlington overall (60%; Table 2; Figure 8). Nearly one-quarter of residents in adjacent block groups are under the age of 20, with children ages 0–14 accounting for most of this group (17.9%), followed by teens aged 15–19 (7.0%). This reflects Arlington's citywide under 20 population (29.0%); yet, we observed children and teens less frequently than expected given the surrounding area's demographics. Adults aged 65 and older account for (9.7%–24.6%) of residents in the surrounding neighborhoods, with three adjacent block groups exceeding the citywide estimate for this age group (11.1%). Our observations of 65 and older populations, termed seniors, were similar to the citywide estimate, but lower than the adjacent areas. This suggests that both teens and older adults are underrepresented age groups among users.
Discussion
To our knowledge, this is one of the first studies to apply the SOPARC method to postbuyout open space to understand how these spaces are used by community members. It is important to note, buyout open space experiences an ad hoc implementation process compared with planned open spaces such as city parks, greenbelts, or playgrounds (Zavar and Hagelman III, 2016). Buyout open space is created as the result of hazard risk exposure and homeowner willingness to participate in the relocation program (Greer, Binder and Zavar 2021). This often results in a checkerboarding of open space parcels that remain near occupied houses. Land management decisions on buyout properties also lack the forethought associated with traditional planned open spaces resulting in repurposing land use to fit into the current landscape and community needs (Dascher et al., 2023). Given these reasons, it is critical to study land management and resident use of buyout open space independently of more traditional planned open space as the design, implementation, and management all occur from different processes.
The results provide two important contributions to the literature and to emergency management practitioners: (1) information on how active and passive recreational amenities are used, or not, on properties acquired via flood buyout programs and (2) empirical data that postbuyout land managers, which often includes emergency mangers or floodplain administrators, can use to make more informed decisions on the allocation of resources for buyout properties. Below, we discuss these contributions. In doing so, we situate the results within the current literature and outline opportunities for enhanced decision-making for postbuyout landscapes.
First, SOPARC observations provided information on the age, gender, and race/ethnicity of users, in addition to their level of activity and time of use across five target areas. We observed that formal amenities that support active recreational activities, such as exercise equipment, playgrounds, paved trails, and dog parks, all drew more total users and a more diverse user base across all demographic groups. For example, Target Area 4, which hosted a playground, baseball diamond, and walking trails, also offered benches and picnic tables under shade trees. This mixture of amenities drew the largest numbers of total users. Significantly, seniors and teens, two populations underrepresented across all target areas, were observed more frequently in this target area than in the others. Comparatively, the target areas that only offered passive recreational activities experienced lower usage, which is consistent with previous research that showed visitors were more likely to frequent parks offering more active recreational activities compared to parks with passive activities (Talal and Santelmann 2021). We also observed that the target areas offering a wider range of amenities hosted more varied usage, both passive and active, and more diverse participants throughout the day. These results are similar to Roberts et al. (2019), who found that increased amenities improved park usability and user satisfaction. Additionally, other research suggests that improvements to park amenities increase not only the number of park users but also physical activity levels and health benefits of users (Arifwidodo and Chandrasiri 2021; Cohen et al. 2015; Veitch et al. 2012). We observed the highest number of users engaged in vigorous activities in areas with many amenities.
Secondly, this analysis provides empirical data that can inform land managers tasked with developing and maintaining buyout properties. With these data, practitioners can identify target areas to install different types of amenities or improve underused areas. For example, the tennis court in Target Area 2 is gated and surrounded by homes, giving it the appearance of being privately owned. To increase public usage, land managers could add new signage to direct people to the public tennis court or increase visibility of the tennis court on government websites or social media platforms. Previous research identified different sociodemographic groups rely on different types of information sources to learn about parks and park amenities (Lee, Floyd and Shinew 2002). Specifically, Black, lower-income households, and families with young children were more likely to seek information about park amenities through informal sources, such as friends and family, while White, higher-income households, and older adults relied on formal information sources, such as radio, television, and newspapers. By identifying underrepresented groups of users from SOPARC observations, such as Black and Asian populations in this study, buyout land managers can focus their efforts on reaching these groups by targeting alternative information sources and developing tailored outreach strategies.
Moreover, the demographic data on users’ age provides another opportunity for buyout land managers to increase park usage and diversity of users through SOPARC observations. Based on the simple analysis conducted in this study, comparing neighborhood demographics and park user numbers, we also found that teens and older adults were underrepresented in the observations at the Rush Creek buyout site. Land managers may want to consider advertising in places members of these age groups frequent to draw them to the postbuyout open space. Additionally, land managers could work with residents in the adjacent neighborhood or area schools to identify and offer amenities of interest for people from these age groups. Considering the 65-and-over population is increasing quicker than other age groups in the U.S. (U.S. Census Bureau 2022), it is important to include amenities designed for older adults. Research has shown that older adults seek accessible parks offering passive recreational activities, such as gardening and bird watching, along with ample seating, shade, and bathrooms (Veitch et al. 2020). Moreover, we observed a lack of organized activities at the Rush Creek buyout site; yet, organized activities have been shown to increase physical activity among older adults (Evenson et al. 2016; Veitch et al. 2020). Creating and implementing organized activities could be a cost-effective way to increase park use among adults over 65 years old. Additionally, our observations showed many young children performed vigorous activity after school in Target Areas 3 through 5. Currently, these areas lack water fountains, but they are needed given the age of users and level of activity.
Finally, areas with few amenities and low levels of observed use may offer the best opportunities for increasing ecosystem services, such as urban heat mitigation, carbon sequestration, stormwater regulation, and habitat provision (Beatley and Newman 2013; Chiesura 2004). Urban forests, for example, capture carbon and absorb air pollutants such as nitrogen oxides and ozone, which research suggests may reduce rates of childhood asthma (Lovasi et al. 2008). Similarly, research demonstrates that urban forests mitigate extreme heat stress (temperatures over 35°C) in urban areas. Urban areas with full canopy cover reduced afternoon average temperatures by 3.8°C modified Physiologically Equivalent Temperature (mPET). For our study, Target Areas 1 and 2 had the lowest levels of use and the fewest amenities. Land managers might consider these areas for increased tree plantings, no-mow zones, or native plant reforestation. These environmental changes not only offer passive recreational opportunities but support ecological resilience and promote community health (Deeksha and Shukla 2022; Miller et al. 2006; Tidball 2012) without disrupting existing amenities at buyout sites that residents use.
Taken altogether, the SOPARC method provides buyout land managers with a low-cost, easily replicable tool for assessing how postbuyout open space is used and how it can be improved. These data can inform decisions on amenities to offer, resource allocation, and outreach to ensure the postbuyout land better meets community needs.
Conclusions
With limited time, budget, and data, communities are faced with many challenges in implementing open space uses on buyout land. Yet, without empirical evidence, open space land management can become a guessing game that often results in low utility of the acquired properties (Dascher et al., 2023; Zavar and Hagelman III, 2016). This research demonstrates that the SOPARC method can be used by emergency managers and floodplain administrators to gain valuable data to understand how buyout open space is currently used, or not. With this understanding, land managers can identify strategies and approaches to better meet community hazard mitigation goals, increase amenities for residents, and improve ecosystem services. From our nonparticipant SOPARC observations of the Rush Creek buyout area in Arlington, Texas, we identified demographic characteristics including age, race/ethnicity, and activity level of users, as well as day and time of use. We identified that areas with amenities, such as paved trails, benches, dog parks, and playgrounds, drew more users to the open space than areas with only passive open space options. We also found that amenities obscured between houses in subdivisions were underused and may benefit from street-level signage to welcome users to the amenities. Although weekends attracted more users, we observed many children using the open space to walk to/from their houses and elementary school thus avoiding busy roads along with the perimeter of the neighborhood and buyout area. Yet teens and older adults were underrepresented in the observations, suggesting land mangers could offer new amenities that appeal to these age groups, or better advertise the existing amenities to target these age groups. Moreover, our observations suggest that Black and Asian residents are underusing the buyout areas and that different outreach strategies may increase the diversity of users to better reflect the demographic composition of the surrounding neighborhoods.
Critically, the SOPARC method can provide land managers with information on where to invest limited funds to increase amenities in high-use areas or identify locations that may be ideal to enhance ecological function given low use. Emergency managers and others can implement similar studies with minimal resources to inform open space management decisions on buyout properties so they can maximize mitigation goals while also best serving community needs. Although SOPARC is well established in Parks and Recreation (McKenzie et al. 2006), this research provides a novel application of the SOPARC method outside of traditional parks and recreation studies, thus extending the audience to include emergency management, often the custodians of postbuyout open space. Using SOPARC, land managers can examine how buyout land is used before deciding where to site amenities, in addition to determining how to improve the condition and utility of existing amenities on buyout open space. Looking forward, additional research is needed to evaluate its effectiveness across other buyout areas beyond this case study and over multiple seasons. This research offers a methodological template for future work that identifies patterns in amenity use across different locations, populations, and hazard risk exposures that can inform how local communities prioritize amenities on buyout open space, especially with limited resources. Future work should also consider usage patterns across different types of postbuyout open space, such as nature preserves, athletic fields, detention basins, and return-to-nature areas. Regardless, this initial study identifies the potential of the SOPARC method as an adaptable tool to improve postbuyout land use without requiring extensive resources.
Footnotes
Acknowledgments
The authors thank the City of Arlington for their support of this study and the reviewers for their feedback.
Ethical Considerations
Ethical approval was not required for this research as it only uses nonparticipant observational data collected at publicly owned land.
Funding
The authors received no financial support for the research, authorship, and/or publication of this article.
Declaration of Conflicting Interests
The authors declared no potential conflicts of interest with respect to the research, authorship, and/or publication of this article.
Data Availability Statement
Data will be made available on request.