
Abstract
Respondent burden is complex and represents more than just the time spent completing the survey. With this research, we highlight the importance of looking beyond objective measures to understand the respondent’s perception of the survey-taking experience. First, we asked participants to tell us in their own words about the term “burden” and how surveys and survey questions can be burdensome. We identified themes in how respondents think about surveys that can inform targeted approaches to reducing respondent burden. We then tested the idea that perceptions of burden may not adhere to any objective measure of what it means for a survey to be burdensome. Through survey instructions, we presented different frames of reference to dissociate perceptions of survey length from actual survey length and analyzed the effect on ratings of burden. Our research suggests that factors like repetition, disorganization, and perceptions of pointlessness are key to respondents’ understanding of burden. Different frames of reference translated to significant differences in both perceptions of survey length and perceptions of burden, regardless of actual survey length. To improve respondents’ survey-taking experience, survey designers must go beyond survey length to consider perceived burden.
1. Introduction
In the current climate of declining response rates, a common mandate to survey programs is to reduce respondent burden. Higher levels of respondent burden are thought to deter respondents, increase measurement error, and negatively impact future survey cooperation (Peytchev and Peytcheva 2017; Stocké and Langfeldt 2004). Typically, the practical effects of such directives are to reduce the length of the survey. Indeed, the law governing how U.S. federal agencies collect data emphasizes the importance of survey length in its regulation of the number of burden “hours” imposed on the public (Office of Management and Budget 1995). These efforts at burden reduction are easy to assess and reliable. If the data cannot be obtained from another source, however, reducing the length of the survey and the number of questions asked reduces the level of detail, amount, or type of information available and can result in diminishing the value of the survey to data users. A renewed interest in recent years in distinguishing between objective and perceived burden (Kunz and Gummer 2025; Yan and Williams 2022) may offer a different way forward. In this article, we carry forward the conceptualization of “burden” as negative feelings experienced by survey respondents (Frankel 1980; Yan and Williams 2022), going beyond the narrow definition used in the collection of data for official statistics in the U.S. Federal government. Research into how respondents themselves perceive the factors that cause respondent burden will enable survey organizations to more effectively target the sources of respondent burden. This approach drives our research questions and data collection designs, pushing to identify methods to improve the respondent survey experience without reducing the value of the survey.
1.1. Prior Research
There are a number of theoretical models defining respondent burden and the field has not converged upon a single conceptualization, though there does seem to be increasing interest in the inclusion of both objective survey features and respondent perceptions (see Yan and Williams (2022) for a review). Objective burden can be calculated and measured reliably through instrument paradata and properties of the questionnaire. Number of questions, number of interviews, number and size of the respondent’s tasks, and number of contact attempts are examples of objective burden (Groves and Couper 1998; Hoogendoorn and Sikkel 1998). However, these objective concepts are only proxies for a respondent’s survey experience and may not have a direct effect on respondents’ experience of burden (Fricker et al. 2014; Yan et al. 2020). Researchers have proposed that, to understand the respondent experience of burden, we must measure perceptions and attitudes, including interest in the survey topic, views of the importance of the survey, motivations, perceptions of task difficulty or sensitivity, and perceptions of time and effort spent (Bradburn 1978; Earp et al. 2022; Sharp and Frankel 1983; Yan et al. 2020). For example, consider perceived survey length. Although the concept of length is objective, the perception of how long it feels to respond to a survey is subjective and that perception may be affected by factors beyond survey length alone (Fricker 2016). Similarly, perceptions of burden represent how the respondent feels about the survey experience.
1.1.1. Measuring Respondent “Burden.”
Although surveys use the term “burden” both in public materials summarizing surveys and in survey questions themselves, researchers have not yet confirmed that respondents and survey designers understand the term in the same way.
A common method for eliciting how respondents feel about the survey experience is to ask a direct question about how burdensome the survey was (Bottone et al. 2018; Galesic 2006; Hedlin et al. 2008; Yan et al. 2020; Yan and Williams 2022). In some cases, this direct question is used to capture an overall perception of respondent burden with only a single question. The U.S. Bureau of Labor Statistics (2012) uses this question in the Consumer Expenditure Quarterly Interview Survey: “How burdensome was this survey to you? Very burdensome/Somewhat burdensome/A little burdensome/Not at all burdensome.” In the field test of the redesigned National Health Interview Survey, Dahlhamer et al. (2019) used the same question with a different response scale: “How burdensome was this survey to you? Would you say … not at all burdensome, a little burdensome, moderately burdensome, very burdensome, or extremely burdensome?” The concept has also been extended to specific dimensions of the survey experience, such as in Engstrom and Sinibaldi (2024): “Would pre-filling answers make the survey burdensome? Much more burdensome/A little more burdensome/Neither more nor less burdensome/A little less burdensome/Much less burdensome.” In these examples, the question does not define burden or reference either objective survey features or perceptions.
However, the concept of “burden” has been only minimally pre-tested for use with respondents (Holzberg and Katz 2022). Lacking the knowledge of how respondents interpret the concept of burden means that it is not known if respondents interpret the term as intended by researchers. It is also not known whether the term represents the modern survey experience, in which the public is receiving an increasing number of survey requests and responding to those requests online in a self-administered mode. These changes may affect how respondents conceptualize the experience of taking surveys. Research is needed to explore the concept of burden from the respondent point of view to understand what factors affect respondent perceptions of the survey-taking experience and outcomes like respondent effort, cooperation in future surveys, and attitudes toward surveys.
1.1.2. Disentangling Objective and Perceived Burden
Previous research has shown that judgments often are made relative to a reference set. For example, individuals have been shown to care more about their income level relative to a socially-constructed group of peers rather than in absolute terms, and this rank judgment is ultimately correlated with ratings of well-being (Boyce et al. 2010). Even ratings of objective physical phenomena such as brightness and loudness are subject to context dependence (Lockhead 2004). Perceptions need not be tied to their objective reality.
Likewise, a respondent’s survey experience takes place not in a vacuum but within a context. At the survey participation level, Tourangeau and Ye (2009) showed that framing of a survey request as either a loss or a gain affected response rates. At the question level, multiple studies have shown that responses to attitude questions depend on the context created by earlier items in the questionnaire (Schuman and Presser 1981; Schuman et al. 1981; Wang et al. 2014). Building on these ideas, we propose that the context or frame of reference can change how burdensome an activity is perceived to be. A respondent may judge a survey experience to be not at all burdensome when compared to preparing taxes but that same survey experience may be judged to be extremely burdensome when compared to ordering a pizza. In the context of survey length, previous studies have shown that announcing a longer survey has negative effects on survey outcomes, including lower response rates (Crawford et al. 2001; Galesic and Bosnjak 2009; Marcus et al. 2007). However, these studies did not disentangle the announced (perceived) length from the experienced (actual) length of the survey. For example, Galesic and Bosnjak (2009) made participants aware of the expected survey durations and then the subsequent survey instrument was tailored to match those expectations. It is not possible in that study to distinguish the effects of the objective characteristics of the survey and a respondent’s perception of those characteristics.
In a related line of research, Yan et al. (2010) varied both actual and announced survey length and provided feedback to respondents in the form of progress indicators. The progress indicator feedback resulted in changes to break-off rates and other data quality indicators, confirming that respondent perceptions of survey length are an important part of the overall survey experience. However, the effects were complicated, depending on whether the feedback provided to respondents was positive (more progress than expected) or negative (less progress than expected) relative to respondent expectations. Research into other ways of using feedback to set respondent perceptions is still needed.
1.2. The Present Research
Previous research has documented that reductions in actual survey length alleviate perceptions of respondent burden. But there remain gaps in our understanding of what we are measuring when we ask respondents about burden and in our understanding of how to reduce burden in a way that is meaningful to respondents. With this research, we aim to identify new pathways for leveraging the respondent experience to reduce perceived burden by addressing the following research questions:
Research Question 1: How do respondents perceive the burden of their survey experience?
To explore how respondents perceive the survey-taking experience, we asked participants to describe their perspectives in their own words. In these data, we looked for themes in the way that respondents think about surveys and burden that can inform approaches to reducing respondent burden effectively.
Research Question 2: Do objective and subjective components of burden uniquely contribute to overall perceptions of burden?
We propose that the respondent’s subjective experience of burden can be separated from objective measures of burden. In other words, a respondent’s perceptions of the survey-taking experience will affect their ratings of burden, regardless of their actual survey burden.
2. Methods
2.1. Participants
To collect these data, we conducted multiple surveys with an online non-probability panel. Participants gave their informed consent to participate in the research.
The data for Research Question 1 came from two surveys (a main survey and a follow-up available only to participants who completed the first survey). A total of 386 participants completed the two surveys, and of these participants, 51% were male, 5% identified as Hispanic or Latino, and the majority identified as White (85%; 7% identified as Black, 6% as Asian, and fewer than 2% as American Indian or Alaska Native or Native Hawaiian or Other Pacific Islander). The median age was thirty-six years old. The highest level of education attained was a Bachelor’s degree or higher for 57% of participants.
A total of 488 participants completed the survey collecting data for Research Question 2 (an additional 56 participants broke-off from the survey before completion and are included only in break-off analyses). Of these participants, 52% were male, 7% identified as Hispanic or Latino, and the majority identified as White (85%; 10% identified as Black, 6% as Asian, and fewer than 4% as American Indian or Alaska Native, or Native Hawaiian or Other Pacific Islander). The median age was thirty-four years old. The highest level of education attained was a Bachelor’s degree or higher for 50% of participants.
These samples from the online non-probability panel are not representative of most U.S. government surveys. These samples have more participants self-reporting as White, fewer participants self-reporting as Hispanic or Latino, and more participants self-reporting an educational attainment of a Bachelor’s degree or higher than estimates based on the American Community Survey during a similar time period (U.S. Census Bureau 2016a, 2016b). Additionally, this panel is likely to have past experience with surveys and research studies. We expect that participants’ direct experience with surveys means that they will have multiple survey experiences to draw from when reflecting on what response burden means to them and evaluating the surveys in this study. This experience likely leads to stronger attitudes toward surveys that may be predictive of future behaviors (Fazio and Zanna 1981). However, that same experience may mean the participants are less susceptible to context framing because they have their own reference set of relevant surveys. It is not known what effect this experience or this sample source may have on the study.
For each survey, participants received a payment of $ 0.75. This amount was typical for similar studies on this platform and did not depend on their responses, only on the completion of the survey. Although monetary incentives may often be a motivation for online non-probability panelists to participate in surveys, Kocar and Lavrakas (2025) found that desires to help with research, contribute to a better understanding of attitudes and opinions, and benefit the community were the most common motivations for non-probability panel volunteers in an academic organization setting. Similar motivations may also play a role in the current study, given that the study was described to participants as “research,” participants were asked to “tell us about what they think,” and the study was being conducted on behalf of the Bureau of Labor Statistics (BLS).
2.2. Design
2.2.1. Research Question 1
The data for exploring perceptions of the term “burden” for Research Question 1 came from a pair of surveys. Analysis is limited to participants who completed both surveys (65.5% response rate to an email invitation one week after the first survey, AAPOR RR1). Each survey took approximately ten minutes to complete. The analysis for this study focused on participants’ responses to debriefing questions about the survey experience. The rest of the content, which included twenty items designed to induce different levels of burden (high burden example: estimation of how many people, including children, live in your neighborhood, with responses in intervals from 0–50, 51–100, and so on up to 1,001 or more; low burden example: preference between responding to surveys on desktop computers or mobile smartphones), was not analyzed for this study. The survey content was the same for all participants. The questions analyzed in this research are detailed in the Appendix.
The first survey included questions collecting open-ended examples of burdensome activities. The questions used in this analysis appeared near the end of the survey after a direct question collecting overall burden of the survey. Participants were shown each of the prompts below (repeated for “somewhat burdensome”).
(1) We would like to understand how your experience participating in this survey relates to other experiences in real life. Name an activity from real life that you would give a rating of “Extremely burdensome.”
(2) And please explain what makes that activity extremely burdensome.
The second survey included two separate questions collecting open-ended responses about what makes surveys and questions burdensome, in general. These questions appeared toward the beginning of the survey, after participants reported what they recollected about the first survey and how they decided to participate in the second survey. The two questions were:
(3) In your own words, what does it mean for participating in a survey to be “burdensome”?
(4) In your own words, what does it mean for a survey question to be “burdensome”?
Participants were also asked a closed-ended question about burden, located in the second survey after the open-ended questions.
(5) Which of the following would make a survey feel burdensome to you?
Participants were given a list of fourteen characteristics from which to select all that applied (categories shown in Table 5). The list of characteristics was designed by the authors to probe for concepts adjacent to burden that could inform future approaches to improving the survey experience.
2.2.2. Research Question 2
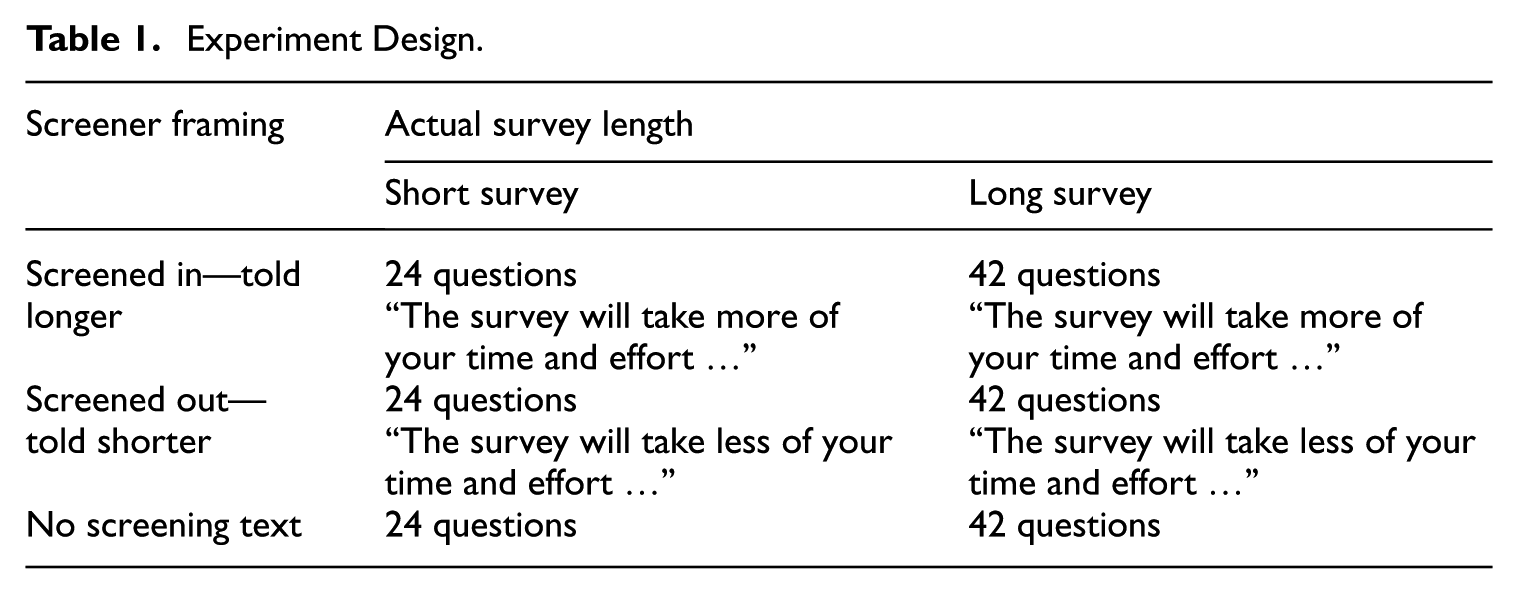
The data for Research Question 2, evaluating whether survey instructions can affect ratings of respondent burden by controlling the context in which the survey experience is judged, came from a third survey using the same online non-probability panel. We used a 2 × 3 between-groups experimental design that controlled actual survey length and the context in which survey length was perceived. With this design, we separate the effects of actual and perceived survey length on overall ratings of burden.
During the introduction to the online survey, participants were told that they would be answering questions about their attitudes toward BLS and behaviors related to BLS data. The description stated that the main survey would “take about 5 minutes, on average.” This average survey duration time was announced to participants in advance of their commitment to participate in the survey and all participants saw the same survey duration time estimate.
One-half of participants were assigned to the “short” survey condition (twenty-four questions total) while the other half of participants were assigned to the “long” survey condition (forty-two questions total). Although this design results in an overall short survey, we believe that short surveys are relevant. For example, the core of the Current Population Survey, a household survey that is the primary source for labor force data in the United States, is estimated to take a brief 8.1 minutes (Department of Labor/Bureau of Labor Statistics 2023).
One grid consisting of six questions was presented to all participants and framed as screening questions. After submitting their responses to these questions, participants then were shown the experimental context framing text intended to affect their perceptions of burden. Similar to Yan et al. (2010), this context framing provides feedback about survey progress. However, unlike Yan et al. (2010), the experiment does not rely on respondent expectations; the context framing provides explicitly positive or negative feedback regardless of actual time spent on the survey. We used three experimental groups: screened into a longer survey, screened out to a shorter survey, no screening. One-third of participants were told they were screened into a survey that was longer than what others were asked to do, with the following text: Based on your answers, we will now ask you to complete the long version of our survey and go through additional sections and answer extra questions. Unfortunately, you will have to answer more questions that other respondents don’t have to. The survey will take more of your time and effort than originally estimated. We appreciate your participation in the survey.
One-third of participants were told they were screened out of a longer survey and so had to do less than others, with the following text: Based on your answers, we will now ask you to complete the short version of our survey and skip past some survey sections and answer fewer questions. Fortunately, you don’t have to answer those questions that other respondents have to answer. The survey will take less of your time and effort than originally estimated. We appreciate your participation in the survey.
The final third of participants did not receive any screening outcome information. These participants proceeded from the first question grid directly to the next question grid, without any awareness of the text shown to other participants.
Although we refer to these different framings as screener outcomes, they are effectively the same as the survey pathing, branching, or skip logic commonly found in surveys. A respondent who reports not currently working for pay is not asked questions about work arrangements; a respondent who reports having an expense for furniture is then asked questions about those furniture purchases.
With this factorial design, we assessed respondent burden for participants who experienced the same actual survey length (e.g., forty-two questions) but had different burden frames (screened in, screened out, no screening). Likewise, we assessed burden for participants who experienced the same burden frame (e.g., screened out) but experienced different survey lengths (twenty-four or forty-two questions). Participants were randomly assigned to treatment conditions using this factorial design, summarized in Table 1. Because the screening outcome is displayed during the survey, rather than afterward as part of the burden judgment question, we believe that the context framing will affect how participants feel during the survey.
Experiment Design.
The survey questions were presented in a grid format, such that each page presented six questions that used the same response scale. The questions are included in the Appendix. All participants received the same first grid. After completing the first grid and receiving any screening text (or not), the participants completed the rest of the survey. The remaining question grids came from a set of six grids. Participants in the short survey condition were shown a random selection of three out of these six grids while participants in the long survey condition were shown all six grids. The survey content for any given participant varied but all questions for both the short and long survey conditions came from the same pool of questions about attitudes toward and behaviors related to BLS data. After completing the grids, a screen instructed participants that the main survey was over and that participants would next be asked to answer debriefing questions about the experience of completing the main survey. The debriefing questions asked participants for ratings of how burdensome it felt to participate in the survey and for ratings of their perceptions of survey length and other dimensions of burden that were not the focus of this analysis; the questions analyzed in this research are detailed in the Appendix.
The survey instrument collected the amount of time spent on each grid of six questions from the time that the page was presented until the time that the page was submitted. Summing the time spent on each question grid results in a measure of overall survey duration excluding any time spent on reading the screener text quoted above (this was excluded to reduce the impact of anticipated variance in reading speed and to account for the absence of any screener outcome text to be read in the control condition). Although survey duration and actual survey length are conceptually related, duration varies by individual and reflects dynamic factors such as effort.
2.3. Analysis
2.3.1. Research Question 1
We asked participants to use their own words to describe causes of burden. Analysis of these open-ended responses began by using an inductive coding approach to develop a coding scheme based on a preliminary review of the responses (Boyatzis 1998). This method is often used for exploratory research because it enables researchers to identify novel themes and capture subtleties in participants’ actual language, which may be missed when relying on pre-existing categories. Two coders worked together on approximately 10% of cases to refine coding definitions and rules of selection. Coding rules are described in the Appendix. After excluding training cases, the coders each independently coded half of the remaining sample. The coders double-coded approximately 25% of the sample for inter-rater reliability analyses. Kappa values ranged from 0.50 to 0.82; the coders had “moderate” to “almost perfect” agreement (Landis and Koch 1977). Due to the open-ended nature of the data, some responses included multiple concepts. To represent this, coders assigned multiple secondary codes, as needed. The codes are described in the Results section.
The main variables of interest from the open-ended text responses were the codes that emerge from inductive coding, the relative frequencies of the emergent codes, and the frequency of participants reporting multiple reasons. From the pre-determined list of burden-related characteristics, we focused on the relative frequencies of selection of each characteristic.
2.3.2. Research Question 2
This experiment used a 2 × 3 between-subjects design to evaluate the effects of actual survey length (short, long) and screener framing (screened in, screened out, no screening). The primary analysis focuses on perceived burden ratings using a question and 5-point ordered response scale similar to what has been used in previously published research (e.g., U.S. Bureau of Labor Statistics 2012). Although the ratings are ordinal, we assume they are sufficient for parametric analyses given Levene’s test indicated equal variances (F(5, 480) = 1.48, ns). The ANOVAs were assessed for main effects and, if significant, followed-up with pairwise comparisons using the Bonferroni adjustment for multiple comparisons. The same analyses were conducted with survey duration added as a continuous covariate.
To support the main analysis, we also assessed the effectiveness of the experimental design. We assessed the effect of the actual survey length and screener framing groups on survey duration and perceptions of survey length.
A separate analysis evaluated whether the relationship between screener framing and break-off rates was significant. This analysis looked specifically at the break-offs that occurred immediately after the screener framing announcement was shown to participants. A chi-square test of independence compared break-off rates across the screener framing groups.
3. Results
3.1. Research Question 1: Perceptions of “Burden” and Its Causes
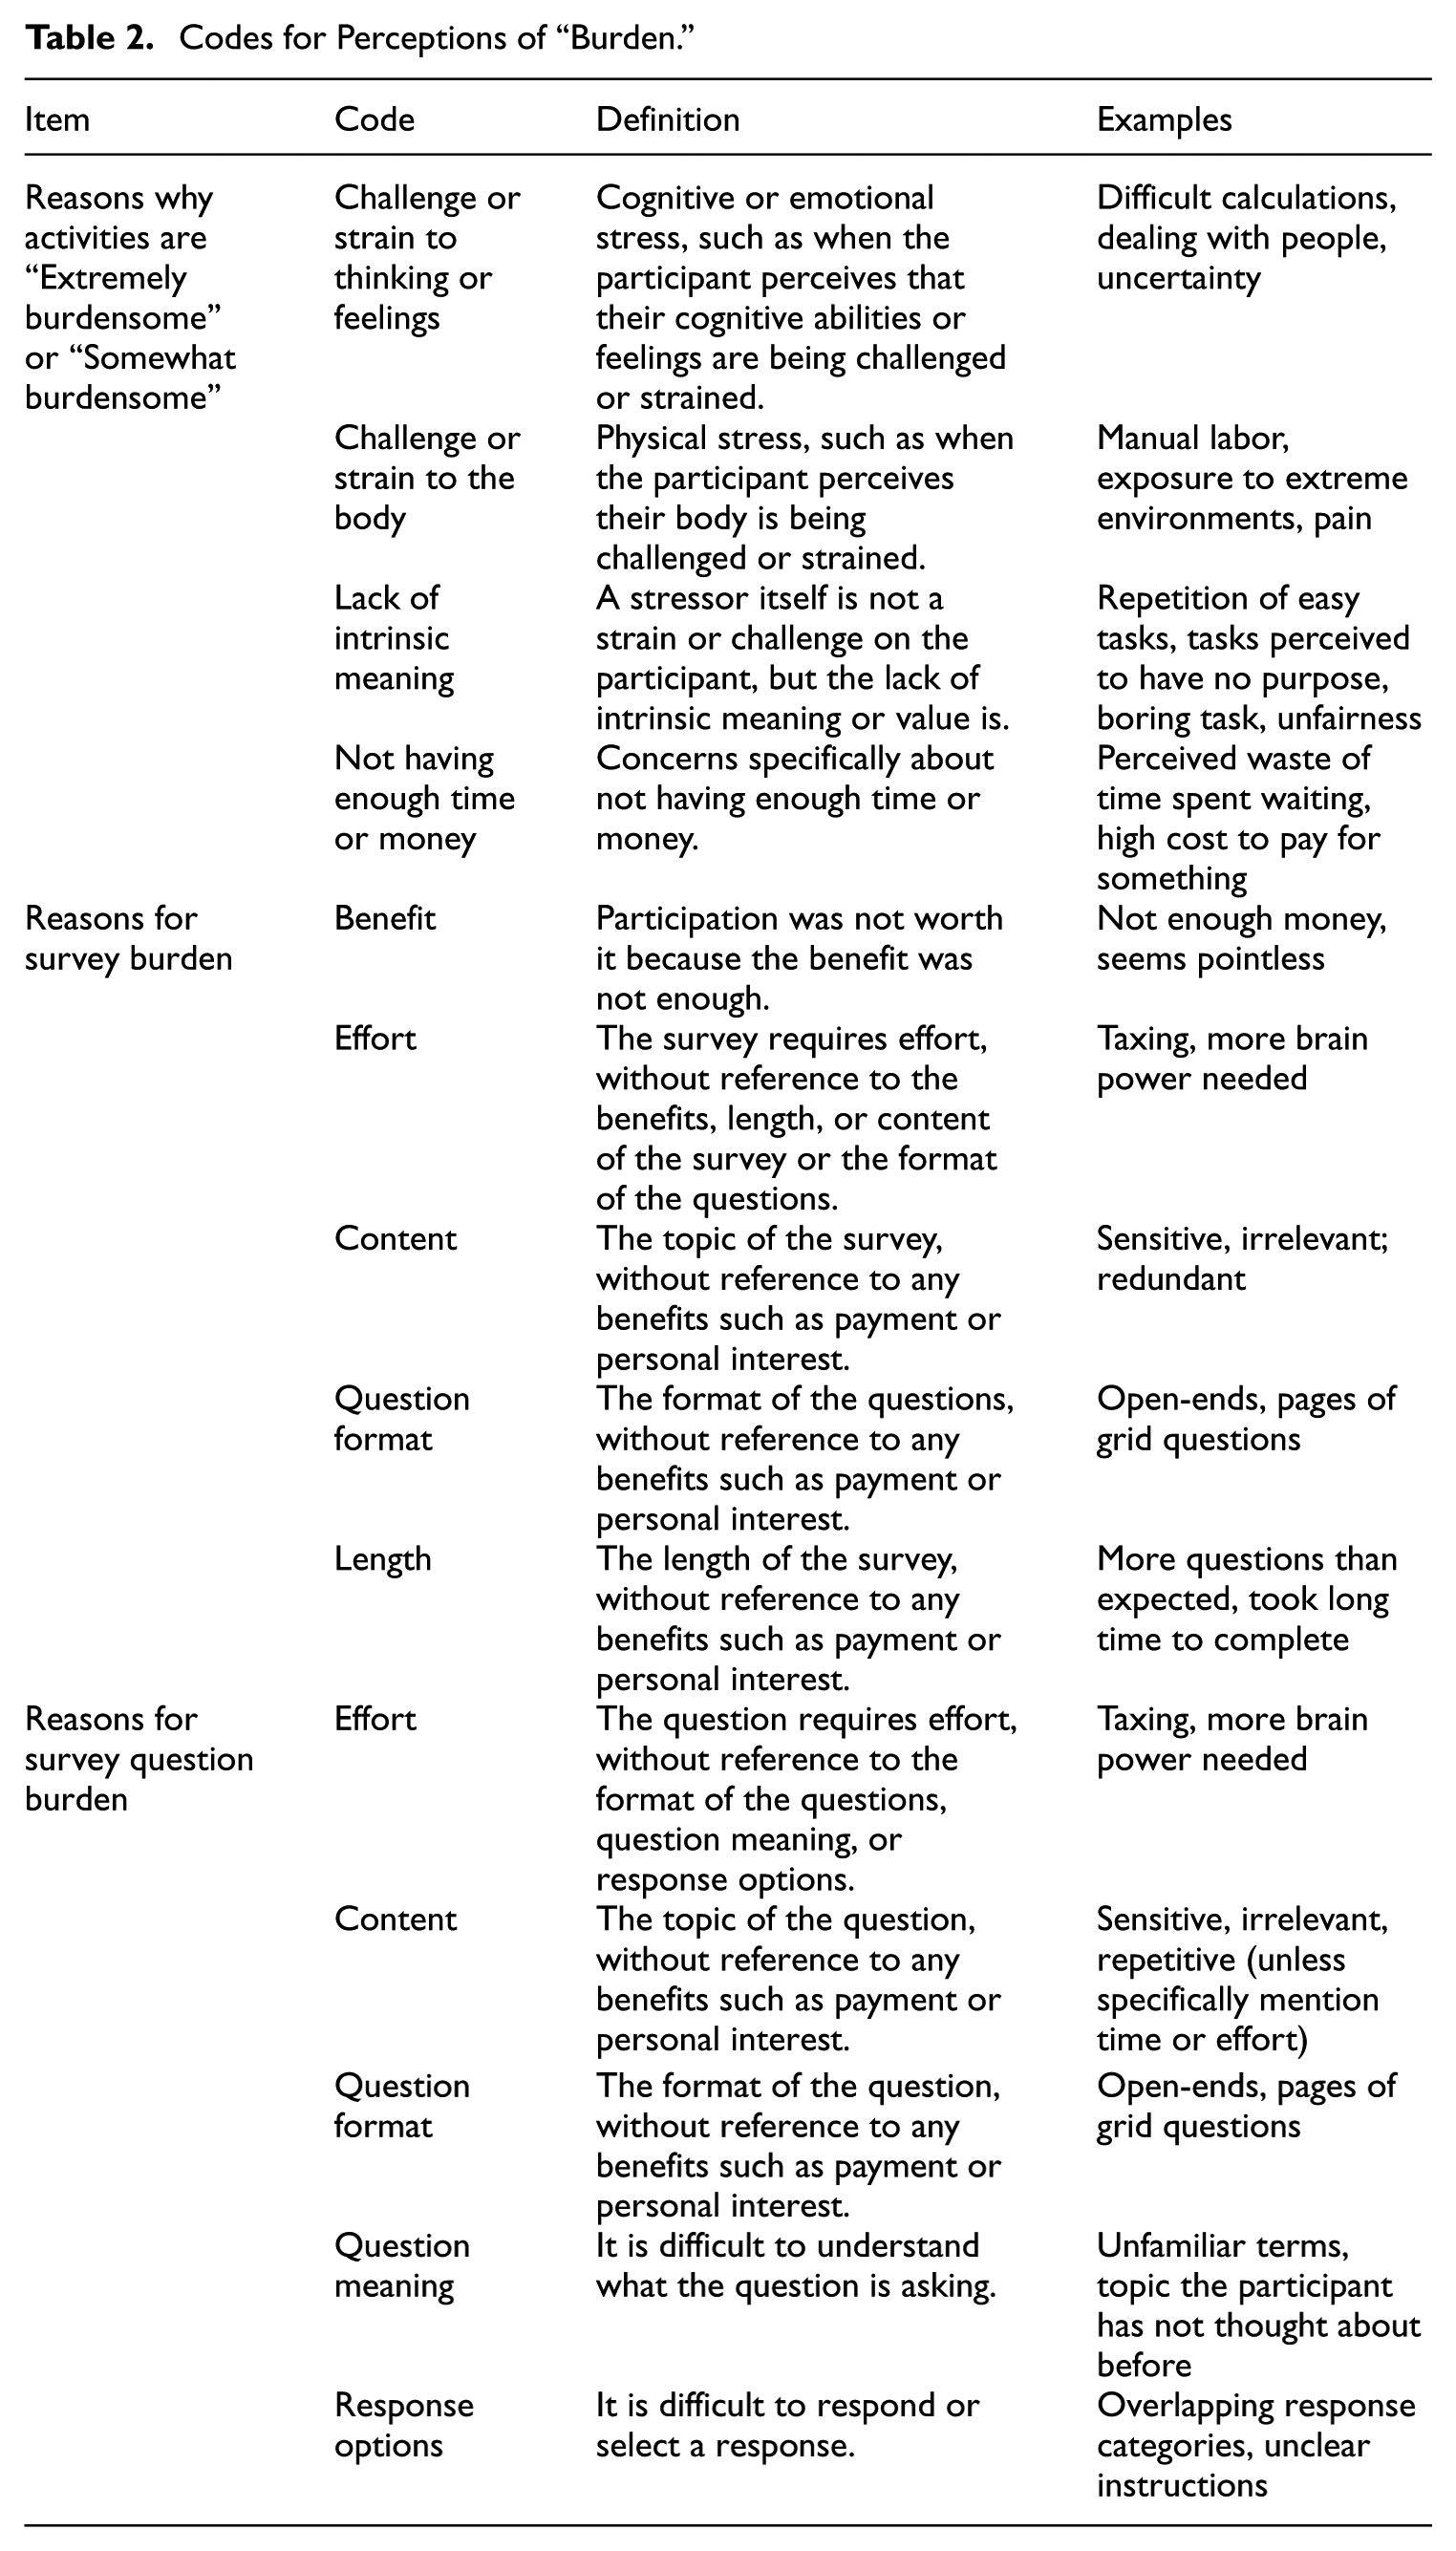
The inductive coding of the open-ended responses to summarize participant perceptions of the term “burden” as it related to burdensome activities, reasons for survey burden, and reasons for question burden resulted in the codes is summarized in Table 2. The codes summarizing why surveys and survey questions are burdensome overlapped because it is not possible to disentangle the effect of surveys from their questions.
Codes for Perceptions of “Burden.”
3.1.1. Reasons for Everyday Activities to Be Burdensome
There was considerable overlap in what activities participants offered as examples of “extremely” and “somewhat” burdensome everyday activities. For example, “shopping” was named by many participants. However, the activity was considered “extremely” burdensome by some and only “somewhat” burdensome by others. These varying perspectives of the same activity are perhaps intrinsic to burden’s subjective nature and highlight the subjectivity in respondent conceptualizations of burden.
Table 3 below summarizes the frequencies at which each reason for why activities were burdensome appeared in the data. Approximately 25.1% and 14.8% of participant responses were coded as representing multiple reasons for being extremely burdensome and somewhat burdensome, respectively, resulting in an analytic sample of codes larger than the number of participants. The higher rate of multiple reasons given for extremely burdensome activities (X2(1) = 10.3, p < .01) may indicate that burden is cumulative; that is, the presence of additional burden factors can increase perceived burden.
Counts and Proportions of Participants Reporting Reasons for Activities to Be “Extremely Burdensome” and “Somewhat Burdensome.”
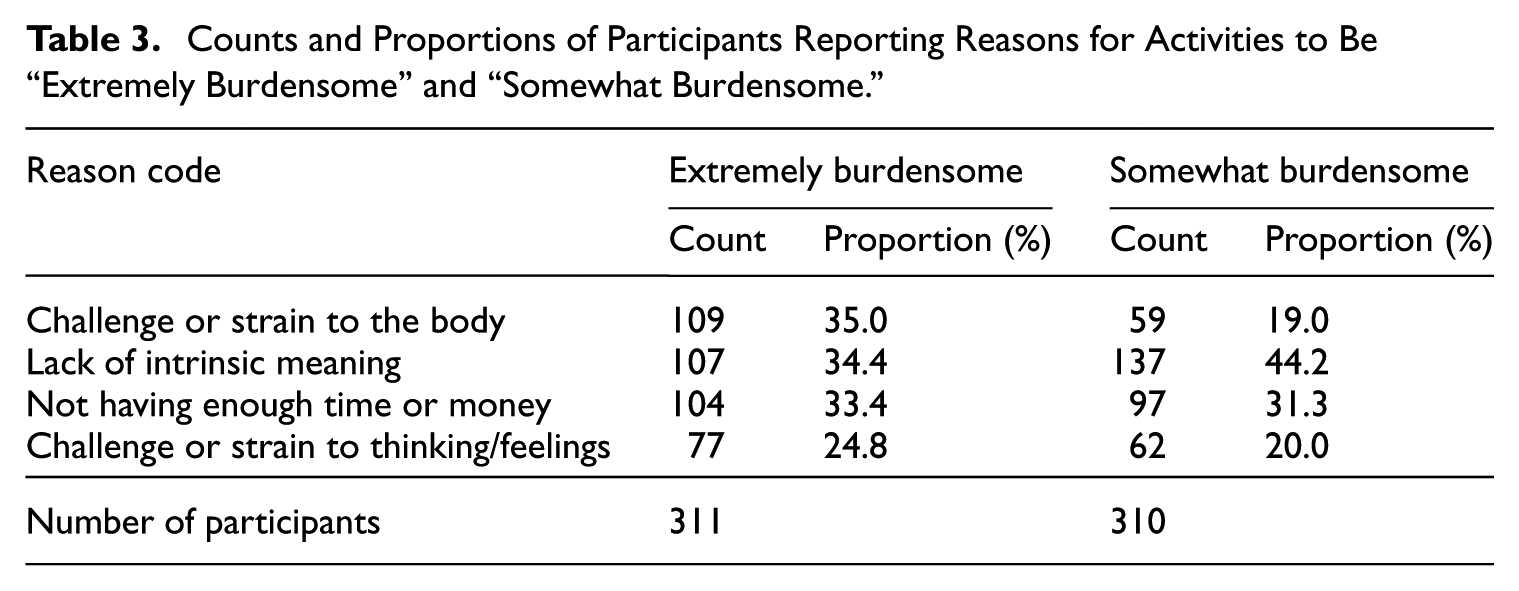
Extremely and somewhat burdensome activities also differed in this analysis by the prevalence of the reason factors. For extremely burdensome activities, the top three reasons were given at similar rates: challenge or strain to the body (35.0% of participants), lack of intrinsic meaning (34.4%), and not having enough time or money (33.4%). In contrast, for activities that are only somewhat burdensome, the most common reason category given by a large margin was the lack of intrinsic meaning category (44.2%). Isolating only the primary cause for activities to be considered burdensome yields similar results. For activities considered extremely burdensome, not having enough time or money (28.3%) and challenge or strain to the body (27.7%) were the most frequently reported causes. For activities considered somewhat burdensome, lack of intrinsic meaning was the most frequently reported primary cause (41.9%).
Participant responses also show that challenge or strain to thinking or feelings is less likely to be a cause of everyday burden. For both extremely and somewhat burdensome activities, challenges or strains to thinking or feelings were among the least frequently cited (24.8% and 20.0%, respectively).
3.1.2. Reasons for Surveys and Survey Questions to Be Burdensome
Again, participants often reported multiple reasons for survey and survey question burden: 55.2% of participants gave multiple reasons for how surveys can be burdensome and 25.2% of participants gave multiple reasons for how survey questions can be burdensome. Overall, the high rate of citing multiple reasons for burden related to surveys supports the idea that respondent burden has multiple dimensions and suggests that respondents perceive and can articulate its different dimensions.
The responses about survey and question burden are summarized in Table 4. The most frequently reported reasons for a survey to be burdensome is length (41.0% of participants) and a judgment of benefit gained by taking the survey (41.0%). The most frequently reported reasons for a question to be burdensome are content (29.3%) and effort (28.2%). Isolating only the primary causes for burden, length was the most frequently reported cause of survey burden (33.5%) and content and effort the most frequently primary causes for question burden (30.0% and 29.1%, respectively).
Counts and Proportions of Participants Reporting Reasons Why Surveys and Survey Questions Are Burdensome.
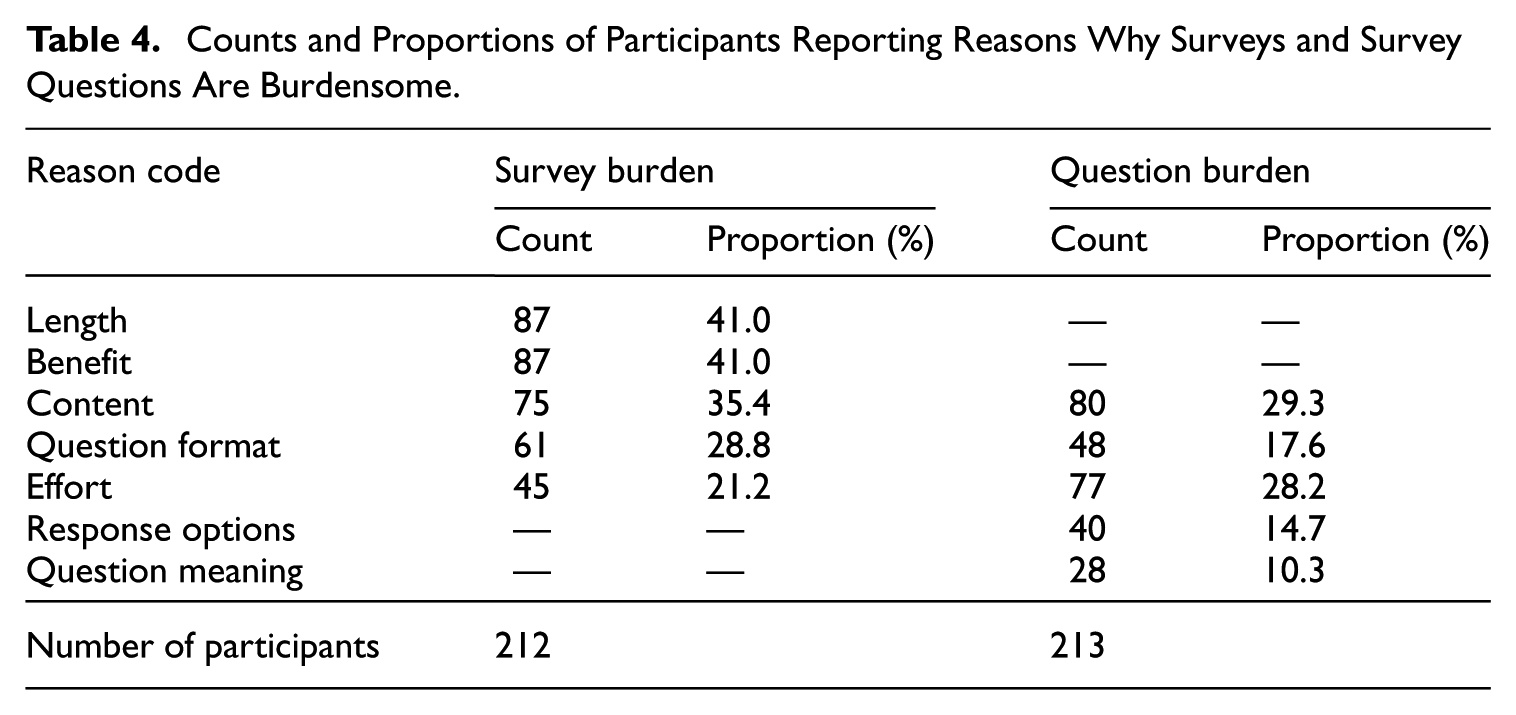
Although there may be overlap between the constructs underlying the codes used (e.g., longer surveys may take more effort), the codes and coding rules were developed to highlight the unique concerns raised by the participants. For example, the effort code was applied only when the response did not reference the benefits, length or content of the survey, or the format of the questions.
Notably, effort was infrequently mentioned in reasons for survey burden but frequently mentioned for reasons for question burden. This difference may suggest that respondents judge survey burden by the amount of overall effort spent (as determined by the respondent), whereas question burden is judged by the amount of effort the question is designed to require. The three code categories related to questionnaire design (question format, question meaning, and response options) were infrequently cited as reasons for burden.
As a follow-up to the open-ended question collecting input on what makes surveys burdensome, participants were also asked a question from which they could select-all-that-apply from a list of fourteen characteristics. Although there is substantial overlap between this list and the code categories that emerged from the inductive coding of participants’ open-ended responses, this list was created before data collection and does not directly map to these characteristics nor use the same language that participants used. These findings are summarized in Table 5.
Selections in Response to “Which of the Following Would Make a Survey Feel Burdensome to You?” (n = 386).
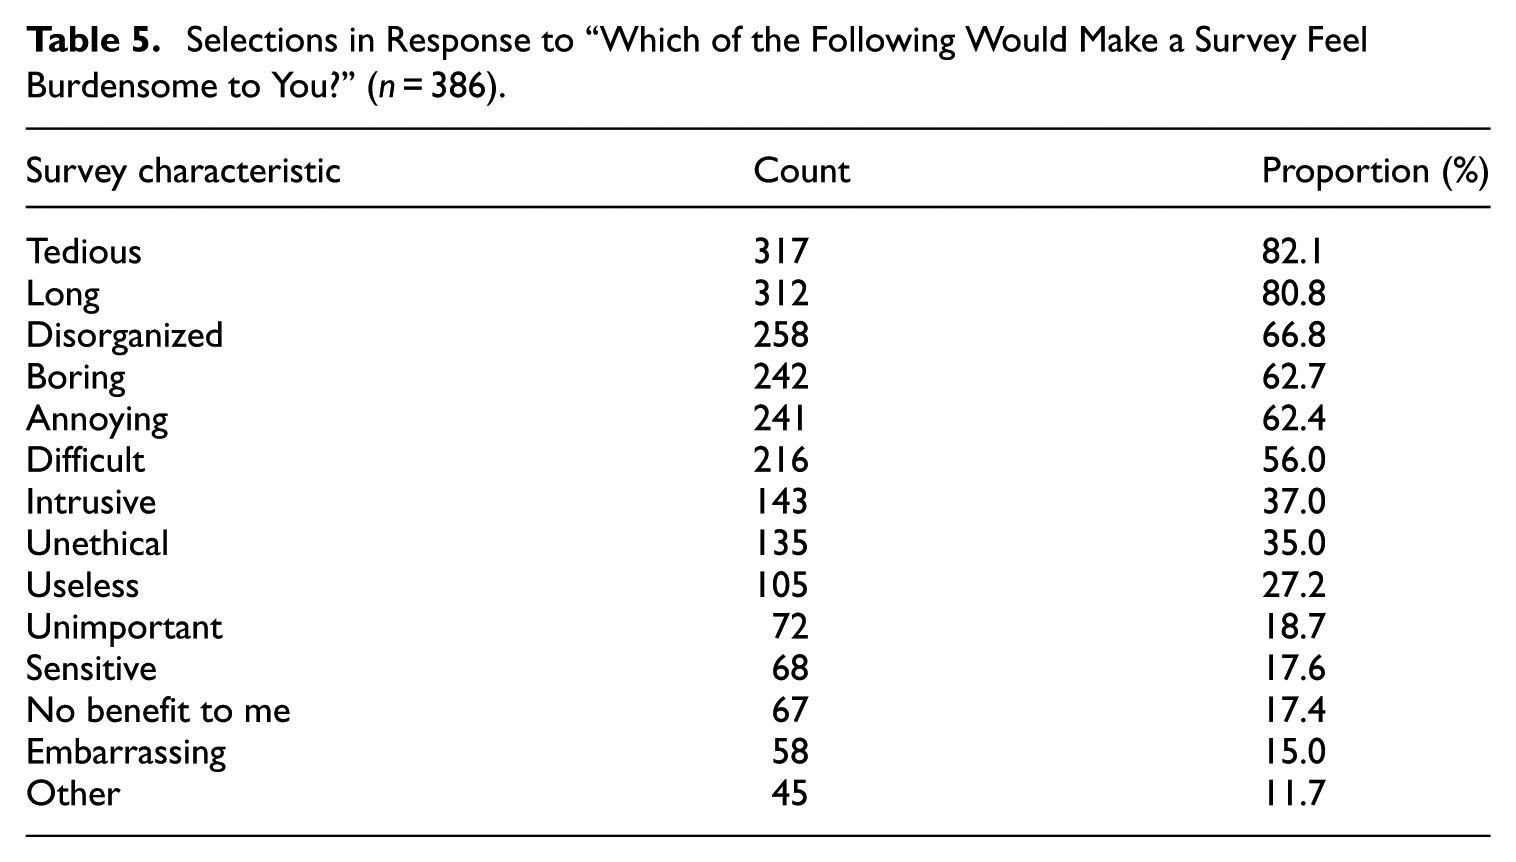
The most frequently endorsed characteristic was “tedious” (selected by 82.1% of participants) closely followed by “long” (80.8%). That such a large proportion of participants selected “long” supports the generally accepted notion of survey burden being related to survey length. The high endorsement rate of “tedious” introduces new possible research directions. Most dictionary definitions for “tedious” contain references to length in combination with the subjective feature of being “boring” (e.g., Merriam-Webster.com Dictionary). However, while “tedious” and “long” were endorsed by more than 80% of the sample, their close relation from the lack of intrinsic meaning domain “boring” was endorsed by only 62.7%. This pattern suggests a perceived distinction between “tedious” and “boring” as they relate to surveys, perhaps implying an emphasis on the detailed and repetitive nature of responding to surveys.
Lower endorsement rates may also be informative: “difficult” was endorsed by only about half of participants. Indeed, characteristics falling in our lack of intrinsic meaning domain of characteristics that are not a strain or challenge to the participant were cited more frequently (“disorganized,” “annoying”) than was “difficult.” This may suggest that difficulty in and of itself is not burdensome, but rather surveys that appear to have no purpose or benefit are burdensome.
3.2. Research Question 2: The Effects of Perceived Survey Length
We designed a 2 × 3 between-groups experimental design that controlled actual survey length (short, long) and the context in which survey length was perceived (screened into a longer survey, screened out into a shorter survey, no screening). With this design, we separate the effects of actual and perceived survey length on overall ratings of burden.
3.2.1. Survey Duration
Although actual survey length varied between groups, we also measured the individual time spent (survey duration) as a direct measure of the respondent experience. The mean survey duration across all participants was 187.64 seconds (SD = 142.02), or just over three minutes long. As expected, an analysis of variance showed that the participants responding to the short survey with fewer questions spent less time while the participants responding to the long survey with more questions spent more time (F(1, 482) = 69.77, p < .001). This confirms that the experimental design imposed more and less actual burden on participants, as intended. The analysis of variance also showed a main effect of the screener framing (F(2, 482) = 4.37, p = .013); Bonferroni post-hoc comparison found a significant difference in survey duration whereby participants who were told they were screened into a longer survey had shorter durations compared to participants who received no screening text (difference mean = 40.14, p = .023). No other follow-up comparisons were significant; while participants who were told they were screened out to a shorter survey appeared faster to respond compared to participants who received no screening text, their mean survey duration was not significantly different from either of the other groups. The interaction between actual survey length and screener framing was not significant (F(2, 482) = 0.25, ns). Mean duration of each experimental group is shown in Table 6.
Mean Survey Duration in Seconds by Actual Survey Length and Screener Framing (n = 488).
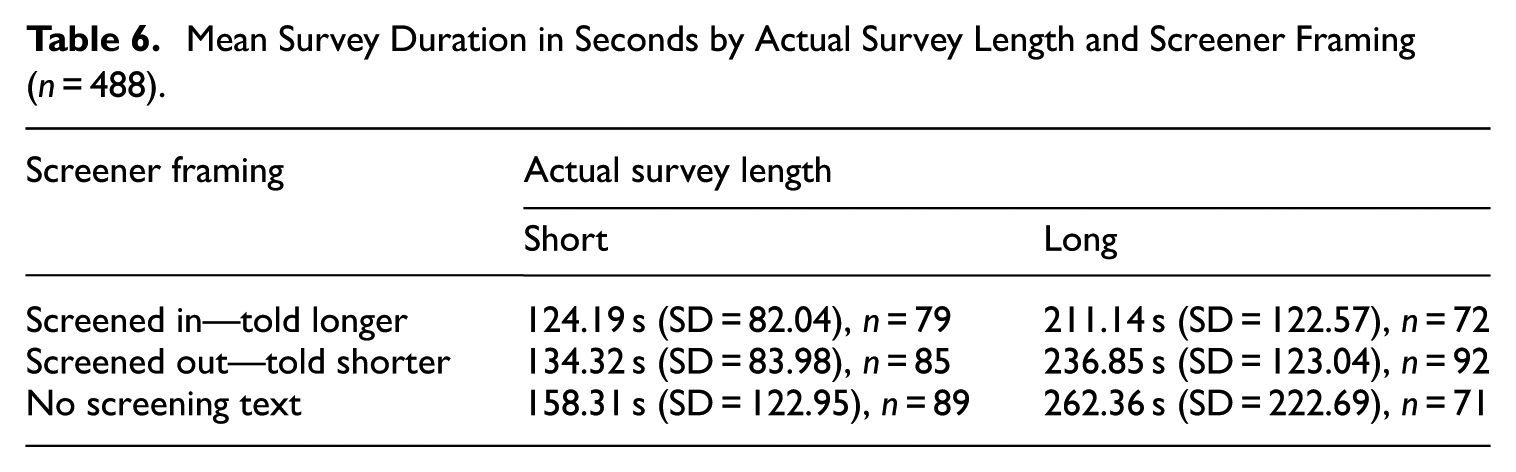
This pattern of results suggests that the screening text, which was displayed early in the survey, changed the way the participants responded to the survey. Participants who were told they were being asked more questions than others reacted to this information by speeding up their response.
3.2.2. Ratings of Perceived Survey Length
We next report analyses of the effects of the screener framing on perceived survey length to assess the effectiveness of the experimental context framing. Participants rated perceived survey length during the debriefing immediately after the survey. The question asked participants to rate how short or long they felt the survey was, on a 7-point fully-labeled scale ranging from “Very short” (1) to “Very long” (7). These responses are summarized in Figure 1. Overall, participants rated the length at 2.12, or between “Short” and “Somewhat short” on the response scale.
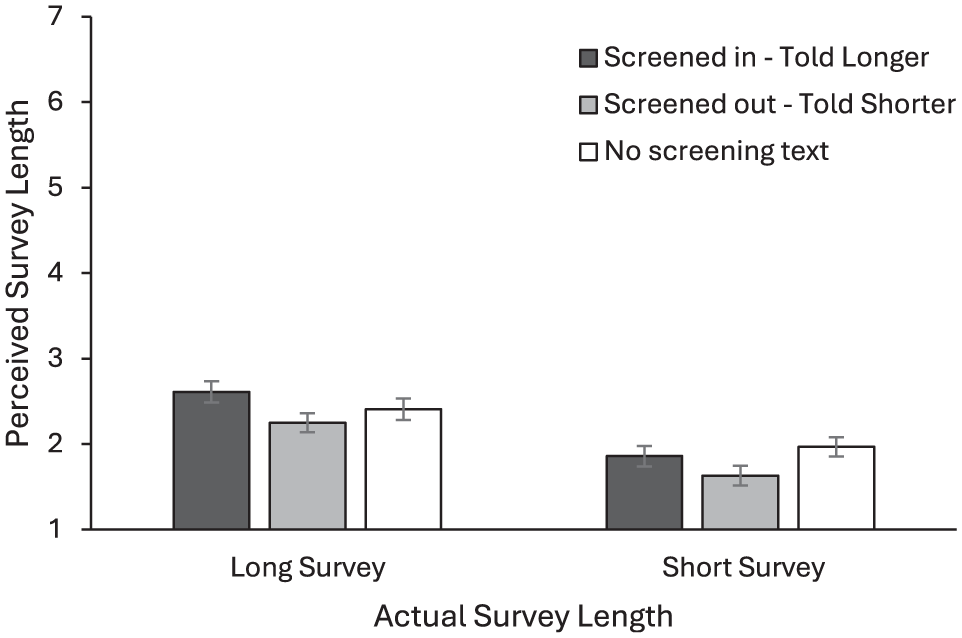
Ratings of perceived survey length (n = 488).
An analysis of variance found a significant main effect of actual survey length on ratings of perceived survey length, such that participants who were asked relatively more questions judged the survey to be longer than those in the objectively shorter survey condition (F(1, 480) = 39.26, p < .001). Although this is an expected finding, this result does indicate that the scale could distinguish between long and short surveys, even though both surveys were relatively short.
There also was a main effect of screener framing on the ratings of perceived survey length (F(2, 480) = 3.72, p = .025), showing that the participants who were told they would experience a longer survey rated the survey as longer than participants who were told they would experience a shorter survey, regardless of the actual survey length experienced (screened in: mean = 2.24; screened out: mean = 1.94; Bonferroni post-hoc comparison: p = .073). The interaction between actual survey length and screener framing was not significant (F(2, 480) = 1.10, ns). An analysis including each individual’s survey duration as a covariate finds that survey duration was not related to ratings of perceived length (F(1, 479) = 1.99, ns). This result indicates that perceptions of survey length were unrelated to the amount of time each participant spent on the survey. The different framing contexts translated to participants’ perceptions about the length of the survey, regardless of the actual time spent on the survey.
3.2.3. Ratings of Other Burden Factors
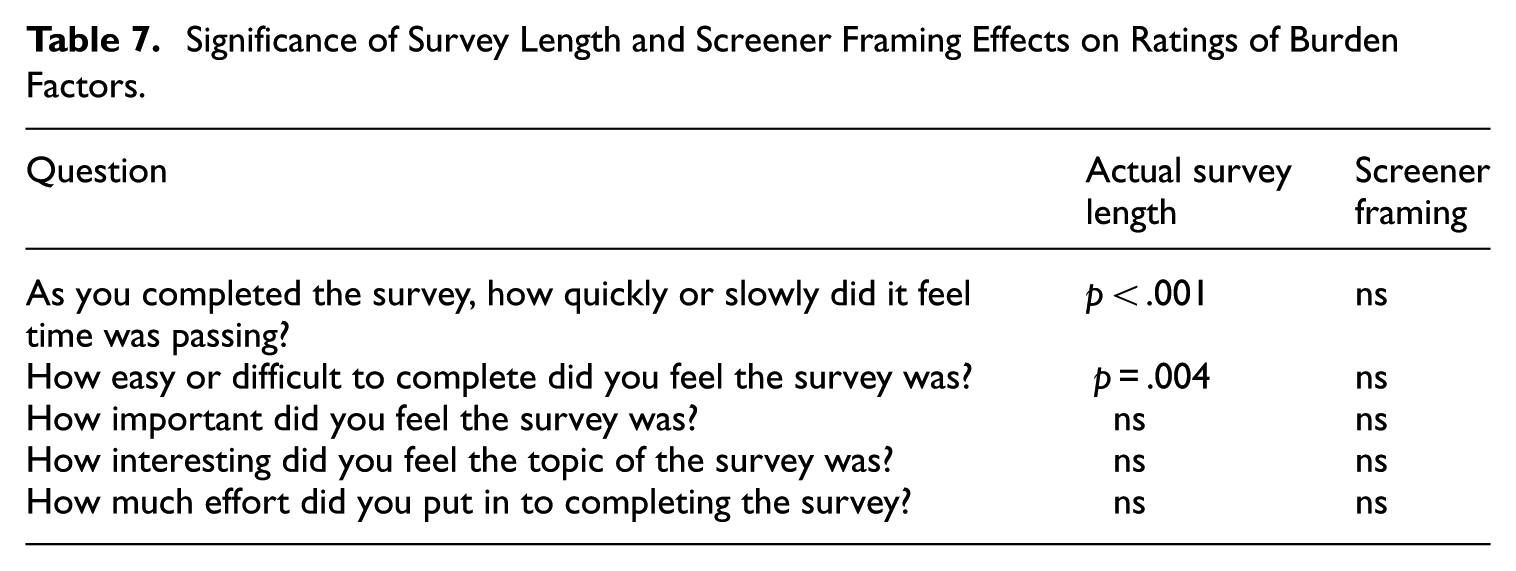
In addition to perceived survey length, participants were asked to rate several other factors believed to be related to burden. Although they are not directly related to this experimental design on length and perceptions of length, we report the results for completeness in Table 7. The analysis of variance found that screener framing did not affect the unrelated burden factors but that the actual survey length was associated with the feeling of time passing (F(1, 480) = 13.40, p < .001) and the difficulty of the survey (F(1, 480) = 8.33, p = 0.004). Participant ratings on effort suggest that the screener framing did not affect effort, despite survey duration analyses reflecting a significant effect on time spent. Participants may not have been aware of this change in their behavior of how quickly they responded to the survey questions.
Significance of Survey Length and Screener Framing Effects on Ratings of Burden Factors.
3.2.4. Ratings of Overall Burden
Participants were asked in a single question to rate how burdensome it felt to participate in the survey, on a 5-point fully-labeled scale ranging from “Extremely Burdensome” to “Not at all Burdensome.” The responses to this question were reverse-coded so that low burden ratings correspond to low levels of burden. The results are summarized in Figures 2 and 3. Overall, the mean burden rating was 1.68, falling between “Not at all burdensome” and “Slightly burdensome.”
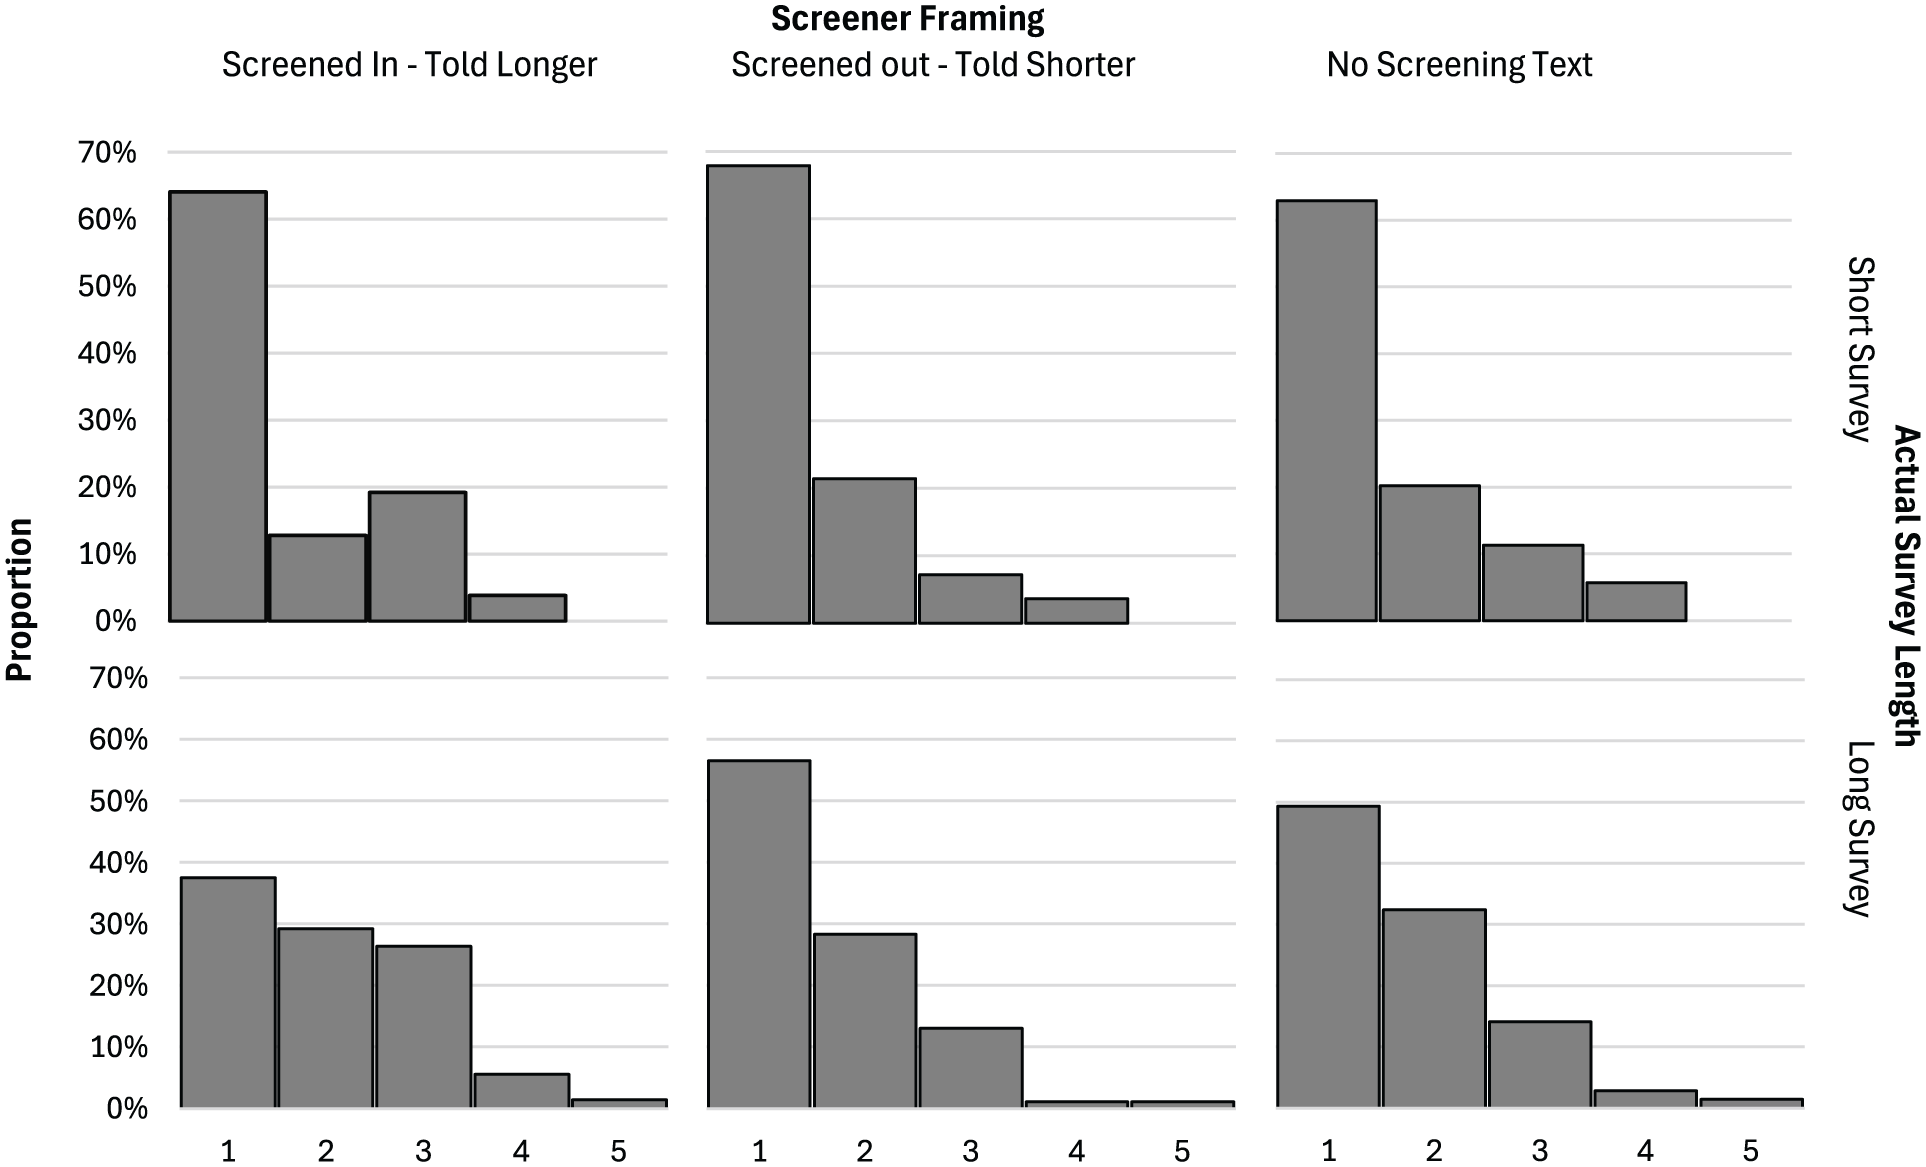
Distributions of ratings of overall burden from participating in the survey (n = 488).
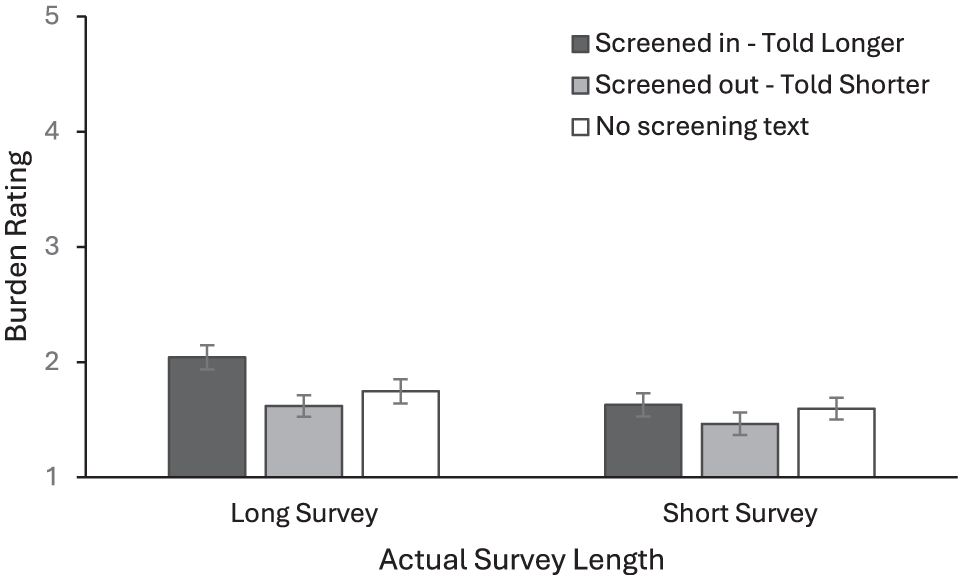
Ratings of overall burden from participating in the survey (n = 488).
The response distributions in Figure 2 show that the screened-out framing was associated with more ratings of “Not at all burdensome” (1) compared to the other treatment conditions, similar to the frequencies among those participants who responded to the objectively short survey.
As expected, an analysis of variance found a main effect of actual survey length whereby participants who experienced the objectively longer survey rated the survey as more burdensome (F(1, 480) = 8.73, p = .003). Although this effect was expected, the result is evidence that the perceived burden rating scale captured differences between the two survey lengths. There also was a main effect of the screener context whereby participants who were told they were screened into a longer survey rated the survey as more burdensome than participants who were told they were screened out, regardless of the actual survey length they experienced (F(2, 480) = 4.38, p = .013; Bonferroni post-hoc comparison: p = .014). Participants in the control condition who did not receive any special instructions fell in the middle and were not significantly different from either screener group. This main effect demonstrates that, regardless of the actual length of the survey experienced, the screening context pushed ratings of burden up or down as hypothesized. The interaction between actual survey length and screening frame instructions was not significant (F(2, 480) = 1.10, ns). This pattern being distinct from the analyses of participant ratings of difficulty, whereby participants who responded to a longer survey thought the survey was more difficult but participants who received screened-in framing did not think their survey was more difficult, indicates that burden captures more than just difficulty.
An analysis including individual survey duration as a covariate finds that survey duration had no effect on burden ratings (F(1, 469) = 0.009, ns) while the effects of framing and actual survey length remain unchanged. In other words, participant ratings of burden were related to the number of questions asked and the screening text about longer or shorter surveys, but not related to the time spent on the survey.
3.2.5. Measures of Data Quality
The screener outcome text was presented to participants after answering the first six questions. We evaluated the number of participants who broke off from the survey immediately after the announcement of a longer or shorter than expected survey. A total of fifty-six participants quit the survey and, of those participants, thirty-five broke-off immediately after the screener outcome text was presented. These break-offs are summarized in Table 8.
Break-Offs from the Survey Immediately After Screener Outcome Announcement (n = 544).
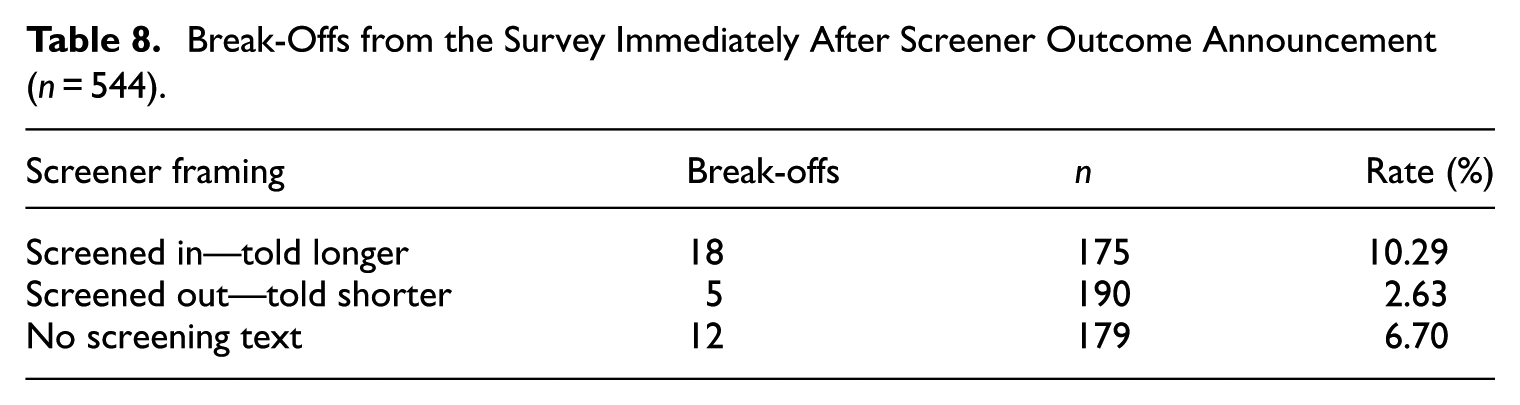
A chi-square test of independence found a significant difference in break-offs due to screener outcome (X2(2, n = 544) = 8.90, p = .012). In follow-up tests, only the participants who were told they were screened into the longer survey and participants who were told they were screened out into the shorter survey broke-off at significantly different rates (X2(1, n = 365) = 9.04, p = .003; other comparisons were non-significant). Immediately after seeing the screener outcome, 10.29% of participants who were told to expect a longer survey quit, and quit at a rate significantly higher than those told to expect a shorter survey. This finding mirrors the results of the context framing’s effect on perceived burden. Within the domain of online non-probability panels, this finding is especially meaningful because these participants forgo all payment despite already having invested time and effort into the survey.
A chi-square test of independence found no significant difference due to survey length, as expected, given that the participants had not yet experienced any differences in survey length (X2(1, n = 544) = 0.46, ns).
Analyses of straight-lining and speeding did not find any significant differences between conditions.
4. Discussion
The findings from these two research questions highlight the importance of looking beyond objective measures to understand the respondent survey-taking experience.
Although surveys use the “burden” term in questions, researchers had not yet confirmed that respondents and survey designers understand the term in the same way. For Research Question 1, we asked research participants to describe in their own words what “burden” means to them. Several consistent themes emerged from participant write-ins, including that the most frequently reported causes of burden in everyday activities were physical challenges, lack of intrinsic meaning, not having enough time or money, and thinking/feeling challenges. In the domain of surveys, the most frequently reported causes of burden were feeling that participation was not worth it, the effort required to complete the survey, the topic of the survey, question format, survey length, difficulty understanding what the question is asking, and difficulty selecting response options. Participants frequently expressed more than one cause for burden, indicating that burden is a multi-dimensional concept. The responses we collected in this study demonstrate that, while the construct seems to be understood in a consistent way across the sample, the measurement of the construct is subjective. Participants repeatedly attributed different degrees of burden to describe the same activity. And this research confirmed that length, which has been used by many survey practitioners and researchers as a proxy for burden, was regarded across nearly all participants as a characteristic of survey burden. In contrast, survey design, such as question format or clarity of response options, was not as frequently mentioned as a reason for survey or question burden. Similarly, difficulty was identified as a factor contributing to burden by fewer than half of participants. However, burden was closely tied with a different characteristic that is yet to be explored: tedium and the importance of finding meaning in responding to the survey.
For Research Question 2, this research investigated the effect of context framing on ratings of respondent burden, to disassociate participants’ perceptions of survey length from actual survey length. We found that both actual and perceived length had their own effects on overall burden. Measures of actual time spent on the survey were unrelated to ratings of burden, further supporting the hypothesis that perceptions are not grounded by objective measures. We also showed that context framing translated to differences in perceptions of survey length, whereby participants who had been told they were screened into a longer survey reported feeling that the survey was longer, compared to participants who were told they had been screened out into a shorter survey. This research also provided evidence that poor framing may cause respondents to spend less time on survey questions and to break-off from surveys at higher rates.
We believe that these findings can improve how survey designers approach respondent burden. The areas that emerged in this research as contributing to feelings of burden are the benefits of survey participation (also discussed in Hedlin et al. 2008), the length of the survey, and redundant or repetitive questions. While this research showed that perceptions can be disentangled from actual reality for only one of these factors, future research could explore ways of affecting perceptions of the other dimensions of burden. Can framing affect perceptions of the benefits of survey participation or the redundancy and repetitiveness of questions? And are there other ways that survey designers can affect perceptions of survey length? Tedium, which is typically defined as combining the characteristic of length with a judgment of the value of that length, may warrant further research to improve how we assess and reduce the burden government surveys impose on the public. Furthermore, what it means for survey participation to be burdensome may change with the presence of an interviewer. An interviewer may moderate the repetitiveness of questions or explain the benefits of participation, rendering these concerns minimal. However, interviewers may introduce new sources of burden, such as through the dimension of the general burden associated with interacting with people. Research in interviewer-administered modes could explore this further.
Targeting perceptions of survey length specifically, survey designers may be able to use framing to make longer surveys feel less burdensome to respondents. This context-dependence presents a unique opportunity for survey designers in which a survey can be perceived to have lower burden without any reduction of survey length. Survey designers can deploy levers for perceived burden as a tool separate from those of objective burden. Messages within the survey can highlight when the respondent is not asked questions that are asked of others may reduce perceived burden. Most surveys have opportunities for this messaging based on filter questions or survey branching. For example, when a respondent reports not doing any work for pay and therefore skips the questions on work arrangements, a notification could provide encouraging feedback: “Based on your answers, we have skipped a section of the survey that’s not relevant to you.” Although such a message does not change the actual length of the survey, it does change the survey context. By recognizing this pathway from context to burden, we renew the emphasis on survey designers to consider the entire survey experience as potentially affecting the survey context and therefore a respondent’s perceived burden.
There are several limitations to this research. Our participants initiated their survey participation themselves from an online non-probability panel where they take short, self-administered surveys–a contrast to many government surveys that are initiated by receiving an invitation. Participants received monetary compensation for their participation. Indeed, compensation did emerge as a common burden-related concern among participants. This population of online non-probability panel survey takers may be particularly sensitive to time and money given that they are paid to complete short tasks. Inasmuch as these differences drive a respondent’s perception of burden, these conclusions may not generalize. Survey framing and perceptions of burden may behave differently in other contexts. However, given that the objective of this research is to understand perceptions of burden related to taking surveys, we believe that participants who have responded to multiple surveys have relevant experience with the subject matter. To confirm that this characteristic of our sample did not affect these findings, future research should repeat this general experimental design using research participants recruited using probability sampling. This research also used relatively short surveys rated as having low levels of burden. Though the scales we used were sensitive enough to detect significant differences due to the experimental design it is not known whether these results will generalize to longer surveys. Despite these limitations, this study provides evidence that framing can be effective at reducing respondent burden. We recommend that future research test whether this approach holds in other survey contexts with other dimensions of burden, particularly long surveys.
Supplemental Material
sj-docx-1-jof-10.1177_0282423X261451321 – Supplemental material for Beyond Survey Length: Understanding Respondent Perceptions of Burden
Supplemental material, sj-docx-1-jof-10.1177_0282423X261451321 for Beyond Survey Length: Understanding Respondent Perceptions of Burden by Erica C. Yu, Brandon Kopp and Victoria R. Narine in Journal of Official Statistics
Footnotes
Acknowledgements
The authors acknowledge Scott Fricker, Wendy Martinez, Morgan Earp, and Brian Harris-Kojetin for their valuable contributions to this research.
Funding
The authors received no financial support for the research, authorship, and/or publication of this article.
Supplemental Material
Supplemental material for this article is available online.
Received: September 30, 2025
Accepted: March 31, 2026
References
Supplementary Material
Please find the following supplemental material available below.
For Open Access articles published under a Creative Commons License, all supplemental material carries the same license as the article it is associated with.
For non-Open Access articles published, all supplemental material carries a non-exclusive license, and permission requests for re-use of supplemental material or any part of supplemental material shall be sent directly to the copyright owner as specified in the copyright notice associated with the article.