






Abstract
The integrity and accuracy of financial data are prerequisites for market efficiency; however, data anomalies and quality issues severely compromise their “fitness for use” in sophisticated decision-making processes, such as value investing strategies. This article reviews the application of advanced artificial intelligence (AI) methods to enhance quality assurance, anomaly detection, and imputation within high-dimensional financial data streams. The paper critically evaluates both statistical-machine learning hybrids (e.g., ARIMA-LSTM) and deep learning combinations (e.g., autoencoder-based GANs), alongside Explainable Artificial Intelligence (XAI) techniques, assessing their utility against the strict auditability requirements of public trust institutions. The synthesized literature suggests that hybrid frameworks can potentially outperform monolithic approaches in detecting nonlinear manipulations and creating “high-fidelity” datasets. Furthermore, the study addresses the “black box” opacity challenge—a major barrier for regulatory and statistical agencies—discussing how methods like SHAP and LIME support, rather than independently ensure, the necessary interpretability of algorithmic decisions. Conclusions indicate that the synergy between the predictive power of advanced AI models and the transparency supported by XAI is a highly valuable component for modern market supervision, enabling effective data validation while supporting institutional accountability.
1. Introduction
Data integrity and accuracy are fundamental to the functioning and stability of modern financial markets. According to fundamental theories such as the efficient market hypothesis (Fama 1970), it is the free and reliable flow of information that enables effective price discovery and the exploitation of arbitrage opportunities, which in turn leads to rational capital allocation. Investors, analysts, and financial institutions base their decisions—from capital allocation to risk management—on publicly available information, assuming its reliability and completeness (Ważna 2019).
In the United States, the Securities and Exchange Commission (SEC) plays a key role in maintaining this trust as the primary regulatory authority (Laskin 2015). The SEC regulates the flow of information from companies to investors by enforcing reporting and transparency standards. In response to suspicions of inaccurate, unreliable, or deliberately misleading information, the Commission takes decisive action, including the publication of warning bulletins and, in extreme cases, the suspension of trading in a company’s shares (Tallboys et al. 2022). These measures are designed to protect investors and ensure the fair functioning of the market.
Consequently, any erosion of data credibility poses a direct threat to market efficiency, introduces systemic risk, and leads to serious economic consequences. The research problem addressed in this article focuses on the destructive impact that erroneous or deliberately manipulated financial data has on market behavior and investor confidence. Incidents involving misinformation not only lead to misguided investment decisions and unjustified price volatility, but also undermine the fundamental principles of transparency on which the entire financial system is based (Podolski 2019). A concrete example illustrating the scale of the problem is the case of Turbo Global Partners, Inc. (TRBO). On March 30 and April 3, 2020, the company published two press releases containing misleading information related to the COVID-19 pandemic. These announcements had a significant impact on the market—the trading volume of TRBO shares doubled and the share price rose sharply by about 15%. In response to these events and in order to protect investors, the SEC decided to suspend trading in the company’s shares on April 9, 2020 (Tallboys et al. 2022).
The main thesis of the article is that such events expose the inadequacy of traditional, human-based control mechanisms and, in the era of high-frequency trading, necessitate the development of automated and interpretable AI systems capable of maintaining market integrity. In response to this demand, AI-based methods are increasingly being used, but they bring their own unique challenges. In recent years, there has been a growing use of advanced deep learning models in the analysis of financial time series (Buczyński et al. 2023). These architectures are highly effective in identifying complex, nonlinear patterns that often elude traditional statistical methods. However, their increasing complexity leads to a problem known as the “black box,” where the internal logic of the model remains opaque to the user (Guidotti et al. 2018). Today, modern architectures are utilized to detect anomalies in multidimensional time series (MTS) (Sun et al. 2025; Tallboys et al. 2022; Zhang et al. 2023). These analytical tools encompass both statistical-machine learning hybrids, such as combinations of Autoregressive Integrated Moving Average (ARIMA) and Long Short-Term Memory (LSTM) networks, as well as structurally complex deep learning combinations, such as Autoencoders integrated with Generative Adversarial Networks.
It is precisely the opacity of these highly effective models that constitutes a key research gap. In a financial context, anomaly detection alone is insufficient; understanding its causes is critical for regulatory compliance, auditability, risk management, and overall model robustness. While Explainable Artificial Intelligence (XAI) methods provide essential technical transparency by offering local or global explanations of model outputs, they are not a substitute for institutional oversight; rather, they serve as a supportive component within broader governance and accountability frameworks.
The main objective of this article is to review and analyze the application of artificial intelligence methods in the process of quality assurance and anomaly detection in financial data streams. Particular attention will be paid to differentiating various modeling frameworks and evaluating techniques that increase their interpretability. Furthermore, the article explores how methods originating in high-frequency financial market analytics might conceptually inform processes in official statistical production. While National Statistical Offices (NSOs) operate under different institutional mandates and data regimes than regulatory bodies like the SEC, exploring the deployment of these AI frameworks at earlier stages of the official data lifecycle—such as anomaly detection and data validation in administrative data flows—offers a promising, albeit cautious, research avenue.
The structure of the article is as follows. The article begins with an introduction to the issue of data integrity, emphasizing the importance of this issue, and defines the research gap and the purpose of the publication. The second part of the paper analyzes the fundamental role of data quality in value investing strategies, defining the risk of the “value trap” and the imperative of using high-fidelity analytics. The third section presents an overview of advanced methods combining statistical models with machine learning algorithms (e.g., ARIMA-LSTM) and deep learning combinations (e.g., AE-GAN) that are used in anomaly detection and missing financial data imputation. The fourth part of the article addresses the issue of AI model transparency, discussing the role of XAI—including Local Interpretable Model-agnostic Explanations (LIME) and SHapley Additive exPlanations (SHAP) methods—as a supportive tool in the process of auditing and building trust in decision-making systems. The fifth part is a discussion that synthesizes the impact of the discussed technologies on investment risk reduction mechanisms, carefully delineating the roles of respective market and public actors. The article concludes with a summary indicating research limitations and directions for future work.
2. The Impact of Data Quality on Value Investing Strategies
Understanding the fundamental principles of value investing is key to appreciating the role that data quality plays in this strategy. Popularized by the outstanding results of investors such as Warren Buffett, this philosophy is not a form of speculation, but a disciplined analytical process whose effectiveness depends on the accuracy of the input information. Its strategic importance lies in the systematic exploitation of market inefficiencies to generate above-average returns (Petrova 2015).
First formulated by Graham and Dodd, the value investing strategy is based on a simple but powerful concept. Its goal is to identify and purchase stocks whose market price, as a result of temporary market inefficiencies, has fallen significantly below their intrinsic value (Graham and Dodd 1934). This approach assumes that markets do not always operate efficiently, which creates opportunities for intelligent investors to purchase solid assets at a discount. The popularity of this strategy has grown rapidly thanks to its consistent and effective application by entities such as Berkshire Hathaway Inc., which have proven its long-term profitability (Schroeder 2008).
In academic research, this concept is often operationalized through the analysis of financial ratios, and stocks with a high book-to-market (B/M) ratio are commonly categorized as value stocks. Identifying promising value stocks is an analytical process that relies entirely on in-depth interpretation of financial data (Cakici and Topyan 2014). The critical dependence of value investing strategies on the reliability and completeness of corporate financial disclosures cannot be overestimated. To maintain conceptual clarity, it is essential to distinguish between these firm-level disclosures—which are produced by market participants and overseen by regulatory bodies—and official statistics, which are compiled and disseminated by National Statistical Offices (NSOs) under different institutional mandates. The indicators used by investors to assess a company’s value, such as the aforementioned B/M, are direct derivatives of corporate accounting data. It is the quality of this specific market data that forms the cornerstone of the entire decision-making process, determining the accuracy of the selection and the ultimate investment success (Almas 2007).
The mechanism by which value investors assess the financial prospects of companies involves an in-depth analysis of a variety of accounting signals and historical data. This process is not limited to a simple comparison of indicators, but requires an understanding of the subtle relationships and trends hidden in corporate financial statements. Analytical models use a number of variables that aim to capture the fundamental condition of a company. Key variables include: CFO (cash flow from operating activities), change in leverage (Δ Leverage), change in margin (Δ Margin), and change in asset turnover (Δ Turn-Over) (Ashta 2008; Haskins 2017; Nguyen 2021). Table 1 presents the characteristics of key accounting signals used in valuation models.
Summary of Key Accounting Signals Used in Valuation Models.
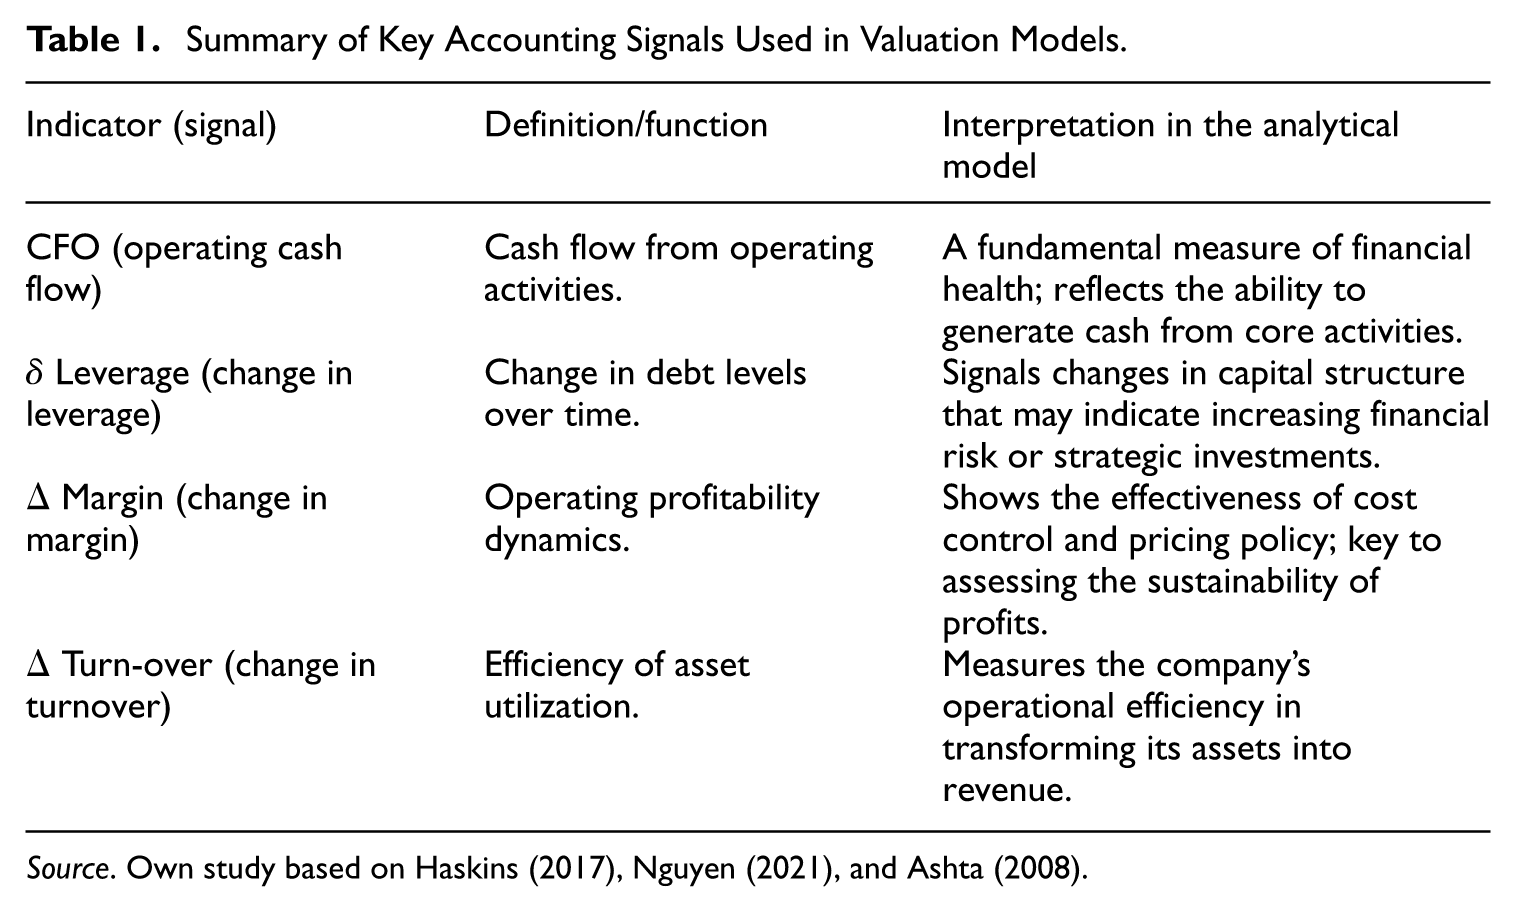
Source. Own study based on Haskins (2017), Nguyen (2021), and Ashta (2008).
The primary objective of analyzing these indicators is to capture changes in future profits, which are considered one of the key factors in stock valuation (Lev and Thiagarajan 1993; Ou and Penman 1989). However, since investment decisions are so heavily based on data, any inaccuracies, incompleteness, or misinterpretations carry a fundamental risk known as a value trap. This phenomenon involves misidentifying stocks as undervalued, when in fact their low market price is fully justified by the company’s persistently deteriorating financial prospects or structural problems. Investors, tempted by the apparent opportunity, purchase assets whose value, instead of rising, continues to fall, leading to significant losses (Penman and Reggiani 2018). Rather than a failure of official macroeconomic statistics, a value trap fundamentally represents a breakdown in the corporate reporting ecosystem and the market supervisory mechanisms designed to ensure disclosure integrity.
The complexity and volatility of the stock market mean that distinguishing genuine opportunities from value traps requires not only in-depth financial knowledge, but also many years of experience. This risk is directly related to the quality of the available corporate data and the adequacy of the analytical models used to interpret it. Conventional models, such as regression, are often unable to effectively handle imprecise relationships and complex interactions between individual financial variables (Maturo 2016; Zhang 2025). Advanced analytical models aim to precisely discriminate between general stocks with high B/M and those that actually have good financial prospects, which is a fundamental analytical defense against falling into the value trap (Loistl and Konstantinov 2020). The main cause of this phenomenon is basing investment decisions on erroneous, incompletely interpreted, or subsequently revised historical data. Inference based on an incomplete picture leads to a false sense of security and a misjudgment of intrinsic value. Avoiding value traps therefore requires not only access to data, but also advanced methods of processing it that can model uncertainty and complex relationships. This leads directly to a growing demand for high-fidelity analytics.
In response to the limitations of traditional analytical methods and the ubiquitous risk of value traps, modern quantitative investors are increasingly turning to advanced analytics solutions. Success in today’s market conditions requires not only accurate input data, but also high-fidelity analysis (Siemieniuk et al. 2018). This refers to the ability of decision-making systems to model complex, nonlinear, and imprecise relationships in financial data that elude simpler statistical models.
One of the most promising directions is the integration of artificial intelligence (AI) techniques with traditional accounting models. Integrated systems, such as hybrid fuzzy-Artificial Neural Network (Fuzzy-ANN) models, are designed to learn complex if-then rules directly from historical data (Iglesias et al. 1996). This allows for much more nuanced support for the stock selection process, as exemplified by the rule: if CFO is high, ΔLeverage is low, ΔMargin is high, and ΔTurn-Over is medium, then the subsequent rate of return (HPR) is relatively high. A key advantage of these approaches is their inherent ability to deal with uncertainty and imprecise relationships between financial variables, which is a fundamental limitation of conventional methods.
The potential of this approach has been illustrated in an empirical study conducted on the Taiwanese stock market. The Hi-Value portfolio, constructed by Shen (2013) from twenty-two high-value stocks identified by an AI model, achieved results that outperformed key market benchmarks: the Taiwan 50 Index and the weighted Taiwan Stock Exchange Index—see Table 2. However, it is important to contextualize this evidence, as it is based on a single-country setting and a specific sample period. While the portfolio achieved notable absolute returns, a comprehensive evaluation of the model’s superiority across different global markets would require systematic comparisons with explicit benchmark metrics.
Performance Results of the AI-Supported “Hi-Value” Portfolio Over a Twelve- and Twenty-Four-Month Horizon.
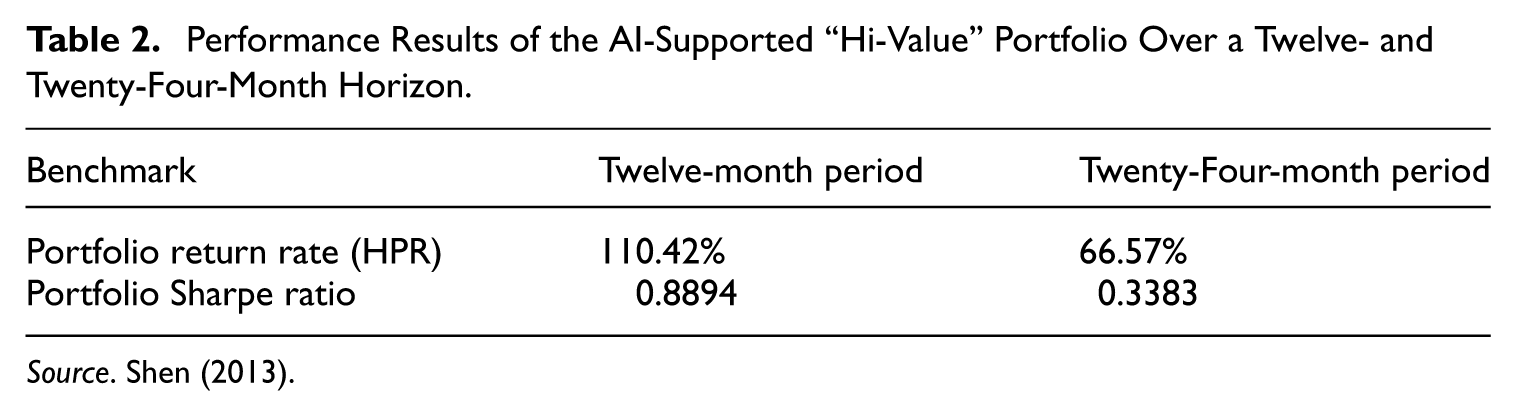
Source. Shen (2013).
These preliminary results suggest that a portfolio built on a model capable of deeper and more flexible analysis of fundamental data can potentially outperform standard market indices in terms of both rate of return and risk-adjusted return (Sharpe ratio). This supports the premise that modern value investing strategies increasingly benefit from the use of advanced analytical methods. The quality of investment decisions in value strategies is therefore inextricably linked not only to the quality of the corporate data itself, but also to the sophistication and accuracy of the models used to interpret it.
3. Hybrid Methods in Anomaly Detection and Data Imputation
The growing complexity of financial time series, characterized by the simultaneous occurrence of linear and nonlinear relationships, poses a fundamental challenge for modern data analysis. This dual nature of information, in which long-term trends and seasonal patterns of a linear nature are intertwined with sudden, nonlinear fluctuations and hidden dependencies, often exceeds the analytical capabilities of individual model classes. Traditional statistical models, despite their robustness in interpreting linear structures, are unable to effectively capture complex, dynamic variability (Zhang 2025). Monolithic machine learning models, on the other hand, while powerful in modeling nonlinearity, may not fully exploit the explicit autocorrelation components of the data. This situation motivates the development and application of advanced hybrid methods, which, by synergistically combining different modeling paradigms, aim to create more accurate, robust, and complete forecasting systems. Hybrid models, in the context of time series analysis, generally refer to integrated forecasting structures. However, to maintain conceptual clarity, it is essential to distinguish between two distinct modeling frameworks often grouped under this term: statistical-machine learning hybrids and deep learning combinations (Schweidtmann et al. 2024). Statistical-machine learning hybrids explicitly decompose and model linear and nonlinear components by combining classical statistical models with machine learning algorithms. In contrast, deep learning combinations consist entirely of integrated neural network modules without a classical statistical component.
The dominant paradigm for statistical-machine learning hybrids is the sequential approach, in which a classical statistical model, such as ARIMA, is used to model the linear component of the time series. This model effectively identifies and forecasts trends and regular autocorrelation patterns. Then, the residuals from the ARIMA model, which by definition represent the nonlinear, stochastic part of the data that cannot be explained by the linear model, become the input data for an advanced machine learning model. Recurrent networks, such as LSTM, are often used in this role, as they are able to capture complex, nonlinear temporal relationships. This two-step process allows for a precise separation of modeling tasks, which has been successfully applied in stock market forecasting (Lyu 2025) and in variants using ARFIMA-LSTM models for long-memory data analysis (Bukhari et al. 2020).
An alternative but equally powerful paradigm is hybridization based on signal decomposition. In this approach, signal processing techniques such as wavelet transform (WT) or empirical mode decomposition (EMD) are used to decompose the original, non-stationary time series into a set of simpler components of different frequencies (Maheshwari and Kumar 2014). For example, a signal can be separated into a trend component (low frequency) and a fluctuation component (high frequency). Each of these components, characterized by different dynamics, is then modeled using a specialized algorithm that best suits its nature. In research on energy consumption forecasting, Support Vector Regression (SVR) has been successfully used to model stable trends, and Extreme Learning Machine (ELM) has been used to forecast more volatile fluctuations (Chen et al. 2025). The use of these integrated architectures paves the way for deeper and more precise analysis (Wang et al. 2025), which translates into key benefits compared to monolithic approaches.
The strategic importance of hybrid methods stems from the synergy created by combining different algorithms. A fundamental advantage of statistical-machine learning hybrids is their ability to simultaneously and specifically model both linear and nonlinear relationships in data. Statistical models are excellent at capturing linear trends and autocorrelation, while advanced machine learning models can handle complex nonlinear patterns and long-term dependencies (Lyu 2025). Synergy can also occur within purely deep learning architectures; in deep learning combinations such as Convolutional Neural Network (CNN)-LSTM or CNN-Gated Recurrent Unit (GRU) models, convolutional layers act as automatic feature extractors, identifying relevant patterns in short time windows, which are then passed on to recurrent layers to model dependencies in longer sequences (Sowiński and Komorowska 2025).
Importantly, the separation of modeling tasks in statistical-machine learning hybrids can reduce the risk of overfitting. By entrusting the statistical model with the task of explaining the linear component, it operates at a lower complexity than a monolithic machine learning model attempting to capture all patterns simultaneously. This allows for the creation of simpler and thus more generalizable models that are less prone to fitting noise in the training data. However, it is crucial to note that this reasoning does not directly extend to fully deep learning combinations (e.g., CNN-LSTM), which remain highly complex and require distinct regularization strategies to prevent overfitting.
Hybrid methods are gaining increasing importance in quantitative finance and official statistics, becoming a key tool for analyzing complex economic data. Accurate price forecasting in highly volatile financial and energy markets is one of the key areas of application. In research on stock market forecasting, a two-stage ARIMA-LSTM model was used, achieving high accuracy measured by a coefficient of determination R 2 of .93 (Lyu 2025). However, this performance metric should be interpreted cautiously within its specific sample context; a comprehensive evaluation of the model’s relative superiority would require systematic benchmark comparisons against alternative models. The principles of integrated architectures also apply to energy markets, where deep learning combinations utilize the capabilities of CNNs to extract local features alongside recurrent layers to model temporal dependencies (Sowiński and Komorowska 2025). In turn, a decomposition approach used in energy consumption forecasting (WT separating the signal for SVR and ELM) yielded notable precision, documented by a mean absolute percentage error (MAPE) of 1.37% in a specific case study of Jiangsu province (Chen et al. 2025). Similar to the financial forecasting examples, contextualizing this result against standard baselines is necessary for a comprehensive evaluation.
Data gaps resulting from reporting delays, measurement errors, or system failures pose a serious challenge to the quality of statistical and financial analyses. Hybrid methods offer advanced solutions to this problem, going beyond simple interpolation techniques.
The concept of data inpainting, borrowed from image processing, has been successfully adapted to fill in missing fragments in time series. For this purpose, a deep learning combination has been developed that utilizes the synergistic action of deep encoder-decoder networks and GANs. In this approach, the encoder-decoder network acts as a generator in the GAN architecture, reconstructing missing data fragments in a way that is consistent with the surrounding known values (Luo et al. 2018). This method has demonstrated effectiveness in accurately filling missing values and improving the mapping of long-range patterns. Although the methodology described originates from geostatistical research, its underlying principles are conceptually applicable to imputation problems in financial and economic time series (Bai and Tahmasebi 2020), provided that the unique distributional properties of financial data are accounted for.
4. The Role of Explainable Artificial Intelligence (XAI) in the Audit of Official Data
The reliability of data in official financial statistics is of fundamental strategic importance. Public trust institutions, such as national statistical offices, central banks, and regulatory agencies, operate in areas where data form the basis for macroeconomic policy-making and market stability. As advanced artificial intelligence (AI) technologies are implemented, these institutions face a dual challenge: they must leverage the analytical potential of these tools while maintaining full transparency and accountability for their actions (Fritz-Morgenthal et al. 2022).
The implementation of advanced machine learning models, such as deep neural networks, is associated with the previously discussed black box problem. Their complex, multi-layered architecture and nonlinear internal logic make the decision-making process extremely difficult for humans to interpret (Ribeiro et al. 2016). This opacity is a fundamental barrier to the adoption of AI in institutions where every decision must be fully justified and auditable. The lack of interpretability is seen not only as a technical limitation, but also as a serious operational, legal, and ethical risk that undermines trust in automated systems (Murorunkwere et al. 2025; Wu et al. 2025).
Explainable Artificial Intelligence (XAI) offers a set of methodologies and tools that support overcoming these barriers, although it should be viewed cautiously as a supportive component rather than a comprehensive panacea for accountability. By providing insight into the decision-making mechanisms of models, XAI facilitates their audit, validation, and trust building (Ali et al. 2023). In the data audit process, model-agnostic post-hoc methods such as LIME and SHAP prove particularly valuable. Their main advantage is their ability to interpret the predictions of any model, even existing and complex ones, without the need to modify it. This flexibility is crucial in institutional environments, where changing approved analytical systems is often impossible or impractical. These techniques allow for the analysis of decisions made by models treated as black boxes, providing explanations for individual results (Kamath and Liu 2021).
The LIME method is based on a simple but powerful idea: explaining a complex model by approximating its behavior in the local environment of a single prediction. In practice, LIME generates a set of slightly modified (perturbed) versions of the analyzed data sample, observes how the black box responds to these changes, and then builds a simple, interpretable replacement model (e.g., a linear model) on this basis. This local model explains which features and to what extent contributed to the main model’s specific decision (Iqbal and Amin 2025; Ribeiro et al. 2016). Despite its usefulness, LIME has some limitations, especially in the context of time series data. The quality and stability of the explanations generated can be sensitive to the way the data is segmented. This sensitivity is particularly problematic in financial auditing, where an arbitrary choice of time window or segmentation can lead to a situation where one analyst concludes that an anomaly was caused by trading volume, while another, using a different segmentation, attributes it to price volatility. Such instability in explanations undermines the very auditability that XAI is supposed to ensure (Bobek and Nalepa 2025).
SHAP is a unified approach to prediction interpretation, the foundations of which are based on Shapley values from cooperative game theory (Lundberg and Lee 2017). This method assigns each feature an imputation value that reflects its average marginal contribution to the prediction result, taking into account all possible combinations of features. The SHAP value for a given feature informs how much it deviated the prediction from the baseline (i.e., the average prediction for the entire dataset). The strength of SHAP lies in its theoretical foundations, characterized by three key properties (Lundberg and Lee 2017):
Local accuracy: The sum of the SHAP values of all features for a given prediction is equal to the difference between the prediction result and the baseline value.
Missingness: A feature that does not contribute information receives a SHAP value of zero.
Consistency: If the model is modified such that the contribution of a given feature increases or remains unchanged, its SHAP value cannot decrease.
However, to maintain analytical balance, it must be acknowledged that SHAP is not without practical limitations. Calculating exact Shapley values for highly complex deep learning architectures is computationally intensive and often relies on approximation methods, which can introduce their own layers of uncertainty into the auditing process.
In the context of anomaly detection, SHAP becomes a potentially powerful diagnostic tool. Nizam et al. (2022) demonstrated the effectiveness of using SHAP values to decompose model predictions into component feature contributions within the industrial Internet of Things (IoT) domain. While their empirical evidence is rooted in industrial sensor networks rather than finance, the underlying methodological principle is conceptually transferable. It suggests that similar frameworks could be cautiously adapted to identify factors causing anomalies in financial time series. By analyzing the SHAP values for a prediction labeled as an anomaly, an analyst can pinpoint which variables contributed to that classification and to what extent. For example, imagine that a model labels a corporate quarterly earnings report as anomalous. Analysis of the SHAP values may reveal that the model’s decision was not dictated by a single false number, but by a combination of factors: a slightly unusual debt-to-equity ratio (SHAP value: +0.2), a significant but not impossible increase in accounts receivable (SHAP value: +0.3), and a geographic distribution of revenue inconsistent with previous quarters (SHAP value: +0.25). This allows the auditor to see the constellation of factors that made the report suspicious. Visualizations such as SHAP summary plots rank features by their average absolute impact on the model’s output, allowing for quick identification of the most important predictors in the entire dataset.
Both LIME and SHAP provide analytical tools that allow us to look inside black boxes, which is a key step in building trust in automated data audit and control systems, provided their respective methodological limitations are properly managed. Table 3 compares the two models.
Comparison of LIME and SHAP Explainability Methods in the Context of Financial Data Auditing.
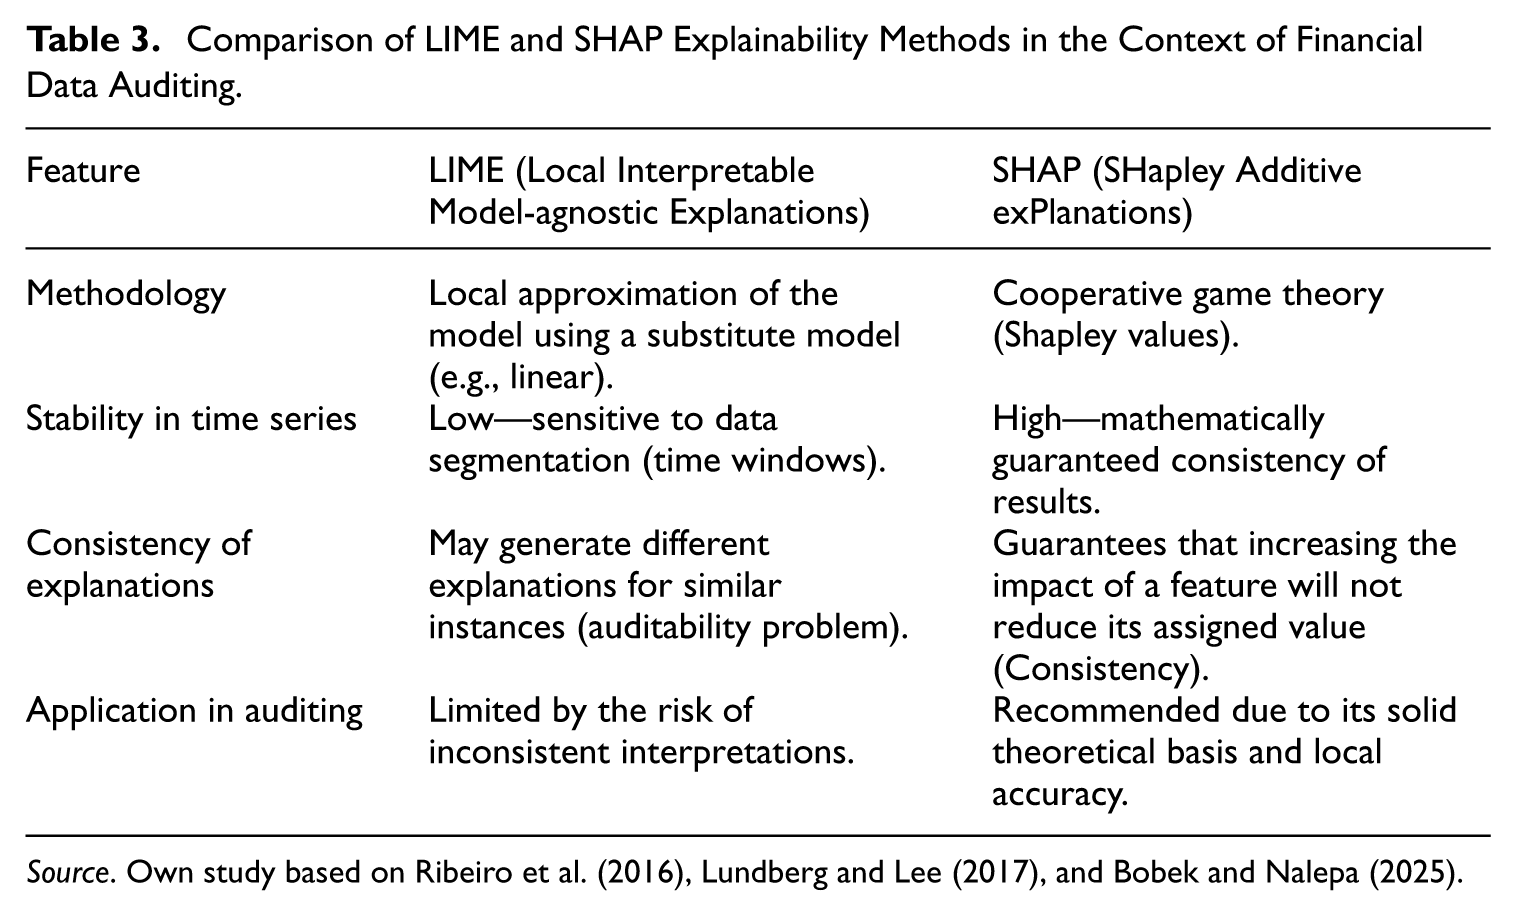
Source. Own study based on Ribeiro et al. (2016), Lundberg and Lee (2017), and Bobek and Nalepa (2025).
The implementation of artificial intelligence in public institutions—spanning both regulatory bodies overseeing market disclosures and national statistical offices compiling macroeconomic data—is not only a technological challenge, but a socio-technical one. It involves supporting human trust in decisions informed by machines, especially in contexts where errors can have serious economic consequences. In this process, Explainable Artificial Intelligence can act as an interpreter between a complex, nonlinear model and a human analyst. By providing local, understandable explanations for flagged anomalies—for example, indicating which reported characteristics made a data submission appear suspicious—XAI systems enable experts to more effectively verify and validate the algorithm’s outputs. Instead of blindly accepting the results, analysts can critically evaluate them based on their domain knowledge (Fritz-Morgenthal et al. 2022). This shift from correlation-based alerts to explanation-based diagnostics highlights XAI’s value proposition. It helps the auditor move from the question “What did the model flag?” to “What economic or statistical reality might this flagged anomaly represent?”
While technical auditability and reproducibility of results support accountability—a foundational element for public trust institutions (Fritz-Morgenthal et al. 2022)—they do not independently guarantee it. Explanations generated by methods such as SHAP or LIME can become a valuable part of the audit documentation. They help create an evidence trail that can be analyzed by internal control departments, supervisory authorities, and other stakeholders. As a result, the AI model becomes a more transparent analytical tool, though it remains embedded within, rather than a replacement for, broader institutional accountability structures. XAI does not eliminate the need for human expertise; rather, it aims to enhance it, allowing specialists to focus on the substantive interpretation of results instead of trying to guess the logic behind the algorithm. Ultimately, integrating XAI should be viewed as a supportive measure in data management rather than a comprehensive solution to all transparency challenges. For institutions operating under strict mandates of public trust, adopting explainable systems represents a highly relevant, albeit complex, step toward supporting credibility and institutional oversight in the era of algorithmic decision-making.
5. Analysis and Discussion: Implications for Investment Strategies
The purpose of discussing the results is to demonstrate how the advanced artificial intelligence methods discussed earlier can affect the outcomes of value investing strategies. Moving from theoretical analysis to operational implications, it is worth exploring how technological innovation in the area of data quality assurance translates into potential risk reduction and improved investment decision effectiveness. The central point of this discussion is the thesis that the use of hybrid models for imputation and anomaly detection, along with the implementation of Explainable AI (XAI) to support auditability, fundamentally strengthen the information ecosystem, potentially improving price discovery and increasing the rationality of capital allocation in markets.
To maintain institutional coherence, it is essential to delineate the roles of different actors in this ecosystem. Value investing relies on rigorous fundamental analysis, whose credibility and effectiveness are inextricably linked to the quality of corporate financial disclosures overseen by market regulatory bodies (e.g., the SEC), rather than official macroeconomic statistics compiled by National Statistical Offices (NSOs). Every decision to purchase shares perceived as undervalued is based on the assumption that this corporate input data—reflecting the financial condition of the company—is accurate and complete (Matuszak 2013). Improving the oversight of this specific data stream represents a strategic reinforcement of the entire investment paradigm.
As has been shown, value investors base their analytical models on an in-depth interpretation of accounting indicators, such as cash flow from operations (CFO), in order to forecast future profits (Lev and Thiagarajan 1993; Ou and Penman 1989). A fundamental risk to this strategy is the phenomenon of the value trap, which often results from decisions based on erroneous, incomplete, or subsequently revised corporate data. Advanced hybrid methods offer a direct technological response to this challenge. Techniques such as data imputation using encoder-decoder architectures (Bai and Tahmasebi 2020) and the detection of subtle anomalies using ARIMA-LSTM models (Lyu 2025) can be utilized by supervisory authorities to foster the creation of high-fidelity data environments.
By analyzing historical time series, regulatory systems could proactively flag inconsistencies in fundamental indicators—such as unusual fluctuations in cash flows or margins—which, if left undetected in public disclosures, could lead an investor directly into a value trap. The implementation of these technologies at the source, specifically in the process of data collection and verification by regulatory institutions, supports the investor’s decision-making process. Consequently, analysts would operate on datasets with significantly higher integrity, providing more reliable input for their analytical models and reducing the risk of misjudging a company’s intrinsic value.
In this way, strengthening the integrity of input data through regulatory oversight initiates a cascade of positive effects that propagate from the level of individual financial information to the broader stability of investment portfolios. This risk reduction mechanism, driven by the potential application of advanced AI models in market supervision, can be deconstructed into a series of logically linked steps that ultimately aim to reduce volatility and uncertainty for the end investor—see Table 4.
Cascading Investment Risk Reduction Mechanism Supported by Hybrid AI Systems.
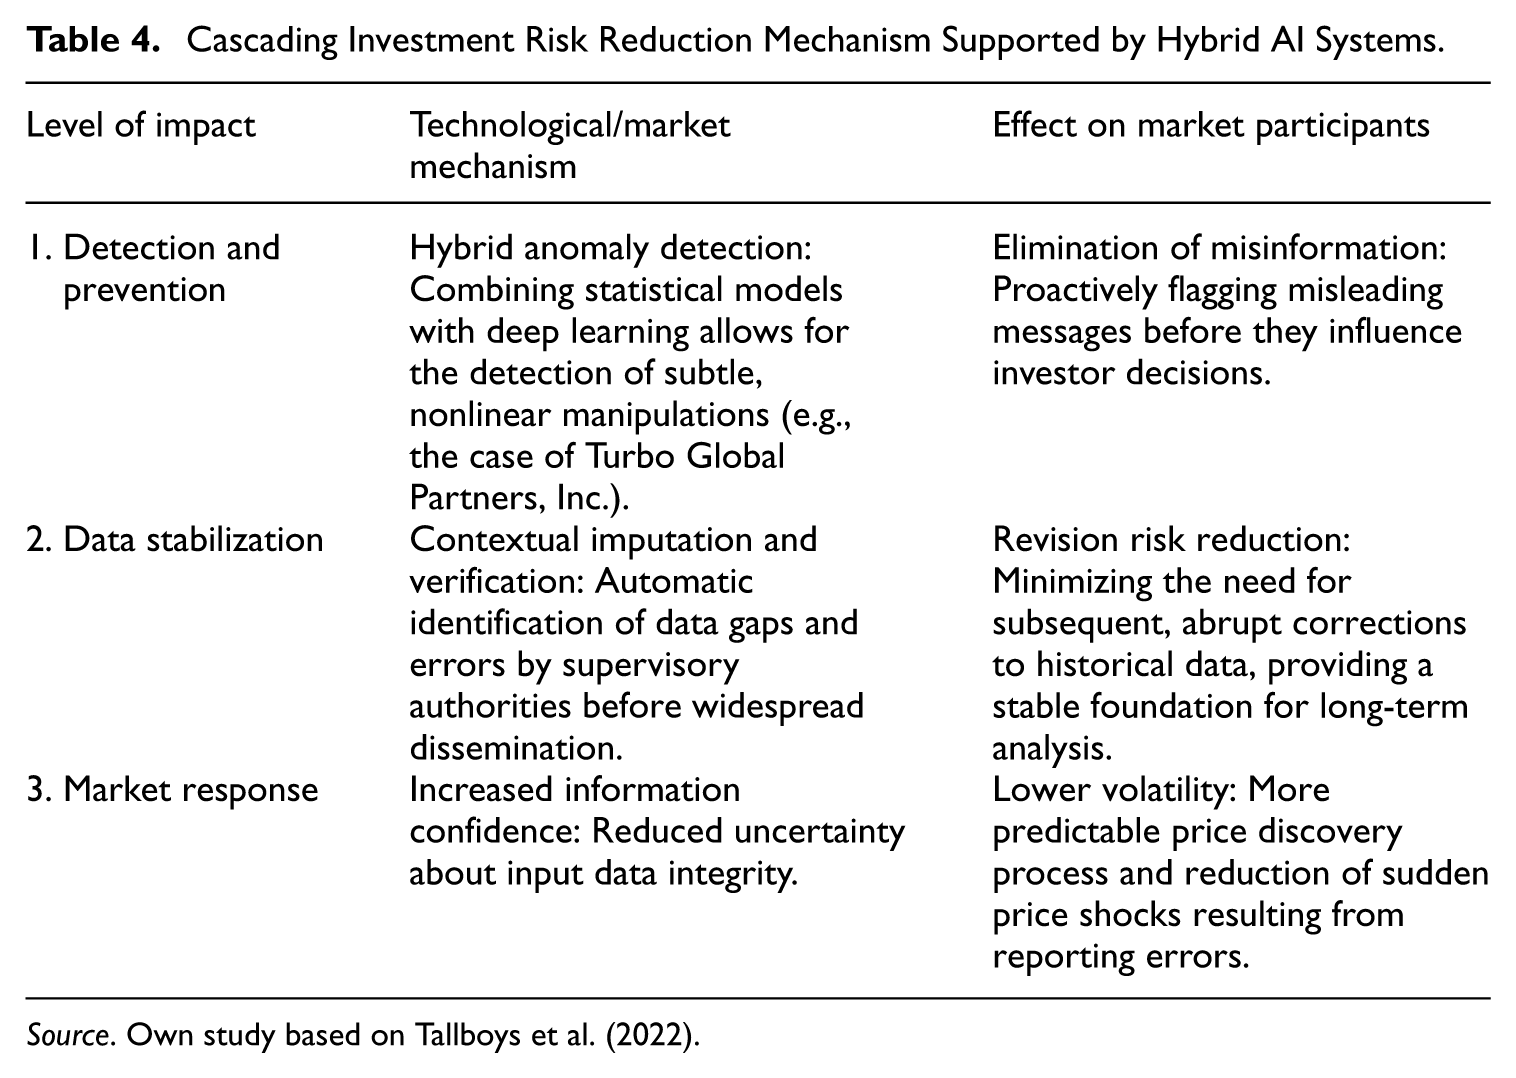
Source. Own study based on Tallboys et al. (2022).
For supervisory authorities and regulatory bodies, minimizing the magnitude of subsequent data revisions by reporting entities is an important operational goal; the proposed hybrid AI models could facilitate this by helping to identify anomalies in the pre-dissemination or early-dissemination phase, thereby stabilizing historical time series and reducing the market risk associated with frequent data corrections. This mechanism can potentially translate into a more predictable investment environment, which is particularly valuable for long-term strategies such as value investing, where stability of fundamentals is key. However, the effectiveness of this mechanism depends not only on technological precision, but also on market confidence in the methods used.
The predictive accuracy of advanced algorithms, while impressive, is not enough to ensure their widespread acceptance in the financial ecosystem. In the context of public trust institutions such as the SEC, which are responsible for market integrity, it is important to support the auditability and transparency of the data verification process. Market participants must be confident that algorithmic decisions are justified and consistent. This is where Explainable AI (XAI) plays a supportive role, helping to build a bridge between the complexity of the algorithm and the need for human oversight.
As indicated in the section on Explainable Artificial Intelligence (XAI), these methods address the black box problem (Ribeiro et al. 2016) by translating the internal logic of models into human-understandable justifications. When comparing the two leading model-agnostic techniques, LIME and SHAP, it is important to note the particular usefulness of SHAP in a financial context. Its solid foundations in game theory help ensure the consistency and stability of explanations, which is beneficial for audit credibility. In contrast, LIME can be unstable when applied to time series data, where the choice of data segmentation method can lead to inconsistent interpretations (Bobek and Nalepa 2025; Lundberg and Lee 2017).
In practice, an analyst at a supervisory agency could use SHAP values to deconstruct an anomaly alert in a company’s financial report. Instead of receiving only binary information (“anomaly: yes/no”), the analyst would see a precise breakdown of the contribution of individual variables to this decision. They could conclude that the alert was generated due to a combination of a slightly increased level of receivables, an unusual change in operating margin, and a decline in asset turnover. Such a decomposition creates a defensible, precise audit trail that supports institutional accountability (Fritz-Morgenthal et al. 2022). In this way, XAI is an important component in building market confidence in a new generation of high-fidelity financial data, rather than just a technical add-on.
Despite its analytical potential, the implementation of the described AI technologies in financial market supervision faces significant technical, operational, and institutional barriers. Realizing the vision of highly automated and transparent data verification systems requires overcoming the following challenges:
Institutiona lresistance and the “black box” problem: A fundamental barrier is the reluctance to rely on systems whose internal logic is not fully understood by decision-makers and auditors. As research shows, the black box problem undermines trust and hinders the adoption of AI in institutions that require accountability for decisions made, which is crucial in the public and financial sectors (Murorunkwere et al. 2025).
Computational cost: Hybrid models, especially those using deep learning architectures such as GAN and LSTM (Lyu 2025; Zhang et al. 2023), are inherently resource-intensive. Training and deploying them at the scale of national market supervisory systems, which process huge volumes of data, would require significant investment in dedicated high-performance computing infrastructure. This scalability challenge is particularly relevant for the processing of large-scale administrative registers or high-frequency data, where traditional manual validation is no longer feasible due to the unprecedented volume and velocity of incoming data streams.
Technical limitations of XAI methods themselves: Even the most advanced explainability tools still have their weaknesses. The aforementioned potential instability of explanations generated by LIME for time series data (Bobek and Nalepa 2025) illustrates that these methods are not a universal solution. They require further development and validation to ensure their reliability in every analytical context, especially in high-stakes applications.
Overcoming these challenges will be key to more fully realizing the potential that artificial intelligence offers in strengthening the integrity of financial markets and supporting more informed investment strategies.
6. Conclusion
The era of high-frequency trading and algorithmic data analysis has challenged the effectiveness of traditional, human-based financial market control mechanisms. The incident involving TRBO, whose disinformation activities spread at a speed that made manual intervention impossible, is not an anomaly but a symptom of a systemic gap (Tallboys et al. 2022). This article addresses this issue by reviewing a new generation of AI-based tools that can support the integrity of financial data.
In response to these challenges, based on the synthesized literature, three main observations can be formulated:
C1: The literature suggests that hybrid models, such as sequential ARIMA-LSTM architectures, offer distinct advantages over monolithic models. Their ability to simultaneously and specifically model both linear and nonlinear relationships allows for potentially higher forecasting accuracy (Lyu 2025). Furthermore, in the case of statistical-machine learning hybrids, this separation of modeling tasks can also help reduce the risk of overfitting, increasing the models’ ability to generalize.
C2: Data quality is a fundamental factor determining the success of value investing strategies. The use of AI to foster high-fidelity data environments emerges as a valuable defense mechanism against the value trap phenomenon (Ou and Penman 1989). This mechanism involves supervisory authorities proactively identifying inconsistencies in key fundamental indicators, such as cash flow from operations (CFO) or margins, which, if left unverified, could lead to poor investment decisions.
C3: Explainable Artificial Intelligence (XAI) is a highly valuable, supportive component facilitating the implementation of advanced algorithms in institutions of public trust. XAI methods help mitigate the black box problem (Ribeiro et al. 2016), building trust based on methods with a solid theoretical foundation that support the consistency and stability of explanations (Lundberg and Lee 2017). This transparency is a key factor in creating a reliable and defensible audit trail (Fritz-Morgenthal et al. 2022).
The proposed review article addresses the research gap identified in the introduction concerning the opacity of advanced anomaly detection models. This was achieved through a systematic review of not only highly effective hybrid models, but also XAI methods that tackle the issue of their interpretability. In this way, it was discussed how these two areas of research are not only complementary, but also constitute an interdependent system. It was also argued that the implementation of complex predictive models without the parallel use of explainability frameworks is suboptimal and introduces significant operational risks in the context of public trust institutions. The presented review suggests that it is the synergy between the predictive capabilities of hybrid methods and the interpretability supported by XAI that holds the key to maintaining the integrity of modern markets.
It should be emphasized that the analysis has its limitations. The work is a literature review and, as such, does not present the results of new empirical research or propose an innovative algorithmic model. Its purpose was to synthesize and critically evaluate the existing state of knowledge. Furthermore, the analysis did not attempt to thoroughly examine all the challenges associated with the practical implementation of the technologies discussed. Key barriers that require further attention include:
Institutional barriers: Resistance to the adoption of “black box” systems, which is not irrational but stems from the real operational, legal, and reputational risks associated with implementing systems that lack accountability mechanisms (Murorunkwere et al. 2025).
High computational cost: Significant infrastructure requirements associated with training and deploying complex deep learning models at scale, which may be a significant constraint for many institutions.
Imperfections of existing XAI methods: Potential instability of some popular techniques, such as LIME, when applied to time series data, which may undermine the reliability and consistency of the explanations generated in an audit context (Bobek and Nalepa 2025).
The analysis indicates that the future of financial data oversight and algorithmic auditing lies in the close synergy between the analytical potential of hybrid models and the transparency supported by Explainable Artificial Intelligence. The conclusions of this work open the way to further promising research directions. Among the most important of these is the development of real-time XAI systems for analyzing data streams from public databases, such as SEC EDGAR—systems capable of deconstructing anomalies, indicating to analysts not only that a report is suspicious, but also why, for example, due to a disturbing constellation of factors such as an increase in receivables and a change in operating margin. Equally important will be research on optimizing hybrid models to reduce their computational complexity without losing predictive accuracy, and designing new, more stable and consistent XAI methods dedicated to the specifics of nonlinear, multidimensional time series in finance.
The proposed research directions represent steps toward exploring a new paradigm of algorithmic auditing, in which predictive power is closely linked to transparency. In summary, the integration of explainable artificial intelligence is becoming a highly relevant strategic consideration, supporting trust and stability in the financial system in the digital age.
Footnotes
Funding
The author disclosed receipt of the following financial support for the research, authorship, and/or publication of this article: Proofreading supported by funds from the Ministry of Science under the “Regional Excellence Initiative” Program.

Received: December 31, 2025
Accepted: May 18, 2026