
Abstract
Background
The effects of a tin filter on virtual non-enhanced (VNE) images created by dual-energy CT have not been well evaluated.
Purpose
To compare the accuracy of VNE images between those with and without a tin filter.
Material and Methods
Two different types of columnar phantoms made of agarose gel were evaluated. Phantom A contained various concentrations of iodine (4.5–1590 HU at 120 kVp). Phantom B consisted of a central component (0, 10, 25, and 40 mgI/cm3) and a surrounding component (0, 50, 100, and 200 mgI/cm3) with variable iodine concentration. They were scanned by dual-source CT in conventional single-energy mode and dual-energy mode with and without a tin filter. CT values on each gel at the corresponding points were measured and the accuracy of iodine removal was evaluated.
Results
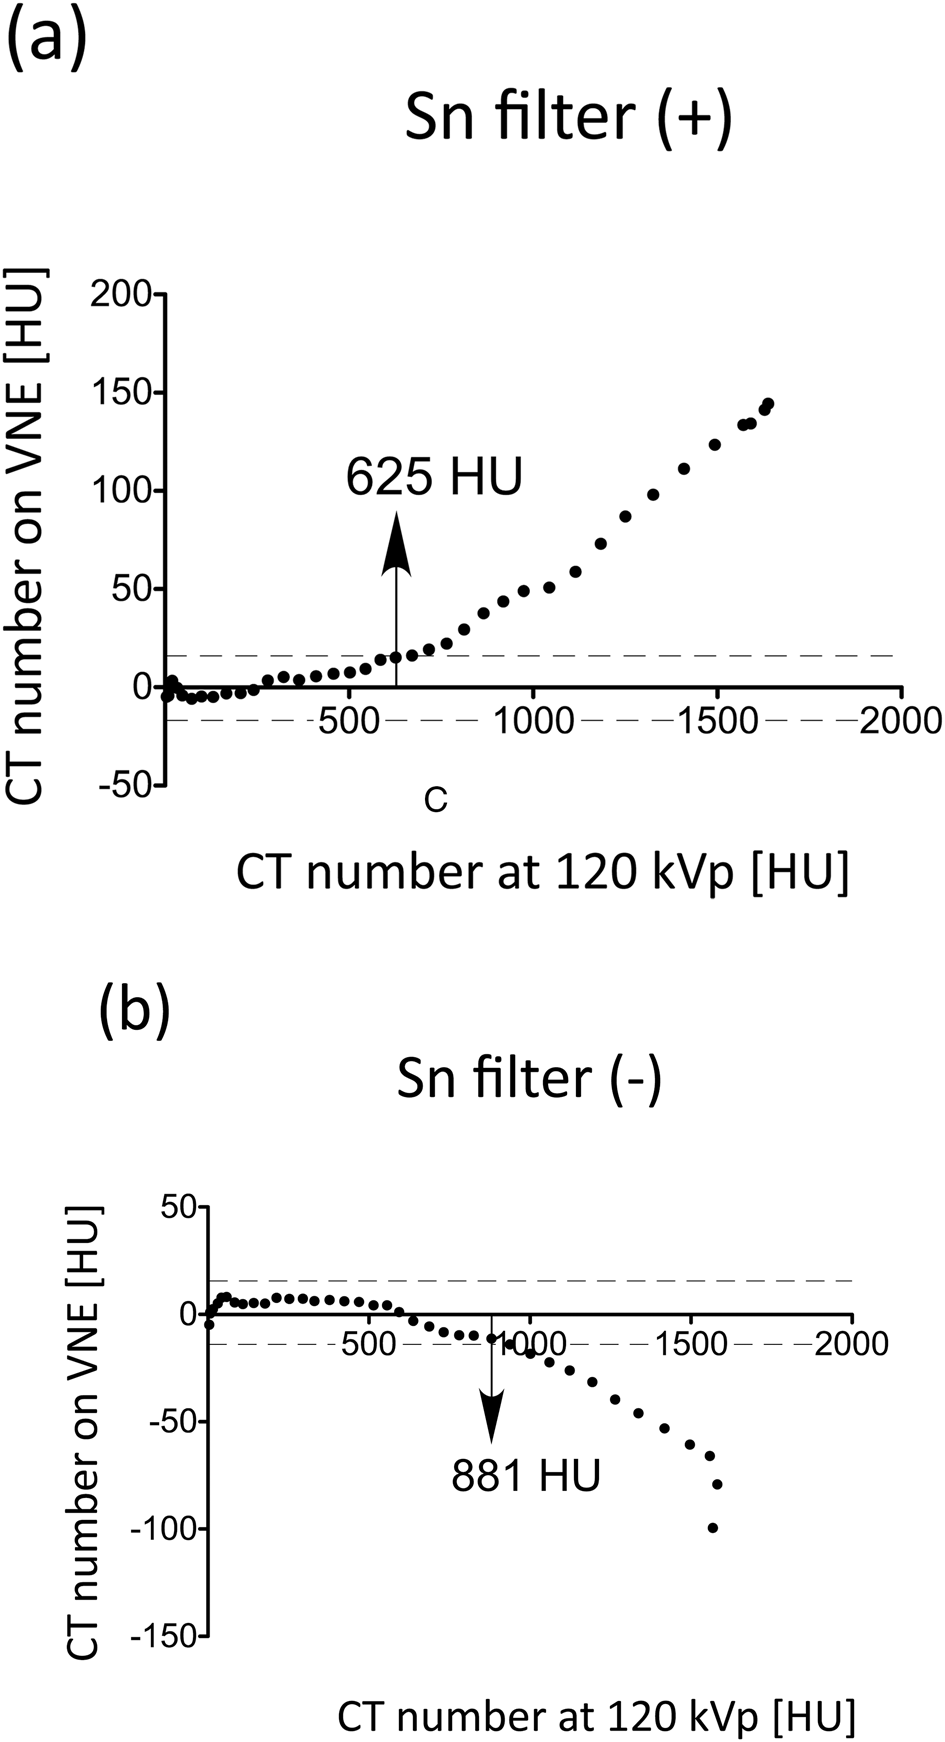
On VNE images, the CT number of the gel of Phantom A fell within the range between –15 and +15 HU under 626 and 881 HU at single-energy 120 kVp with and without a tin filter, respectively. With attenuation over these thresholds, iodine concentration of gels was underestimated with the tin filter but overestimated without it. For Phantom B, the mean CT numbers on VNE images in the central gel component surrounded by the gel with iodine concentrations of 0, 50, 100, and 200 mgI/cm3 were in the range of –19–+6 HU and 21–100 HU with and without the tin filter, respectively.
Conclusion
Both with and without a tin filter, iodine removal was accurate under a threshold of iodine concentration. Although a surrounding structure with higher attenuation decreased the accuracy, a tin filter improved the margin of error.
Since the introduction of dual-source CT in 2005 by Siemens Medical Solutions with the brand name SOMATOM Definition, many reports concerning its application to diagnosing procedures have been published. Among them, the dual-energy technique has been one of the most interesting topics, creating novel images not obtained using conventional single-source CT scanners. This unique technique has enabled quite new applications, such as lung perfusion imaging (1, 2), bone-removed CT angiography (3, 4), qualitative diagnosis of urinary stones (5, 6), and quantitative contrast enhancement analysis of pulmonary ground-glass attenuation lesions (7, 8).
Liver VNC (virtual non-contrast) is application software available on a workstation. With this application, components of contrast material can be separated from the data-sets of postcontrast images obtained by the dual-energy (DE) technique based on the 3-material decomposition theory, consequently creating virtual non-enhanced (VNE) and “iodine-mapping” images (9). A previous study showed that VNE images might replace “true” non-enhanced images as part of a multiphase liver imaging protocol with consequent saving of the radiation dose (10); however, Takeuchi et al. (11) reported the inaccuracy of iodine removal in some clinical situations. They suggested that a higher range of iodine concentration and a beam-hardening effect from surrounding thick skeletal structures such as the pelvis might contribute to the inaccuracy.
Although changes in radiation quality induced by the beam-hardening effect are considered to influence the accuracy (12), a new system equipped with a “selective photon shield” has recently been introduced to reduce the effect by removing low-energy photons from the high-energy X-ray tube using a tin filter. This technique could achieve better separation of the 80 and 140 kVp images and is expected to improve the ability to discriminate different materials such as calcium, iodine, and iron (13). It could also be expected to produce more reliable and applicable VNE images even in the range of higher attenuation; however, the precise characteristics of this technique have not been investigated in detail so far.
In this study, we conducted a phantom study to investigate the influence of high-attenuating materials and the effects of a tin filter on VNE images, focusing on the effectiveness of iodine removal.
Material and Methods
Preparation of phantoms
Two types of 30-mm-diameter columnar phantoms were made from plastic centrifuge tubes (Becton Dickinson, Franklin Lakes, NJ, USA). Phantom A contained 2% agarose gel (Sigma-Aldrich Japan, Tokyo, Japan) and variable concentrations (0 to 100 mgI/cm3; changed by gradation) of iodinated contrast media (Iopamiron; Bayer Schering Pharma, Berlin, Germany). The iodine concentration gradient was created by utilizing the diffusion phenomenon after placing several pieces of gel in different concentrations of iodine (Fig. 1a). This phantom was used to investigate the relationship between CT numbers on images scanned in conventional 120-kVp single-energy (SE) mode and those in VNE (80 and 140 kVp) mode. Phantom B contained 2% agarose gel with 0, 10, 25, or 40 mgI/cm3 iodine in the central component (15 mm in diameter) as regions of interest (ROIs), and with 0, 50, 100, or 200 mgI/cm3 iodine in the surrounding component (Fig. 1b). Phantom B was used to investigate the influence of encircling high-attenuation objects on VNE images. CT numbers in the central components of Phantoms B were measured before being assembled to confirm their uniformity and homogeneity using 120-kVp conventional SE scans.
Schematic view of the phantoms. (a) Phantom A. In a cylindrical container, a concentration gradient of iodinated contrast medium was made by dissolving it in agarose gel. (b) Phantom B contains a central component with variable iodine concentrations (0, 10, 25, and 40 mgI/cm3) as regions of interest and a surrounding component with a constant iodine concentration (0, 50, 100, or 200 mgI/cm3)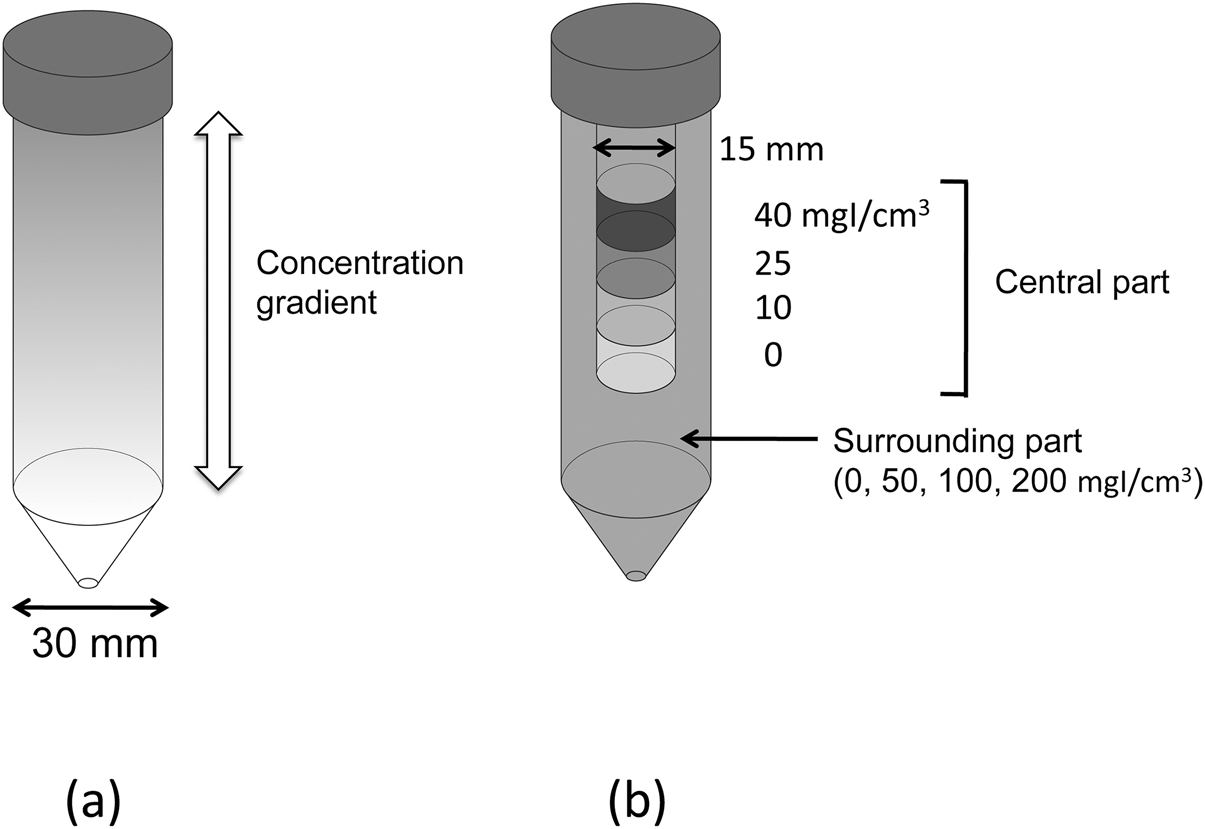
CT scanning
Each phantom was fixed in the axial center of a columnar container (30 cm in diameter) filled with water and scanned with SOMATOM Definition Flash (Siemens Medical Solutions, Forchheim, Germany) in 120 kVp SE mode and DE mode. Scanning parameters used in SE mode were as follows: tube voltage, 120 kVp; tube current-time product, 122 mAs; beam collimation, 64 × 2 × 0.6 mm with z-flying focal spot; rotation time, 0.5 s; and pitch, 0.6. Parameters in DE scan mode were as follows: tube voltages, 80 and 140 kVp; tube current-time products, 214 and 83 mAs for 80 and 140 kVp, respectively (with a tin filter), 220 and 40 mAs for 80 and 140 kVp, respectively (without a tin filter); beam collimation, 32 × 2 × 0.6 mm with z-flying focal spot; rotation time, 0.5 s; and pitch, 0.6. The images were reconstructed at 1.5-mm thickness and 1-mm intervals using a reconstruction kernel of D30f. Both phantoms were scanned along the longitudinal axis.
Calculation of VNE images
The concept of material decomposition using DECT has already been reported (9). VNE images were obtained from the data-sets acquired by two different kilovolt scans using the “Liver VNC” application of Syngo Dual Energy originally installed on the workstation. On the plot of CT numbers of different materials at 80 and 140 kVp spectra, fat, water, and soft tissue lie on a line, whereas additional iodine in the tissue displaces the CT numbers of the respective voxels from the line. Since the slope of the line for iodine is known and constant, the concentration of iodine can be estimated from the diagram. Therefore, iodine component was removed from the data-sets created from two different kilovolt images, and VNE images were obtained. The parameters required for material decomposition followed the manufacturer's default settings.
Image evaluation
Imaging analysis was performed using DICOM imaging software OsiriX version 3.3 (free download at
For the main experiment, CT numbers were measured on 120 kVp SE, DE (at both 80 and 140 kVp), and VNE images in the corresponding areas by placing circular region of interests (ROIs) on the viewer with a window setting of 600/150 (WW/WL) (Fig. 2). For Phantom A, ROIs with 3.0 cm2 were applied at the axial center on 40 different slices. For Phantom B, ROIs with 1.0 cm2 were applied to the central component on three different slices per iodine concentration (0, 10, 25, or 40 mgI/cm3). The location of each ROI was identical among the different kilovolt images and scans.
Examples of the ROI setting. (a) A transaxial VNE image of Phantom A. ROIs with 3.0 cm2 were applied on the axial center in 40 different slices. (b) A transaxial VNE image of Phantom B. ROIs with 1.0 cm2 were applied to the central component in three different slices per iodine concentration (0, 10, 25, or 40 mgI/cm3).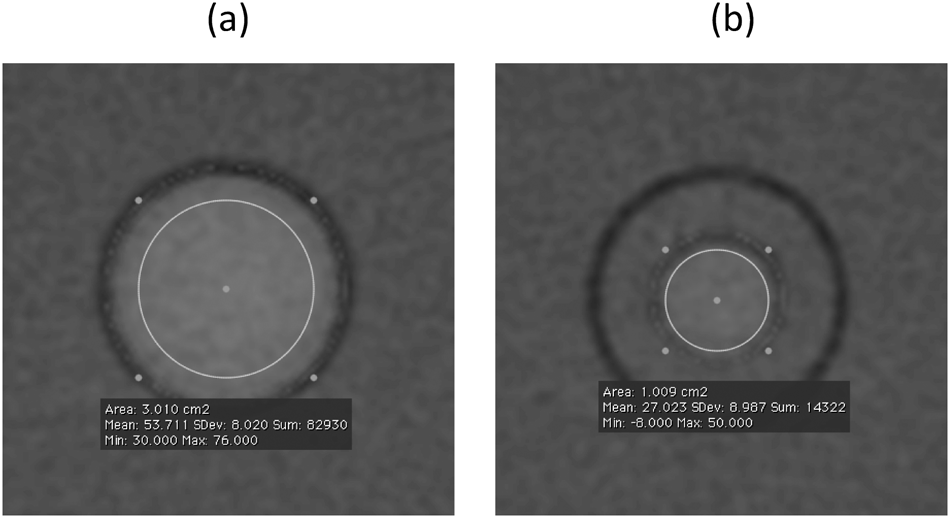
We employed the range from –15 to 15 HU for acceptable iodine removal on VNE images, because in a preliminary experiment the CT number of water with 2% agarose gel was approximately zero, with an estimated margin of error on the assumption that it could exclude hemorrhage, enhanced tissue, or fat in clinical settings.
The maximum CT number that could be measured on this equipment was 3070 HU.
Statistical analysis
All calculations were performed using statistical software Prism 5 ver. 5.0 (GraphPad Software, La Jolla, CA, USA). To assess the differences in CT numbers between VNE images with and without the filter, the paired t-test was used.
Results
Quality of the phantom models
Properties of the phantoms
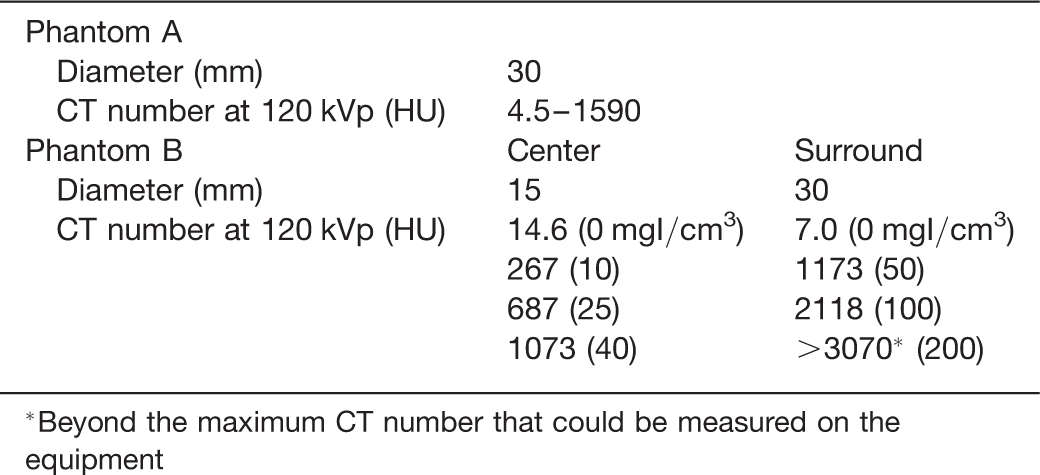
*Beyond the maximum CT number that could be measured on the equipment
Correlation between CT numbers on 120 kVp SE and VNE images (Phantom A)
CT images of Phantom A in eight different slice planes on 120 kVp-SE images, VNE images with and without a tin filter are shown in Fig. 3. Fig. 4 is a scatter plot showing the relationship between CT numbers on 120 kVp-SE and VNE images with and without a tin filter. CT numbers on VNE images were nearly zero within the attenuation range of ± 15 HU under 626 and 881 HU of 120 kVp images with and without the filter, respectively. With attenuation over these thresholds, iodine concentration of gels was underestimated with the tin filter but overestimated without it. With the tin filter, the CT number on VNE images increased according to the elevation of CT number on 120-kVp SE images and decreased without the tin filter.
Transaxial CT images of Phantom A in eight different slice planes on 120 kVp single energy scan (top row), VNE scan with a tin filter (middle row), and VNE scan without a tin filter (bottom row) (WW/WL = 600/150). CT numbers are shown below each image A scatter plot between CT numbers on SE images and those on VNE images with (a) or without (b) a tin filter. In the range of higher attenuation, iodine removal became insufficient (with the filter) or excessive (without the filter). Dashed lines indicate the range between –15 and 15 HU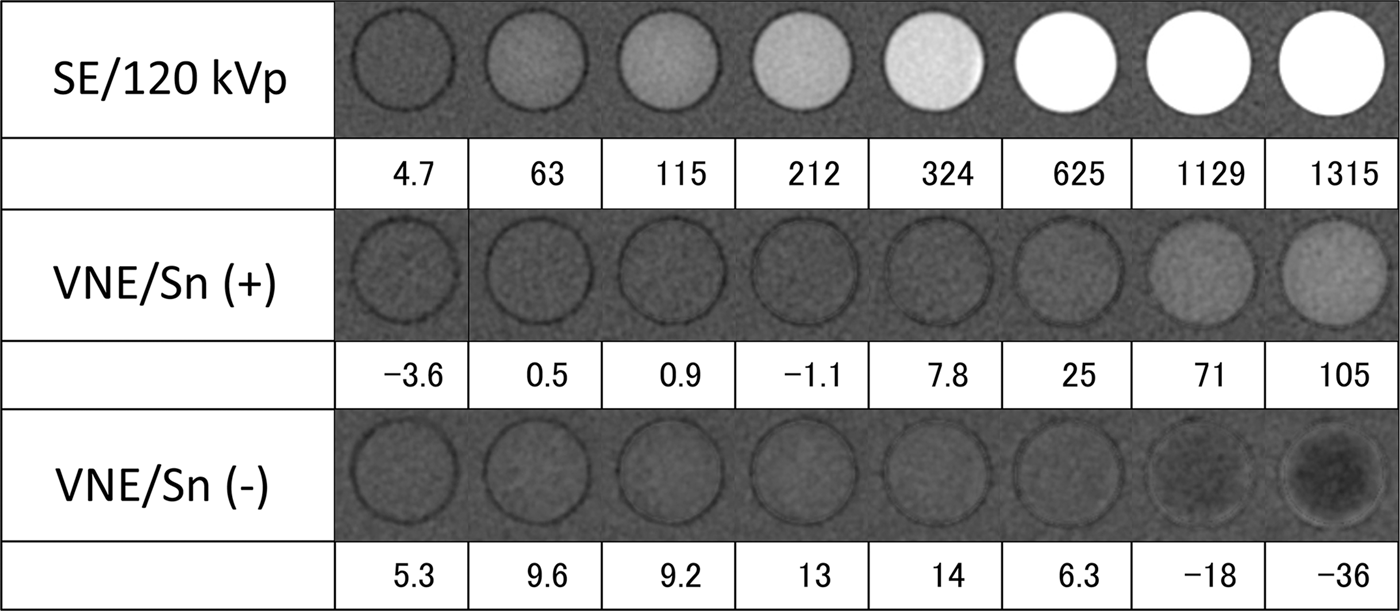
CT numbers of central component on VNE images surrounded by various iodine concentrations (Phantom B)
Fig. 5 shows the VNE images of Phantom B in four slice planes with central iodine concentrations of 0, 10, 25, and 40 mgI/cm3 with and without the tin filter surrounded by the outer component with iodine concentrations of 0, 50, 100, and 200 mgI/cm3. Because the CT numbers in the area with 100 and 200 mgI/cm3 were higher than the maximum value (3070 HU) at 80 kVp, iodine removal became incomplete and showed elevated attenuation in the surrounding area. Mean CT numbers on VNE images of the central gel component including all four iodine concentrations with each iodine concentration in the surrounding areas are shown at the bottom of Fig. 4. Without the tin filter, iodine removal became insufficient at iodine concentrations of 100 and 200 mgI/cm3, especially according to the lower iodine concentration of the central component (including 0 mgI/cm3).
Transaxial VNE images of Phantom B in slice planes with different concentrations of iodine (0, 10, 25, and 40 mgI/cm3) surrounding an area with different concentrations of iodine (0, 50, 100, and 200 mgI/cm3) (WW/WL = 600/150). Left column: with the filter, right column: without the filter. CT numbers of the central areas are shown below each image. Note that incomplete iodine removal is seen in surrounding components with 100 and 200 mgI/cm3 because their CT numbers at 80 kVp were beyond the maximum value (3070 HU) and miscalculations occurred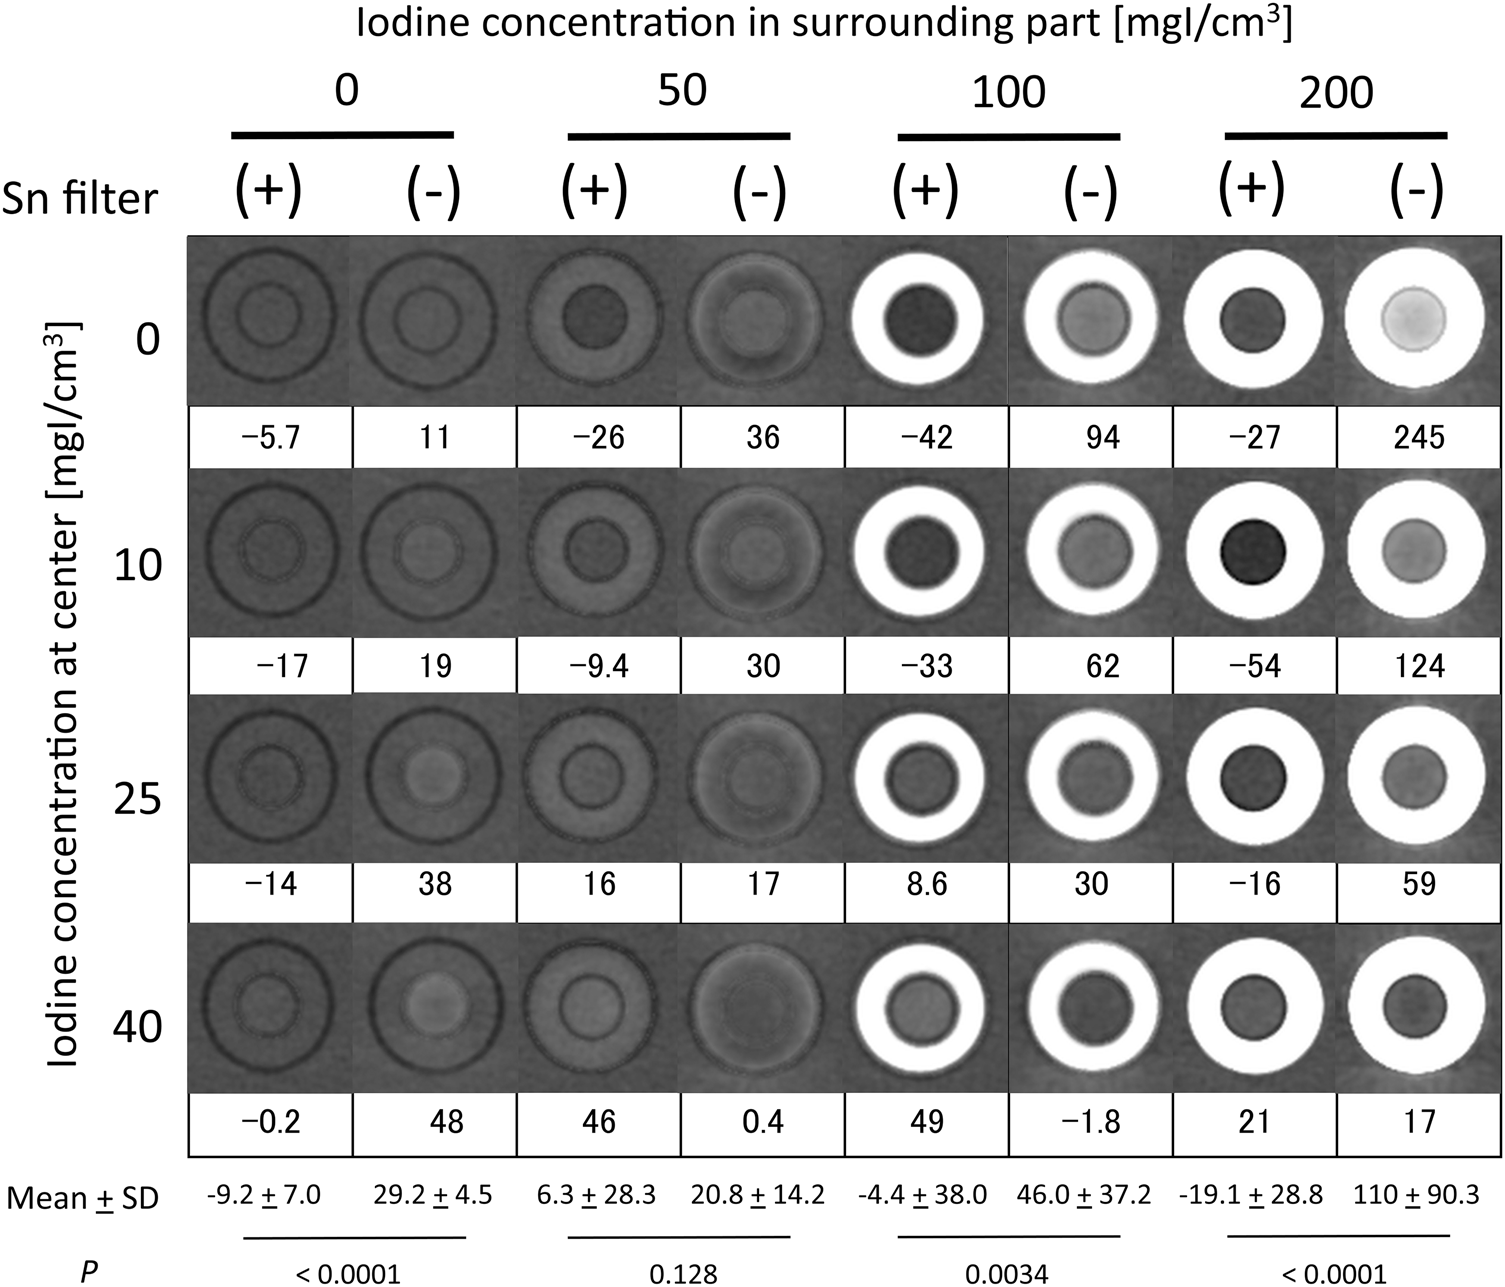
Discussion
In the study using Phantom A, iodine was almost sufficiently removed in the attenuation range under 626 and 881 HU (at 120 kVp) with and without a tin filter, respectively. Since these attenuation values are higher than those of all contrast-enhanced organs, including blood in vessels, VNE images are considered to be acceptable in most clinical settings. In a range higher than those CT numbers with a large amount of iodine, however, iodine removal became inaccurate and underestimated in a scan setting using a tin filter. In contrast, over-estimation of iodine removal was observed without the tin filter. In clinical cases with VNE images, deterioration of the accuracy of iodine removal has been reported, especially in the urinary tract in a postcontrast pyelogram phase (11, 14). This phenomenon probably occurs because of the difference in CT numbers at each scan using different kilovoltages. Because the 3-material decomposition theory is based on a hypothesis in which the increasing rate of CT numbers on 80–140 kVp diagrams is constant with the increase in the concentration of iodine. The VNC application employs 3.01 and 2.00 as the constant with and without the tin filter, respectively. In this study, however, the observed increasing rate was not constant and deviation from theoretical values became larger in the higher attenuation range so that an error in iodine removal occurred (Fig. 6). Since this error seemed systematic, it could be possible to find a correcting formula to calculate more accurate iodine removal. For this study, however, a partial volume effect and in-plane inhomogeneity might be problematic because the concentration of iodine in Phantom A changes by gradation. To solve these problems and to create optimal image processing algorithms, we are conducting a phantom study using a greater variety of homogeneous phantoms with different sizes and attenuations.
Suggested theory for the inaccuracy of iodine removal in the experiment using Phantom A. On the 80–140 kVp diagram, CT numbers of unenhanced tissues behave as shown by a thick gray line. According to the material decomposition theory, the increasing rate of CT numbers is constant with an increase in the concentration of iodine within the tissue (solid line). In this study, however, the observed increase rate was not constant and deviation from theoretical values became larger in the higher attenuation range (solid dots). (a) Case with a filter. For example, if the CT number located at point “P” is observed, VNE calculation will appear as a dotted line (parallel to the solid line) and result in insufficient removal (point “Q”). (b) Case without a filter. For the same reason, excessive removal will occur in the range with higher attenuation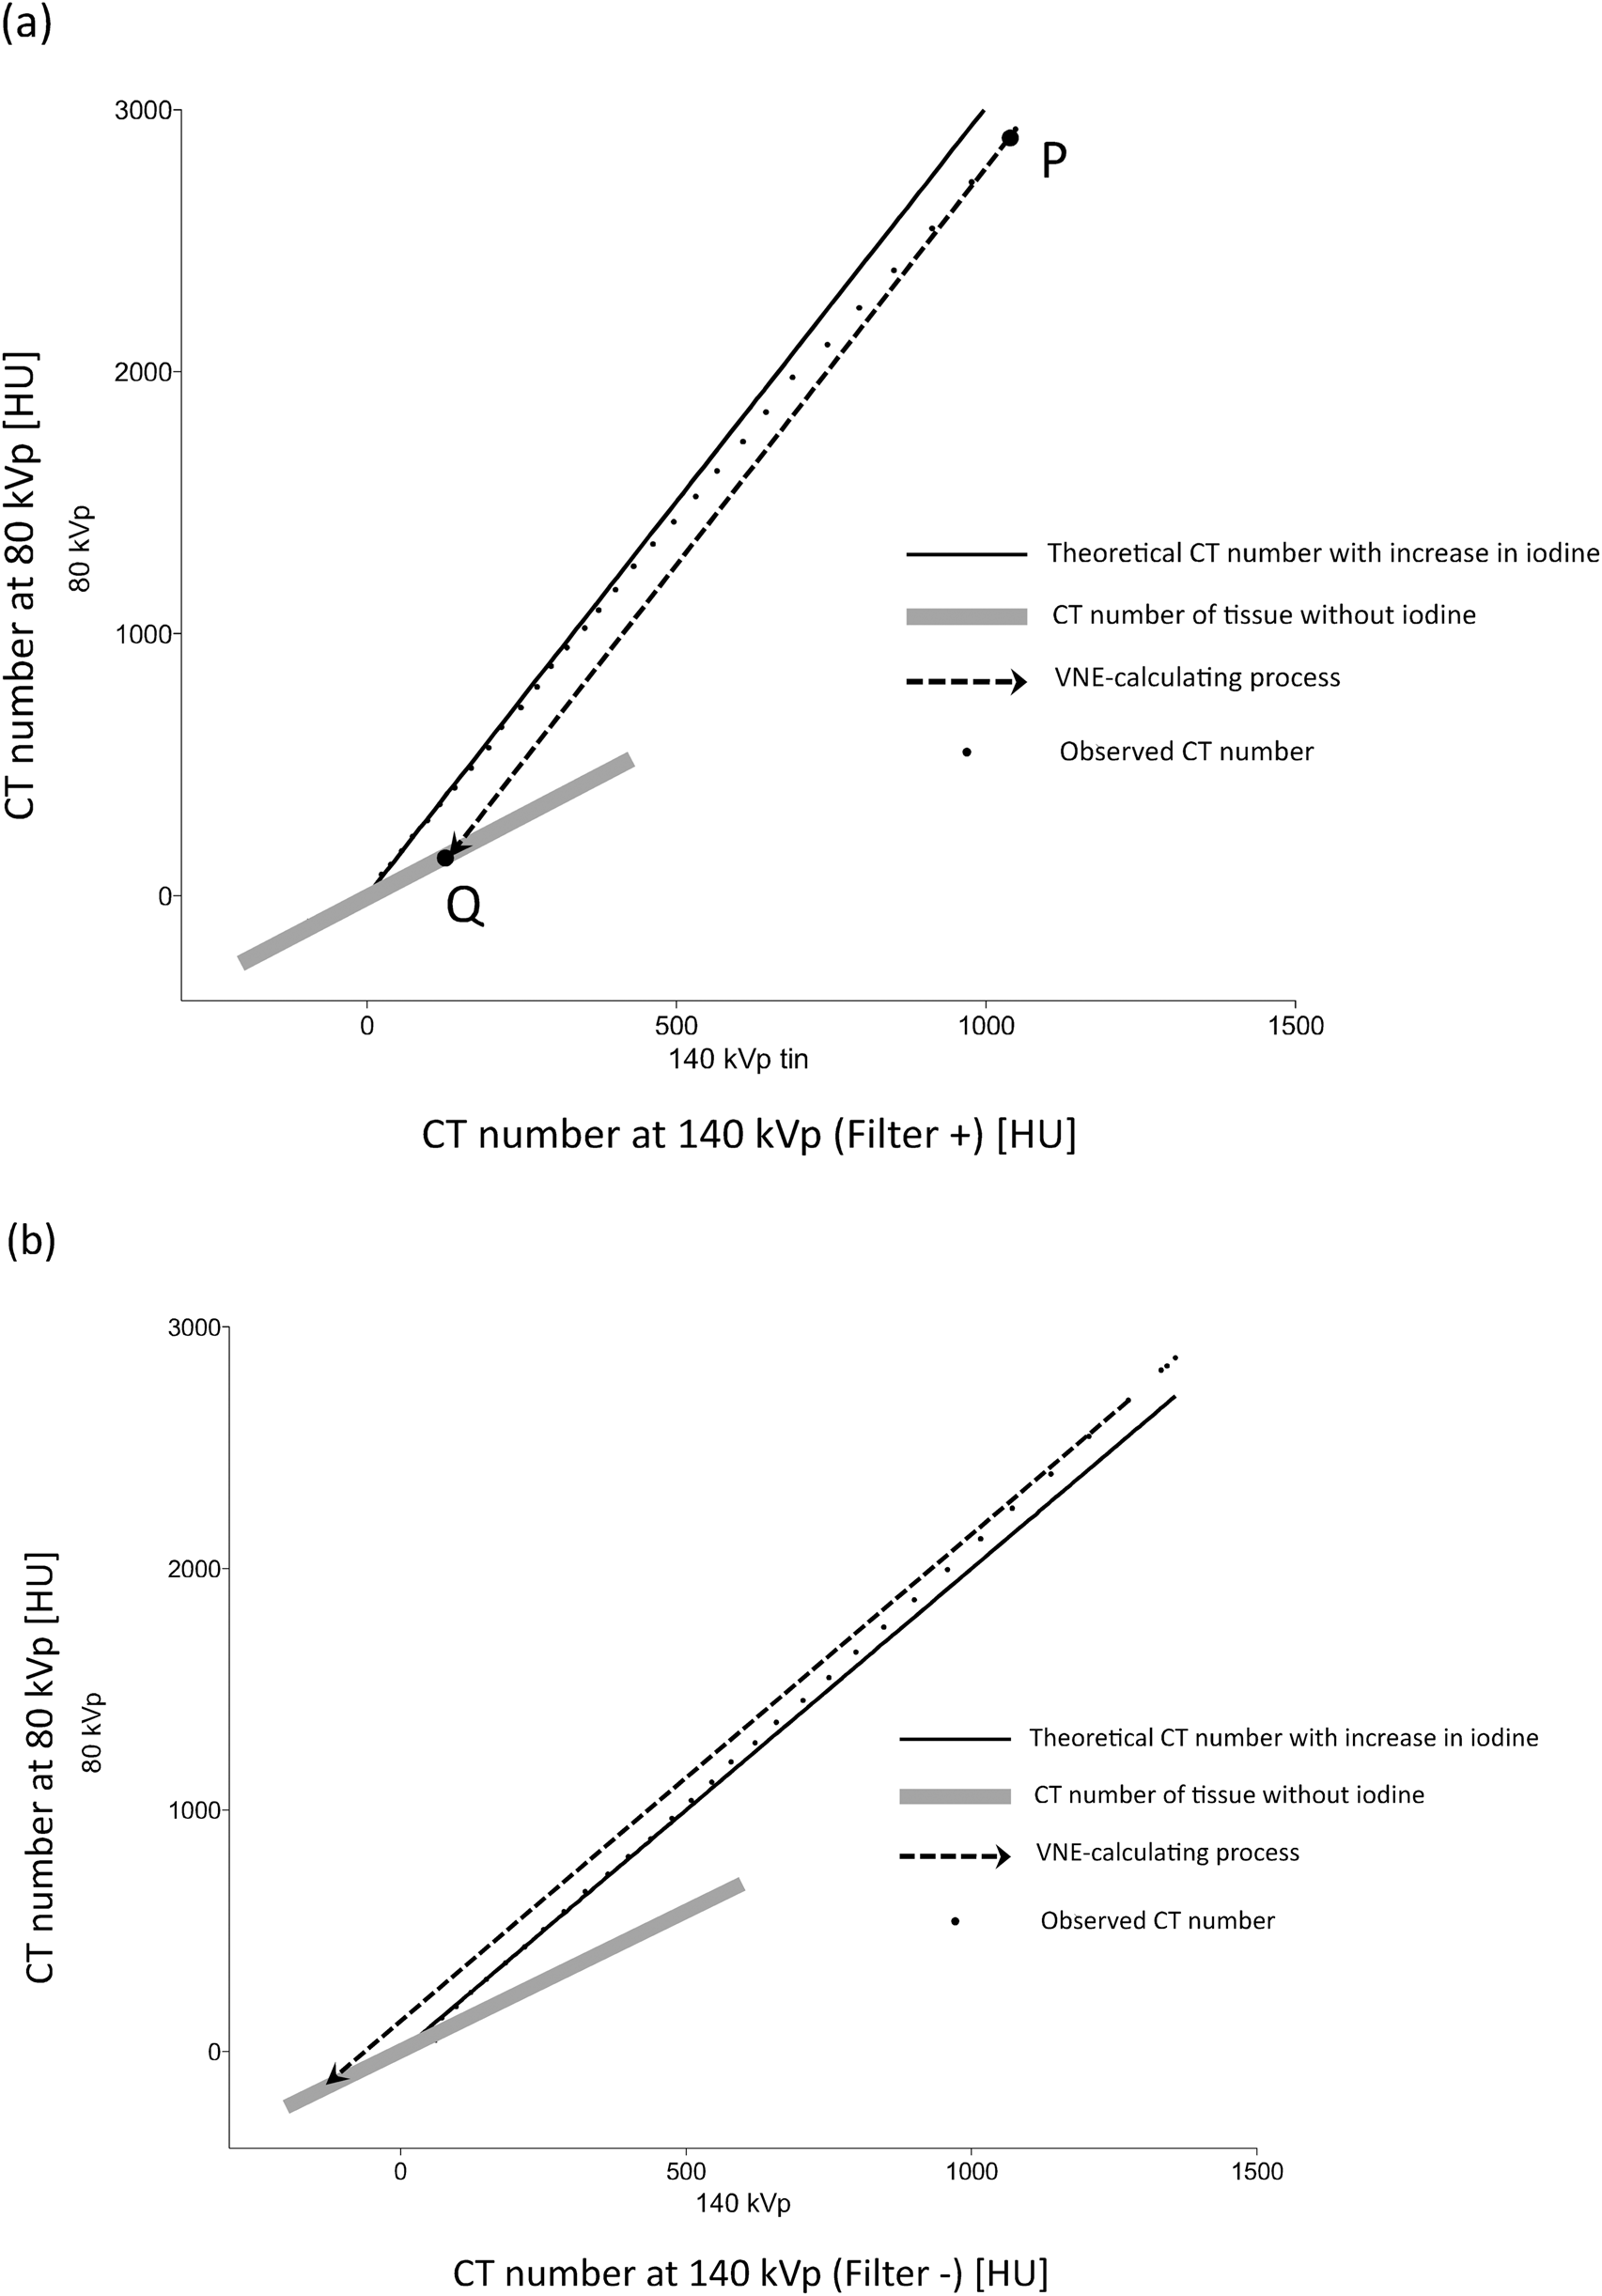
In the study using Phantom B, surrounding high-attenuation materials affected the efficiency of iodine removal on VNE images. In the central component surrounded by high-concentration iodine (100 and 200 mgI/cm3), inaccurate and insufficient iodine removal occurred, especially in a situation with low iodine concentrations (0 and 10 mgI/cm3) on the images scanned with no tin filter, but it seemed to be improved by applying the filter. In contrast, iodine removal was more accurate on images with iodine concentrations of 25 and 40 mgI/cm3 in the central component even in the absence of the tin filter. This was probably because the slope of the lines for iodine on the 80–140 kVp diagrams changed according to the iodine concentration in the surrounding components. With the scan using the tin filter, iodine removal was more accurate than without it at iodine concentrations of 0, 10, and 25 mgI/cm3. An iodine concentration of 25 mgI/cm3 is equivalent to 663 ± 2.2 HU at 120 kVp SE (Table 1) and is considered to be applicable to most contrast-enhanced organs. Thus, VNE images calculated by scan data using a tin filter might be reliable in most clinical settings, including intracranial and pelvic lesions surrounded by a thick bone structure or regions adjacent to artificial implantations.
The beam-hardening effect is considered one of the factors affecting the accuracy of material decomposition (12) as well as the original single-energy images (15). The results in this study using Phantom B indicate that the beam-hardening effect contributes to inaccurate iodine removal on VNE images, because it seemed to increase on images scanned without the tin filter, which should reduce low-energy components of 140 kVp X-ray spectra in advance. The absorption of the spectrum of low-energy photons by the surrounding high-density contrast material and the reduction of the total photon amount arriving at the target might cause miscalculation of its density. A similar phenomenon is observed on contrast-enhanced SE images, known as the nomination of “pseudo-enhancement”, considered to be caused by the beam-hardening effect (16). In contrast, on VNE images, these over-estimation errors were decreased effectively by the tin filter. This result implies that the tin filter would also have the potential to improve the quality of unenhanced CT images, especially for targets close to materials with high attenuation.
There are some limitations of our study. First, there is a possibility of under-estimation of the beam-hardening effect because the phantoms were uniform in size and shape and relatively small. Because the extent of the beam-hardening effect depends on the shape of the objects as well as their attenuation, unpredictable artifacts might appear in clinical cases that have more complex structures. For this reason, more sophisticated algorithms to improve accuracy are warranted for certain clinical settings. Second, in the experiment using Phantom B, iodine contrast material was used as a high-attenuation material surrounding the objects because it was easy to prepare a homogeneous high-density phantom within a simple-shaped model; therefore, the influence on material decomposition of other biological materials or artificial implants remains uncertain. Third, our experiment using Phantom B did not use lower iodine concentrations precisely; thus, the accuracy of VNE images at a lower range of attenuation remains strictly unclear; however, a similar result is expected because the extent of iodine removal was nearly proportional to iodine concentration in the surrounding area.
In conclusion, this experimental study demonstrated the accuracy of iodine removal on VNE images regardless of a tin filter in the range within clinically relevant concentrations and has potential for improving the influence of surrounding high-attenuating regions, probably by reducing the beam-hardening effect.