
Abstract
Background
Lung perfusion based on dynamic scanning cannot provide a quantitative assessment of the whole lung because of the limited coverage of the current computed tomography (CT) detector designs.
Purpose
To evaluate the feasibility of dynamic volume perfusion CT (VPCT) of the whole lung using a 128-slice CT for the quantitative assessment and visualization of pulmonary perfusion.
Material and Methods
Imaging was performed in a control group of 17 subjects who had no signs of disturbance of pulmonary function or diffuse lung disease, and 15 patients (five patients with acute pulmonary embolism and 10 with emphysema) who constituted the abnormal lung group. Dynamic VPCT was performed in all subjects, and pulmonary blood flow (PBF), pulmonary blood volume (PBV), and mean transit time (MTT) were calculated from dynamic contrast images with a coverage of 20.7 cm. Regional and volumetric PBF, PBV, and MTT were statistically evaluated and comparisons were made between the normal and abnormal lung groups.
Results
Regional PBF (94.2 ± 36.5, 161.8 ± 29.6, 185.7 ± 38.1 and 125.5 ± 46.1, 161.9 ± 31.4, 169.3 ± 51.7), PBV (6.7 ± 2.8, 10.9 ± 3.0, 12.9 ± 4.5 and 9.9 ± 4.6, 10.3 ± 2.9, 11.9 ± 4.5), and MTT (5.8 ± 2.4, 4.5 ± 1.3, 4.7 ± 2.1 and 5.6 ± 2.3, 4.3 ± 1.5, 4.9 ± 1.5) demonstrated significant differences in the gravitational and isogravitational directions in the normal lung group (P < 0.05). The PBF (154.2 ± 30.6 vs. 94.9 ± 15.9) and PBV (11.1 ± 4.0 vs. 6.6 ± 1.7) by dynamic VPCT showed significant differences between normal and abnormal lungs (P < 0.05), notwithstanding the four large lungs that had coverage > 20.7 cm.
Conclusion
Dynamic VPCT of the whole lung is feasible for the quantitative assessment of pulmonary perfusion by 128-slice CT, and may in future permit the evaluation of both morphological and functional features of the whole lung in a single examination.
Pulmonary perfusion imaging is an important clinical investigation, and the detection of changes in regional perfusion may be helpful in clinical diagnosis or in the evaluation of pulmonary function. Pulmonary perfusion imaging can indicate the hemodynamic and functional characteristics of an organ or tumor. One previous study demonstrated that computed tomography (CT) perfusion imaging findings were closely correlated with tumor angiogenesis, which provided a non-invasive method of quantitative assessment for blood flow patterns in addition to a useful diagnostic method for lung cancer (1). Dual-energy lung perfusion CT in children was used to evaluate regional lung perfusion with an acceptable radiation dose (2). Dynamic perfusion magnetic resonance imaging (MRI) has been proven to be valid for the assessment of the hemodynamic characteristics and progression of pulmonary hypertension (3).
Examining the perfusion of the pulmonary parenchyma may provide an assessment of the reduction in pulmonary blood flow that results from pulmonary embolism (PE) or emphysema (4–6). Nuclear medicine scintigraphy has been considered the gold standard for the assessment of pulmonary perfusion, but it has substantial limitations with respect to spatial and temporal resolution. MRI is a more promising technique owing to its high spatial resolution and the ability to detect lobar and segmental abnormalities of perfusion (7, 8). However, MRI of the pulmonary parenchyma has been hampered by the heterogeneous magnetic susceptibility of the lung (9). MR cannot provide an accurate assessment of the pulmonary parenchyma, and high-resolution computed tomography (HRCT) remains the investigation of choice for this. Therefore, any comparison of the morphological changes within the lung with areas of impaired pulmonary perfusion requires an additional technique.
In recent years, increasing attention has been focused on CT pulmonary perfusion. With dual-energy CT (DECT) systems that can acquire two spiral CT data-sets with different photon spectra simultaneously, DECT has the potential to map iodine distribution patterns as lung perfusion images (10–12). A new CT subtraction technique for perfusion imaging is used to evaluate the morphological and functional changes in the resulting color-coded images subtracting the plain CT data from the enhanced CT data (13, 14). As a result of the limited coverage of the current designs of CT detector, lung perfusion based on dynamic scanning can only provide quantitative studies in lung tumors or in regional pulmonary parenchyma (15, 16). With the rapid development of CT techniques, volume perfusion CT (VPCT) of a total organ has now become available (17). The introduction of a new 128-slice scanning technique enables dynamic perfusion imaging with its capability for adaptive spiral scanning. This is implemented by bidirectional table movements and a broad detector range, which results in the coverage of organs and tumors up to a coverage of 27 cm. It is now possible to provide a comprehensive assessment of the perfusion of the total pulmonary parenchyma. The purpose of this study was to evaluate the feasibility of a VPCT of the total lung for the quantitative assessment and visualization of pulmonary perfusion.
Material and Methods
Subjects
Dynamic CT scans were performed in 32 patients. The control group consisted of 17 subjects (13 men, 4 women; age range, 38–74 years; mean, 61 years) with a diagnosis of esophageal carcinoma but without signs of disturbances of pulmonary function or diffuse disease; they were considered to have normal lungs. The control subjects all had normal pulmonary function test results. Fifteen patients had esophageal cancer and abnormal lungs (12 men, 3 women; age range, 44–77 years; mean, 64 years), 10 of which had previously diagnosed emphysema and five had a suspected acute PE as a consequence of combined dyspnea and increased D-dimer levels. All diagnoses were proved by hematological tests, histology, pulmonary function tests, or an assessment of the clinical course. Dynamic CT scans and other examinations were performed within 2 weeks of each other. The study was approved by the Ethics Committee of our university. All patients gave informed consent prior to study entry.
Dynamic CT scanning
All examinations were performed using a 128-slice spiral CT scanner (Somatom Definition AS, Siemens Healthcare, Munich, Germany). This scan is implemented by special table movements, termed bidirectional or pendulum table movements. This enables high resolution times and large coverage. A dynamic CT protocol was established with the following parameters: tube voltage, 80 kV; tube current, 50 mA; rotation time, 0.3 s; acq. 32 × 1.2 mm, time resolution, 2 s; coverage of 20.7 cm; and reconstructed slice thickness, 3 mm. As the first-pass time for pulmonary parenchyma is no more than 30 s by first-pass and recirculation curves (18), the protocol for dynamic pulmonary perfusion imaging consisted of a total of 15 continuous volume acquisitions, with one volume acquisition performed in 2 s. Those patients who could not hold their breath for 30 s were asked to breathe shallowly after their maximal breath-hold time. Where possible, 15 continuous volume acquisitions were performed during a breath-hold at end-inspiration. Prior to the dynamic CT volume acquisition, an unenhanced acquisition was performed with 120 kV and 110 mA to ensure that the lung parenchyma of interest would be covered by the 20.7 cm imaging field and to assess any morphological changes within the lung.
All examinations were performed after the intravenous infusion of 60 mL iodine contrast medium (iopromide injection 370, Bayer Schering Pharma, Guangzhou, China) at a flow rate of 6 mL/s, followed by a 40 mL saline flush given at the same flow rate with a power injector (Medrad Stellant, Pittsburgh, PA, USA).
Imaging postprocessing and data acquisition
Image data-sets were reconstructed with a 3 mm slice thickness and 3 mm increment, which resulted in 69 images per series and a total of 1035 dynamic images for the entire examination. The postprocessing of pulmonary perfusion started on the SIEMENS system software; then, all images were transferred to a postprocessing workstation (Volume Wizard, Siemens Healthcare, Munich, Germany) to complete the assessment of pulmonary perfusion. This required four steps:
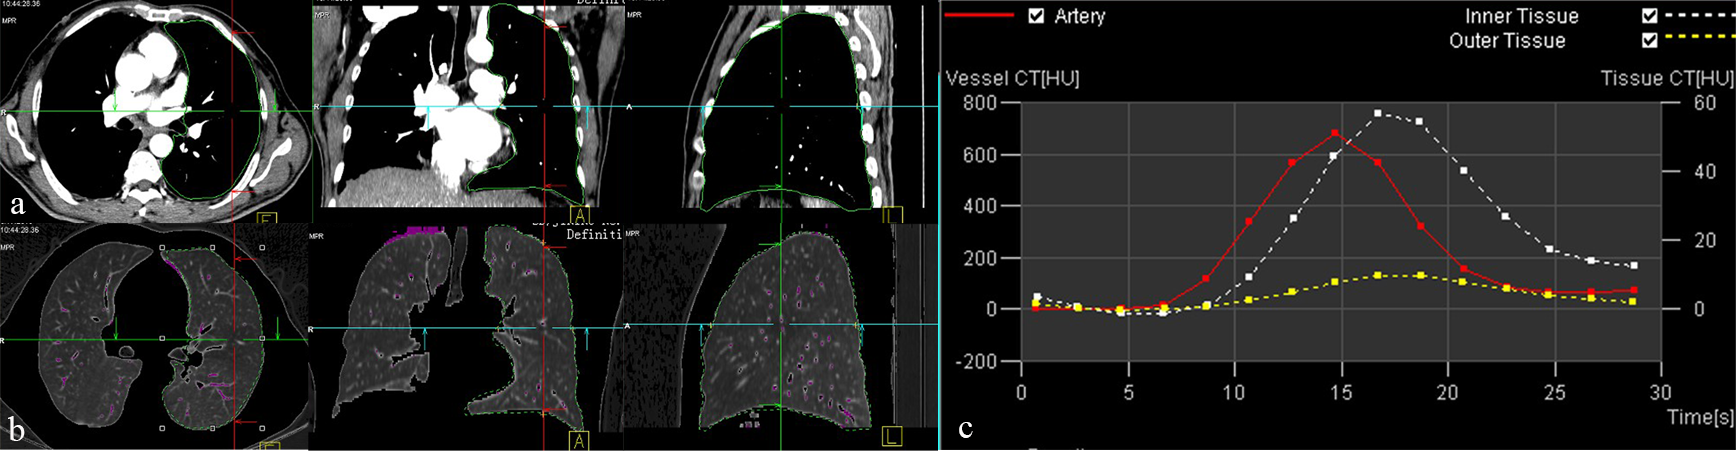
1. Motion correction: Images from the entire series were corrected for motion and distortion artifacts and the quality of the enhancement curves were upgraded so that reliable calculations of perfusion parameters would be possible. 2. Segmentation: A threshold-based contour finder was used for segmentation, as lung tissue (low HU) was generally enclosed by high HU areas (pleura, chest wall). A typical value for the segmentation threshold was –300 HU (14). The volume of the lung was manually calculated using three-dimensional (3D) images. We excluded the pulmonary lobes with consolidation of the pulmonary tissue as the examination was focused onto the lung tissue of interest (Fig. 1a). 3. Vessel: The pulmonary artery was defined as the input artery in order to evaluate the perfusion of the pulmonary parenchyma. Major vascular structures were removed by HU range selection to reduce their effects on pulmonary perfusion (Fig. 1b). 4. Calculation: The VPCT parameters for the total lung (pulmonary blood flow, PBF; pulmonary blood volume, PBV; mean transit time, MTT), time-density curves of the pulmonary artery and the volume of lung tissue (Fig. 1c) were obtained. Examples of (a) segmentation, (b) major vascular cutting, and (c) time density curves (pulmonary artery, red; inner lung tissue, white; outer lung tissues, yellow)
Measurements of regional perfusion were performed to assess the gravitational (ventral to dorsal) and isogravitational (upper to lower) directional changes in the normal lung group. Three contiguous images were obtained through the ventral, middle, and dorsal areas of the lungs, and through the upper, middle, and lower lungs. The ventral image was obtained in the anterior mediastinum (in front of the aortic arch), the middle image at the carina and the dorsal image in the posterior mediastinum (behind the abdominal aorta), and all of these were in the coronal plane. The upper image was obtained from above the aortic arch, the middle was at the level of the carina, and the lower was obtained from approximately 2–3 cm above the top of the diaphragm, all in the axial plane (19). The perfusion parameters (PBF, PBV, and MTT) from each region were obtained from a manually taken outline.
The CT dose index-volume (CTDIvol) and the dose length product (DLP) of the dynamic and routine chest images listed on the patient summary sheet were recorded. Effective dose (ED) was calculated from the DLP multiplied by a factor of 0.017 (20).
Statistical analysis
Values are presented as the mean ± standard deviation (SD). To evaluate the regional differences in PBF, PBV, and MTT in the gravitational and isogravitational directions, one-way analysis of variance (ANOVA) followed by least significant difference (LSD) tests were performed. The differences in the VPCT parameters between the normal and abnormal lungs were evaluated with an independent-sample t-test. For all tests, P < 0.05 was considered to be statistically significant. All analyses were performed using SPSS 11.5 software (SPSS Inc., Chicago, IL, USA).
Results
All VPCT examinations were successfully completed and no adverse effects were observed. Embolus was detected in the pulmonary artery of all five patients with suspected PE. In the control group, 22 lungs (13 left and 9 right) were imaged and compared to 19 lungs in the abnormal lung group (8 left and 11 right). However, the coverage of 20.7 cm could not completely cover the entire lung in patients with larger lungs (n = 4 lungs). Representative PBF, PBV, and MTT maps from a patient with normal lung are shown in Fig. 2. Perfusion maps of the lung parenchyma in the axial, sagittal, and coronal planes showed a heterogeneous appearance.
Images from a 47-year-old male patient with esophageal carcinoma and normal pulmonary parenchyma. Image maps of (a) pulmonary blood flow (PBF), (b) pulmonary blood volume (PBV), (c) mean transit time (MTT), and (d) chest CT in axial and coronal plane (120 kV and 110 mA). The perfusion maps of the lung parenchyma show a heterogeneous appearance in the gravitational (ventral to dorsal) and isogravitational (upper to lower) directions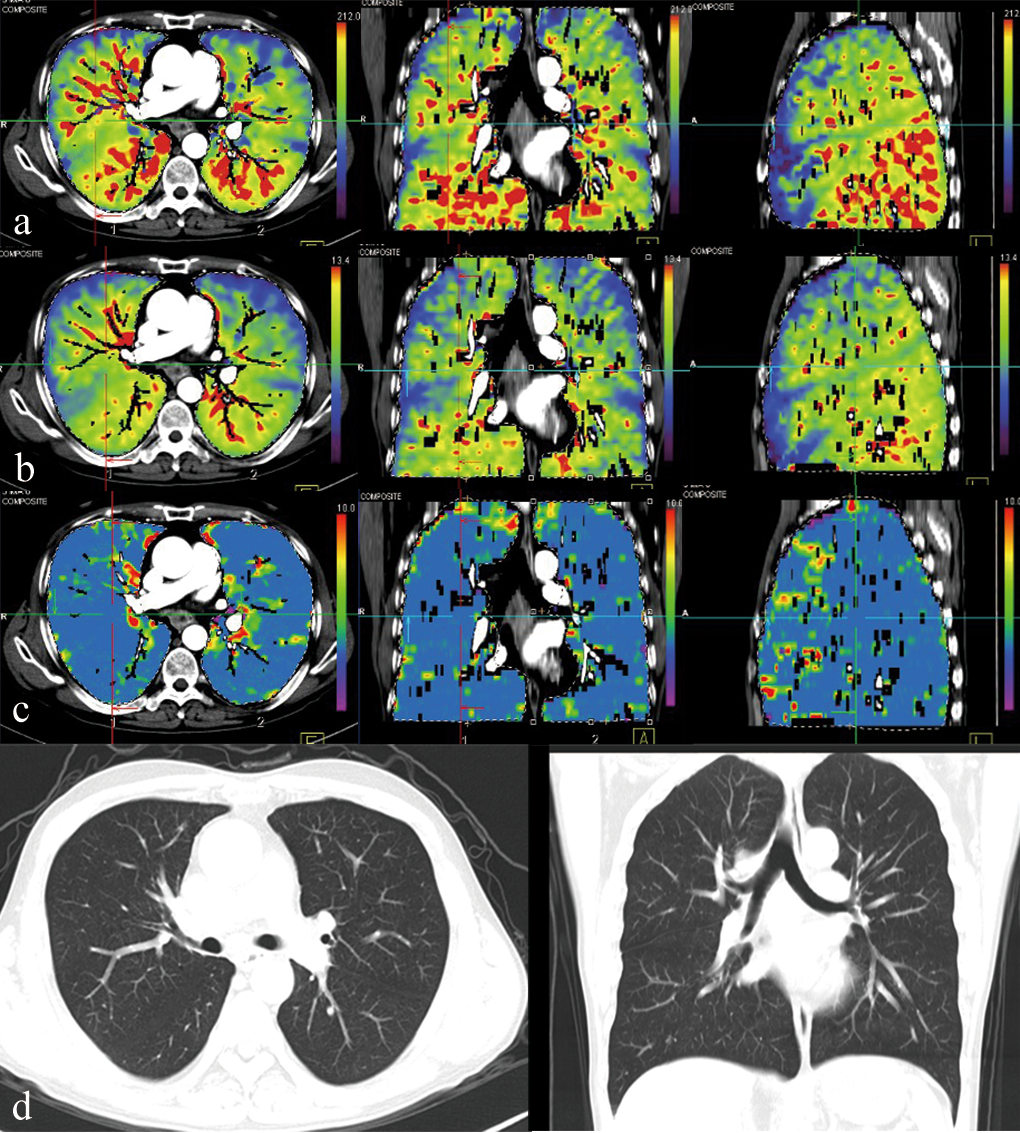
The regional differences in PBF in gravitational and isogravitational directions in control subjects
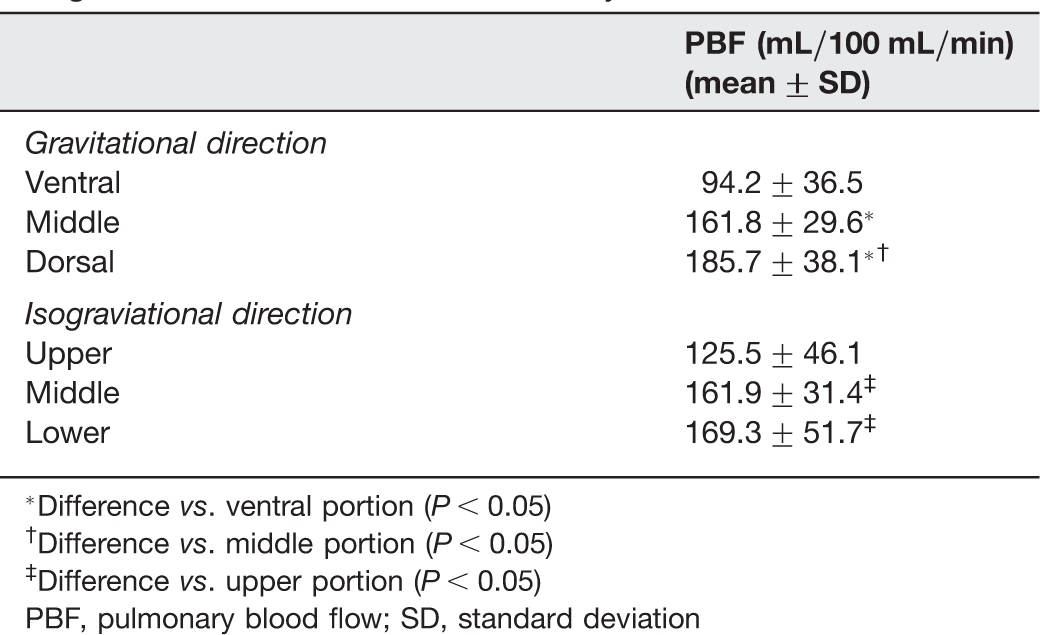
*Difference vs. ventral portion (P < 0.05)
†Difference vs. middle portion (P < 0.05)
‡Difference vs. upper portion (P < 0.05)
PBF, pulmonary blood flow; SD, standard deviation
The regional differences in PBV in gravitational and isogravitational directions in control subjects
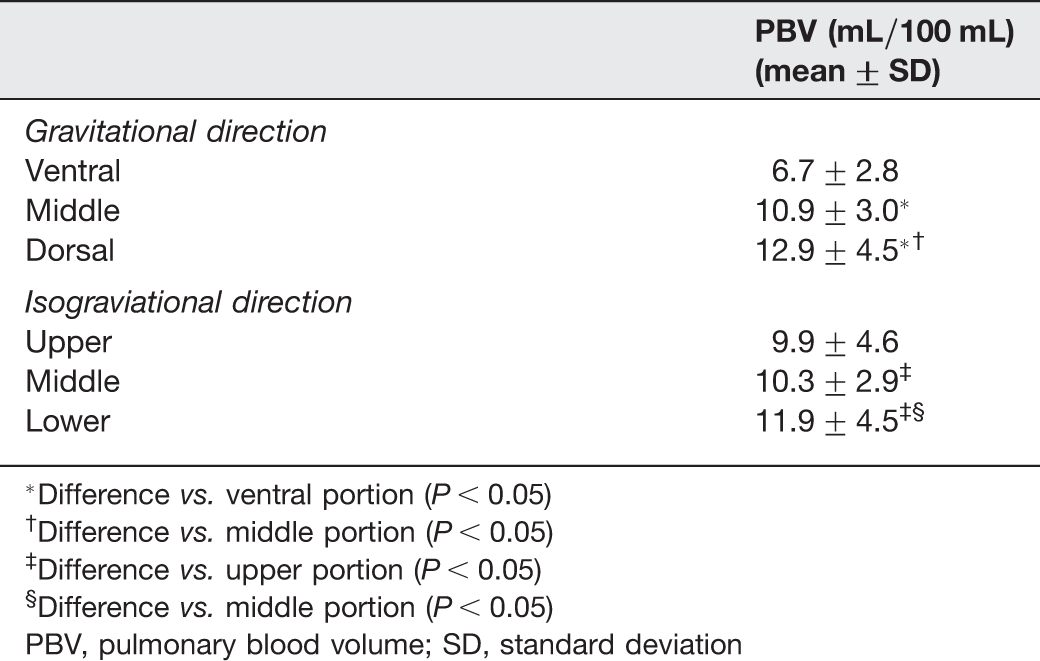
*Difference vs. ventral portion (P < 0.05)
†Difference vs. middle portion (P < 0.05)
‡Difference vs. upper portion (P < 0.05)
§Difference vs. middle portion (P < 0.05)
PBV, pulmonary blood volume; SD, standard deviation
The regional differences in MTT in gravitational and isogravitational directions in control subjects
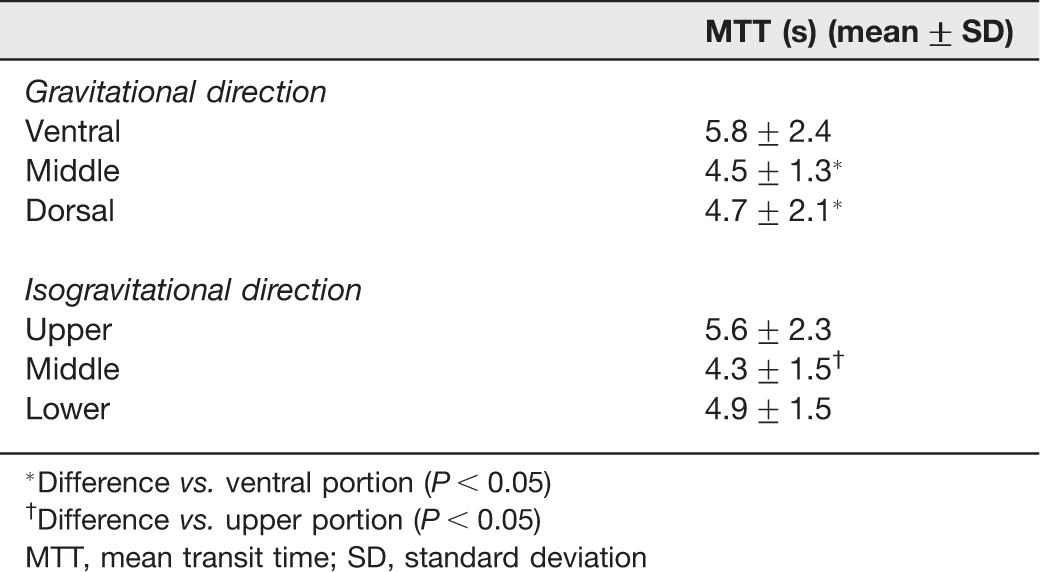
*Difference vs. ventral portion (P < 0.05)
†Difference vs. upper portion (P < 0.05)
MTT, mean transit time; SD, standard deviation
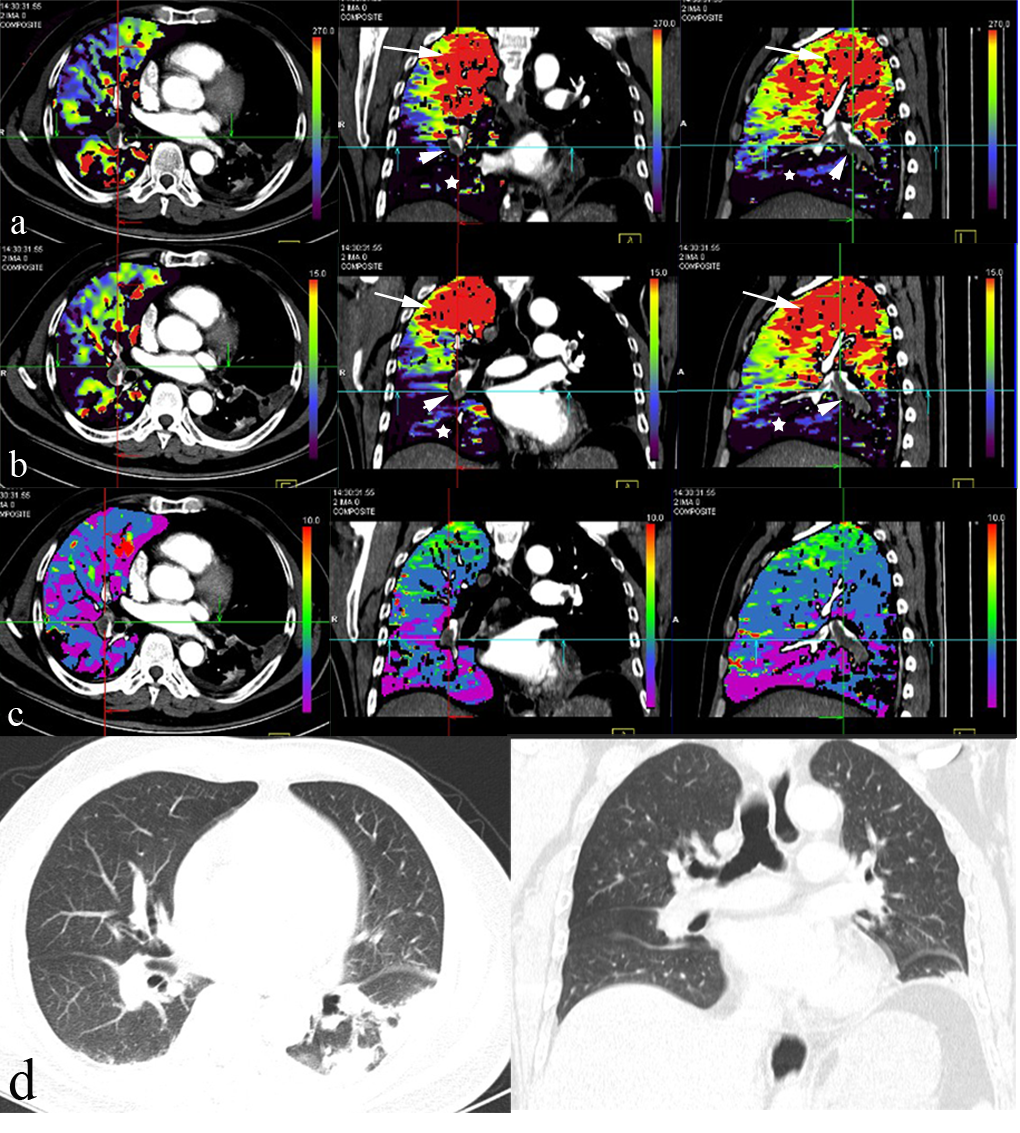
PBF, PBV, and MTT maps of representative cases with PE and emphysema are shown in Figs. 3 and 4. Failure of perfusion was observed in affected segments, and markedly or slightly increased perfusion was observed in areas that were not affected by clots or emphysema.
Images from a 59-year-old male patient with esophageal carcinoma and severe emphysema. Image maps of (a) pulmonary flow (PBF) showing reduced PBF in the upper lung and slightly increased PBF in unaffected areas, (b) pulmonary volume (PBV) showing reduced PBV in the upper lung and slightly increased PBV in unaffected areas, (c) MTT showing a slightly heterogeneous decrease in mean transit time (MTT) in the upper lung, and (d) chest CT in axial and coronal planes showing panlobular emphysema in the upper lung (120 kV and 110 mA) Images from a 53-year-old female patient with acute pulmonary embolism. Image maps of (a) pulmonary flow (PBF) showing reduced PBF in the lower lung (star), markedly increased PBF in the upper unaffected lung due to the enhancement of collateral flow from the bronchial artery to the pulmonary artery (long arrow), and multiple clots (short arrow) in the right lower pulmonary artery, (b) pulmonary volume (PBV) showing reduced PBV in the lower lung (star), and markedly increased PBV in the upper unaffected lung (long arrow), (c) MTT showing a slightly heterogeneous decrease in the lower lung, and (d) chest CT in axial and coronal planes showing increased density in the right lower lung (120 kV and 110 mA)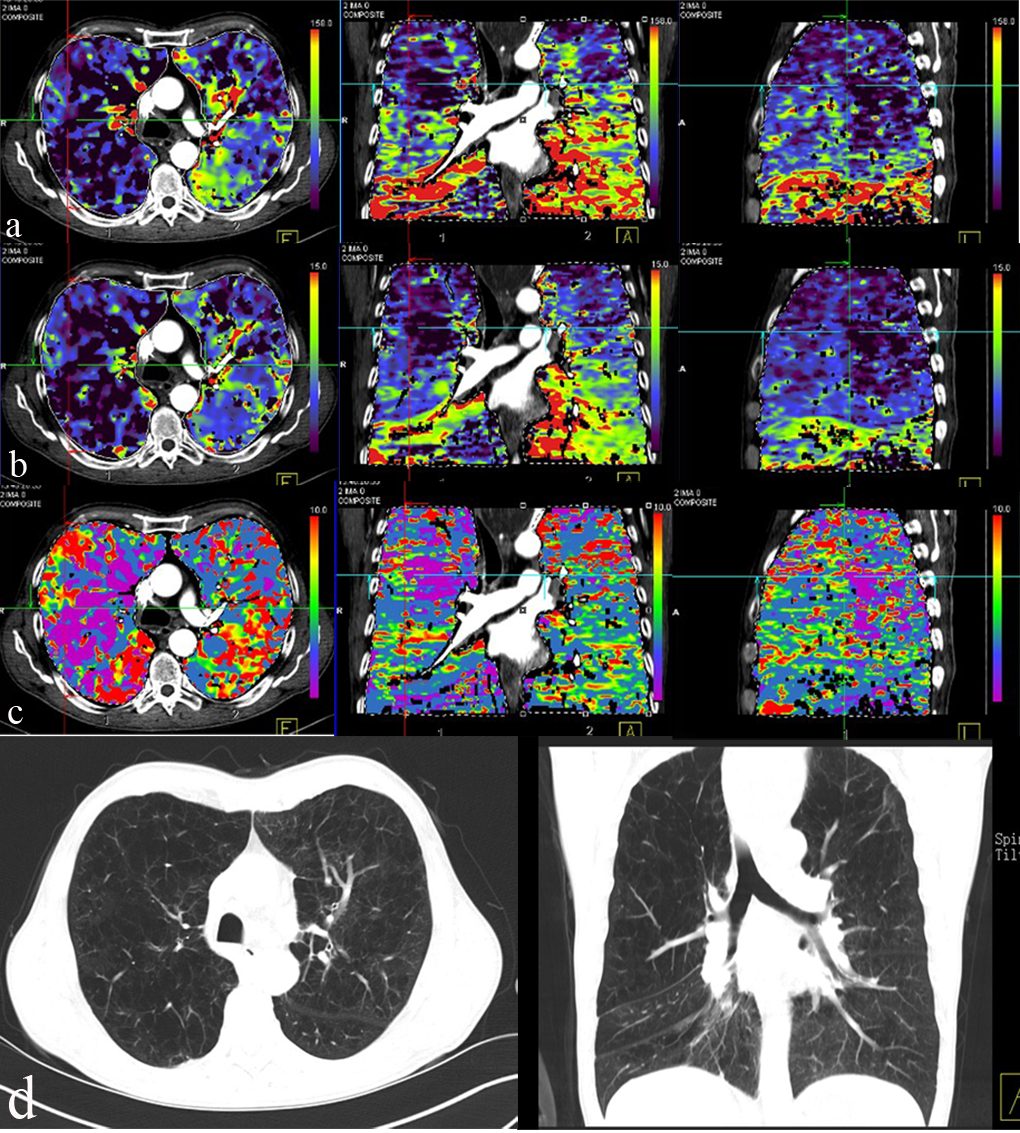
VPCT parameters of normal and abnormal lungs
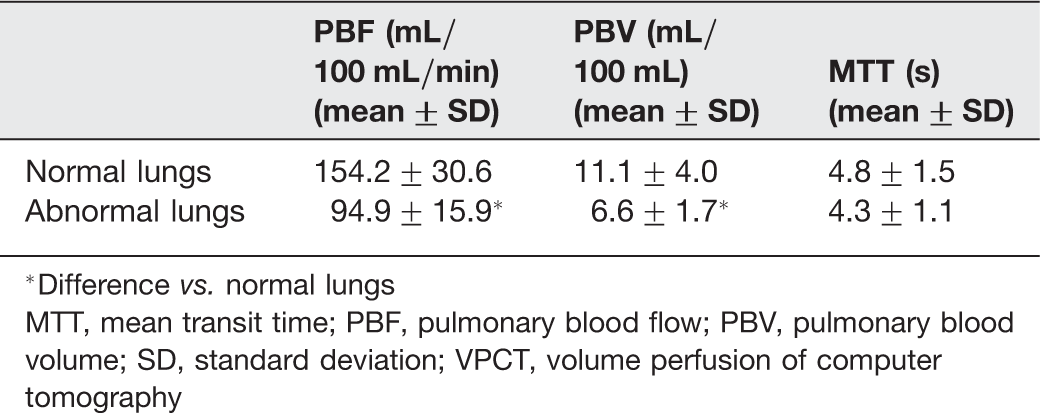
*Difference vs. normal lungs
MTT, mean transit time; PBF, pulmonary blood flow; PBV, pulmonary blood volume; SD, standard deviation; VPCT, volume perfusion of computer tomography
The ED for the entire CT examination was 10.1 ± 0.5 mSv (DLP, 593.8 ± 29.4 mGy × cm; CTDIvol, 24.04 ± 1.29 mGy), which was made up of 6.02 mSv (DLP, 354 mGy × cm; CTDIvol, 16.65 mGy) for the dynamic CT and 4.1 ± 0.5 mSv (DLP, 239.8 ± 29.4 mGy × cm; CTDIvol, 7.39 ± 1.29 mGy) for the routine chest CT.
Discussion
The assessment of pulmonary parenchyma perfusion parameters have been variously reported by MR, SPECT, or CT (6, 7, 15, 21, 22). Standard dynamic CT cannot provide a comprehensive assessment of pulmonary perfusion due to the limited coverage of the current designs of CT detector. Various methods are available to assess pulmonary perfusion using whole pulmonary parenchyma measurements, such as dual energy CT (DECT)-based selective iodine uptake measurements and the CT imaging postprocessing silhouette technique. DECT perfusion maps are generated based on the iodine distribution patterns at one time point. VPCT measures temporal changes in tissue density after intravenous contrast injection. Thus, density measurements include contrast material contained in the intra- as well as extravascular space. This is the dynamic perfusion study by different time point, as distinguished from DECT. This present study aimed to assess the pulmonary perfusion of the entire pulmonary parenchyma using ordinary dynamic scanning with a 128-slice spiral CT that incorporated a pendulum moving-bed technique. Our results demonstrated the feasibility of VPCT for the quantitative visualization and assessment of pulmonary perfusion of the whole pulmonary parenchyma. This offers an alternative way of investigating the whole lung perfusion. VPCT facilitates a global analysis of physiological and pathological characterization of diffuse lung diseases or mass lesions.
The variation and gradients of PBF and PBV in the isogravitational and gravitational directions were observed in normal lungs. These results were compatible with those demonstrated using MR (7, 23). Many factors, including the physiological and pathological characteristics of the subjects, may affect perfusion imaging. In addition, there has been disagreement about perfusion parameters that have been estimated by different measurement techniques (24). Although our pulmonary perfusion parameters (PBF and PBV) showed some differences compared with past MR reports (7), the same trends in the gradients in the isogravitational and gravitational directions were observed.
In our results, the MTT was shorter in the middle and dorsal regions of the lung compared with the ventral region of the lung. In addition, the MTT was shorter in the middle region of the lung compared with the upper region. These results are not consistent with the results for the PBF and PBV. Furthermore, these results were not in accordance with the findings of past reports. This may be have been a result of the volume calculation for the MTT from three contiguous slices, as the pulmonary perfusion parameters vary between the peripheral and central regions of the lung, in addition to in the isogravitational and gravitational directions. In addition, the appearance of the MTT on the perfusion maps was less heterogeneous than for PBF and PBV. In the past, the main limitation of dynamic CT scanning in this area was the coverage of the detector (current systems from various manufacturers cover 19.2–40 mm), even though the 320-slice CT covers an anatomical region of 16 cm (17). This new 128-slice spiral CT used bidirectional table movements and a broad detector range that covered a region of at least 20.7 cm. Dynamic VPCT can therefore now provide a comprehensive assessment of perfusion for the total pulmonary parenchyma, so that the physiological and pathological features of the whole organ can be evaluated.
Some preliminary results of pulmonary perfusion abnormalities in patients with PE and emphysema have been demonstrated. The PBF and PBV of the volume perfusion for the whole lung in patients with PE and emphysema were significantly lower than those found in normal lungs. However, the MTT of the volume perfusion for the whole lung showed no significant difference compared with the MTT of normal lungs. This result may be explained by the fact that the MTT of the whole lung perfusion was slightly heterogeneous and that our study group was composed of a relatively small number of mixed patients with varying degrees of PE and emphysema. In addition, the visualization of pulmonary perfusion abnormalities in patients with PE and emphysema demonstrated by this technique is similar to that shown by DECT (10, 12). The appearances of reduced perfusion in the affected segments, and markedly or slightly increased perfusion in unaffected areas were observed. The reduction in the functional area of the pulmonary vascular bed usually accompanied these affected segments. In order to maintain patient respiratory and cardiac functions, the lung receives collateral flow from the bronchial artery in the systemic circulation to the pulmonary artery (7).
One important consideration in CT imaging is the radiation dose, which increases with the number of acquisitions. To minimize the radiation dose, our protocol used 80 kV and 50 mA for the perfusion measurements, which gave a total dose (DLP, 593.8 mGy × cm) that was within the range of radiation dose for chest and lower than those for whole pancreas perfusion studies (17, 25). The radiation dose of the dynamic CT scan was 6.02 mSv (DLP, 354 mGy × cm) and the ED for the entire CT examination was 10.1 ± 0.5 mSv. Although we used the best possible study protocol, the radiation dose was higher than that of a conventional chest CT scan. However, this disadvantage could be offset by providing a method for assessing whole lung morphology and performing functional investigations simultaneously. Due to this relatively low kV and mA, the dynamic images of the lung were affected to varying degrees by image noise. The calculation of perfusion was based mainly on the density change over time within a particular region of interest, so the volume perfusion data were only slightly affected by image noise. Nevertheless, the reconstructed slice width used was 3 mm in order to reduce image noise.
There are some limitations of the present study. First, although the coverage of the dynamic CT is approximately 21 cm, the field of view for the lung perfusion scan could not cover the whole lung in larger patients or those with severe emphysema. Our CT system can provide coverage of 27 cm, but the CT protocols with larger coverage regions could not be used due to their lower time resolutions. A previous study showed that decreasing temporal resolution resulted in inaccurate perfusion values. The area under the time-enhancement curve (AUC) for a 2 s temporal resolution was approximately the same as for the 0.5 and 1 s temporal resolutions. For the temporal resolution of 4 s, a reduction in the AUC would result in significant errors in the calculation of perfusion values (26). Therefore, in our study, we used the temporal resolution of 2 s. Although this is lower than that used in MR, further improvements in scanning may occur in the future with the development of new CT techniques.
Second, the measurement of lung perfusion is complex and affected by many factors, which include cardiac output, body size and the flow rate of the contrast medium. In some reports, a flow rate of the contrast medium that was individualized for each patient has been used to minimize the effects of cardiac output and body size (15, 27). The calculation of perfusion is based mainly on density change over time within a particular region of interest. The subject's cardiac output is associated with variations in the contrast medium arrival time. Differences in these values can lead to variations in the time to peak arterial enhancement, which can affect the quantitative assessment of perfusion imaging. Increasing the concentration of contrast improves the peak opacification of tissue, which suggests that evaluating the CT perfusion is better performed with the highest available concentration of contrast agent (28). The peaks of enhancement increase in magnitude and occur earlier, and the duration of high-magnitude enhancement decreases when the injection rate and the volume of contrast media are increased (29). Based on these previous studies, we used a high concentration of iodine (370 mgI/mL) and injection rate (6 mL/s) to obtain complete first-pass times for the pulmonary parenchyma perfusion studies. Our expectation was that these effects on lung perfusion could be minimized by the relatively high flow rates and concentrations of contrast material. Streak artifacts from undiluted contrast agent around the superior vena cava in earlier phases of VPCT are likely to affect measurements of upper lung perfusion, and the right upper lung in particular. In order to minimize their potential influence on perfusion parameters, we measured the left lung as often as possible.
Third, only a relatively small patient group, with two different diagnoses, was used for this study, which limited any general conclusions that could be drawn about perfusion abnormalities and these were not compared with the lung CT morphological features or nuclear techniques. Therefore, a further study will be required to demonstrate the capabilities of dynamic VPCT in combination with morphological features or nuclear medicine techniques.
In conclusion, the use of dynamic CT is feasible in the quantification of the volume perfusion of the whole lung and in the visualization of pulmonary perfusion in both normal and abnormal lungs. Dynamic VPCT may offer an opportunity to evaluate the morphological and functional features of the whole lung in a single examination.