
Abstract
Background
Ectopic pancreas can frequently be mistaken for other submucosal masses. Ectopic pancreas may follow the signal intensity of mother pancreas on various magnetic resonance (MR) sequences, which might be helpful for differentiation between ectopic pancreas and other submucosal tumors in upper gastrointestinal (UGI) tract.
Purpose
To evaluate the value of MR imaging (MRI) in differentiating ectopic pancreases from submucosal tumors in UGI tract.
Material and Methods
Fifteen patients with ectopic pancreas and 26 patients with UGI submucosal tumors were included. All patients underwent abdominal MRI with diffusion-weighted imaging (DWI) and gadoxetic acid-enhanced MRI. Qualitative (location, contour, growth pattern, lesion border, and presence of intralesional cystic portion and duct-like structure) and quantitative (long diameter [LD], short diameter [SD], LD/SD ratio, signal intensities and apparent diffusion coefficients [ADC], and signal intensity – and ADC ratios of UGI submucosal lesions to pancreas) parameters were compared between ectopic pancreases and UGI submucosal tumors using Fisher’s exact test, the Mann-Whitney U test, and receiver-operating characteristic (ROC) analysis.
Results
Duodenum was the most common location for ectopic pancreas (12/15, 79.9%), and the gastric body for UGI submucosal tumors (15/26, 57.7%) (P = 0.005). Round shape was an imaging feature more common in UGI submucosal tumors (12/26, 46.2%) than in ectopic pancreas (1/15, 6.7%; P = 0.021). On all of the various pulse sequences of MR images, ectopic pancreas showed isointensity comparable to that of pancreas more frequently than did sequences of UGI submucosal tumors (P < 0.01).The means (0.95 ± 0.09, 0.99 ± 0.06, 1.07 ± 0.08) of the signal intensity ratio of ectopic pancreas to pancreas on fat-suppressed unenhanced T1-weighted, arterial, and portal phase images were significantly higher than those (0.60 ± 0.09, 0.62 ± 0.28, 0.86 ± 0.27) of UGI submucosal tumors (P < 0.05). In contrast, the means (1.05 ± 0.12, 0.93 ± 0.18) of the signal intensity ratios of ectopic pancreas on T2-weighted images and DW images (b = 800 s/mm2) were significantly lower than those (1.82 ± 0.39, 2.35 ± 0.94) of UGI submucosal tumors (P < 0.001). On ROC analysis, if absolute value of difference between 1.0 and signal intensity ratio of submucosal lesions to the pancreas on T1-weighted images is <0.21, the sensitivity and specificity reach 100.0% for diagnosis ectopic pancreas from submucosal tumors.
Conclusion
Abdominal MRI with DWI can be a valuable tool for differentiating ectopic pancreases from UGI submucosal tumors.
Introduction
Ectopic pancreas, also called heterotopic or aberrant pancreas, is defined as pancreatic tissue that lacks anatomic or vascular continuity with the normal pancreas and is abnormally located (1–3). Ectopic pancreas is the second most common gastric submucosal lesion after mesenchymal tumors (3–5). In 90% of cases it is found in the upper gastrointestinal (UGI) tract adjacent to the pancreas, especially in the stomach, duodenum, or proximal part of the jejunum. Manifesting as a submucosal mass in the UGI tract, ectopic pancreas is often misinterpreted as a mesenchymal tumor such as gastrointestinal stromal tumor (GIST), due to non-specific computed tomography (CT) imaging findings (6,7). Histopathologic diagnosis of ectopic pancreas is usually difficult when tissue specimens are obtained using standard endoscopic biopsy forceps; however, surgery or endoscopic resection is usually unnecessary for asymptomatic patients (8).
Ectopic pancreas is a congenital disorder, and the elements of pancreas parenchyma are usually present (6). Through an abundant of proteins and manganese, the pancreas is one of the organs in the abdomen with the highest signal intensities on fat suppressed T1-weighted images (9) and in this respect ectopic pancreas may show hyperintensity on fat-suppressed T1-weighted images. In contrast, GISTs, the most common UGI submucosal tumors, typically have a hypointense solid portion on fat-suppressed T1-weighted images (10), as do other mesenchymal tumors such as Schwannomas and leiomyomas (11,12). We therefore hypothesized that the difference in signal intensity between ectopic pancreas and other UGI tract submucosal tumors will appear on other magnetic resonance (MR) sequences in addition to the fat-suppressed T1-weighted images. Diffusion-weighted imaging (DWI) with the apparent diffusion coefficient (ADC) map may also prove useful in distinguishing between ectopic pancreas and UGI tract submucosal tumors.
The purpose of this study was to evaluate the value of MR imaging (MRI) in differentiating ectopic pancreases from submucosal tumors in UGI tract.
Material and Methods
Patients
Our ethics committee approved this retrospective study with waiver of informed consent. We searched our radiologic abdominal imaging data base between January 2005 and April 2012 by using the following search terms: “gastric or stomach”, “duodenal or duodenum”, “submucosal or subepithelial”, “ectopic or heterotopic pancreas”, “leiomyoma”, “gastrointestinal stromal tumor or GIST”, “Schwannoma”, and “mesenchymal tumor”. Of the 579 patients found, 55 patients underwent DWI and gadoxetic acid-enhanced MRI at our hospital. Of these 55 patients, 29 underwent surgery for UGI submucosal lesions and pathology revealed 19 GISTs, three schwannomas, two neuroendocrine tumors, one leiomyoma, one hemangioma, and three ectopic pancreases. Of the remaining 26 patients, 12 patients underwent regular follow-up for liver cirrhosis (n = 7) or abdominal malignancy (n = 5; two gastric cancers, and one each of colon cancer, hepatocellular carcinoma, and pancreas tail cancer) after surgery using abdominal CT or MRI over 37–68 months (mean, 42.6 months). In the follow-up studies of these 12 patients, submucosal lesions at the duodenum or jejunum which had similar attenuation and signal intensity to pancreas on pre- and postcontrast dynamic CT and MRI and showed no significant change over 3 years were detected and diagnosed as ectopic pancreas. The other 14 of the 26 patients were followed up for <2 years by abdominal CT or MRI and were excluded from our study due to insufficient follow-up. Other exclusion criteria were diseases of mother pancreases including acute and chronic pancreatitis, and nearly cystic submucosal lesion. However, no patients were excluded due to these criteria. The final study group (Fig. 1) included 26 patients with UGI submucosal tumors (19 GISTs, three schwannoma, two neuroendocrine tumor, and one each of leiomyoma and hemangioma) of mean age 56.8 ± 13.4 years (range, 30–83 years) among whom were 13 men (mean age, 59.5 ± 12.7; range, 37–83 years), and 13 women (mean age, 54.2 ± 13.9; range, 30–75 years); and 15 patients with ectopic pancreases with mean age 51.5 years ± 11.4 (range, 35–73 years) among whom were 10 men (mean age, 51.2 ± 11.2 years; range 35–73 years), and five women (mean age, 52.2 ± 10.3 years; range, 39–62 years).
Flow chart of the study population.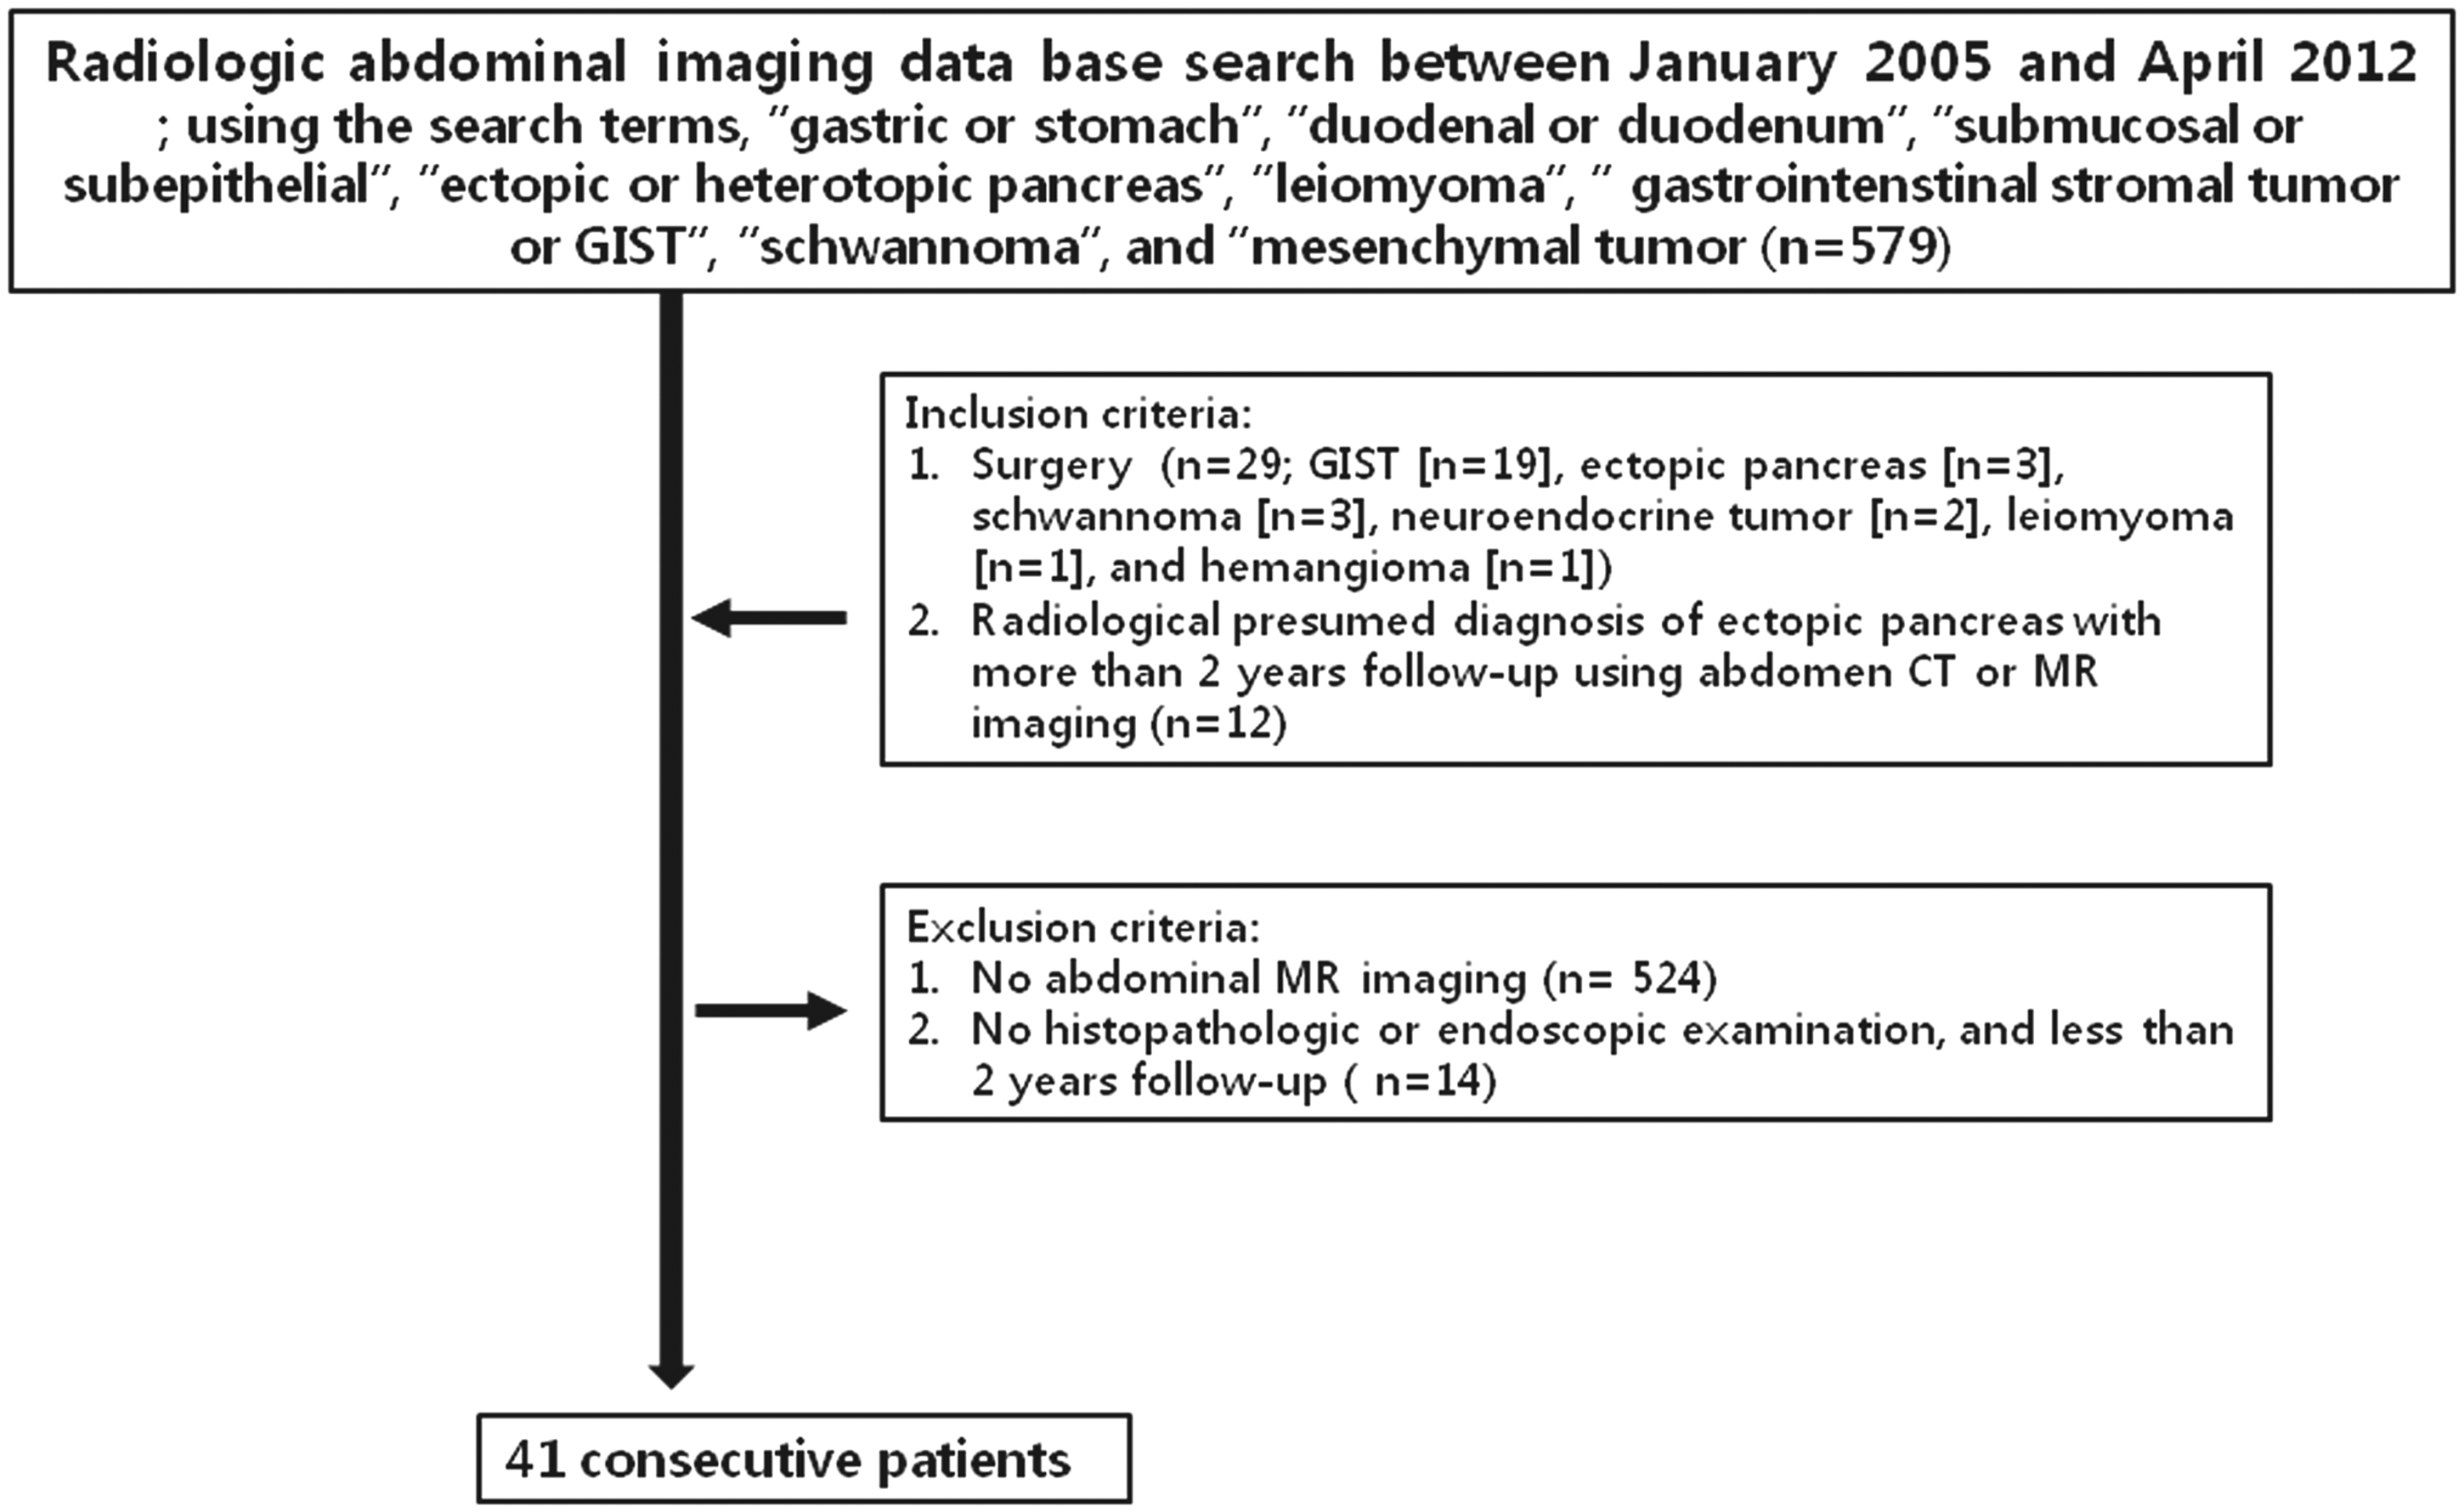
MRI technique
MRI sequences and parameters.
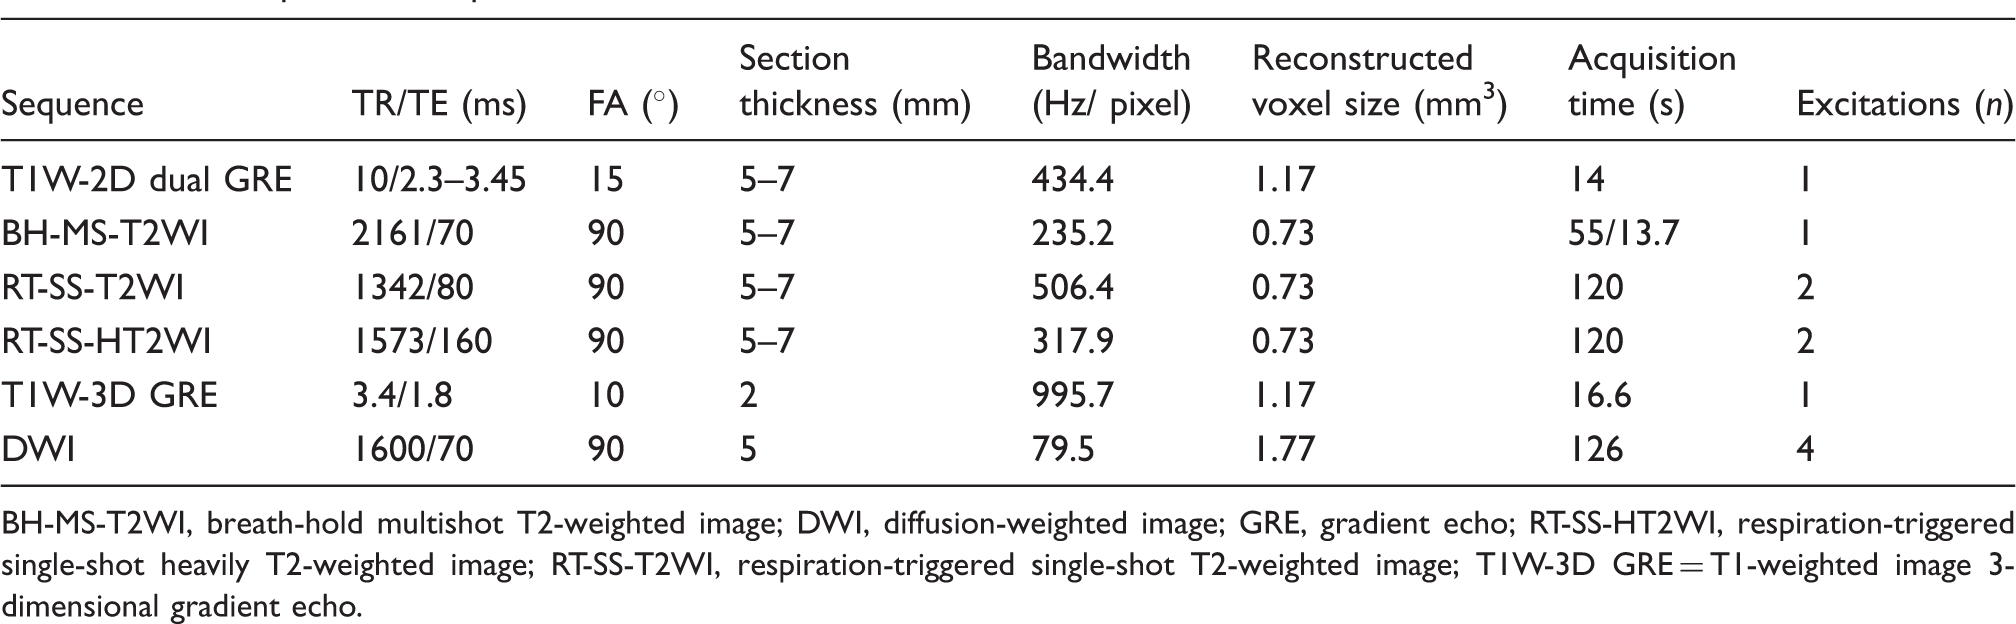
BH-MS-T2WI, breath-hold multishot T2-weighted image; DWI, diffusion-weighted image; GRE, gradient echo; RT-SS-HT2WI, respiration-triggered single-shot heavily T2-weighted image; RT-SS-T2WI, respiration-triggered single-shot T2-weighted image; T1W-3D GRE = T1-weighted image 3-dimensional gradient echo.
DWI with a b-value of 0, 100, and 800 s/mm2 was acquired simultaneously before the administration of gadoxetic acid using a respiratory-triggered single-shot echo planar imaging (Table 1). The beginning of each acquisition was timed to the same state of the respiratory cycle. Because a high b value DWI provides better contrast, minimizing the perfusion effect and yielding greater tissue diffusivity and a lower T2 shine-through effect, the ADC was calculated by a monoexponential function using b-values of 0 and 800 s/mm2.
Imaging analysis
Qualitative analysis
Two experienced radiologists (SJL and KMJ) with 20 and 11 years of abdominal MRI interpretation experience, respectively, who knew that there was a submucosal tumor in UGI tract, but were not aware of the surgical and histopathologic results, reviewed MR images at a picture archiving and communication workstation (PACS, Centricity Radiology RA 1000; GE Healthcare, Chicago, IL, USA). Images were presented in a random sequence to the observers, who evaluated them in consensus. The following MRI findings were assessed: (a) location, (b) contour, (c) growth pattern, (d) lesion border, (e) the presence of an intralesional cystic portion, (f) the presence of duct-like structure, and (g) the signal intensity of UGI submucosal lesions. Lesion contours were classified as round, ovoid, or lobular. Growth patterns were classified as extraluminal, mural, intraluminal, or mixed (13). Lesion borders were classified as ill-defined versus well-defined. The signal intensities of UGI submucosal lesions were compared to normal pancreas on unenhanced T1- and T2-weighted images, gadoxetic acid-enhanced arterial phase, portal phase, 3-min late phase, and DWI (b = 800 s/mm2). For heterogeneous lesions, the most strongly enhanced portion of the lesion on arterial phase and the corresponding portion on other MR sequences were compared to the pancreas. UGI submucosal lesions were graded as hyperintense when the signal intensity of the lesion was greater than that of the pancreas; isointense when the signal intensity of the lesion was similar to that of the pancreas; and hypointense when the signal intensity of the lesion was weaker than that of the pancreas.
Quantitative analysis
The long diameter (LD) and the short diameter (SD) of the UGI submucosal lesions, and signal intensities of the UGI submucosal lesions and normal pancreas on various pulse sequences of MR images with DWI (b = 800 s/mm2) were measured by a radiologist (KMJ). The ADC values of the lesions and pancreas were also measured. Lesions ≥10 mm in the shortest diameter were included in the quantitative signal intensity analysis of UGI submucosal lesions to reduce partial volume averaging effects. A total of 38 UGI submucosal lesions (19 GISTs, 13 ectopic pancreases, three schwannomas, one each of neuroendocrine tumor, leiomyoma, and hemangioma) were included in the quantitative analysis. Circular or ovoid regions of interest (ROIs) were placed to include almost the entire area of the homogeneous solid portion of lesions while avoiding the most peripheral portions to exclude partial volume effects of adjacent extralesional tissue. For heterogeneous UGI submucosal lesions, the most strongly enhanced portion of the lesion on arterial phase and the corresponding portion on other MR sequences were assessed. The signal intensities were measured three times and averaged. The mean sizes of the ROI of the UGI submucosal lesions and of the pancreas were 61.6 ± 68.7 mm2 (range, 13–301 mm2) and 26.2 ± 2.3 mm2 (range, 17–41 mm2), respectively. Then, the LD/SD ratios of the lesions and the signal intensity and ADC ratios of UGI submucosal lesions to pancreas (signal intensity [ADC] ratio = signal intensity [ADC value] of lesion) / signal intensity [ADC value] of pancreas) were calculated.
Statistical analysis
For qualitative comparisons of location, contour, growth pattern, border, and the presence of intralesional cystic portion and duct-like structure between UGI submucosal tumors and ectopic pancreas, Fisher's exact test was used. For quantitative comparisons of size, LD/SD ratios of the lesion, and signal intensity and ADC ratios of UGI submucosal lesions to pancreas, the Mann-Whitney U test was used.
Ectopic pancreas would be similar to the mother pancreas, and the signal intensity (ADC) ratio of ectopic pancreas to mother pancreas might be closer to 1.0 than that of submucosal tumors. Therefore, the absolute value of difference between the signal intensity (ADC) ratio of submucosal lesions and 1.0 might be significantly different between ectopic pancreas and submucosal tumors. Thus, instead of using the actual signal intensity (ADC) ratios of ectopic pancreas and submucosal tumor, we calculated the absolute value of difference between and signal intensity (ADC) ratio of submucosal lesions and 1.0 and used for receiver-operating characteristic (ROC). We calculated area under the ROC curve (AUC), and selected the cut-off point that maximized the value of the Youden index, which yields a threshold level where both the sensitivity and specificity are high (14). The P values <0.05 were defined as statistically significant. All statistical analyses were performed using SAS version 9.1.3 (SAS Institute, Cary, NC, USA).
Results
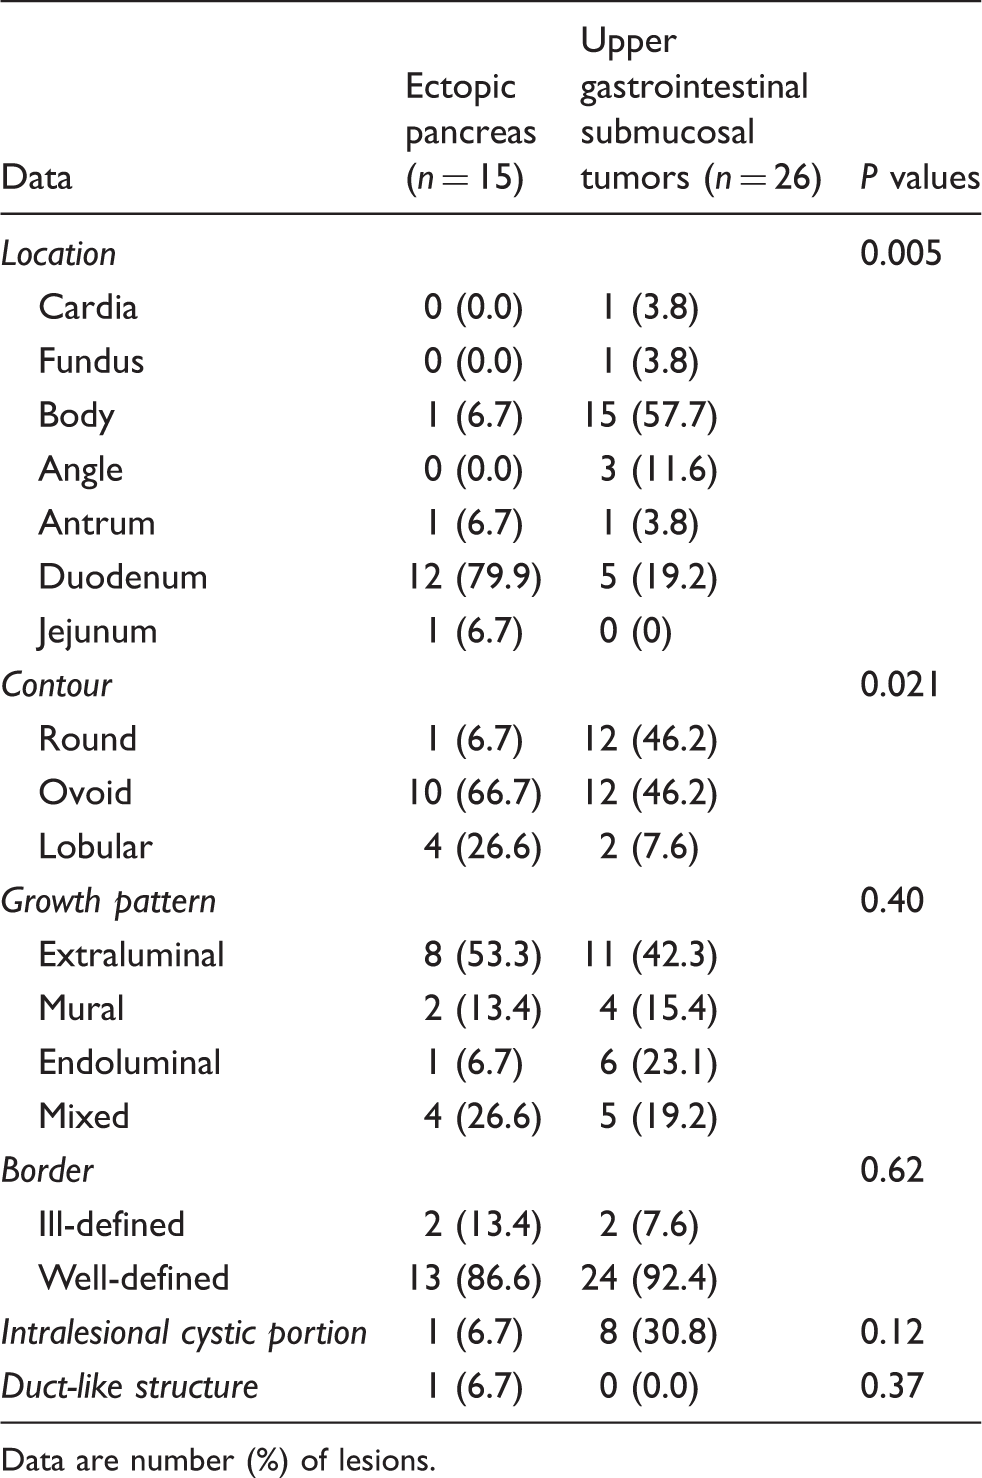
The morphologic findings of ectopic pancreases and UGI submucosal tumors on MR images are summarized in Table 2. The distribution of location differed significantly between ectopic pancreases and UGI submucosal tumors (P = 0.005). The most common location was duodenum (12/15, 79.9%) for ectopic pancreases, and gastric body for UGI submucosal tumors (15/26, 57.7%). The UGI submucosal tumors (12/26, 46.2%) were more often round in contour compared to ectopic pancreases (1/15, 6.7%; P = 0.021). Growth pattern, lesion border, and the presence of an intralesional cystic portion and duct-like structure did not differ significantly between ectopic pancreases and UGI submucosal tumors (P > 0.05). The two ectopic pancreases located in the stomach showed mural growth patterns and ill-defined borders, but most ectopic pancreases in duodenum or jejunum showed extraluminal (6/13, 46.1%) or mixed (4/13, 30.8%) growth patterns, and all of 13 ectopic pancreases in duodenum or jejunum showed well-defined borders (Figs. 2 and 3). The presence of duct-like structure was demonstrated only in an ectopic pancreas in jejunum (Fig. 2).
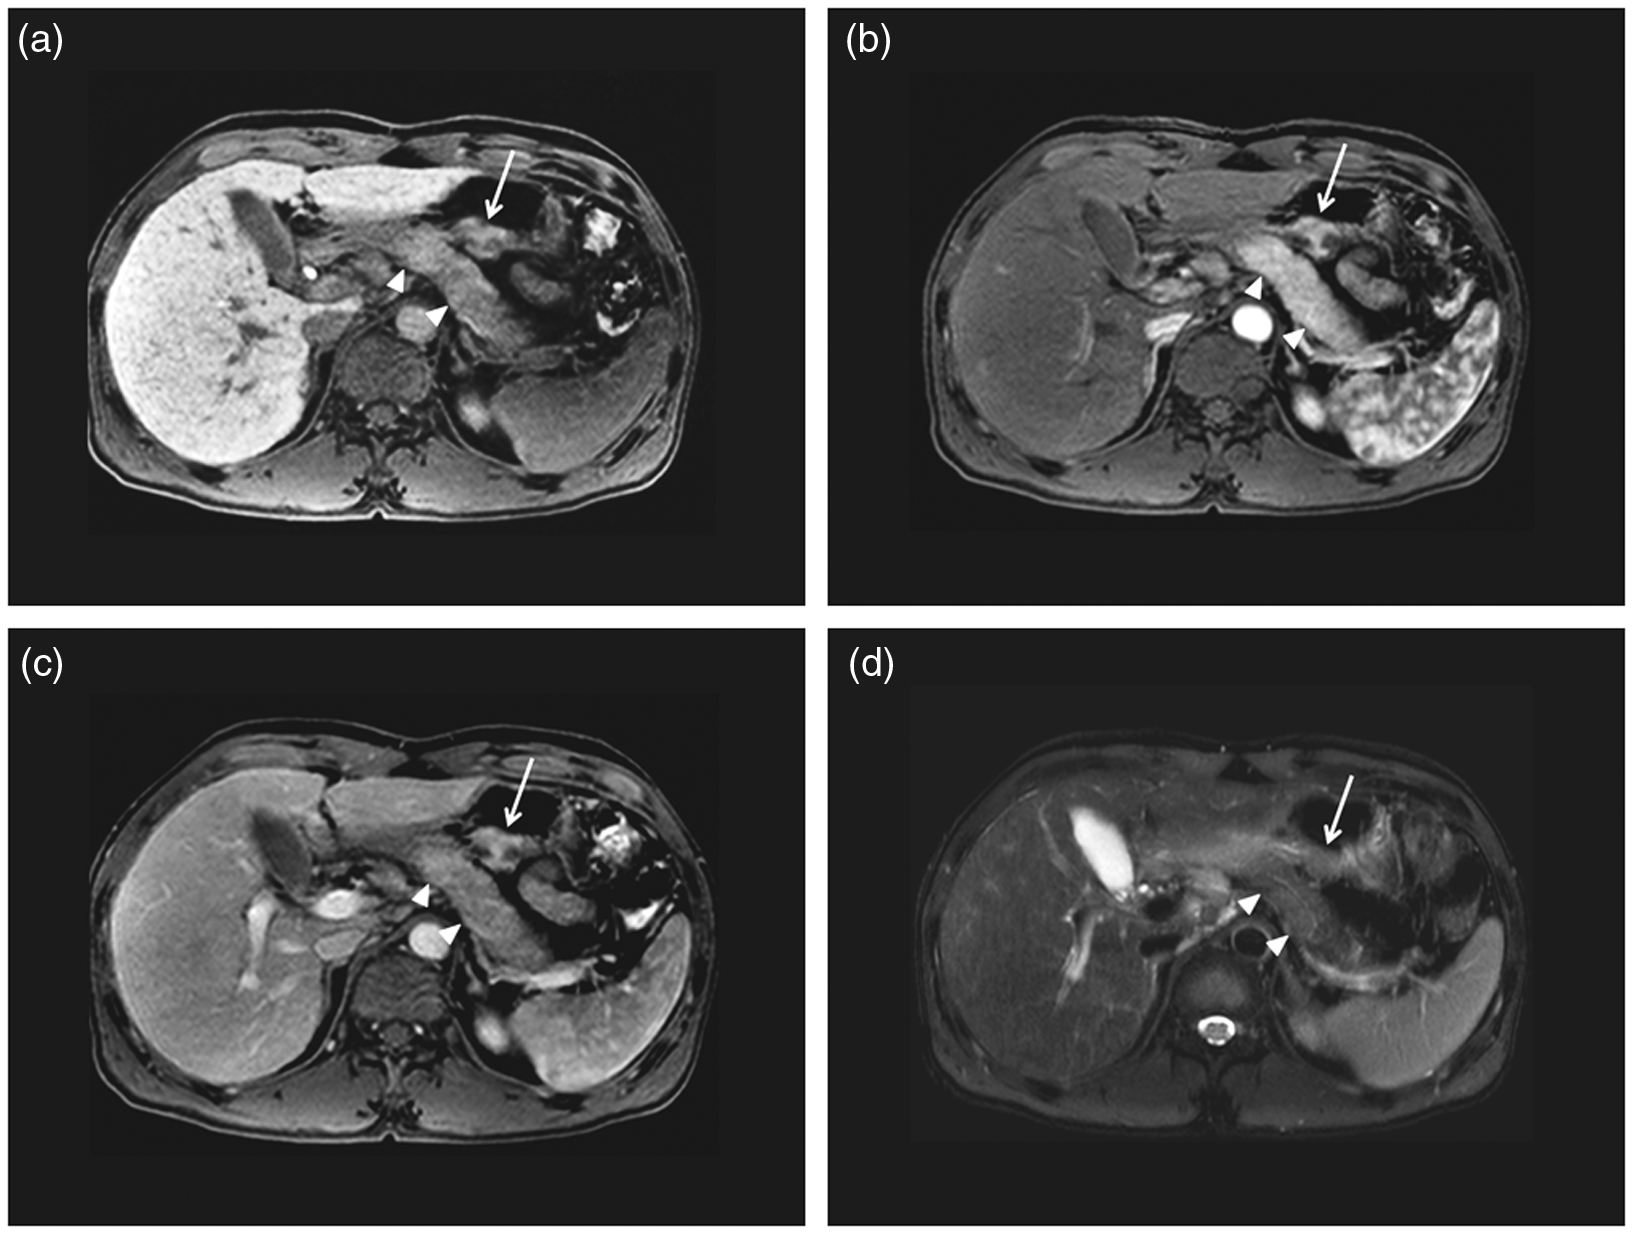
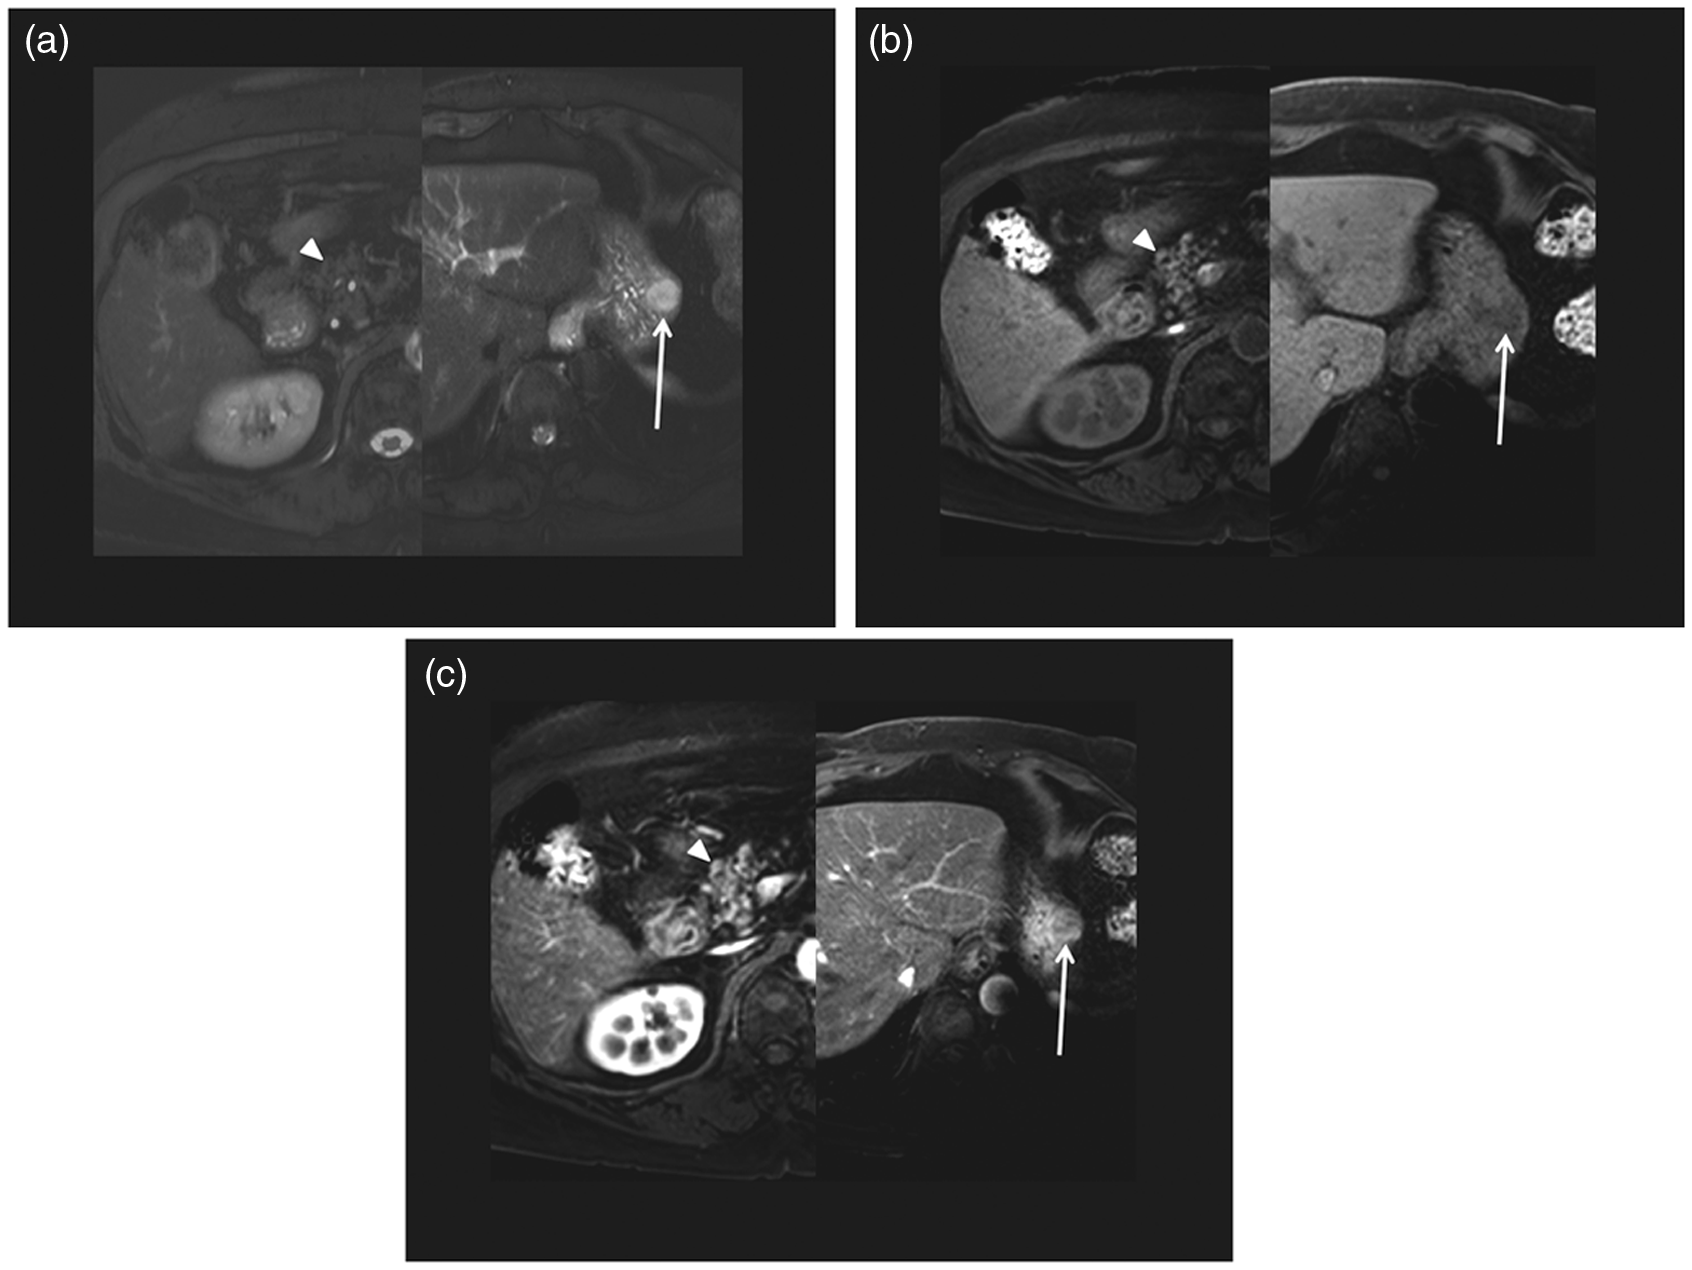
A 39-year-old woman with clinical diagnosis of jejunal ectopic pancreas. Compared with the pancreas (arrowheads), the ectopic pancreas (arrow) appears as a well-defined, lobular, isointense lesion on the transverse unenhanced T1-weighted fat-saturated gradient-recalled echo image (a), gadoxetic acid-enhanced arterial (b), fat-saturated T2-weighted image (c, d), and diffusion-weighted images (b-value 800 (e) s/mm2). Duct-like structure (short arrow) in the ectopic pancreas is noted on transverse fat-saturated T2-weighted image (c, d). The signal intensity ratios of the ectopic pancreas to the pancreas on unenhanced T1-weighted, arterial phase, T2-weighted, and diffusion-weighted (b-value 800 s/mm2) images were 1.00, 1.01, 1.11 and 1.14, respectively. A 43-year-old man with a pathologically proven gastric ectopic pancreas. Compared with the pancreas (arrowheads), the ectopic pancreas (arrow) appears as an ill-defined, lobular, isointense lesion on the transverse unenhanced T1-weighted fat-saturated gradient-recalled echo image (a) and gadoxetic acid-enhanced arterial phase image (b), and as a mildly hyperintense lesion on portal (c) and fat-saturated T2-weighted images (d). The signal intensity ratios of the ectopic pancreas to the pancreas on unenhanced T1-weighted, arterial phase, portal phase, and T2-weighted images were 1.04, 0.99, 1.13, and 1.24, respectively. MRI findings in ectopic pancreas and other submucosal tumors in upper gastrointestinal tract. Data are number (%) of lesions.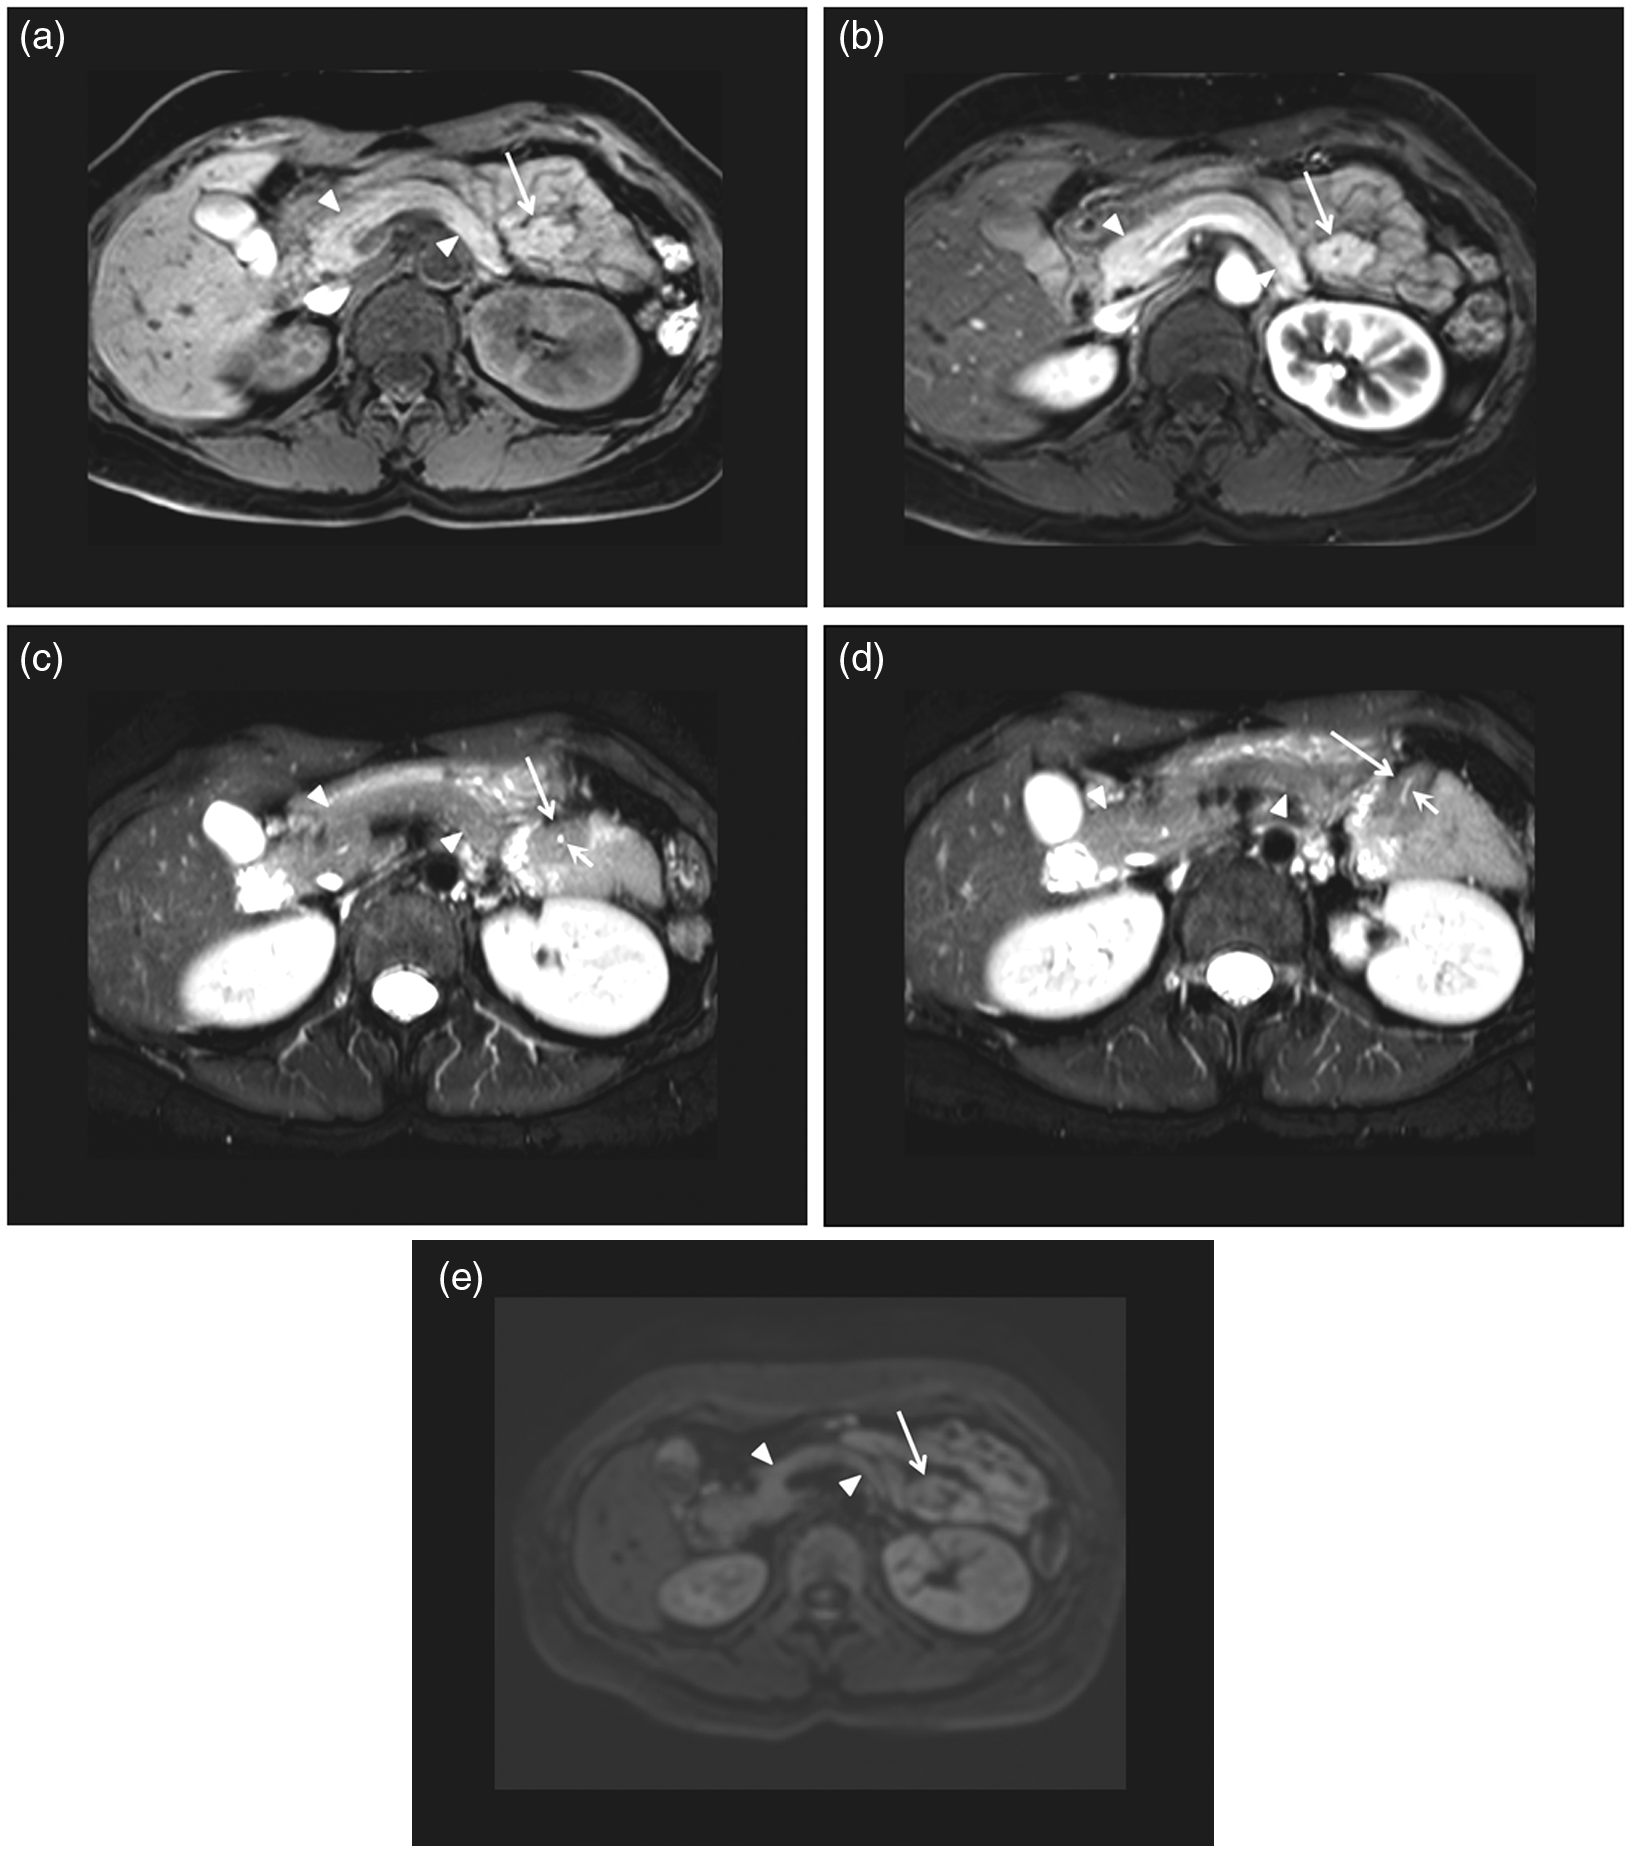
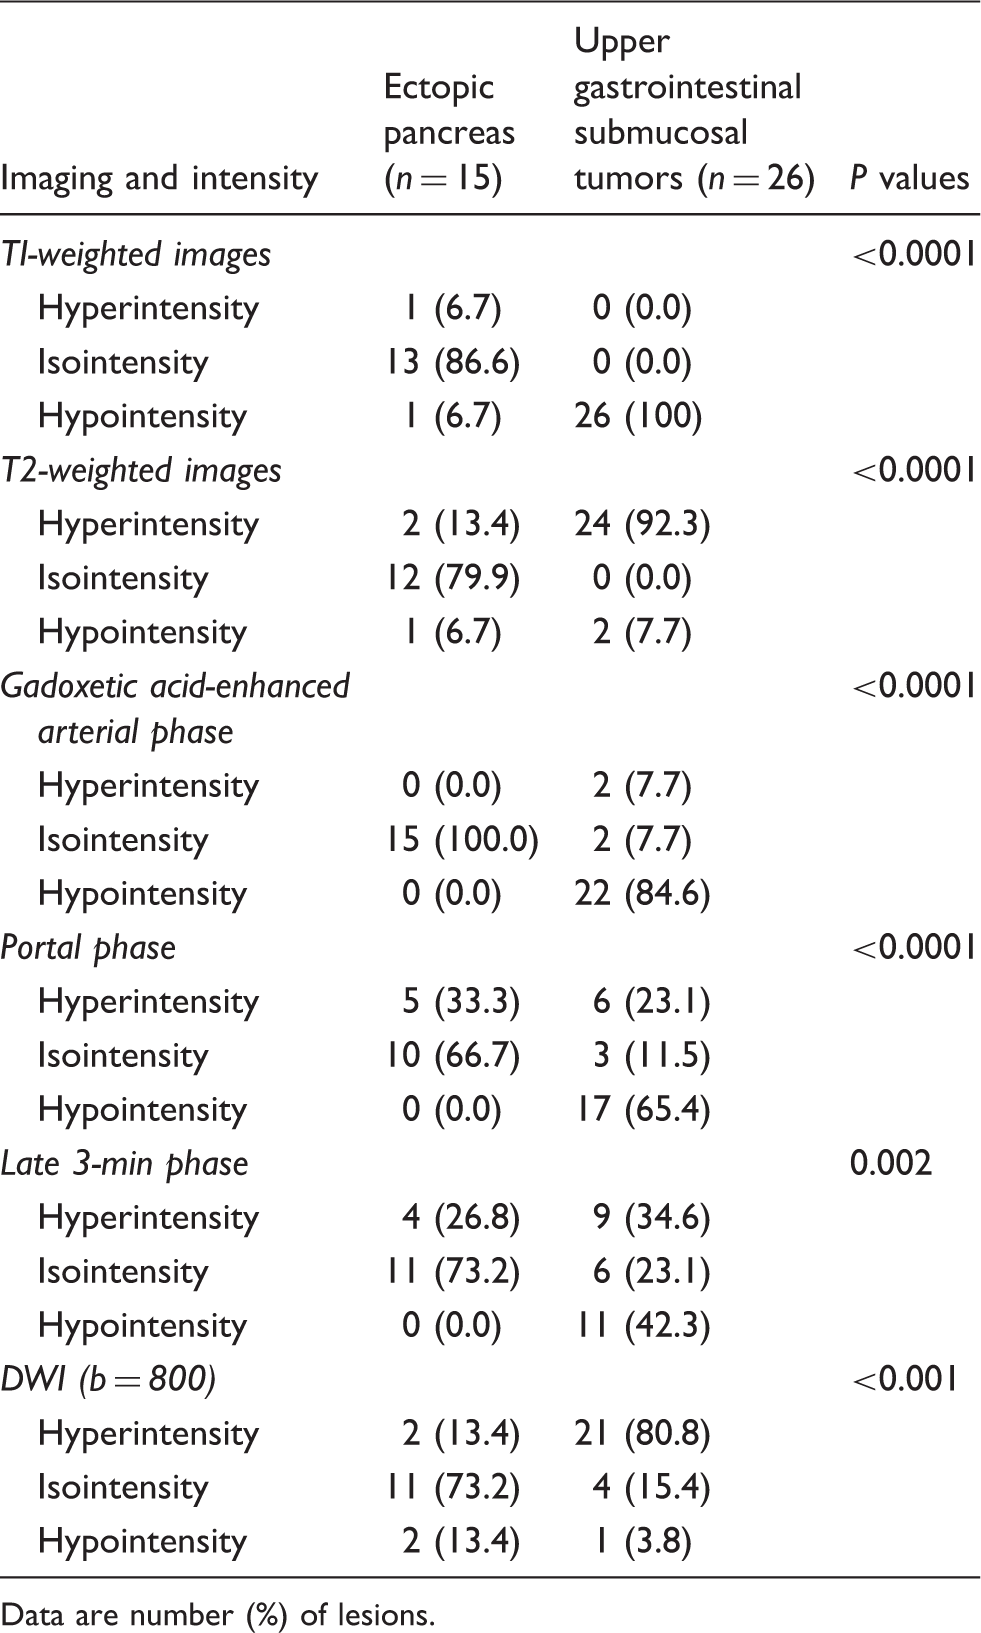
On all of the various pulse sequences of MR images, ectopic pancreases showed isointensity compared with the pancreas more frequently than did those of UGI submucosal tumors (Table 3, P < 0.001) (Figs. 2 and 3). All of the UGI submucosal tumors appeared as hypointense lesions compared with the pancreas on unenhanced T1-weighted images and 24 (92.3%) UGI submucosal tumors appeared as hyperintense lesions compared with the pancreas on T2-weighted images. Of the ectopic pancreases, 14 (93.3%) appeared as hyperintense or isointense lesions compared with the pancreas on unenhanced T1-weighted images and 13 (86.6%) appeared as isointense or hypointense lesions compared with the pancreas on T2-weighted images (P < 0.0001) (Figs. 2–5). On dynamic MR images, all of the ectopic pancreases appeared as isointense lesions compared with the pancreas on arterial phase images, but only two (7.7%) of the UGI submucosal tumors appeared as isointense lesions compared with the pancreas (P < 0.0001). On DWI (b = 800 s/mm2), 21 (80.8%) UGI submucosal tumors appeared as hyperintense lesions compared with the pancreas, while only two ectopic pancreases (2/15, 13.4%; P < 0.001) were hyperintense compared with pancreas (Fig. 4).
A 51-year-old woman with a pathologically proven gastric gastrointestinal stromal tumor. Compared with the pancreas (arrowheads), the tumor (arrow) appears as a well-defined ovoid hypointense lesion on transverse unenhanced T1-weighted fat-saturated gradient-recalled echo image (a), and as a heterogeneous enhancing lesion on transverse gadoxetic acid-enhanced arterial phase image (b). The signal intensity ratios of tumor to the pancreas on unenhanced T1-weighted and arterial phase images were 0.44 and 0.64, respectively. Compared with the pancreas (arrowheads), the tumor (arrow) appears as a well-defined ovoid hyperintense lesion on transverse fat-saturated T2-weighted (c) and diffusion-weighted images (b-value 800 (d) s/mm2). The signal intensity ratios of tumor to the pancreas on T2-weighted and diffusion-weighted (b-value 800 s/mm2) images were 1.51 and 1.87, respectively. A 75-year-old woman with a pathologically proven gastric schwannoma. Compared with the pancreas (arrowhead), the tumor (arrow) appears as a well-defined, round hyperintense lesion on the transverse fat-saturated T2-weighted image (a), as an ill-defined hypointense lesion on unenhanced T1-weighted fat-saturated gradient-recalled echo image (b), and as a heterogeneous enhancing lesion on transverse gadoxetic acid-enhanced arterial phase image (c). The signal intensity ratios of the tumor on T2-weighted, T1-weighted, and arterial phase images were 1.97, 0.69, and 0.72, respectively. Signal intensities of ectopic pancreas and other submucosal tumors in upper gastrointestinal tract compared with pancreas on various MR images. Data are number (%) of lesions.
Signal intensity and ADC ratios of ectopic pancreas and other submucosal tumors in upper gastrointestinal tract compared with pancreas.
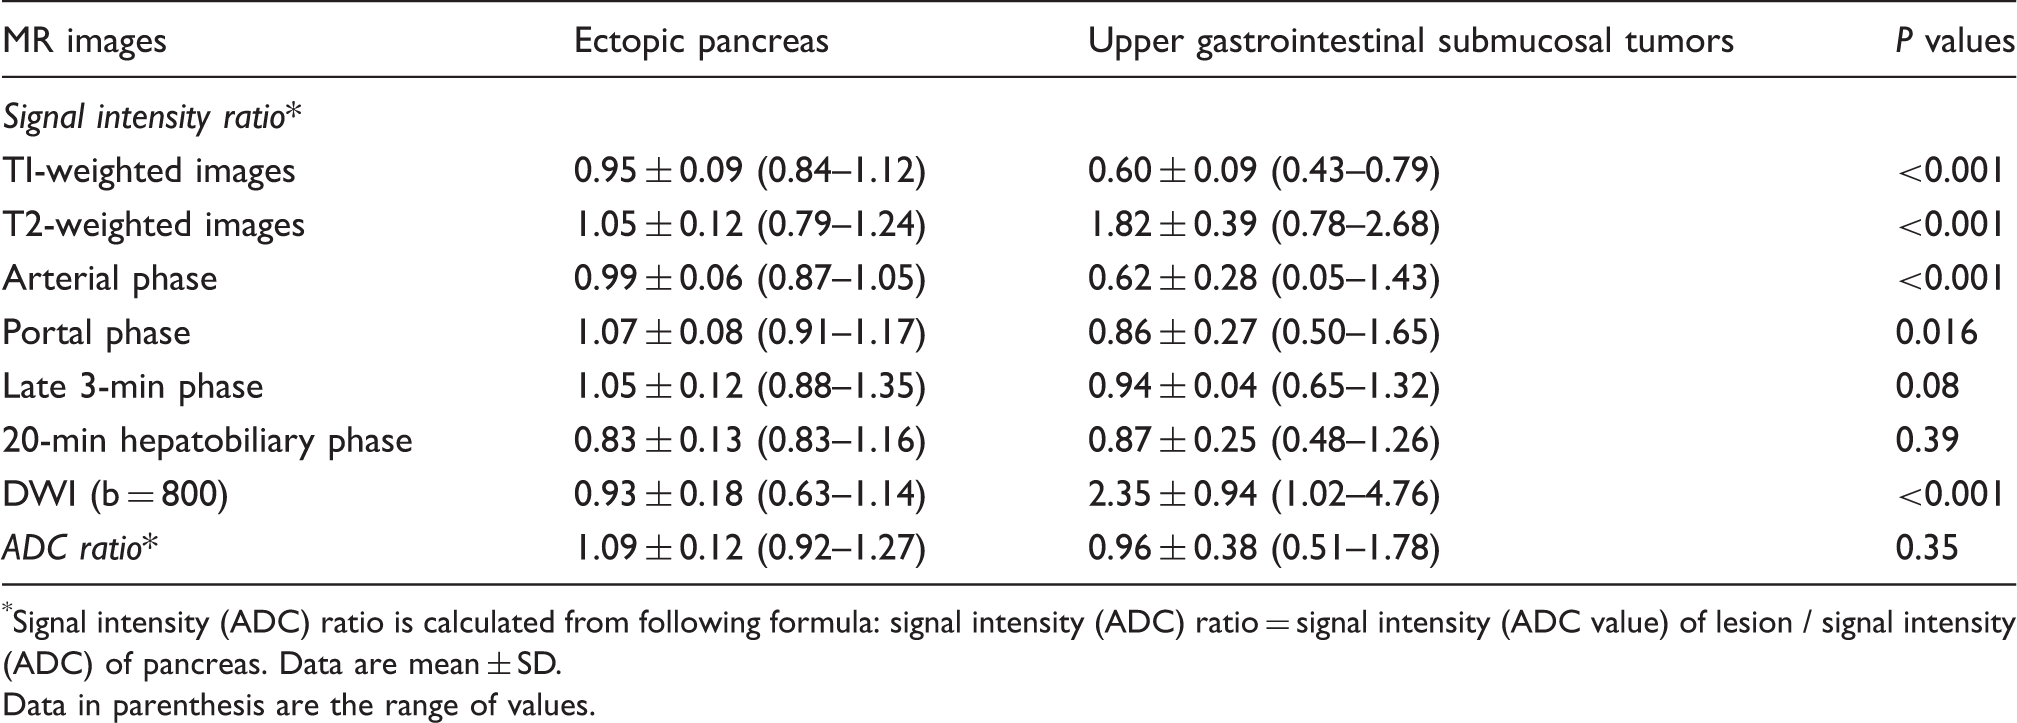
Signal intensity (ADC) ratio is calculated from following formula: signal intensity (ADC) ratio = signal intensity (ADC value) of lesion / signal intensity (ADC) of pancreas. Data are mean ± SD.
Data in parenthesis are the range of values.
Receiver-operating characteristic analysis for absolute values of difference (AVD) between 1.0 and signal intensity ratio of submucosal lesions.
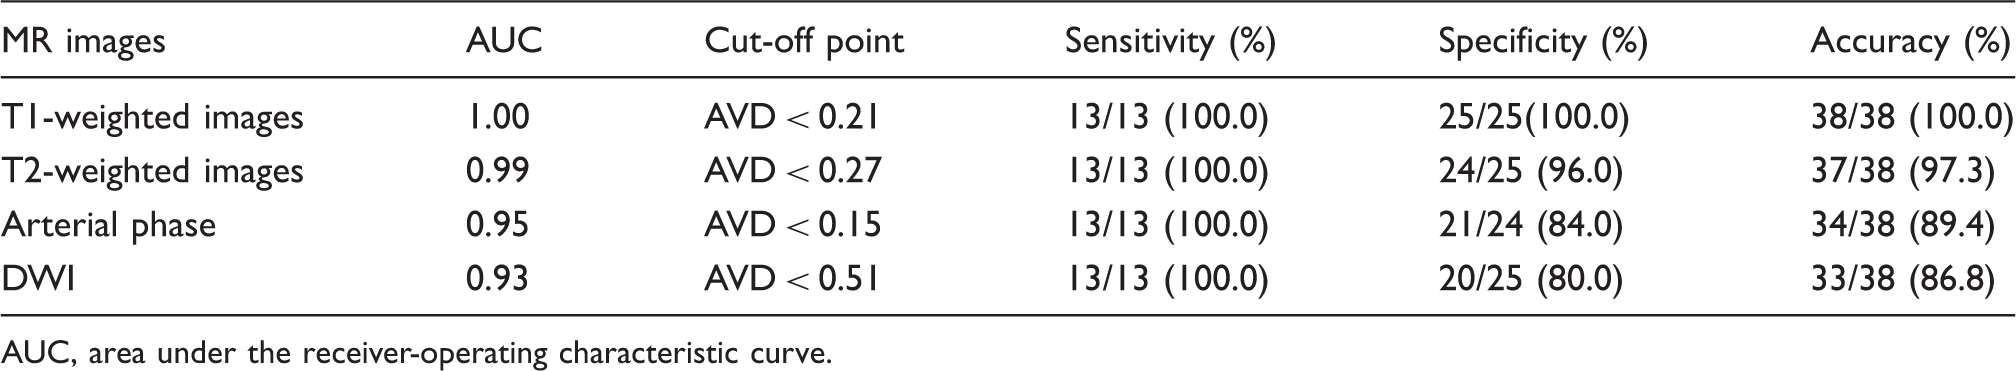
AUC, area under the receiver-operating characteristic curve.
Discussion
Ectopic pancreas is a relatively frequent congenital abnormality. Some patients with ectopic pancreas develop complications such as pancreatitis, insulinoma, and pancreatic cancer, but most patients with ectopic pancreas are asymptomatic throughout life (15–18). CT and endoscopic ultrasonography are used to distinguish ectopic pancreas from UGI submucosal tumors (13,18–20). To our knowledge, however, the use of MRI with DWI for the diagnosis of ectopic pancreas in the UGI tract has not been evaluated. MRI provides superior soft tissue imaging, and the pancreas displays one of the highest signal intensities of the abdominal viscera on fat-suppressed T1-weighted images (9). In addition, the pancreas shows arterial enhancement on dynamic abdominal MRI. Based on these features, we hypothesized that abdominal MRI could have high capability to differentiate ectopic pancreas from UGI submucosal tumors. Accordingly, we found that the ectopic pancreas showed isointensity compared with the pancreas more frequently than did UGI submucosal tumors on all of various pulse sequences of MR images with DWI (P < 0.01).
The study by Kim et al. demonstrated that the characteristic CT imaging findings of ectopic pancreas in the stomach and duodenum included an endoluminal growth pattern, ill-defined border, LD/SD ratio >1.4 and typical locations in the prepyloric antrum (7/14, 50%) and duodenum (4/14, 29%) (19). However, the sensitivity and specificity for diagnosing ectopic pancreas according to these imaging parameters on CT were variable, and reported sensitivity and specificity for diagnosing ectopic pancreas were in the range of 14–100% and 45–100%, respectively. In our study, the duodenum was the typical location (12/15, 79.9%) for ectopic pancreas (P = 0.005), the endoluminal growth pattern and ill-defined border were not significant imaging findings for ectopic pancreas compared with UGI submucosal tumors, and the LD/SD ratio did not differ significantly between ectopic pancreas (mean, 1.68 ± 0.44) and UGI submucosal tumors (1.50 ± 0.53) (P > 0.05). We think that these differences between our study and that by Kim et al. may stem from differences in patient enrollment protocol and variation in the state of distention of the UGI tract. In our study, both ectopic pancreases in the stomach showed mural growth patterns, ill-defined borders, and high LD/SD ratios (2.63 and 1.60), but all of 13 ectopic pancreas in the duodenum or jejunum did not show mural growth pattern, and all of them had well-defined borders. In addition, although Kim et al. did not describe the protocol used for UGI tract distention, the stomach and duodenum in the cases illustrated in their report were distended by negative contrast, while in our study the UGI tract was not distended by any oral contrast agent. This difference also may be another reason for the differences observed in growth pattern and LD/SD ratio for a soft submucosal lesion such as ectopic pancreas. In a study by Wei et al., the LD/SD ratios differed significantly between ectopic pancreases in the stomach and in the duodenum (LD/SD ratio, 1.81 ± 0.23 vs. 1.32 ± 0.18; P < 0.05) (20). Based on our results and on previous reports (19,20), we think that the location of ectopic pancreas and the degree of distention of the UGI tract may influence the appearance and assessment of the growth pattern, lesion border, and the LD/SD ratio observed, and that these factors may explain inconsistencies in CT findings reported to distinguish between ectopic pancreas and other submucosal tumors, especially GIST, in the UGI tract.
The study by Kim et al. demonstrated that ectopic pancreases with predominantly pancreatic acini showed greater enhancement and had a higher CT attenuation value in the portal venous phase than did the pancreas, and the one ectopic pancreas that was predominantly composed of ducts had lower CT attenuation values than the pancreas and even the back muscle (19). Compared with such diversity of CT findings for ectopic pancreas, our findings were relatively discrete: on unenhanced T1-weighted images, only two (13.4%) ectopic pancreases showed slightly different signal intensity qualitatively, but the signal intensity ratios of ectopic pancreas (0.84–1.12) did not overlap with those of UGI submucosal tumors (0.43–0.79). In addition, if absolute values of difference between 1.0 and signal intensity ratio of submucosal lesions to the pancreas on T1-weighted images was <0.21, the sensitivity and specificity reached 100.0% for diagnosis of ectopic pancreas from submucosal tumors. We believe that the similarity of the ectopic pancreas and the pancreas both qualitatively and quantitatively on unenhanced T1-weighted images is a valuable finding for differentiating ectopic pancreas from other submucosal tumors in the UGI tract irrespective of the location of submucosal lesions and the degree of distention of the UGI tract. Other MR sequences, including dynamic imaging and DWI, may be similarly applied.
Our study had some limitations. First, although we recruited the patients who met the inclusion criteria, we cannot rule out selection bias that may have resulted from the retrospective design of our study. Second, 12 (79.9%) ectopic pancreases in our study were not histologically confirmed but clinically confirmed, which rise assumptions that the diagnosis of ectopic pancreas might be already made by using somehow similar criteria to those reported possibly leading to a self-fulfilling prophecy. Nevertheless, we thought that a clinical follow-up period longer than 24 months would be sufficient to exclude other diagnoses. Further prospective large scale study may be needed to validate our results. Third, the number of cases enrolled in our study was relatively small. Qualitative and quantitative analyses did show, however, that the value of abdominal MRI for differentiating between the ectopic pancreas and submucosal tumors in UGI tract was meaningful. Fourth, although in our study there was no patient with chronic pancreatitis or nearly cystic ectopic pancreas, parenchyma with chronic inflammation in mother or ectopic pancreas may show decreased signal intensity on T1-weighted images and delayed gradual enhancement on contrast-enhanced dynamic study images representing fibrotic changes. In addition, ectopic pancreas might have pseudocyst with scarce parenchyma. Under these conditions, differentiation between ectopic pancreas and other submucosal tumors could be difficult on MRI. Finally, we evaluated abdominal MR images with DWI side by side rather than by using image fusion, which might have resulted in increased error frequency because of the small lesions that may not be accurately identified on the MR images. To minimize this potential error, we used a spatial cursor key in our PACS that enabled matching of the corresponding sites on different images using multiplanar localization.
In conclusion, abdominal MRI with DWI can be a valuable tool for differentiating ectopic pancreases from UGI submucosal tumors.
Footnotes
Funding
This research received no specific grant from any funding agency in the public, commercial, or not-for-profit sectors.