
Abstract
Background
The B-mode ultrasound image that can measure muscle architecture is displayed side by side with the ultrasound strain elastogram that can assess muscle hardness. Consequently, muscle architecture can be measured concurrently with muscle hardness using ultrasound strain elastography.
Purpose
To demonstrate the measurement of muscle architecture concurrently with muscle hardness using ultrasound strain elastography.
Material and Methods
Concurrent measurements of muscle architectural parameters (muscle thickness, pennation angle, and fascicle length) and muscle hardness of the medial gastrocnemius were performed with ultrasound strain elastography. Separate measurements of the muscle architectural parameters were also performed for use as reference values for the concurrent measurements. Both types of measurements were performed twice at 20° dorsiflexion, neutral position, and 30° plantar flexion.
Results
Coefficients of variance of the muscle architectural parameters obtained from the concurrent measurements (≤7.6%) were significantly higher than those obtained from the separate measurements (≤2.4%) (all P < 0.05). Intraclass correlation coefficients of the architectural parameters were lower in the concurrent measurements (≥0.74) than in the separate measurements (≥0.97). However, there were no significant differences in any muscle architectural parameters between the concurrent and separate measurements (all P > 0.05).
Conclusion
The use of ultrasound strain elastography for the concurrent measurement of muscle architecture and muscle hardness is feasible.
Keywords
Introduction
Muscle architecture can be defined as the geometric arrangement of the fascicles in the muscle-tendon complex (1,2) and has been investigated with respect to muscle thickness, pennation angle, and fascicle length (1–4). Muscle thickness and pennation angle are both increased by resistance training (1). In addition, muscle thickness reportedly increases in response to muscle damage (3). Muscle hardness is a mechanical property that represents transverse resistance detected by applying perpendicular distortions to the muscle belly and is distinct from the stiffness of the muscle-tendon complex along the longitudinal axis of the muscle (5,6). Previous studies have reported that muscle hardness changes in response to fatigue (7,8) and muscle damage (9,10). These results suggest that muscle architecture and muscle hardness are objective indicators of muscle condition. Good muscle condition is important for athletes seeking to achieve maximal performance in sports competitions. These athletes must be aware of their daily muscle condition and adjust it as necessary for competitions. Thus, muscle architecture and muscle hardness are valuable for managing the daily muscle condition.
Ultrasound strain elastography, also described as compression elastography, sonoelastography, and real-time elastography, is one of the most common imaging methods used to assess the mechanical properties of tissue (11). This method relies on the principle that the application of a compressive force results in tissue deformation (strain); the strain distribution is then determined by real-time capture of ultrasonic echo signals before and after the tissue deformation (11–13). The utility of ultrasound strain elastography for the investigation of muscle hardness has been previously reported (8,10,14,15). We recently devised a quantitative method for the measurement of absolute muscle hardness using ultrasound strain elastography and found that muscle hardness is dependent on the joint angle and/or muscle size (16,17). In ultrasound strain elastography, the elastogram is superimposed on a B-mode ultrasound image and displayed side by side with the B-mode ultrasound image without the ultrasound elastogram. Consequently, if the B-mode ultrasound image that is displayed next to the ultrasound elastogram can be used to quantify muscle architectural parameters, muscle architecture can be measured concurrently with muscle hardness.
When muscle architecture and muscle hardness are measured concurrently, the B-mode ultrasound image and the ultrasound elastogram are acquired at the same time and in the same imaging plane. In addition, the time required to obtain a B-mode ultrasound image concurrently with an ultrasound elastogram is shorter than that required to obtain them separately. Thus, this combined technique offers an efficient way to objectively assess muscle architecture and muscle hardness, which are both indicators of muscle condition. However, it is possible that the B-mode ultrasound image may become blurred because of the repetitive slight compression–relaxation cycles required to obtain the ultrasound strain elastogram. Moreover, the compression–relaxation cycles may lead to underestimation of the muscle thickness. Thus, the purpose of this study was to measure muscle architecture concurrently with muscle hardness using ultrasound strain elastography and to investigate the reproducibility of the measurements and thus the feasibility of ultrasound strain elastography for the concurrent measurement of these parameters.
Material and Methods
Fourteen healthy male subjects (age, 26.1 ± 2.1 years; height, 172.7 ± 4.8 cm; weight, 66.2 ± 7.3 kg; mean ± standard deviation [SD]) voluntarily participated in this study, which was approved by the ethics review board of the Japan Institute of Sports Sciences. Before the experiment, all subjects were fully informed of the experimental protocol as well as the purpose of the study, and all provided written informed consent prior to participation in the experiment.
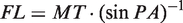
To provide reference values for the concurrent measurements of muscle architecture, separate measurements of muscle architectural parameters (muscle thickness, pennation angle, and fascicle length) were performed by one of the authors (KC) using the ultrasound apparatus (EUB-7500; Hitachi Medical Corporation, Chiyoda-ku, Tokyo, Japan) with a 7.5-MHz linear probe (EUP-L53; Hitachi Medical Corporation) (Fig. 1a). Longitudinal B-mode ultrasound images of the medial gastrocnemius (MG) muscle were obtained. The length of the distal limb was measured from the popliteal crease to the lateral malleolus, and the ultrasound probe was placed at 30% of that length distal to the popliteal crease. To set the ultrasound probe at the same site in all measurements, the skin surface site at which the probe would be placed was marked with a felt-tip pen. The thickness and pennation angle of the MG were measured using a caliper program (ImageJ 1.45; National Institute of Health, Bethesda, MD, USA). Because the muscle thicknesses on the left and right sides in each B-mode ultrasound image were not identical, the averaged value of the right and left sides was used for further analysis. The fascicles of the MG at the 20° dorsiflexion (DF20) and neutral (angle between the tibia and sole: 90°, N) ankle positions were too long to allow for visualization of whole fascicles within the B-mode ultrasound images; thus, the fascicle length was estimated from the following equation (1,18,19):
Schematic of the experimental set-up and typical ultrasound images of the (a) separate and (b) concurrent measurements in a 30-year-old man. Muscle thickness of the medial gastrocnemius was determined by averaging the muscle thickness of the left side and that of the right side. Fascicle length was calculated from the muscle thickness and pennation angle. To obtain ultrasound strain elastograms (for the concurrent measurement only), the softer reference standard (7 kPa) and harder reference standard (30 kPa) were placed on the skin surface, and slight compression–relaxation cycles were repetitively applied with the handheld ultrasound probe. The left image of the concurrent measurement is a color-coded elastogram superimposed on a B-mode ultrasound image. The numeric scale classifies the velocity of the compression–relaxation cycles into 1 to 7, and a classification of 3 to 4 indicates an appropriate cycle velocity. The yellow rectangles within the softer and harder reference standards and the medial gastrocnemius are the regions of interest in which the muscle hardness was measured.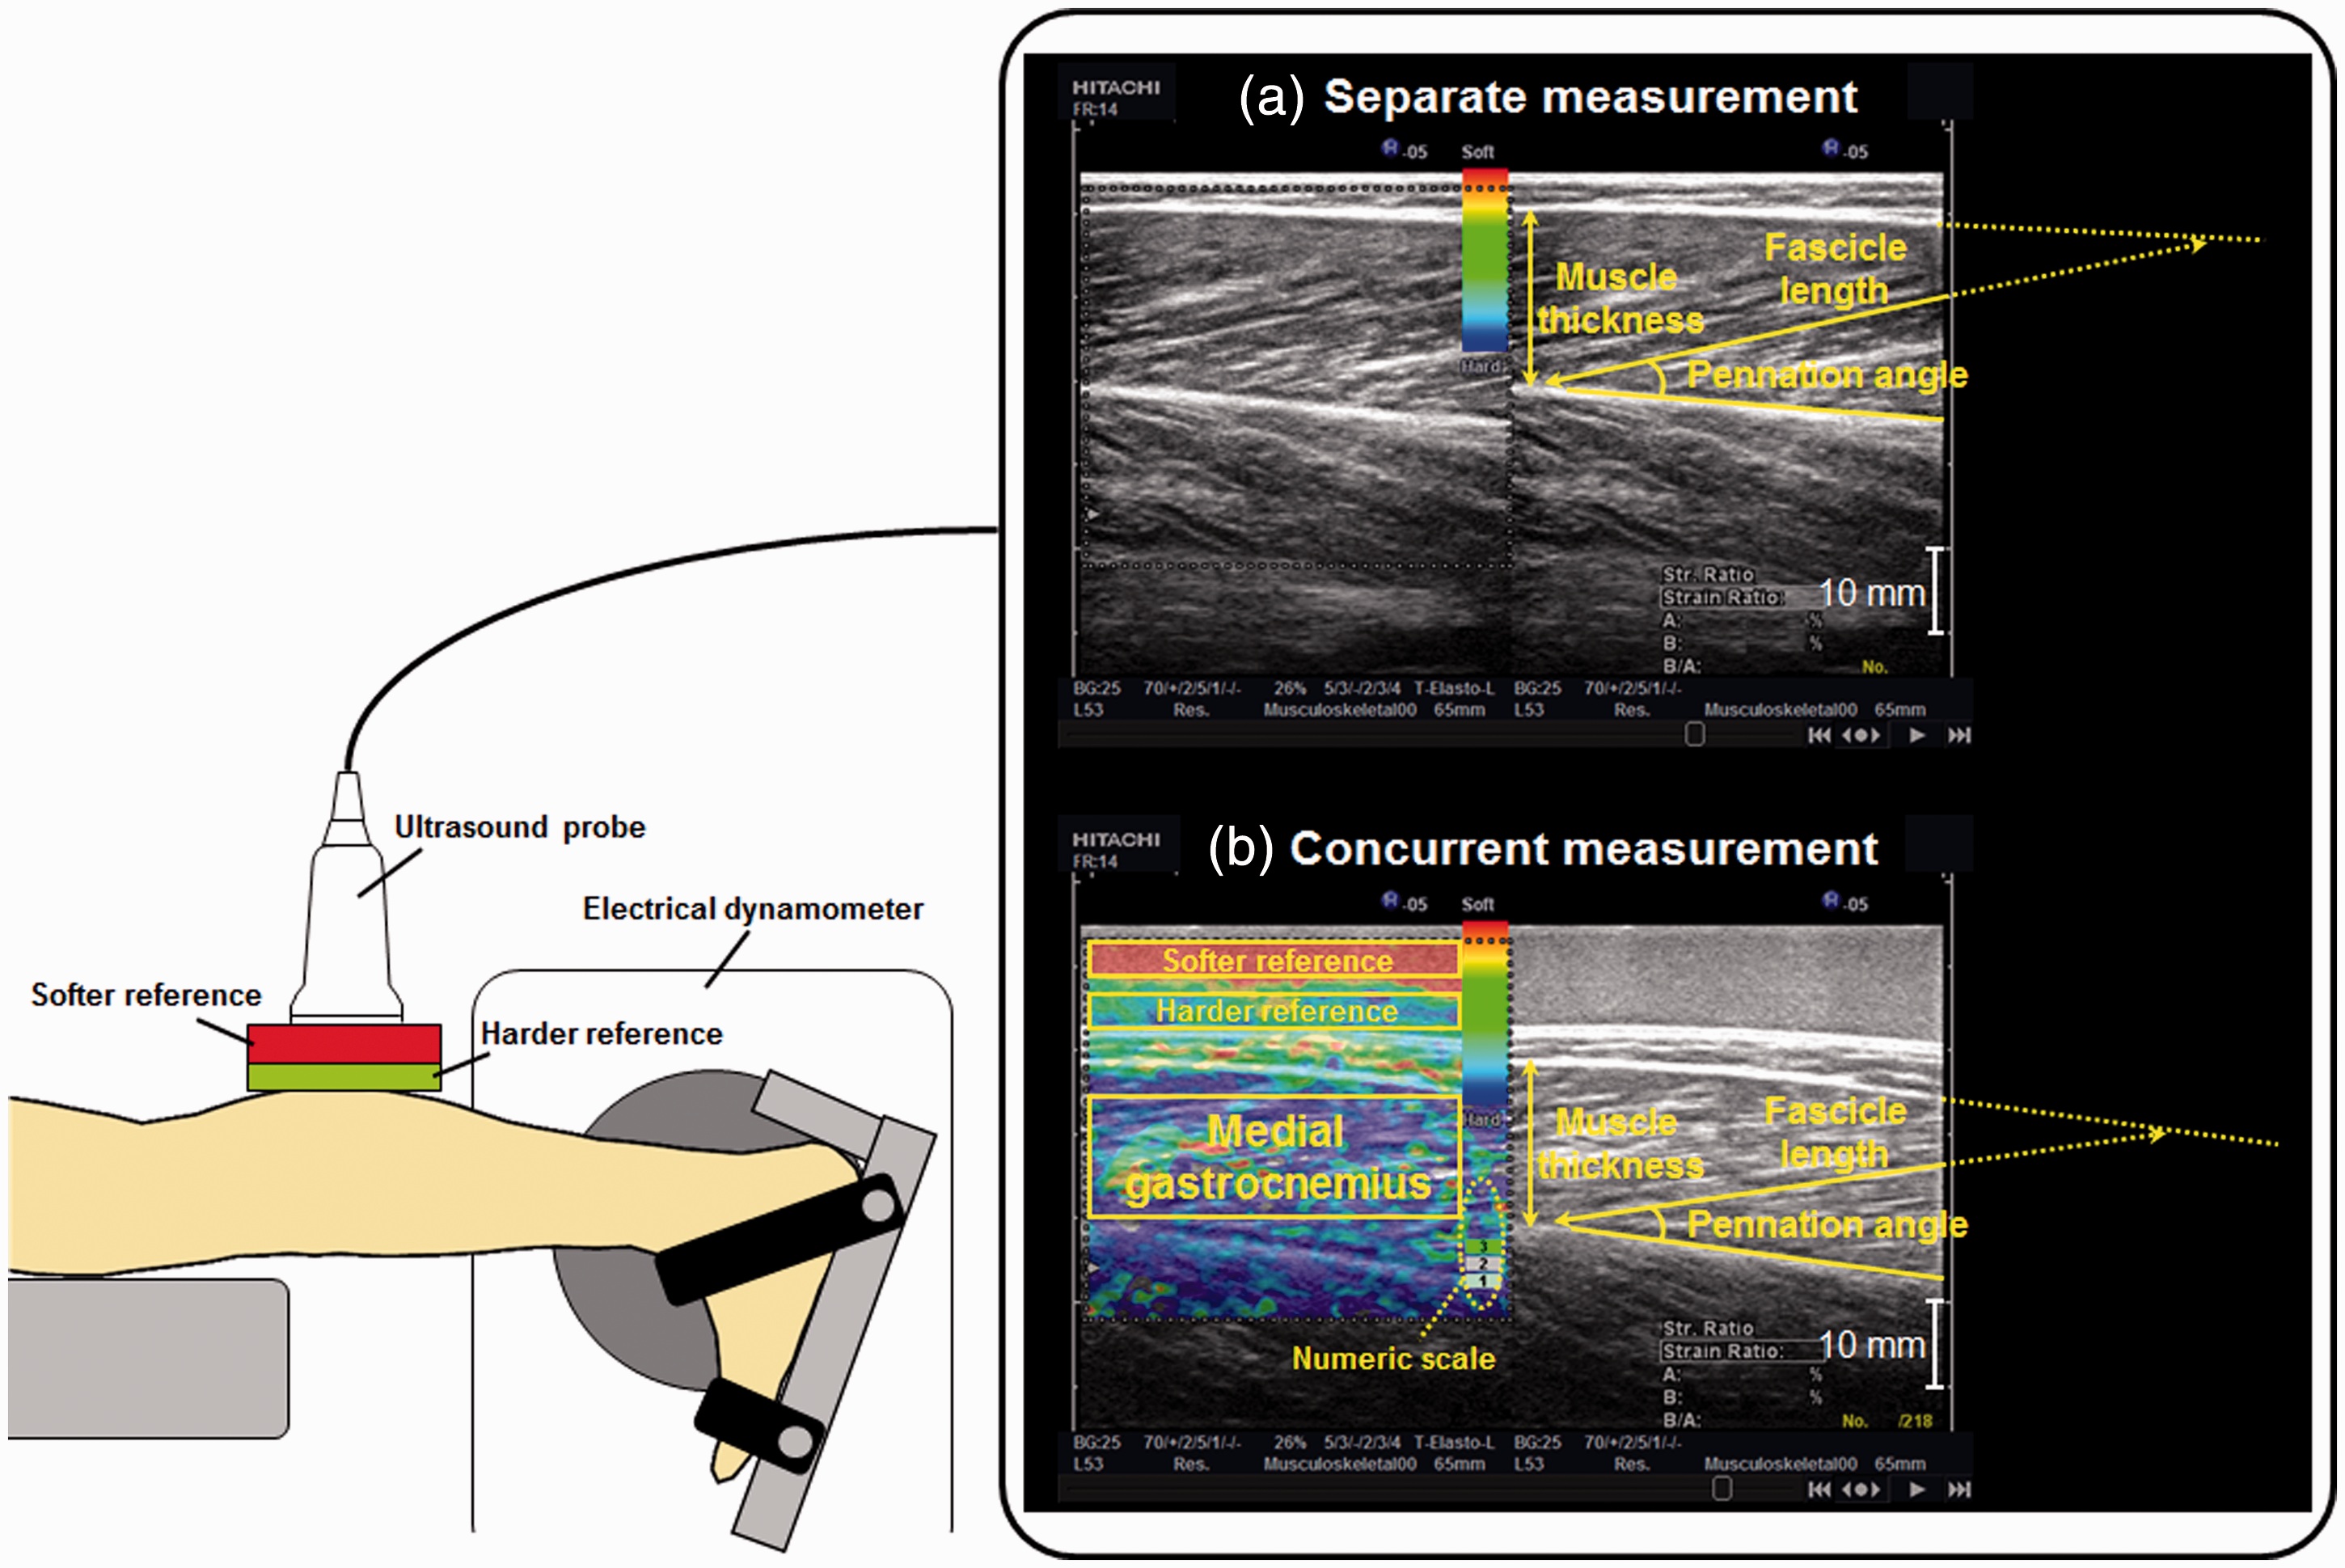
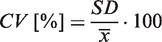
Concurrent measurements of muscle architecture and muscle hardness were performed by the same investigator, using the same ultrasound apparatus and probe for the separate measurements (Fig. 1b). The site of the ultrasound probe for the concurrent measurements was same as that for the concurrent measurements. Muscle hardness of the MG was measured as previously reported (16,17). Two commercially produced tissue-mimicking materials (OST Co., Ltd., Kashiwa-shi, Chiba, Japan) were used as reference standards for the measurements of muscle hardness. The Young’s moduli of these references were 7 kPa (softer reference) and 30 kPa (harder reference). The harder reference standard (width, 110 mm; depth, 60 mm; height, 5 mm) was placed on the skin surface, and the softer reference standard (width, 110 mm; depth, 60 mm; height, 10 mm) was placed on the harder reference standard. To obtain ultrasound strain elastograms, repetitive slight compression–relaxation cycles were applied to the references and MG using the handheld ultrasound probe. A maximum of 218 ultrasound images were stored at 14 Hz as cine loops in the memory of the ultrasound apparatus. The investigator selected one of the elastograms for further analysis based on the following criteria: (i) the velocity of the compression–relaxation cycles was 3 to 4 on a numeric scale of 1 to 7 (Fig. 1b), indicating an appropriate cycle velocity (10,20); (ii) the elastograms of the softer and harder reference standards did not comprise mixed colors, but were primarily a single color; (iii) color-coded elastogram images were obtained over the entire region of interest of the MG; and (iv) the B-mode ultrasound image was not blurred. The strains of the reference standards and the MG were evaluated using the built-in software of the ultrasound apparatus. The hardness of the MG was calculated by substituting its strain into the linear regression equation obtained from the relationship between the strain and hardness of the softer and harder reference standards. The reliability and validity of this method were confirmed by previous studies (16,17). Muscle hardness of the MG was measured twice, and the coefficient of variation (CV) of the two measured values was calculated by the following equation (21):
The subjects lay prone with their knee extended and their lower limb muscles relaxed (Fig. 1). The right foot was firmly secured to a footplate of an electrical dynamometer (Biodex System 3; Biodex Medical Systems, Shirley, NY, USA). The right ankle positions were arbitrarily set at DF20, N, and 30° plantar flexion (PF30). The separate and concurrent measurements were performed twice by one investigator (KC), experienced in both muscle architecture and muscle hardness measurements, at each ankle position.
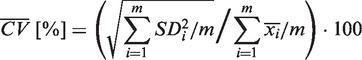
The intra-investigator reproducibility of the muscle architectural parameters and muscle hardness values was evaluated using the CV and intraclass correlation coefficient type 1,1 (ICC [1,1]). The average CV of all the subjects (
Results
Coefficient of variation (CV) and intraclass correlation coefficient type 1,1 [ICC(1,1)] for the separate and concurrent measurements. In the separate measurements, only muscle architectural parameters (muscle thickness, pennation angle, and fascicle length) were measured. In the concurrent measurements, both the muscle architectural parameters and muscle hardness were measured. All measurements were performed at three ankle positions: 20° dorsiflexion (DF20), neutral (N), and 30° plantar flexion (PF30). At each ankle position, two measurements were performed by one experienced investigator. The ranges of the CVs of the two values obtained are shown in parentheses.
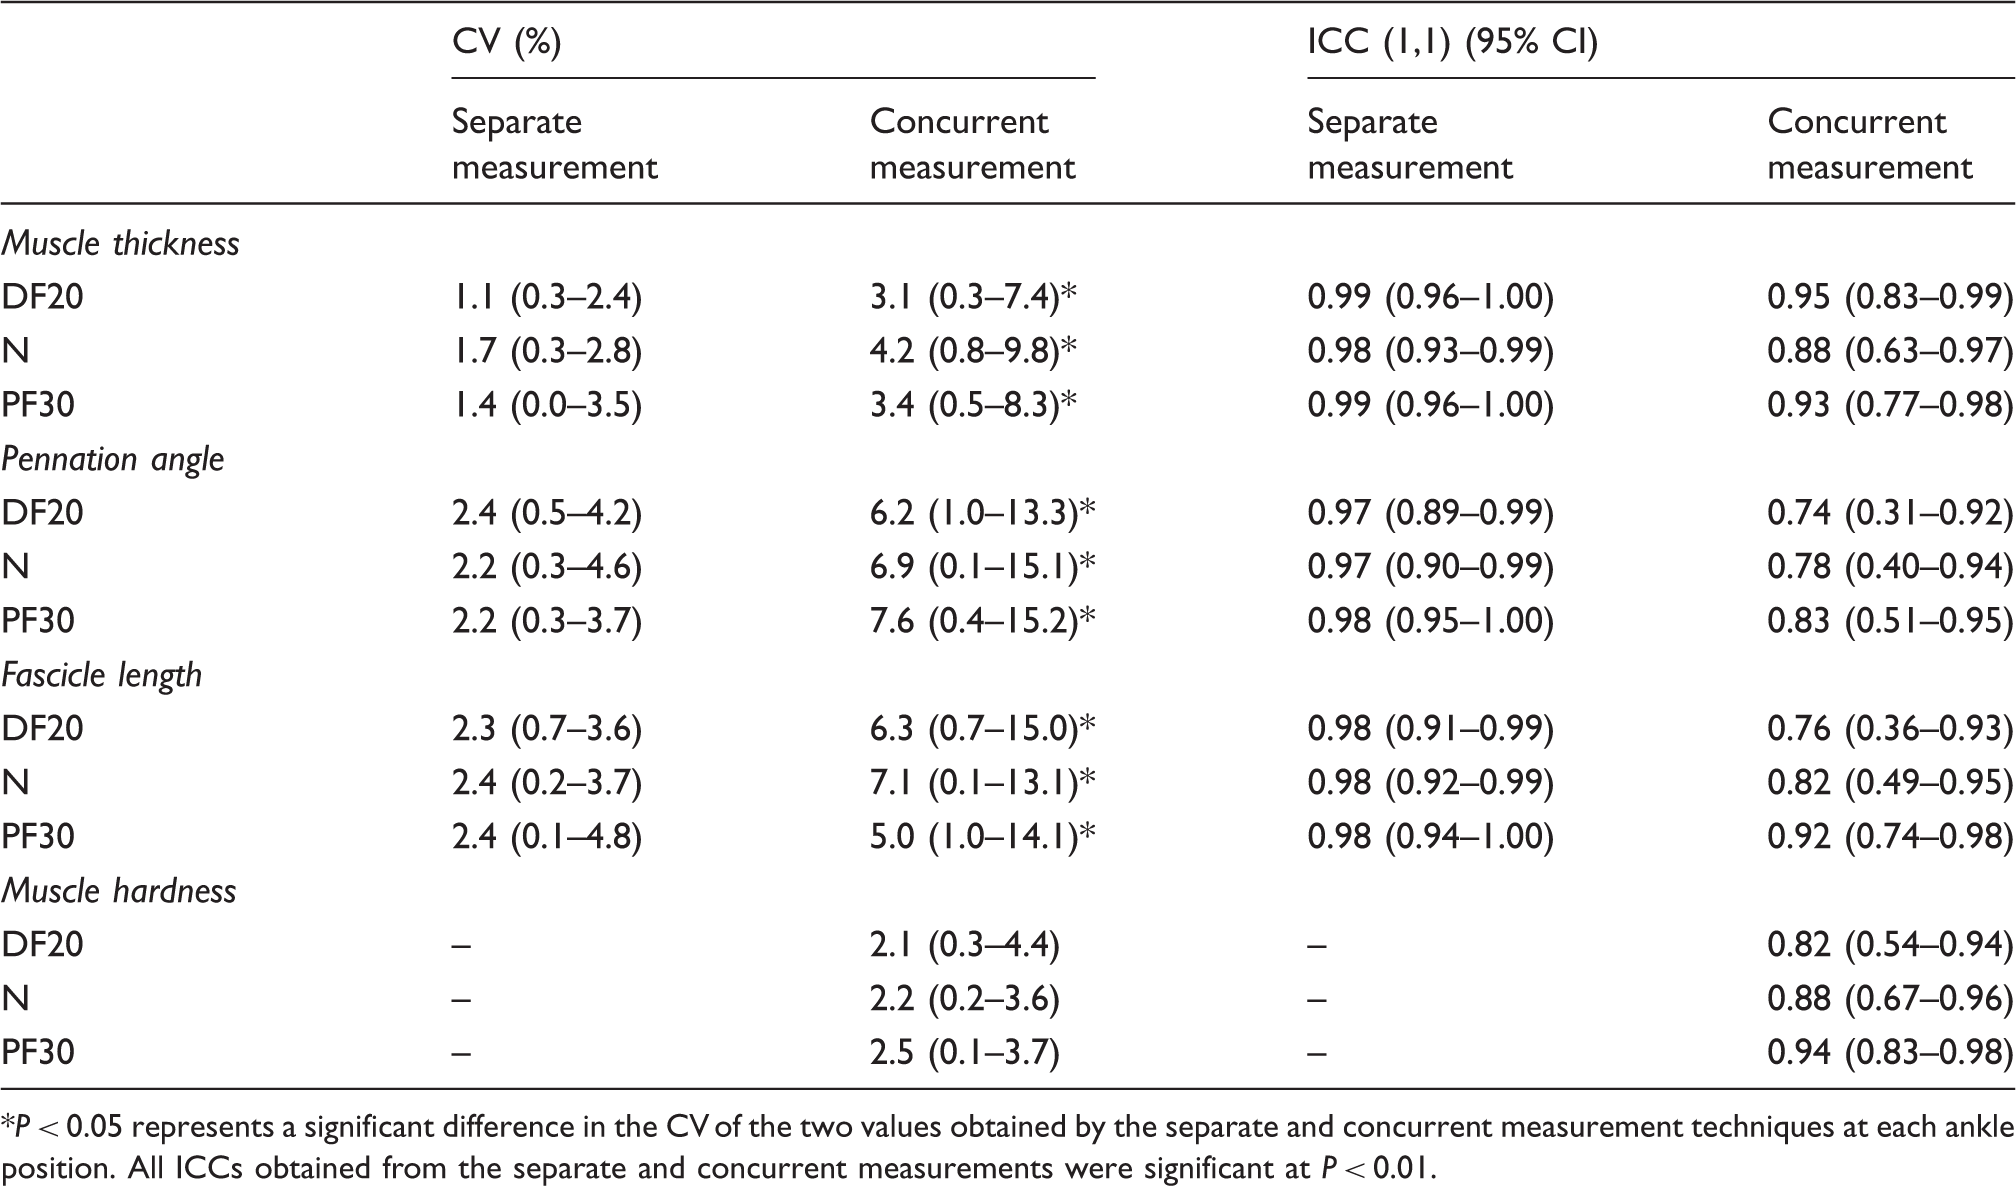
P < 0.05 represents a significant difference in the CV of the two values obtained by the separate and concurrent measurement techniques at each ankle position. All ICCs obtained from the separate and concurrent measurements were significant at P < 0.01.
Fig. 2 shows the muscle thickness, pennation angle, and fascicle length at DF20, N, and PF30 obtained from the separate and concurrent measurements. There were no significant differences in any of the architectural parameters between the values obtained by the separate and concurrent measurements. Using both measurement techniques, the muscle thickness at DF20 was significantly thicker than at PF30 (all P < 0.05), the pennation angle tended to increase from DF20 to N (all P < 0.1) and significantly increased from N to PF30 (all P < 0.001), and the fascicle length significantly decreased with plantar flexion of the ankle (all P < 0.001).
Muscle thickness, pennation angle, and fascicle length obtained from the separate and concurrent measurements. The average values and standard deviations of the architectural parameters are shown for each of three ankle positions: 20° dorsiflexion (DF20), neutral (N), and 30° plantar flexion (PF30). There were no significant differences in the values for these architectural parameters at each ankle position obtained using separate and concurrent measurements.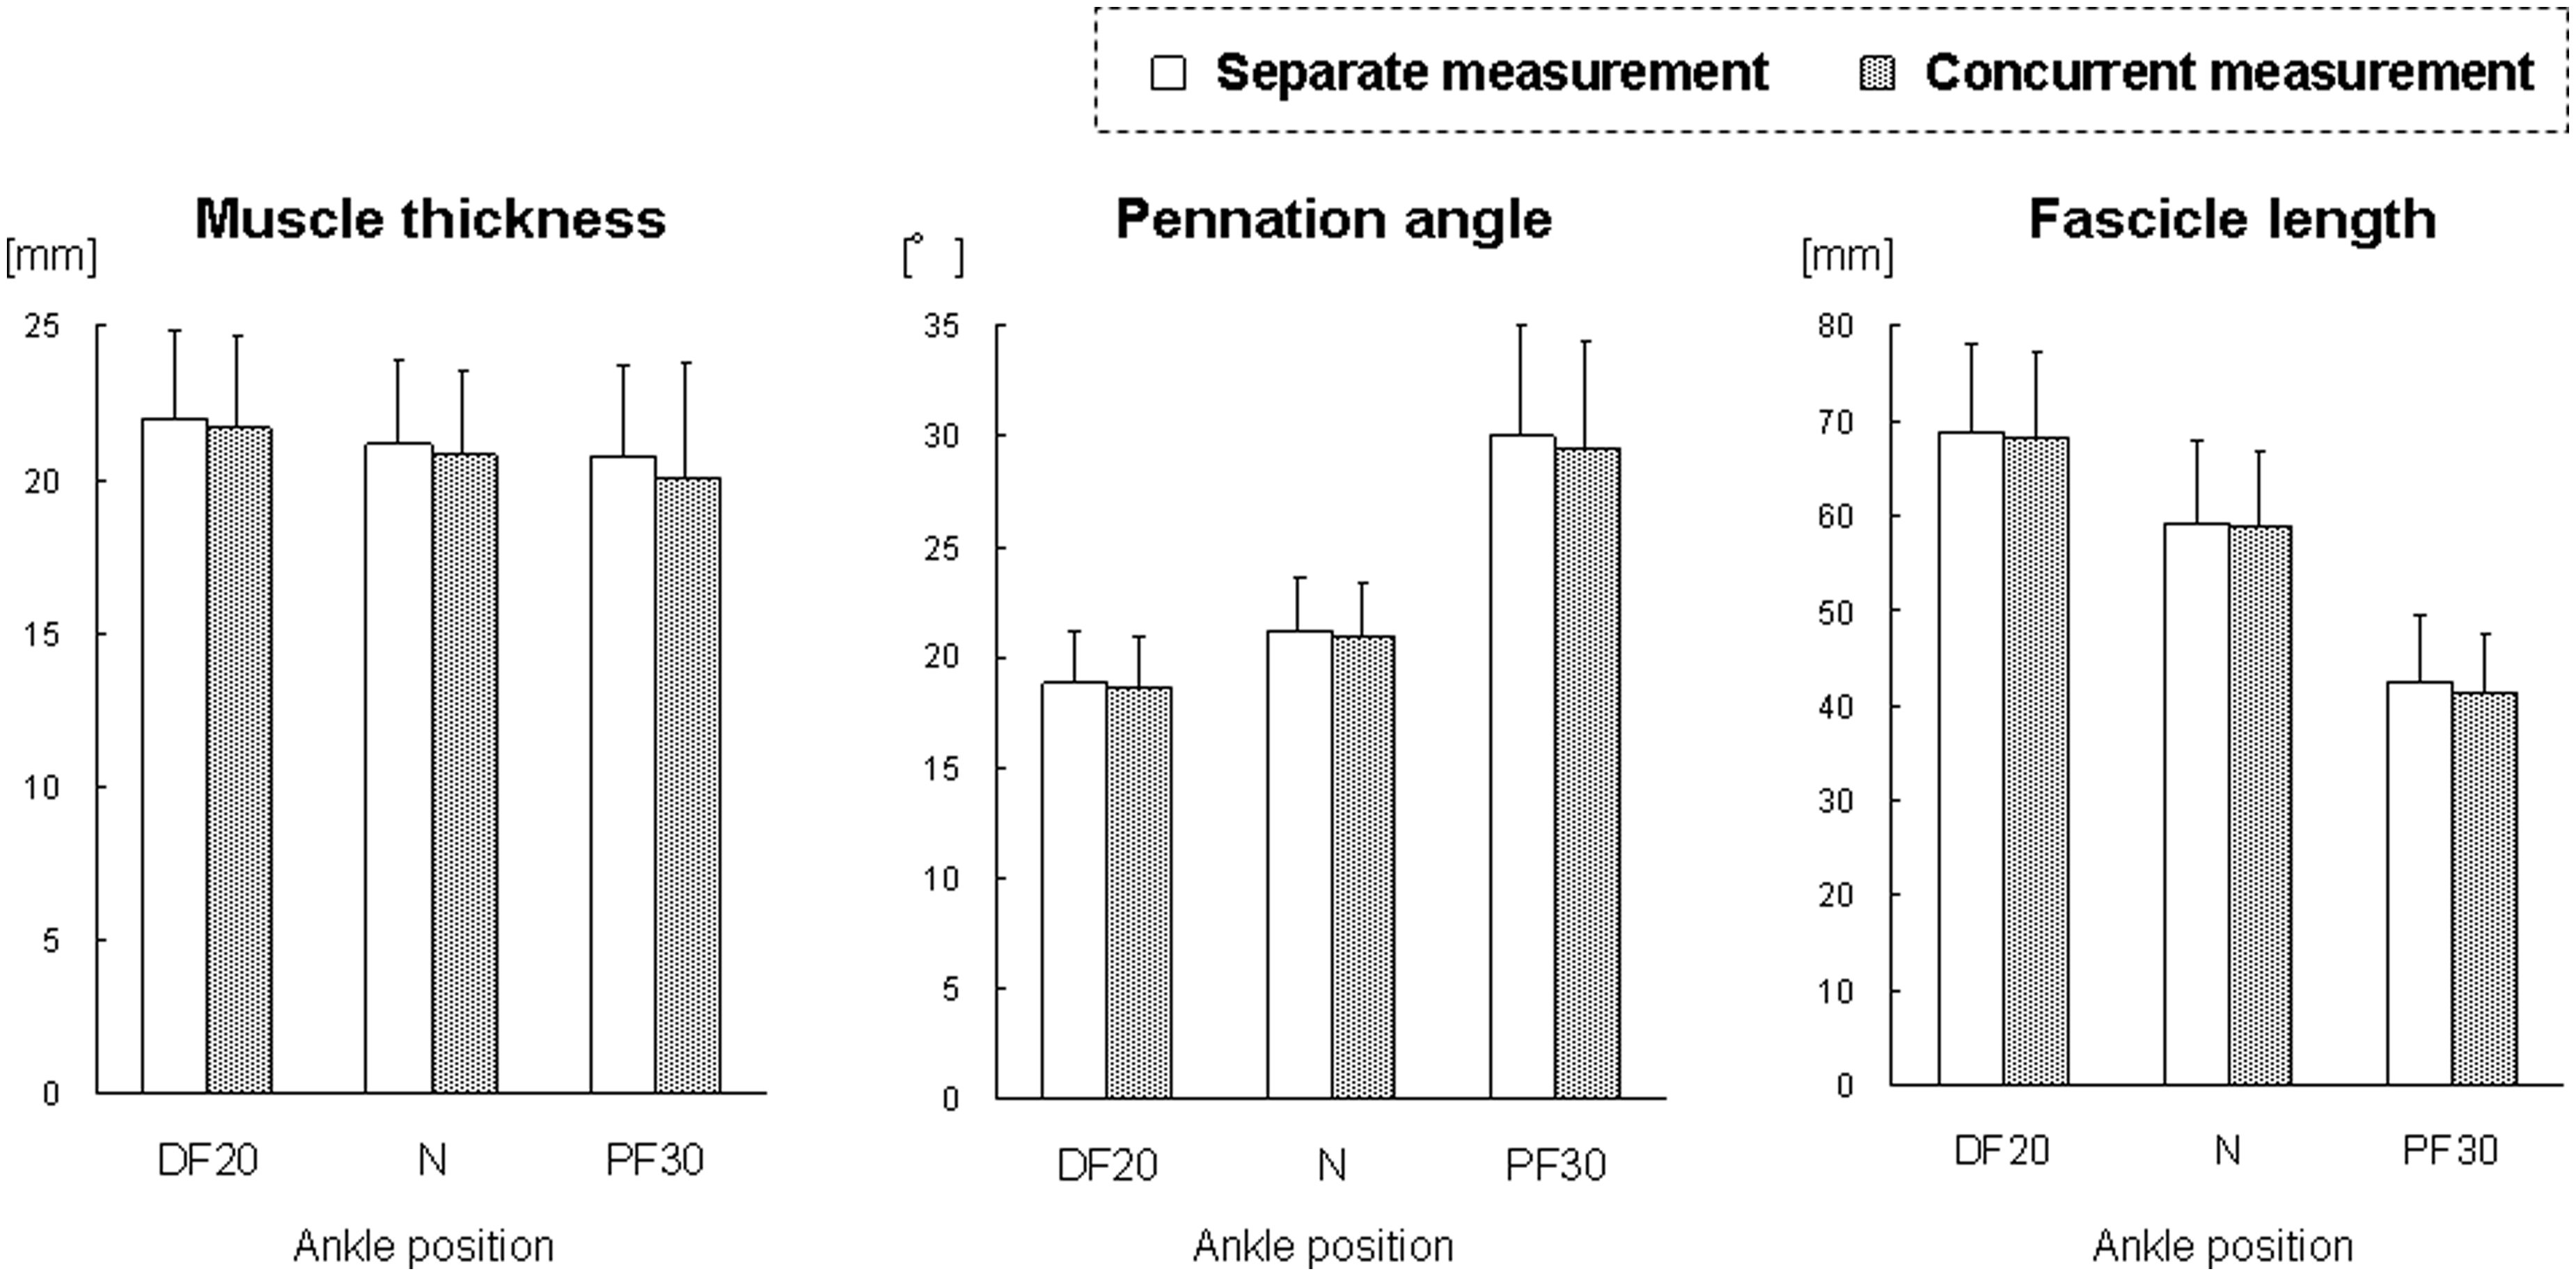
Discussion
In this study, we measured muscle architectural parameters concurrently with muscle hardness using ultrasound strain elastography. The CV for each muscle architectural parameter was significantly higher in the concurrent measurements than in the separate measurements (Table 1). In addition, the ICC (1,1) of each muscle architectural parameter was lower in the concurrent measurements than in the separate measurements (Table 1). However, there were no significant differences in the values obtained for each muscle architectural parameter between the separate and concurrent measurement techniques (Fig. 2).
The B-mode ultrasound images obtained from the concurrent measurement were not blurred, and the image quality was similar to that of the images obtained from the separate measurement (Fig. 1). This result indicates that sharp B-mode ultrasound images can be obtained even during the repetitive slight compression–relaxation cycles applied to obtain ultrasound strain elastograms. We stored ultrasound images at 14 Hz as cine loops in the memory of the ultrasound apparatus, and selected one for further analysis. Because of using the cine loop function, sharp B-mode ultrasound images are obtained. Although sharp B-mode ultrasound images were obtained in the concurrent measurements, the higher CVs and lower ICCs (1,1), that is, less reproducibility compared to the separate measurements was shown in the concurrent measurements (Table 1). In the concurrent measurements, fine adjustments of the imaging plane to obtain clear B-mode ultrasound images and proper compression–relaxation cycles to obtain stable ultrasound strain elastograms have to be performed concurrently by the investigator using the handheld probe. Such technical difficulties may be the source of differences in the imaging planes between the two measurements, and the differences in the imaging planes may lead to lower reproducibility of the concurrent measurements. Regardless of the lower reproducibility of the concurrent measurements, the values for muscle thickness, pennation angle, and fascicle length obtained from the concurrent measurements were not significantly different from those obtained from the separate measurements (Fig. 2). However, especially in longitudinal investigations, we recommend that one B-mode image is saved as a separate measurement while performing the initial scan to determine the probe position for concurrent measurements. This would allow the separate B-mode image to be used as a reference image if the concurrent measurements show low reproducibility.
There were no significant differences in the muscle thickness values obtained by the separate and concurrent measurements (Fig. 2), which indicates that compression with the ultrasound probe did not decrease the measured muscle thickness. A significant decrease in muscle thickness from DF20 to PF30 was observed not only in the concurrent measurements, but also in the separate measurements (Fig. 2). Therefore, this decrease in muscle thickness from DF20 to PF30 was not due to compression with the ultrasound probe, but to deformation of the MG caused by a change in the ankle position.
Muscle thickness, pennation angle, and fascicle length of the MG at a neutral ankle position have been reported at 12–24 mm, 18–23°, and 54–57 mm, respectively (2). In a previous study (4), changing the ankle position from 15° dorsiflexion to 30° plantar flexion resulted in an increase in the pennation angle of the MG and a decrease in its fascicle length. These absolute values and their changes are similar to those observed in the present study (Fig. 2). In this study, we found that the muscle hardness of the MG was about 30 to 40 kPa and significantly decreased with plantar flexion of the ankle. These absolute values and their changes with ankle position changes are similar to those reported in previous studies that also measured the muscle hardness of the MG using ultrasound strain elastography (16,17). Thus, the values for the muscle architectural parameters and muscle hardness obtained in this study can be considered reasonable.
The actual values for the architectural parameters (muscle thickness, pennation angle, and fascicle length) did not significantly differ between the separate and concurrent measurements.
In conclusion, the measurement of muscle architecture concurrently with muscle hardness using ultrasound strain elastography is feasible, and this combined technique is an efficient way to assess muscle condition.
Footnotes
Funding
This study was supported by the Sports Medicine/Science Research Program (Conditioning Research Project) of the Japan Institute of Sports Sciences and a Grant-in-Aid for Young Scientists (B) (Grant Number: 24700695) from the Japan Society for the Promotion of Science.