






Abstract
Background
Central neurocytoma was initially believed to be benign tumor type, although atypical cases with more aggressive behavior have been reported. Preoperative estimation for proliferating activity of central neurocytoma is one of the most important considerations for determining tumor management.
Purpose
To investigate predictive values of image characteristics and quantitative measurements of minimum apparent diffusion coefficient (ADCmin) and maximum standardized uptake value (SUVmax) for proliferative activity of central neurocytoma measured by MIB-1 labeling index (LI).
Material and Methods
Twelve cases of central neurocytoma including one recurrence from January 2001 to December 2011 were included. Preoperative scans were conducted in 11, nine, and five patients for computed tomography (CT), diffusion-weighted imaging (DWI), and fluorine-18-fluorodeoxyglucose positron emission tomography (FDG-PET), respectively, and ADCmin and SUVmax of the tumors were measured. Image characteristics were investigated using CT, T2-weighted (T2W) imaging and contrast-enhanced T1-weighted (T1W) imaging, and their differences were examined using the Fisher's exact test between cases with MIB-1 LI below and above 2%, which is recognized as typical and atypical central neurocytoma, respectively. Correlational analysis was conducted for ADCmin and SUVmax with MIB-1 LI. A P value <0.05 was considered significant.
Results
Morphological appearances had large variety, and there was no significant correlation with MIB-1 LI except a tendency that strong enhancement was observed in central neurocytomas with higher MIB-1 LI (P = 0.061). High linearity with MIB-1 LI was observed in ADCmin and SUVmax (r = −0.91 and 0.74, respectively), but only ADCmin was statistically significant (P = 0.0006).
Conclusion
Central neurocytoma had a wide variety of image appearance, and assessment of proliferative potential was considered difficult only by morphological aspects. ADCmin was recognized as a potential marker for differentiation of atypical central neurocytomas from the typical ones.
Keywords
Introduction
Central neurocytoma is a rare low grade tumor of the central nervous system, which was first described by Hassoun et al. in 1982 (1). It is composed of uniform round cells with neuronal differentiation constituting approximately 0.25–0.5% of all intracranial tumors. It occurs typically in young adults and is located in the lateral or third ventricle around the foramen of Monro (2). The clinical course of central neurocytomas was initially believed to be benign, however, more aggressive behavior including rapid tumor progression, recurrence, extra-ventricular extension, and craniospinal dissemination has been described (3,4). The term atypical central neurocytoma has been proposed for an aggressive variant, which is classified if MIB-1 (Immunotech, Marseilles, France) labeling index (LI), an index of cellular proliferation, is higher than 2% (5) or atypical histologic features of focal necrosis, vascular proliferation, and increased mitotic activity are observed (6). MIB-1 is a monoclonal antibody to Ki-67 antigen that is a nuclear protein associated with cellular proliferation.
For patients with an atypical central neurocytoma, complete resection is the best treatment for better local control and survival (7). Therefore, preoperative estimation for proliferating activity of a central neurocytoma is one of the most important considerations for determining the appropriate surgical strategy. There are some reports discussing imaging features of the central neurocytoma. They reported varying degrees of contrast enhancement with or without cystic appearance and calcification of tumors (8,9), but focused mainly on differentiating neurocytomas from other intraventricular tumors. The relationship between proliferative potential and morphological imaging findings has not been clarified.
As quantitative imaging marker of malignancy, diffusion-weighted imaging (DWI) provides further physiologic information as apparent diffusion coefficient (ADC), which is helpful in grading brain tumors (10,11) including central neurocytoma (12). ADC correlates with tumor cellularity, prognosis, and MIB-1 LI in gliomas (13–15). Standardized uptake value (SUV) measured by 18F-fluorodeoxyglucose-positron emission tomography (FDG-PET) reflects increased glucose metabolism and correlates with histological grade of gliomas (16). Mineura et al. reported rapid regrowth of central neurocytoma that increased the cerebral metabolic rate of glucose (17). Ohtani et al. reported a case of central neurocytoma with intense FDG uptake, which had a high MIB-1 LI and atypical pathological features (18). These cases indicate that SUV may also predict the proliferation potential of central neurocytomas. However, preoperative estimation of the proliferative activity of the central neurocytoma has not been conducted.
Therefore in this study, we investigated if image characteristics and quantitative values of ADC and SUV could distinguish central neurocytomas with MIB-1 LI higher than 2% from those with lower values.
Material and Methods
This study was approved by institutional review board, and informed consent was waived, because retrospective analysis was conducted.
Patients
Characteristics of the patients and tumor images.

3V, third ventricle; Gd-T1WI, gadolinium-enhanced T1-weighted imaging; LtLV, left lateral ventricle; n.a., not applicable; RtLV, right lateral ventricle; T2WI, T2-weighted imaging.
CT imaging
CT images were obtained parallel to the orbitomeatal line. Resolutions of all CT images were 0.4 × 0.4 × 7–8 mm.
MRI
MR scans were conducted with 1.5 T scanners for six patients (patients 1, 3, 4, 4′, and 6 with MAGNETOM Symphony, Siemens Medical Systems, Erlangen, Germany; patients 2 and 5 with Signa Genesis, GE Healthcare, Milwaukee, WI, USA) and 3 T scanners for five patients (patients 7, 8, and 9 with MAGNETOM Trio; patients 10 and 11 with MAGNETOM Skyra, Siemens Medical Systems, Erlangen, Germany). In addition to conventional axial T1-weighted (T1W) imaging (TR/TE, 450–616/8.1–12 ms) and T2-weighted (T2W) imaging (TR/TE, 3180–7960/93–130 ms), contrast-enhanced axial T1W images were acquired after administration of the gadolinium contrast agent (0.1 mmol/kg) in 11 cases. DWI was acquired in nine cases with in-plane resolution = 0.69–1.38 mm and slice thickness/spacing = 3–5/1–1.5 mm using a single-shot echo-planar sequence with motion-probing gradients (b = 0, 1000 s/mm2) applied in three orthogonal directions, and ADC map was calculated.
PET imaging
FDG-PET scans were conducted using a PET scanner for one patient and a PET/CT scanner for four patients (patient 4′ with Advance; patients 8 to 11 with Discovery ST Elite, GE Healthcare, Waukesha, WI, USA). Patients fasted for at least 4 h prior to the scans. After intravenous administration of 4 MBq/kg of FDG, patients rested in a waiting room for 30 min. Emission scans of the brain were conducted for 15 min. Resolutions were 2.0 × 2.0 × 4.25 mm (35 slices) and 2.0 × 2.0 × 3.27 mm (47 slices), respectively, for the scanners.
Image analysis
Appearance of the tumors was reviewed with regard to location, size, calcification on CT image (present/absent: if present, distribution = diffuse or patchy; density = faint or dense), cystic components on T2W imaging (distribution = diffuse or partial; uniformity = uniform or non-uniform; size = small or large), and degree of enhancement on contrast-enhanced T1W imaging (degree = none to slight or moderate to marked; homogeneity = homogeneous or heterogeneous), and categorized by two board-certified neuroradiologists in consensus (RS and TK, both with experience in diagnostic imaging for 8 years).
For quantitative analysis, regions of interest (ROIs) were defined independently by two neuroradiologists (RS and TK) at different areas (2 to 3 areas) within the tumors of the ADC maps and SUV images (ROI size, 50–361 mm2 and 114–513 mm2, respectively) using free software (MRIcro, http://www.mccauslandcenter.sc.edu/mricro/, provided by Chris Rorden, Neuropsychology Lab, Columbia SC, USA).. Care was taken to exclude macroscopic calcifications and cysts on each modality referencing to CT image and T2W imaging. From the values of the ROIs, minimum ADC (ADCmin) and maximum SUV (SUVmax) were extracted.
Proliferative activity
Proliferative activity was measured as MIB-1 LI in formalin-fixed paraffin embedded pathological specimens with immuno-histochemical staining using MIB-1 monoclonal antibody. Areas with highest number of positive nuclei were identified, and a minimum of 1000 cells were counted in each tissue section (by YM, a board-certified pathologist majoring in surgical neuropathology). MIB-1 LI was defined as the percentage of tumor cells which stained positively for Ki-67 nuclear antigen.
Statistical analysis
Intra-class correlation coefficients (ICCs) for measured values in the ROIs were evaluated. Image characteristics were compared between two tumor groups with MIB-1 LI lower to equal to or higher than 2% using Fisher's exact test. ADCmin and SUVmax values were assessed by linear regression analyses with values of MIB-1 LI. ROC analysis was conducted to investigate differential capability of atypical central neurocytomas from typical ones, when there was a significant correlation. A P value <0.05 was considered statistically significant. Statistical analyses were conducted using commercially available software (MedCalc, version 12.4.0; MedCalc Software, Acacialaan 22, B-8400 Ostend, Belgium).
Results
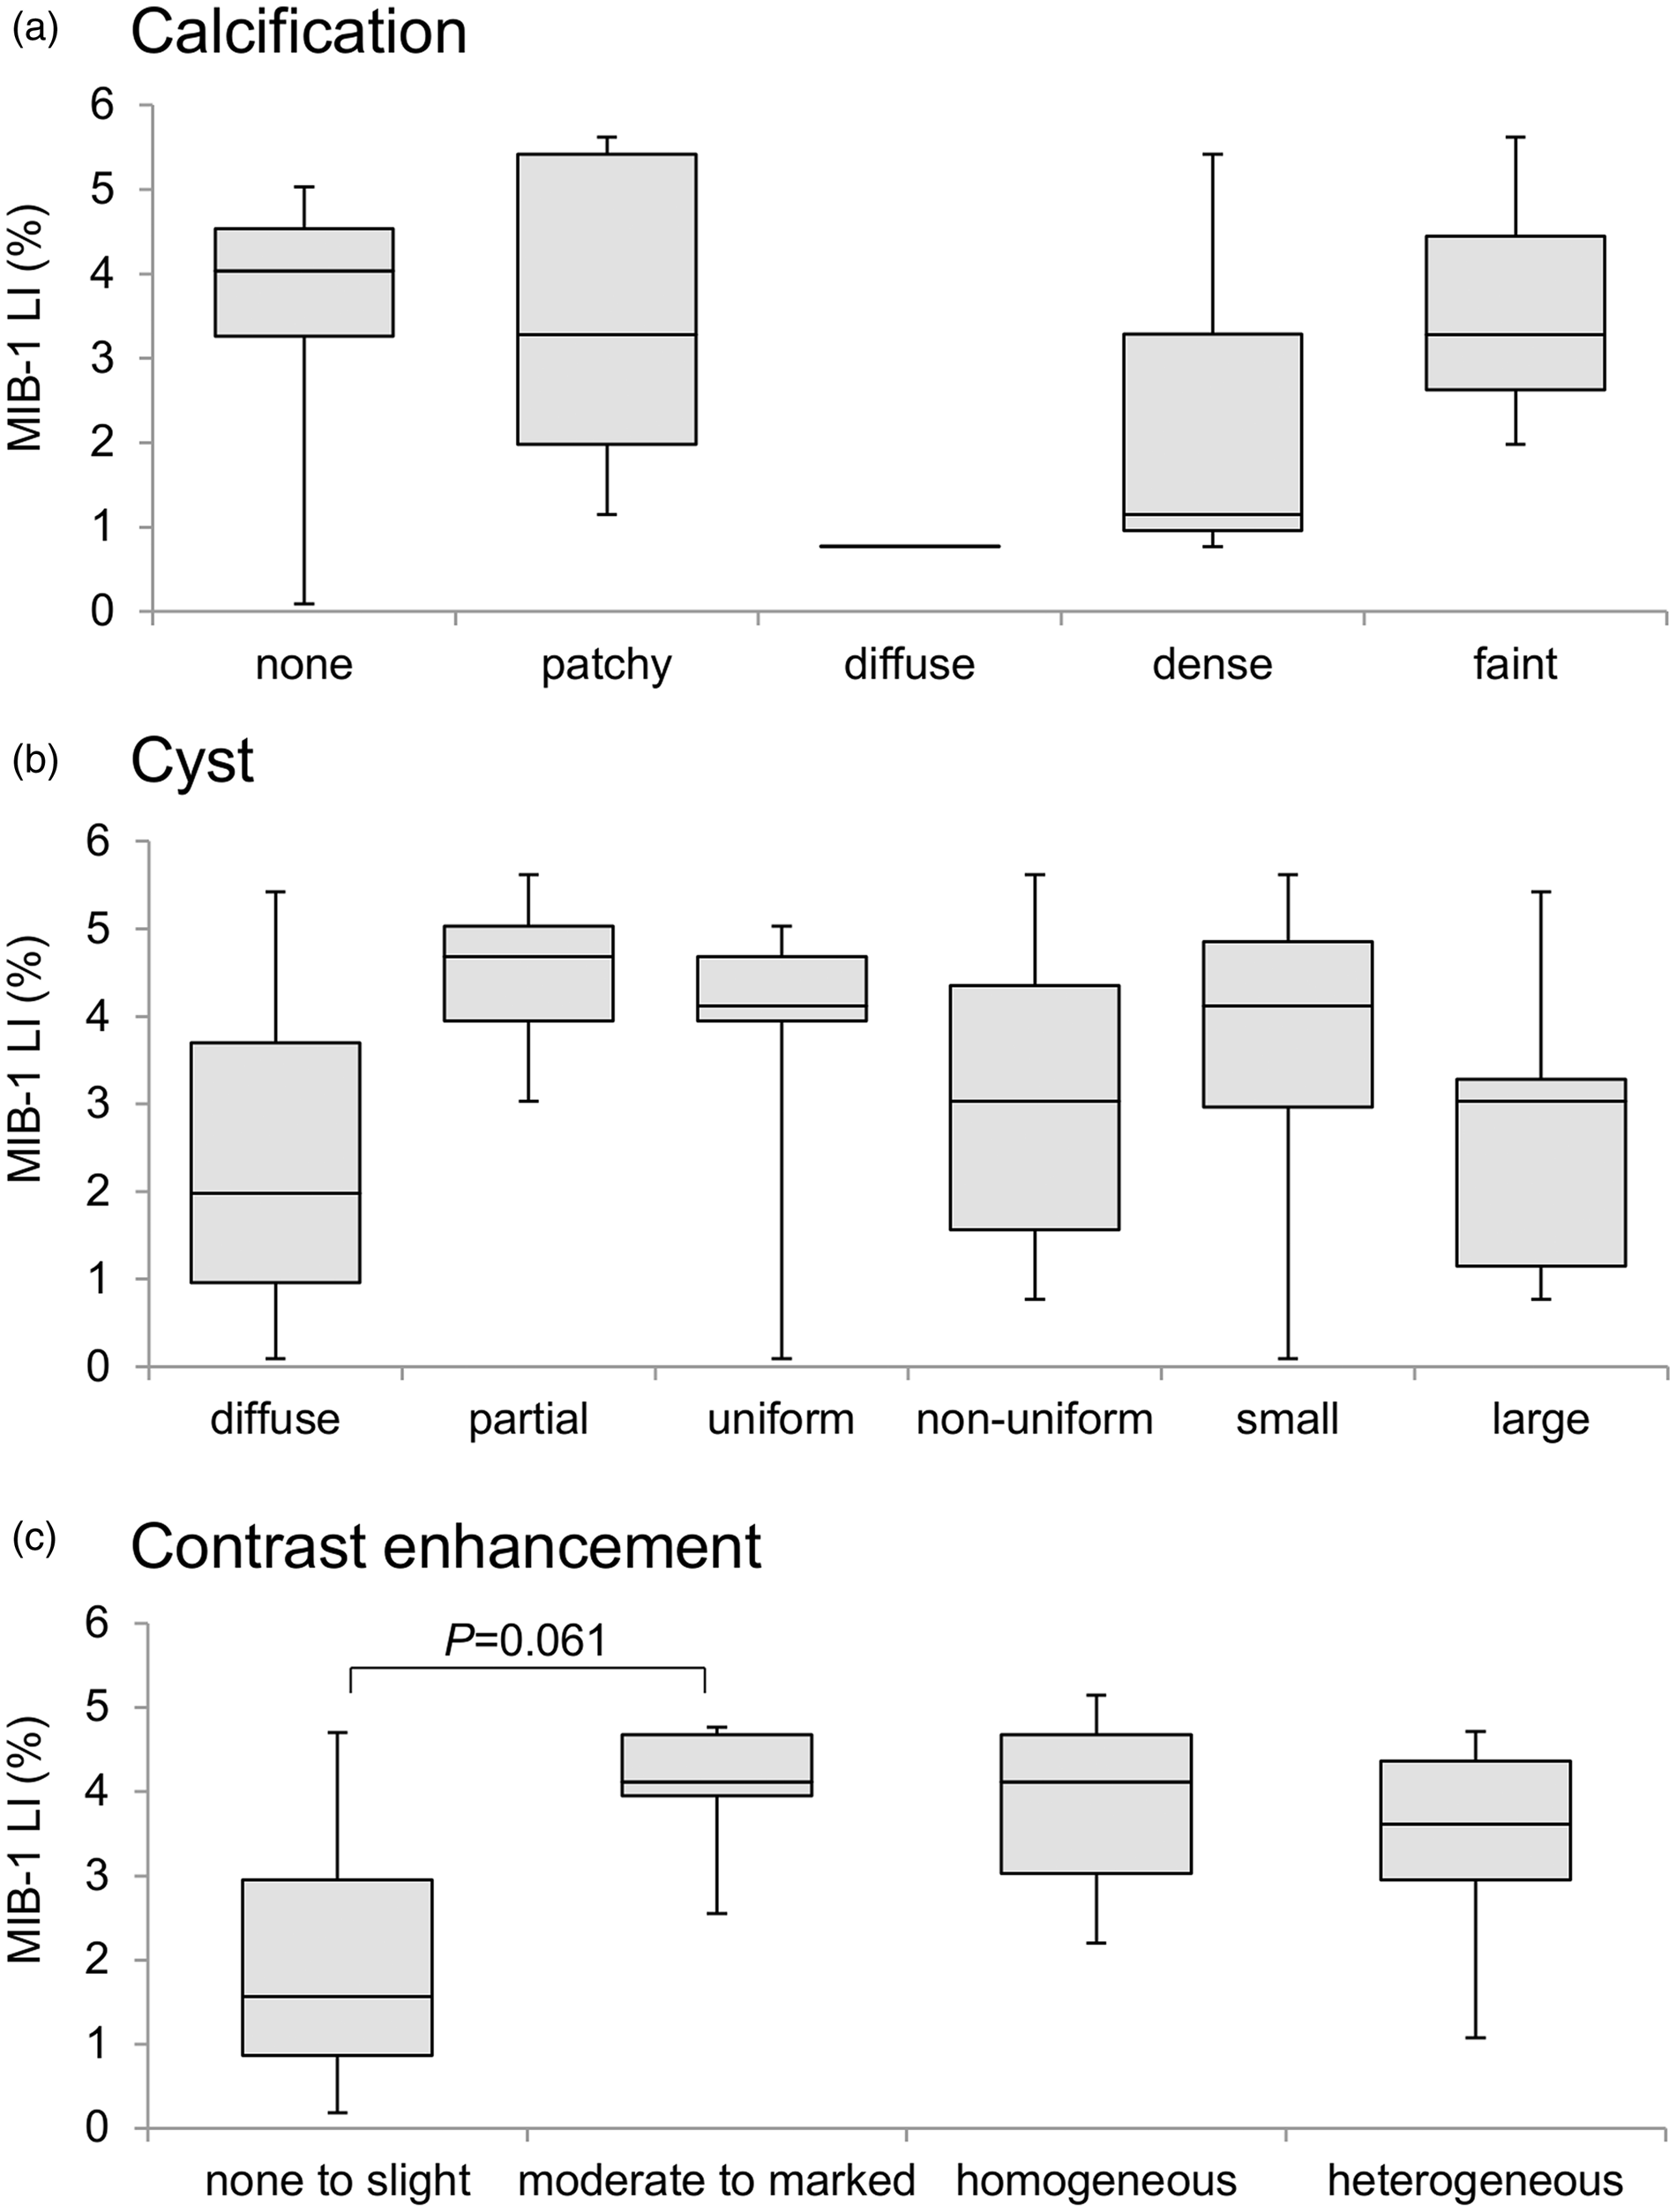
Characteristics of the patients and tumor images are summarized in Table 1. All of the tumors were located in the lateral ventricle and had an attachment to the ventricular wall or septum pellucidum. CT scans showed calcifications of variable density and distribution. Almost all tumors had heterogeneous appearance with solid portions and cysts that were variable in number and size. MRI showed that most tumors were iso- to hypo-intense on T1W imaging and hyper-intense on T2W imaging. Contrast enhancement of tumors was homogenous or heterogeneous, and degree of enhancement varied. Six tumors showed none to slight enhancement and five tumors had moderate to marked enhancement. It was a tendency that strong enhancement was observed in tumors with higher MIB-1 LI (P = 0.061). There was no significant difference in other image characteristics. Fig. 1 shows representative case images (patient 10) and Fig. 2 visually summarizes image characteristics.
A representative case of a central neurocytoma located at the left lateral ventricle (patient 10). Diffusely distributed small cysts on T2W imaging (a) and moderately enhanced solid portion on contrast-enhanced T1W imaging (b) are noted. Calcification is not identified on CT (c). Box plots show the relationship of MIB-1 LI values with the following image characteristics: (a) calcification on CT (none or present, patchy or diffuse, and dense or faint), (b) cysts on T2W imaging (diffuse or partial, uniform or non-uniform, and small or large), and (c) contrast enhancement on T1W imaging (none to slight or moderate to marked, and homogeneous or heterogeneous). Image characteristics of tumors varies greatly and only the difference in contrast enhancement between none to slight and moderate to marked is marginally significant (P = 0.061) between tumors with MIB-1 LI lower or higher than 2% using Fisher's exact test.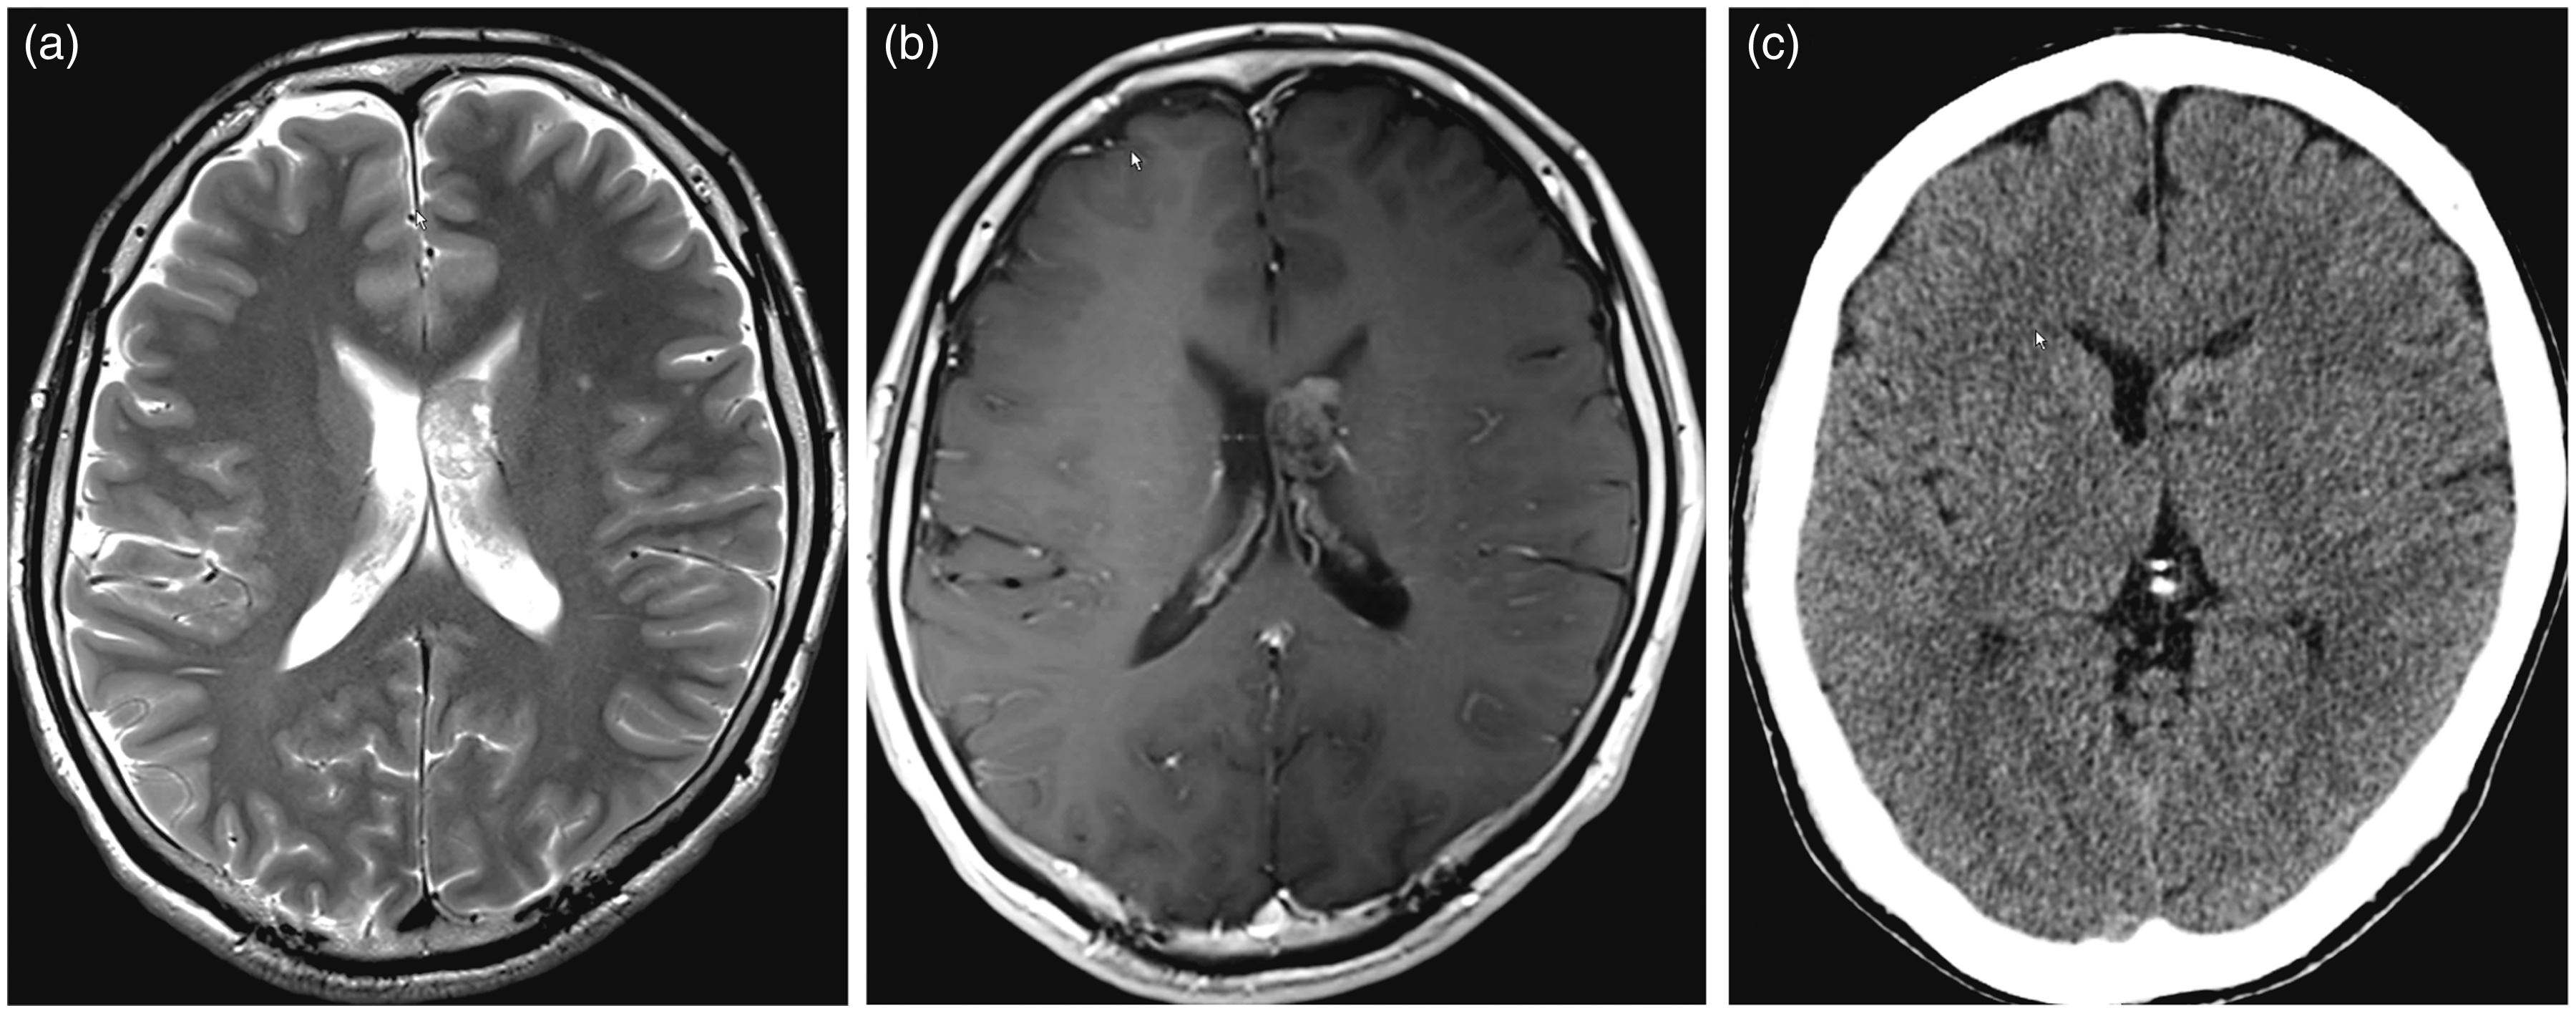
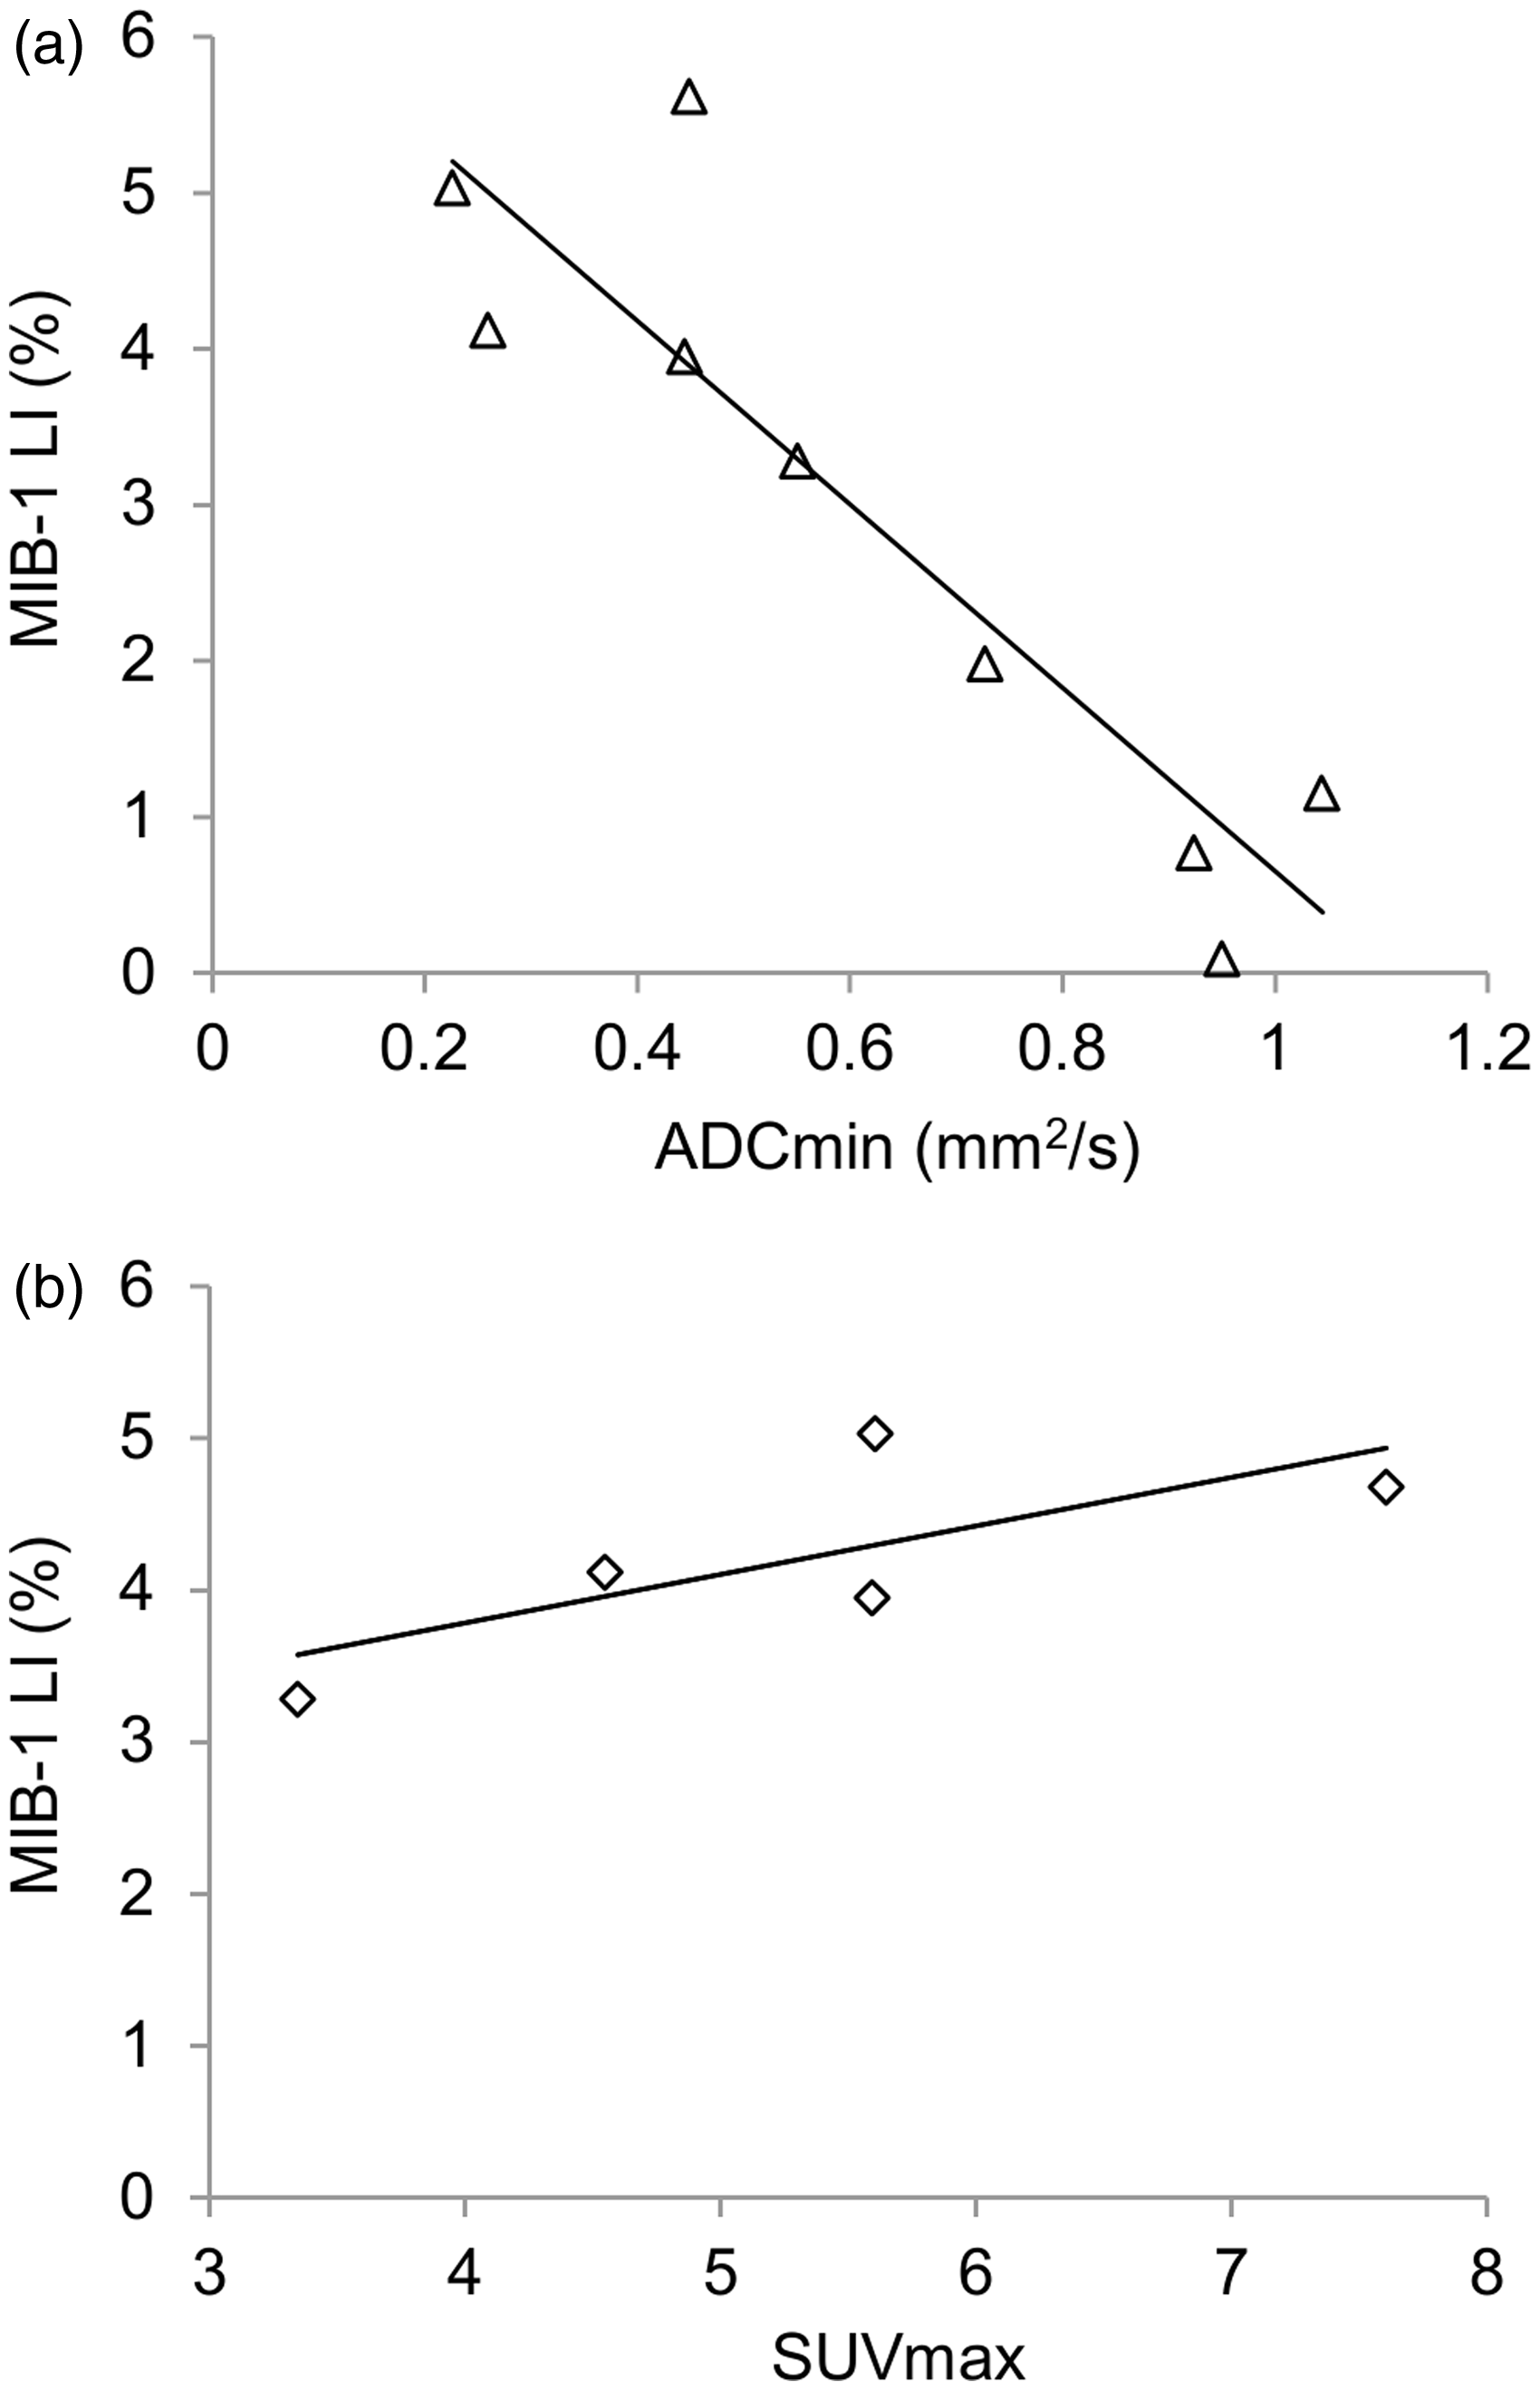
The quantitative values of MIB-1 LI, ADCmin, and SUVmax are listed in Table 2. Fig. 3 shows DWI, ADC map, and FDG-PET/CT images of a representative case. MIB-1 LI was in the range of 0.09–5.62% (mean ± SD, 3.26 ± 1.88%). Four tumors had MIB-1 LI lower than 2%, and eight tumors had those higher than 2%. ICCs of the ROI analyses were 0.97 for ADCmin and 0.96 for SUVmax, which means excellent agreements. ADCmin values ranged from 0.23 to 1.05 × 10⁻³ mm2/s, and significant linear correlation was observed with MIB-1 LI (r = −0.91, P = 0.0006). ROC analysis showed that atypical central neurocytomas could be differentiated from typical ones with 100% sensitivity (95% CI, 47.8–100.0%) and 100% specificity (39.8–100.0%), when the threshold value of ADCmin was set at 0.55 × 10⁻³ mm2/s (P <0.0001). The SUVmax was in the range of 3.35–7.61. The values had high correlation with MIB-1 LI (r = 0.74), but it was not significant (P = 0.15). These linear relationships are presented in Fig. 4.
The solid portion of the tumor in the representative case shows high signal on DWI (a) and restricted diffusion on ADC map, where a ROI for ADCmin is drawn (b). A ROI for SUVmax is defined at the same location on FDG-PET (c), referring to simultaneously acquired CT image (d). (a) Linear regression analyses shows significant negative correlation (r = −0.9) between ADCmin and MIB-1 LI (P = 0.0006). (b) There is high correlation between SUVmax and MIB-1 LI (r = 0.74), but it is not statistically significant (P = 0.15). MIB-1 LI, ADCmin, and SUVmax of the central neurocytomas. ADCmin, minimum value of ADC in the tumor ROI; MIB-1 LI, MIB-1 labeling index; n.a., not applicable; SUVmax, maximum of SUV.

Discussion
Although central neurocytomas have been considered indolent, there are some cases with aggressive biologic behavior including postoperative rapid regrowth (19,20). Among many pathologic features, elevated MIB-1 LI correlates with an increased recurrence rate and poor outcome (5,21) and is thought to be a reliable immune-histopathologic marker (5). No significant correlation was found between other histopathologic characteristics and clinical outcome (22,23). In this study, a large variety was observed in calcification and cystic changes, and only strong enhancement suggested increased proliferative potential as in the former case reports (24,25).
Our result of MIB-1 LI is congruent with the previous reports ranging from less than 0.1 to 11.2% (5,21,23). There was a significant negative linear correlation between MIB-1 LI and ADCmin as in other types of brain tumors (13). ADC values have an inverse relationship with tumor grades (10,26), and poor survival has been reported in malignant glial tumors with lower ADCmin (14,27). Our result indicates that lower ADCmin reflects malignant potential of central neurocytomas. In the case of patient 4, the tumor had a high MIB-1 LI (5.62%) with a lower ADCmin (0.45 × 10⁻³ mm2/s) than the proposed threshold. After partial resection, the tumor regrew gradually in the 3-year follow-up (patient 4'). The recurrent tumor showed a high SUVmax (7.61) before a second operation, and the pathologic specimen revealed that tumor maintained high proliferative activity (MIB-1 LI = 4.68%).
Increased glucose metabolism indicates higher proliferative activity of the brain tumor (28). Our study presented high linearity between SUVmax and MIB-1 LI. This result may help to facilitate the usage of FDG-PET examinations in central neurocytomas as in a previous case report, which demonstrated that a central neurocytoma with higher FDG uptake showed an increased proliferative index associated with atypical histological features (18).
There are several limitations in this study. First, the number of cases is small. However, it is considered inevitable, because the central neurocytoma is relatively rare. Because of this rarity, the enrollment period was very long. Therefore not all image examinations were available, and different scanners and parameters were used, particularly in MRI.
In conclusion, central neurocytomas have a variety of image appearances, with no significant correlation with MIB-1 LI except a tendency that central neurocytomas with higher MIB-1 LI demonstrated stronger enhancement. Assessment of proliferative potential would be difficult if only morphological aspects are considered. ADCmin showed significant linear correlation with MIB-1 LI, and SUVmax had the same tendency. Both quantitative imaging values of ADCmin and SUVmax, especially for ADCmin, are considered as potential markers for predicting high MIB-1 LI of central neurocytoma.
Footnotes
Funding
This research received no specific grant from any funding agency in the public, commercial, or not-for-profit sectors.