
Abstract
Background
There has been a growing need for an imaging method for the accurate diagnosis and staging of liver fibrosis as a non-invasive alternative to liver biopsy.
Purpose
To evaluate the feasibility of intra-voxel incoherent motion (IVIM) imaging for classifying the severity of liver fibrosis.
Material and Methods
Fifty-seven patients who underwent navigator-triggered, diffusion-weighted imaging (DWI) of the liver on a 1.5-T system using nine b-values and had a reliable reference standard for the diagnosis of liver fibrosis (histopathologic findings [n = 27] or clinical findings for normal [n = 18] or cirrhotic liver [n = 12]), were included in our study. Liver apparent diffusion coefficient (ADC), pure diffusion (Dslow), perfusion fraction (f), and perfusion-related diffusion (Dfast), and the product f · Dfast were compared with the liver fibrosis stages (F). The accuracies of these parameters in diagnosing severe liver fibrosis (F ≥3) were evaluated using the receiver-operating characteristic (ROC) curve analysis.
Results
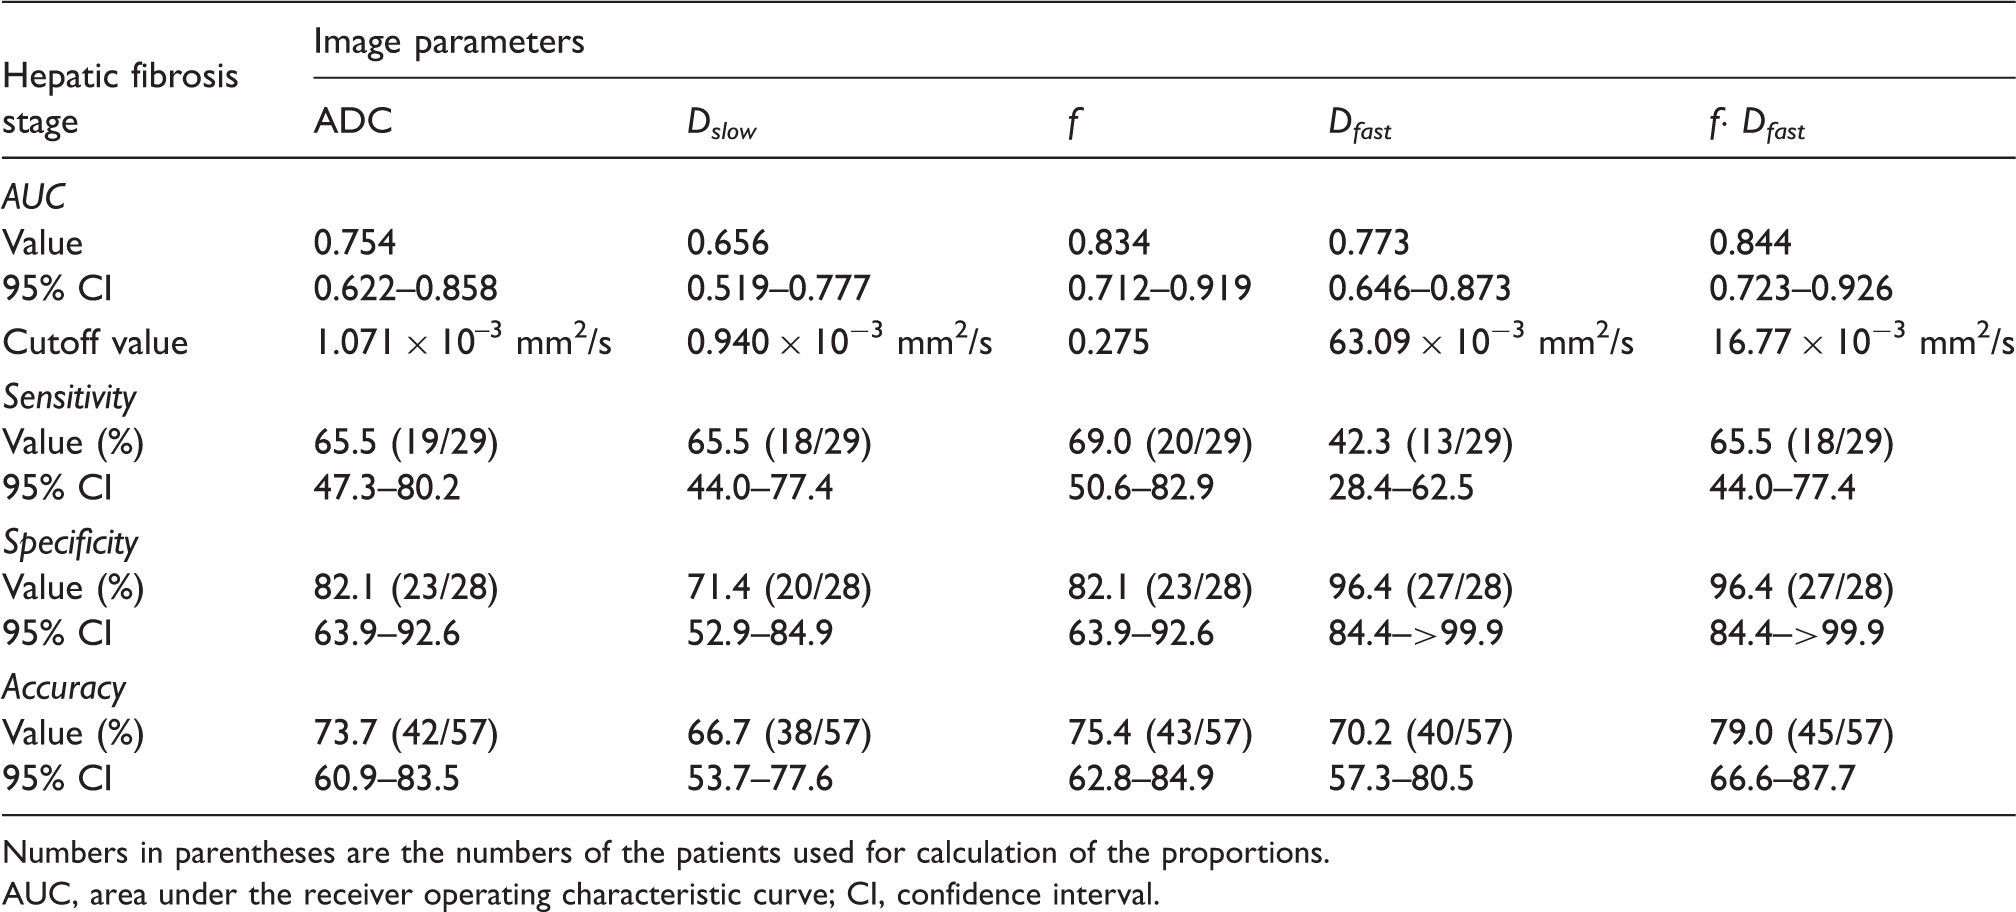
The liver fibrosis stages had the strongest negative correlation with f · Dfast (ρ = –0.52). All of the parameters, except for Dslow, were significantly lower in patients with F ≥3 than in those with F ≤2 (P ≤ 0.001). The area under the ROC curve for diagnosing severe fibrosis was the largest for f · Dfast (0.844) with an overall accuracy of 79.0% (45/57) at the optimal cutoff value and followed by f (0.834), Dfast (0.773), ADC (0.762), and Dslow (0.656).
Conclusion
IVIM imaging is a promising method for classifying the severity of liver fibrosis, with the product f · Dfast being the most accurate parameter.
Keywords
Introduction
Advanced liver fibrosis is an important cause of morbidity and mortality in patients with chronic liver disease (1). Due to the invasiveness and the limitations of liver biopsy such as sampling error and inter-observer variations (2), there is a growing need for a simple, non-invasive method for the diagnosis and staging of the liver fibrosis.
Diffusion-weighted magnetic resonance imaging (DW-MRI) is one of the promising non-invasive techniques for the assessment of liver fibrosis (3–7). Intra-voxel incoherent motion (IVIM) imaging is a method based on DWI, and which allows for the separation of pure molecular diffusion and microcirculation (or perfusion) (8,9). Previous studies (10,11) have demonstrated a greater reduction of perfusion-related parameters in cirrhotic liver compared with healthy liver than true molecular diffusion, and thus suggesting the potential value of IVIM imaging for the assessment of liver fibrosis. However, little has been known about the diagnostic value of IVIM imaging for the diagnosis and staging of liver fibrosis (10–12).
IVIM imaging is typically performed using multiple b-values for the reliable calculation of IVIM parameters, although this increases the image acquisition time (10–12). For successful clinical application of IVIM MRI, this technique must provide sufficient diagnostic information as well as being able to be performed in a time-efficient manner. Therefore, knowledge regarding the influence of the number of b-values on the IVIM parameters and their diagnostic performance is crucial for optimizing IVIM MRI protocols.
Therefore, the purpose of our study was to investigate the relationship of the ADC and IVIM parameters (Dslow, f, Dfast, and f·Dfast) with the stage of liver fibrosis, the diagnostic performance of these parameters in classifying the severity of liver fibrosis, and the influence of different b-value combinations on the IVIM parameters and their diagnostic performance in classifying the severity of liver fibrosis.
Material and Methods
Our institutional review board approved this retrospective study and waived the requirement for informed patient consent. From April 2012 to June 2012, a total of 93 patients underwent abdominal MRI including DWI with multiple b-values. An abdominal radiologist (SSL, with 9 years of clinical experience performing liver MRI) retrospectively reviewed the radiology, pathology, and clinical records in order to identify the patients who had histopathologic findings as the reference standard for the diagnosis of liver fibrosis and those who met the clinical and imaging criteria for diagnosing normal liver or liver cirrhosis. A total of 59 eligible patients were identified. Among them, two patients with clinical liver cirrhosis were excluded because of the presence of huge, hepatocellular carcinomas replacing the entire right hepatic lobe and which preclude the regions-of-interest (ROI) measurement of the ADC and IVIM parameters in the liver parenchyma.
The remaining 57 study subjects (35 men, 22 women; mean age, 58.7 years; range, 32–89 years) were finally included in our study population. These included 27 study subjects with histopathologic findings as the reference standard, 18 subjects with clinically normal liver, and 12 subjects with clinically proven liver cirrhosis.
Histopathologic analysis
All of the liver specimens were obtained during liver resection which was performed within 15.9 days (range, 2–43 days) after MRI for hepatocellular carcinoma in 25 patients, cholangiocarcinoma in two patients, and colorectal metastases in one patient. An experienced hepatic pathologist (ESY) who was blinded to the imaging findings, reviewed hematoxylin-eosin and Masson-trichrome-stained slides of the liver specimen and staged the extent of the fibrosis using the METAVIR scoring system (13). Score F0 indicated no fibrosis, F1 indicated portal fibrosis without septa, F2 indicated portal fibrosis with rare septa, F3 indicated numerous septa without cirrhosis, and F4 indicated cirrhosis.
Clinical findings
Because the sample number of patients with histopathologic findings of the liver was small, we included patients with clinically normal liver (clinical F0) and those with clinically proven liver cirrhosis (clinical F4) using clinical and imaging findings as the reference standards. The inclusion criteria for the patients with clinically normal liver were: (i) patients who underwent MR examination for indications other than the assessment of malignant hepatic tumors or diffuse liver disease; (ii) those who had no risk factors of liver disease, i.e. viral hepatitis, alcohol abuse, and drug abuse; and (iii) those who had normal liver function test results and negative viral serology test results obtained within 1 month of the MR examination. The inclusion criteria for the patients with clinically liver cirrhosis were: (i) the presence of known chronic liver disease; and (ii) the presence of typical morphologic features of cirrhotic liver seen on MRI or clinical and imaging evidence of portal hypertension.
MR examination
MRI was performed on a 1.5 T MRI system (Magnetom Avanto; Siemens Medical Solution, Erlangen, Germany) with a dedicated, six-channel, torso-array coil. The maximum gradient specifications were 45 mT/m for amplitude and 200 mT/m/s for the slew rate.
The IVIM imaging was performed in addition to the routine abdomen MRI protocol which included non-enhanced T1-weighted (T1W) and T2-weighted (T2W) imaging, T2W MR cholangiopancreaticography imaging, and contrast-enhanced T1W imaging. Axial IVIM DW images were acquired using a navigator echo-triggered (PACE [prospective acquisition correction], Siemens) single-shot echo-planar imaging sequence with the following parameters: echo time, 60 ms; repetition time, 2100 ms; echo-planar imaging factor, 115; receiver bandwidth, 1594 Hz per pixel; field of view (FOV), 340 × 256 mm; matrix size, 192 × 115; number of average, 4; section thickness, 7 mm; intersection gap, 1.4 mm; number of sections, 20; and acquisition time, approximately 7 min (variable depending on a patient’s respiratory cycle). Instead of bipolar gradients, mono-polar DW gradients which allow for scanning with a shorter echo time, were used in order to achieve a higher signal-to-noise ratio and to decrease the susceptibility artifacts. An image-based, dynamic distortion correction algorithm was used to correct for eddy-current-induced distortions. DW gradients (i.e. nine b values of 0, 30, 60, 100, 150, 200, 400, 600, and 900 s/mm2) were applied in three, orthogonal directions and were subsequently averaged. A k-space-based, parallel imaging technique (generalized auto-calibrating partially parallel acquisition, GRAPPA, Siemens Medical Solutions) was used with an acceleration factor of 2. Fat suppression was achieved using a chemical shift-selective, fat-suppression technique.
IVIM DW image analysis
DW image data were quantitatively analyzed according to both mono-exponential and bi-exponential models. For the mono-exponential model, the apparent diffusion coefficient (ADC) was calculated by least-square, mono-exponential fitting of all b-value data on a pixel-by-pixel basis according to the following equation (14):

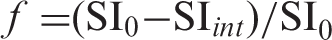
In the bi-exponential model, the signal intensity on the DW image was modeled based on the IVIM theory as the following equation (9):

As a simultaneous fit for all three parameters in equation 2 may be mathematically unstable, we adopted a segmented analysis procedure as used in other clinical IVIM studies (11,15–17). The basic concepts and rationale for the segmented analysis procedure have been described in previous studies (11,15–17). Briefly, because of the negligible contribution of the perfusion component on the DW image signal in the range of high b-values (8,14), Dslow can be determined from the mono-exponential data fitting of b ≥200 s/mm2 data according to the following equation (11):

With the Dslow and f, Dfast can be calculated using a partially constrained non-linear regression of all datasets according to the equation 2. To represent overall hepatic blood flow, the product f·Dfast was calculated by multiplying f and Dfast. All fitting algorithms were implemented with software (Matlab; Mathworks Inc., Natick, MA, USA).
One senior radiology resident (SRJ) performed quantitative image analysis under the supervision of an abdominal radiologist (SSL). Six, 1.5-cm2, circular ROIs were positioned in the right hepatic lobe at areas devoid of large, intrahepatic vessels and prominent artifacts, on two consecutive DW image sections covering the middle portion of the right hepatic lobe, i.e. three ROIs on each section. The left hepatic lobe was excluded due to potential cardiac motion artifacts that could interfere with accurate measurement of the ADC and IVIM parameters (11). Using the b-value selection function of our postprocessing software which allowed calculation of the ADC and IVIM parameters using only the selected b-values, the values of the ADC and IVIM parameters (Dslow, f, Dfast, and f·Dfast) were extracted from the same ROIs with all nine b-value datasets, the seven b-value dataset with omitted higher b-values, i.e. b = 0, 30, 60, 100, 150, 200, 900 s/mm2, and the four b-values, i.e. b = 0, 100, 200, 900 s/mm2.
Statistical analysis
As there was only one patient with F1, the patients with F1 and F2 was grouped together as F1–2 for the analysis. The difference in DW image parameters among the hepatic fibrosis stages, i.e. F0, F1–2, F3, and F4, were analyzed using the repeated-measures ANOVA test and the Bonferroni multiple comparisons test as the post-hoc test. The correlations between the DW image parameters and the hepatic fibrosis stages were analyzed using the Spearman’s correlation coefficient. The difference in the DW image parameters between the patients with severe hepatic fibrosis (F ≥3) and those with less severe hepatic fibrosis (F ≤2), was assessed using the independent sample t-test. The diagnostic accuracies of DW image parameters for diagnosing severe hepatic fibrosis (F ≥3), were compared using receiver operating characteristic (ROC) curve analysis. The optimal cutoff values of the DW image parameters for diagnosing severe hepatic fibrosis (F ≥3), where the sum of the sensitivity and specificity became the largest, were determined and the corresponding sensitivity, specificity, and accuracy were calculated. The values of the DWI parameters and their overall diagnostic performances were compared among four different b-value combinations using the repeated-measures ANOVA test and the ROC curve analysis, respectively. The correlations between the DWI parameters obtained with all nine b-value datasets with those obtained with the other two b-value combinations were evaluated using the linear regression analysis. The statistical analyses were performed with IBM SPSS statistics 19 software (IBM Corp., Armonk, NY, USA) and MedCalc (MedCalc Software, Mariakierke, Belgium). A P value less than 0.05 was considered to indicate a significant difference.
Results
Patient characteristics
Clinical and histological characteristics of the study population.
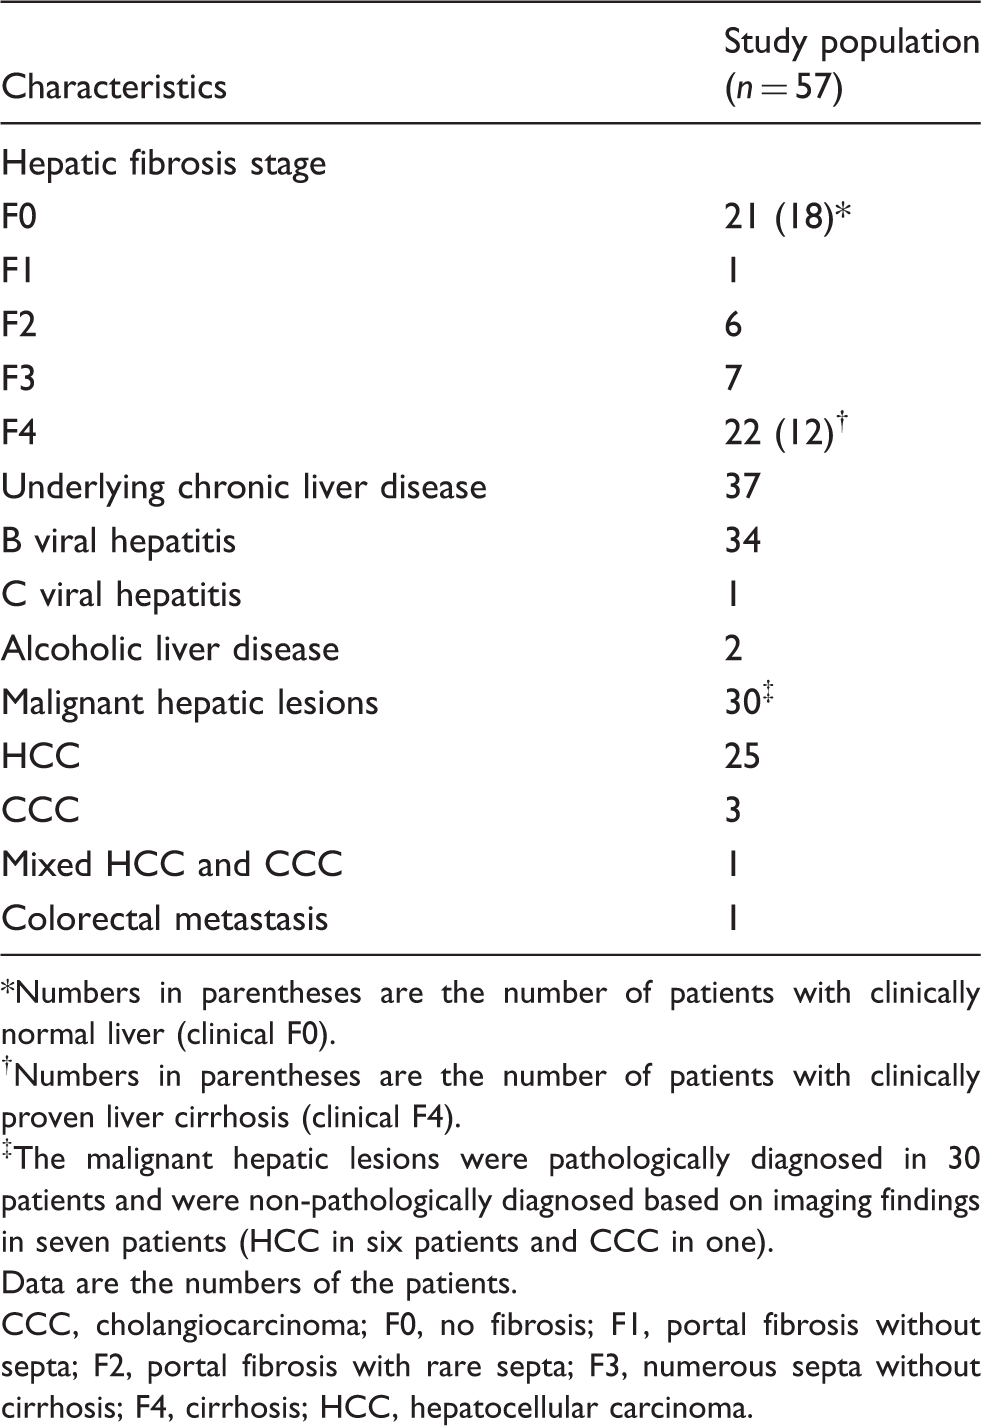
Numbers in parentheses are the number of patients with clinically normal liver (clinical F0).
†Numbers in parentheses are the number of patients with clinically proven liver cirrhosis (clinical F4).
‡The malignant hepatic lesions were pathologically diagnosed in 30 patients and were non-pathologically diagnosed based on imaging findings in seven patients (HCC in six patients and CCC in one).
Data are the numbers of the patients.
CCC, cholangiocarcinoma; F0, no fibrosis; F1, portal fibrosis without septa; F2, portal fibrosis with rare septa; F3, numerous septa without cirrhosis; F4, cirrhosis; HCC, hepatocellular carcinoma.
Correlation between the ADC and IVIM parameters and the stage of hepatic fibrosis
Summary of the DW image parameters according to the hepatic fibrosis stage.
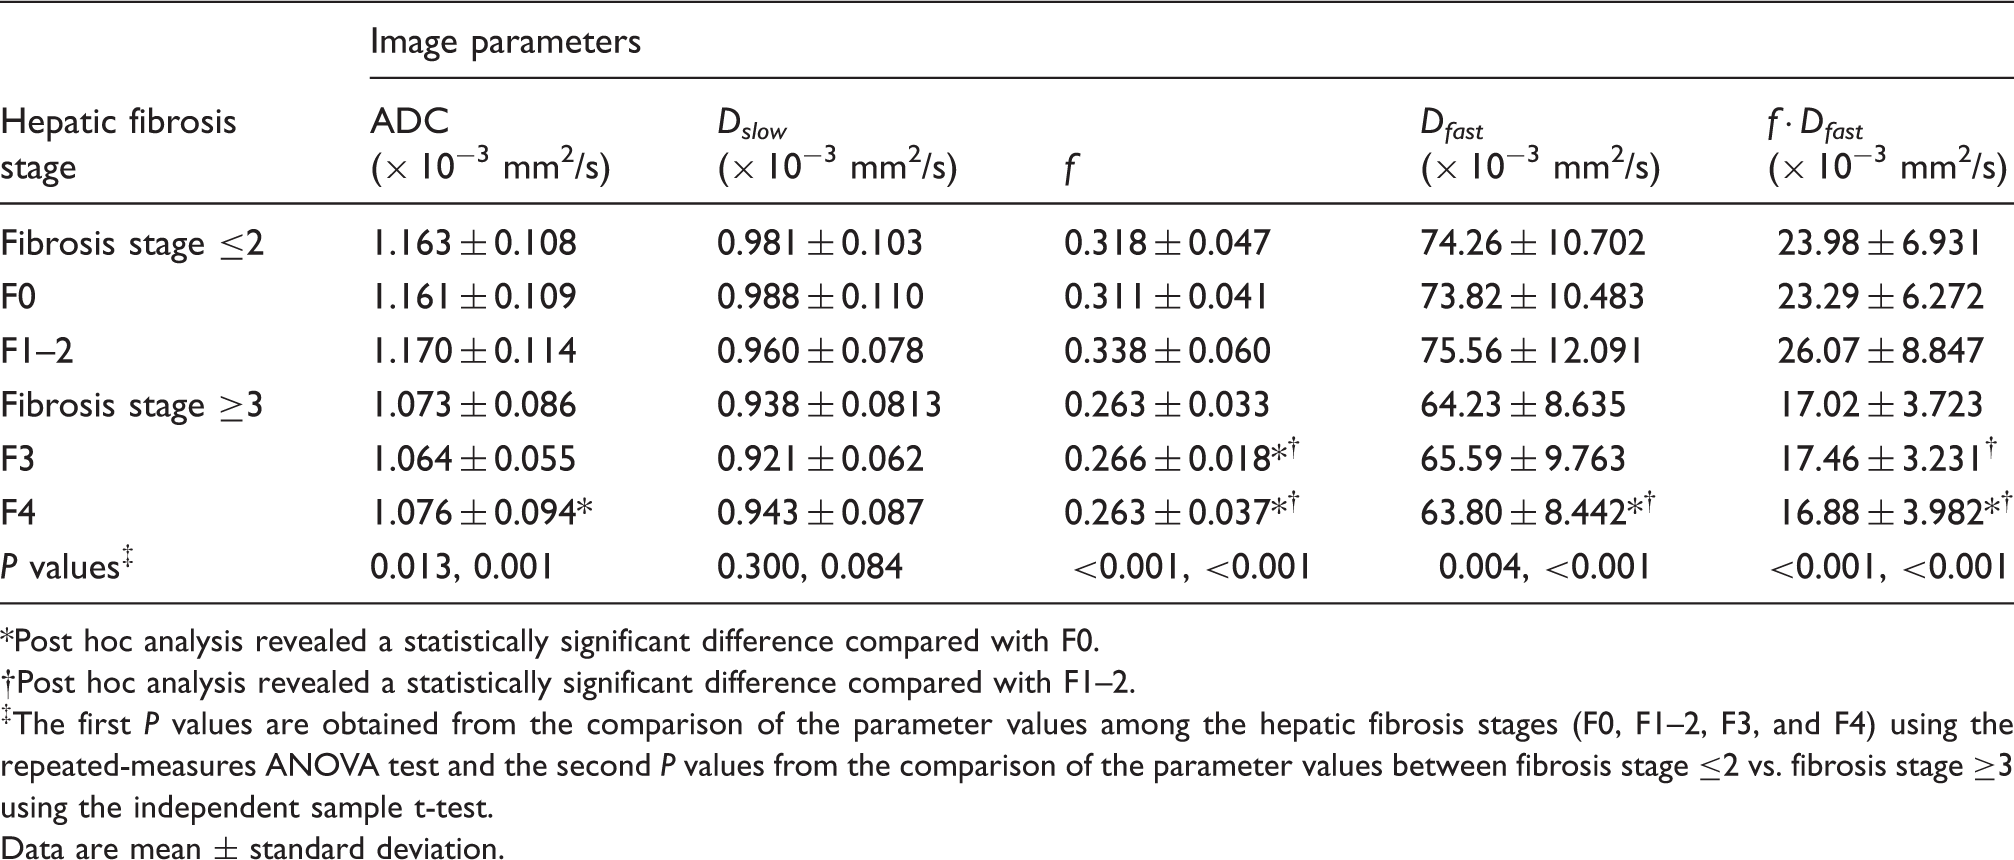
Post hoc analysis revealed a statistically significant difference compared with F0.
Post hoc analysis revealed a statistically significant difference compared with F1–2.
‡The first P values are obtained from the comparison of the parameter values among the hepatic fibrosis stages (F0, F1–2, F3, and F4) using the repeated-measures ANOVA test and the second P values from the comparison of the parameter values between fibrosis stage ≤2 vs. fibrosis stage ≥3 using the independent sample t-test.
Data are mean ± standard deviation.
DWI parameters in the diagnosis of severe hepatic fibrosis (F ≥3)
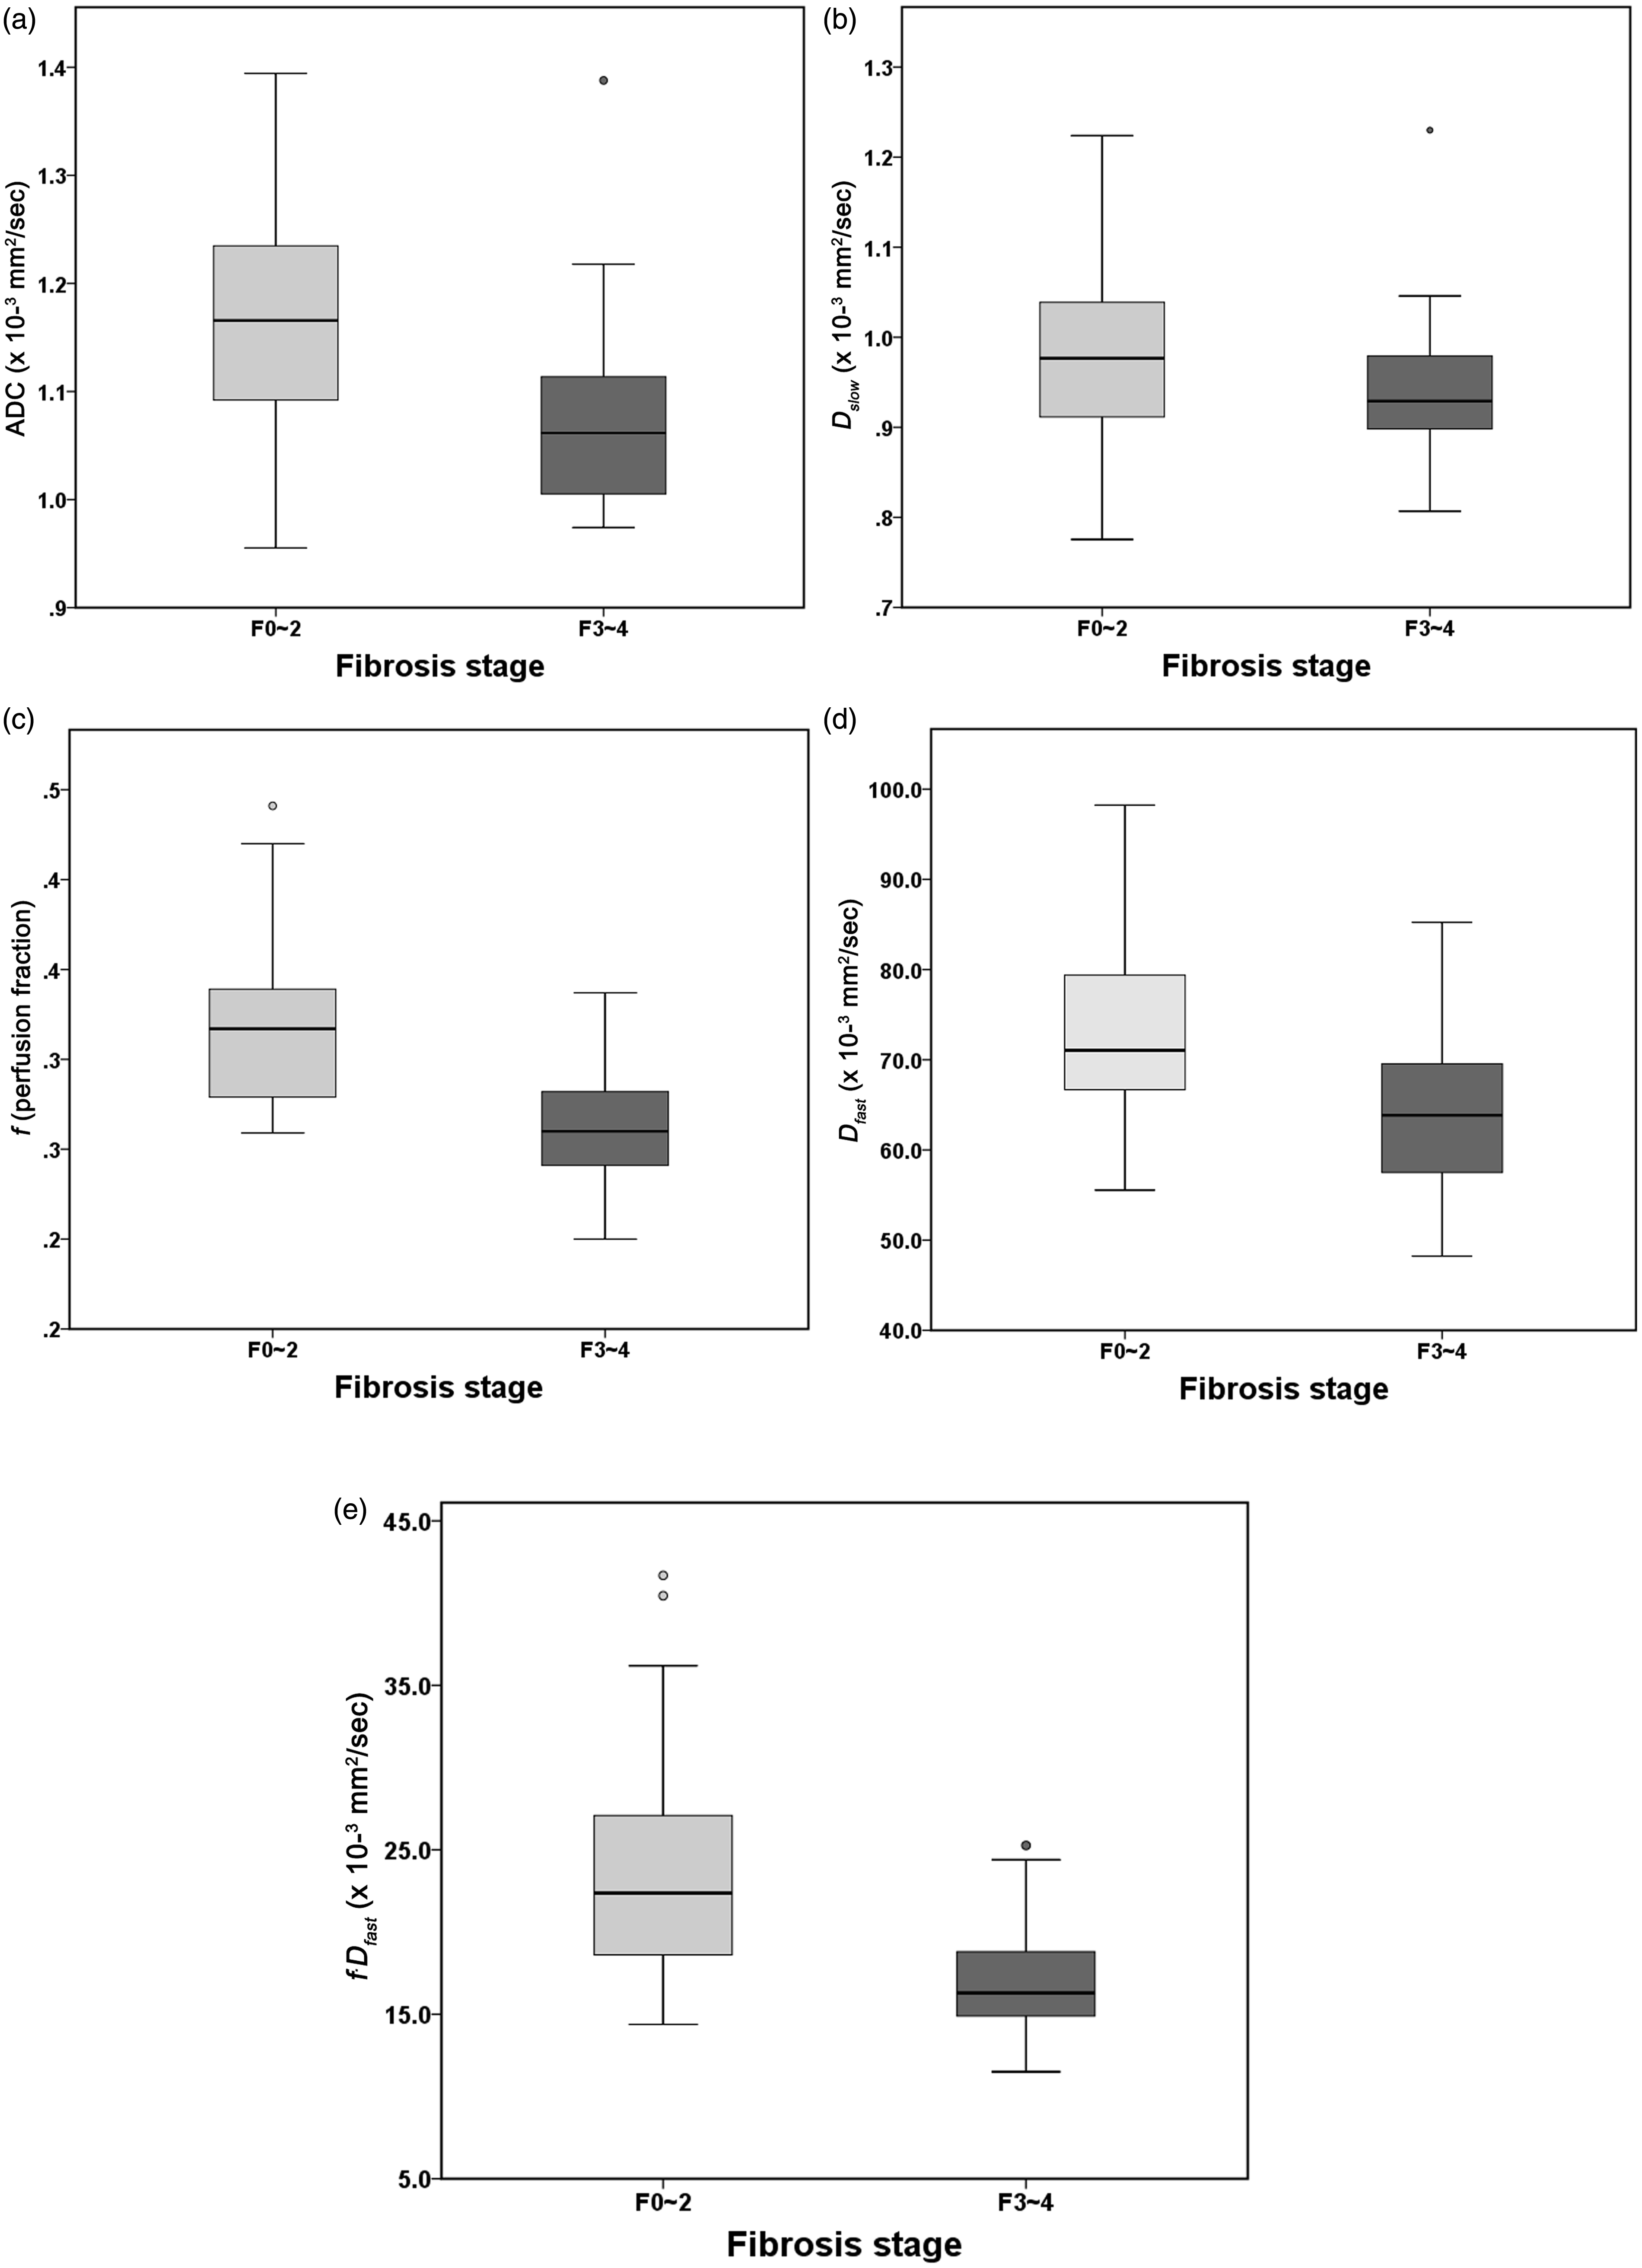
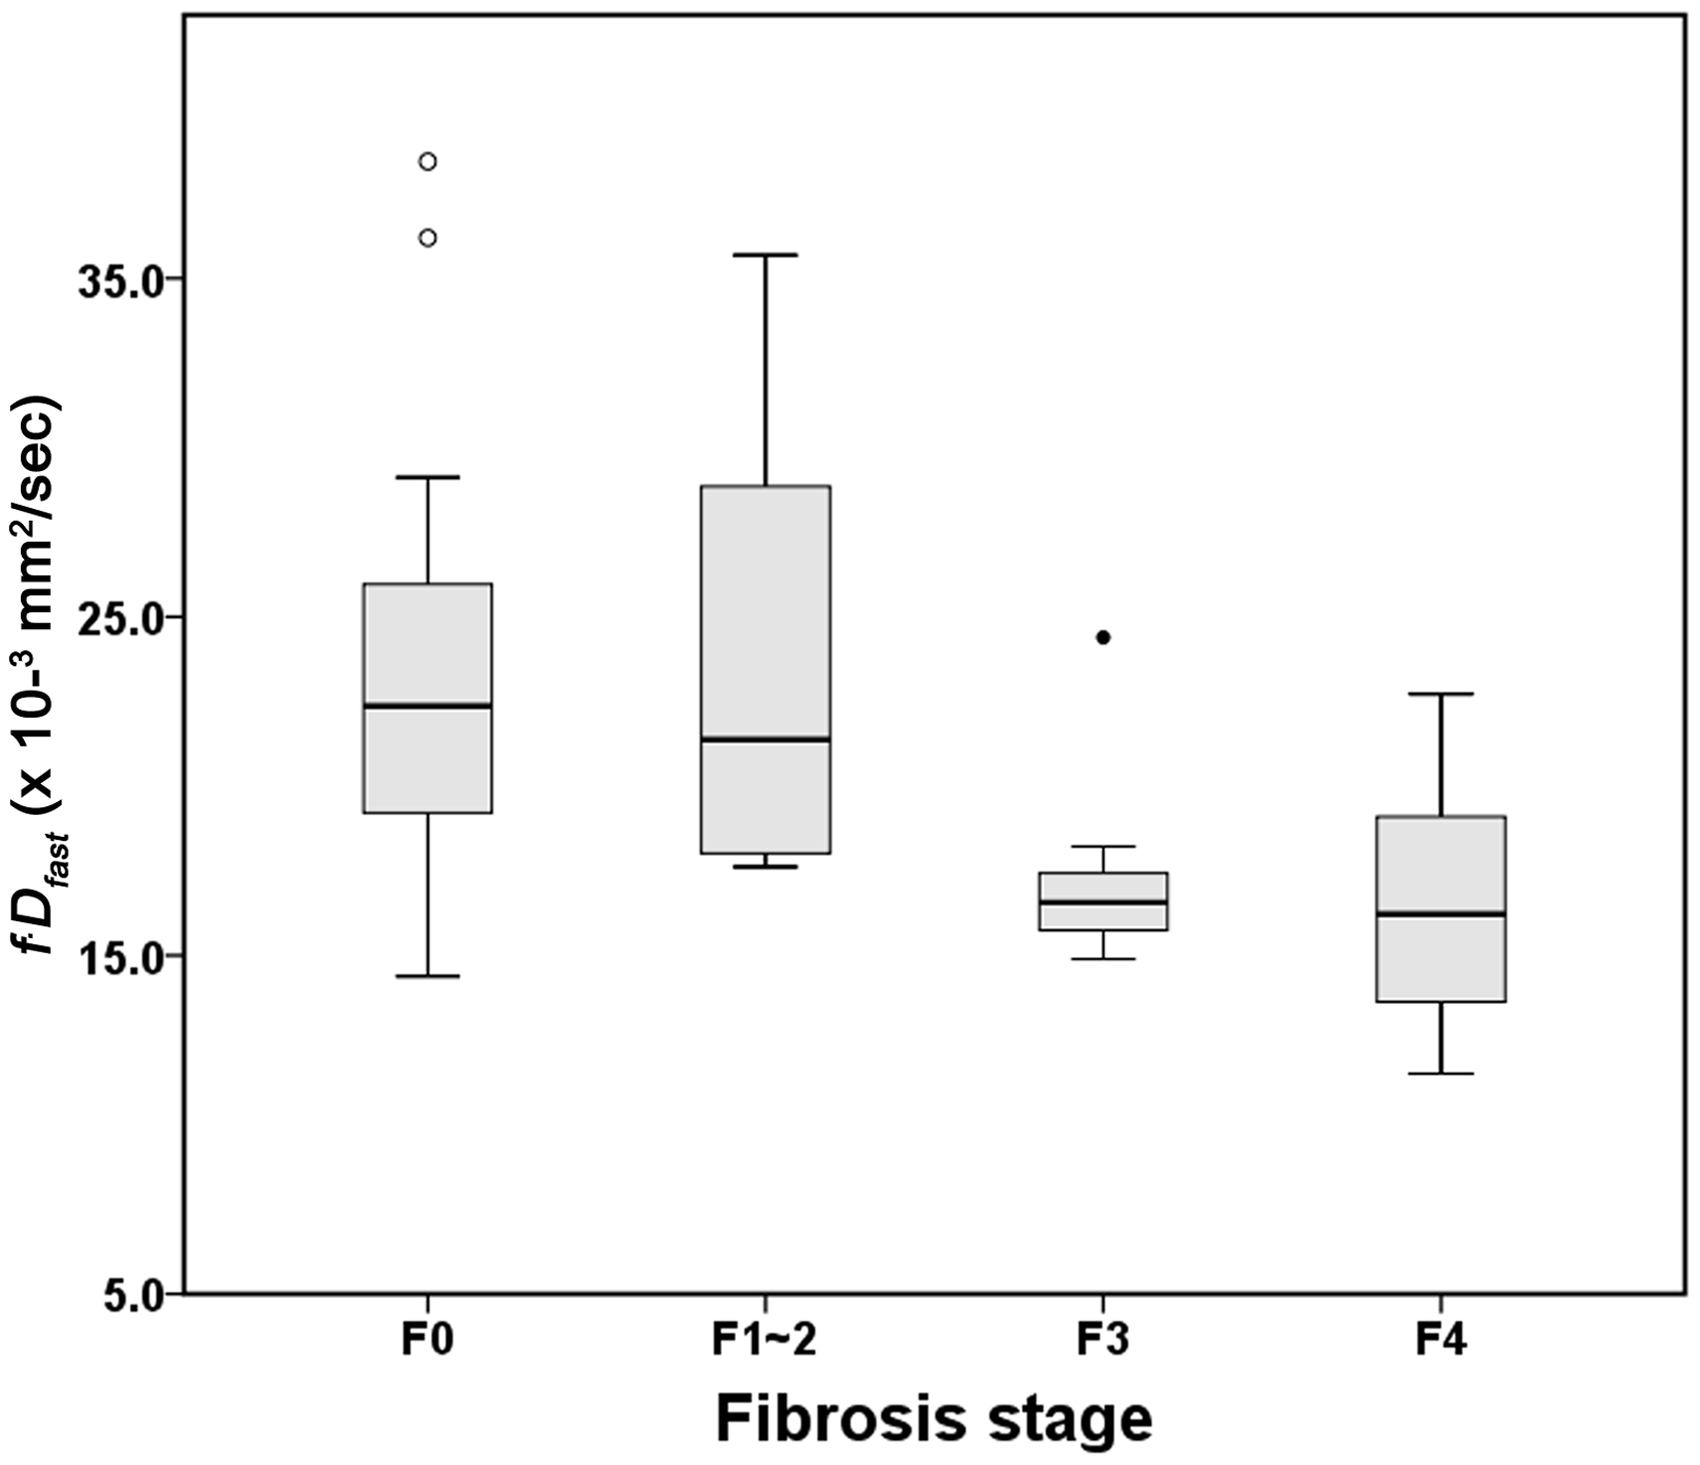
Compared with patients with F ≤2, patients with F ≥3 had significantly lower ADC, f, Dfast, and f·Dfast (P ≤ 0.001). However, there was no statistically significant difference in Dslow between two groups (P = 0.084) (Table 2) (Figs. 1 and 2). The diagnostic performances of the DWI parameters for diagnosing severe hepatic fibrosis (F ≥3) are summarized in Table 3. The area under the ROC curve was largest for f · Dfast (0.844), followed by f (0.834), Dfast (0.773), ADC (0.762), and Dslow (0.656). The areas under the ROC curve for f·Dfast, f, and ADC were significantly larger than that for Dslow (P ≤ 0.046). The area under the ROC curve for f·Dfast was also significantly larger than that of Dfast (P = 0.040). At the optimal cutoff values, the sensitivities are in the range of 42.3–69.0%, specificities 71.4–96.4%, and accuracies 66.7–79.0% depending on the DW image parameters. The highest accuracy was achieved with f · Dfast (79.0% [95% CI, 66.6–87.7%]), followed by f (75.4% [95% CI, 62.8–84.9%]). The box plot of f·Dfast according to the hepatic fibrosis stage (F0, F1–2, F3, and F4) was presented in Fig. 3.
ADC and IVIM parametric maps of a 40-year-old woman with normal liver (upper row) and a 62-year-old man with hepatitis B viral liver cirrhosis (lower row). ADC, f, Dfast, and f·Dfast maps show lower values in the patient with liver cirrhosis (lower row) than in the patient with normal liver (upper row), while no obvious difference is noted in the Dslow maps. Box plots of (a) ADC, (b) Dslow, (c) f, (d) Dfast, and (e) f·Dfast in liver fibrosis stage ≤2 vs. liver fibrosis stage ≥3. The top and bottoms of the boxes are the first and third quartiles, respectively. The length of the box represents the interquartile range. Lines within each box are medians. Error bars show the highest or the lowest datum within 1.5 times of the interquartile range of the upper or lower quartiles. Data points outside the box are outliers. Box plots of f·Dfast according to liver according to the hepatic fibrosis stage (F0, F1–2, F3, and F4). The top and bottoms of the boxes are the first and third quartiles, respectively. The length of the box represents the interquartile range. Lines within each box are medians. Error bars show the highest or the lowest datum within 1.5 times of the interquartile range of the upper or lower quartiles. Data points outside the box are outliers. Diagnostic performances of DW image parameters in diagnosing severe hepatic fibrosis. Numbers in parentheses are the numbers of the patients used for calculation of the proportions. AUC, area under the receiver operating characteristic curve; CI, confidence interval.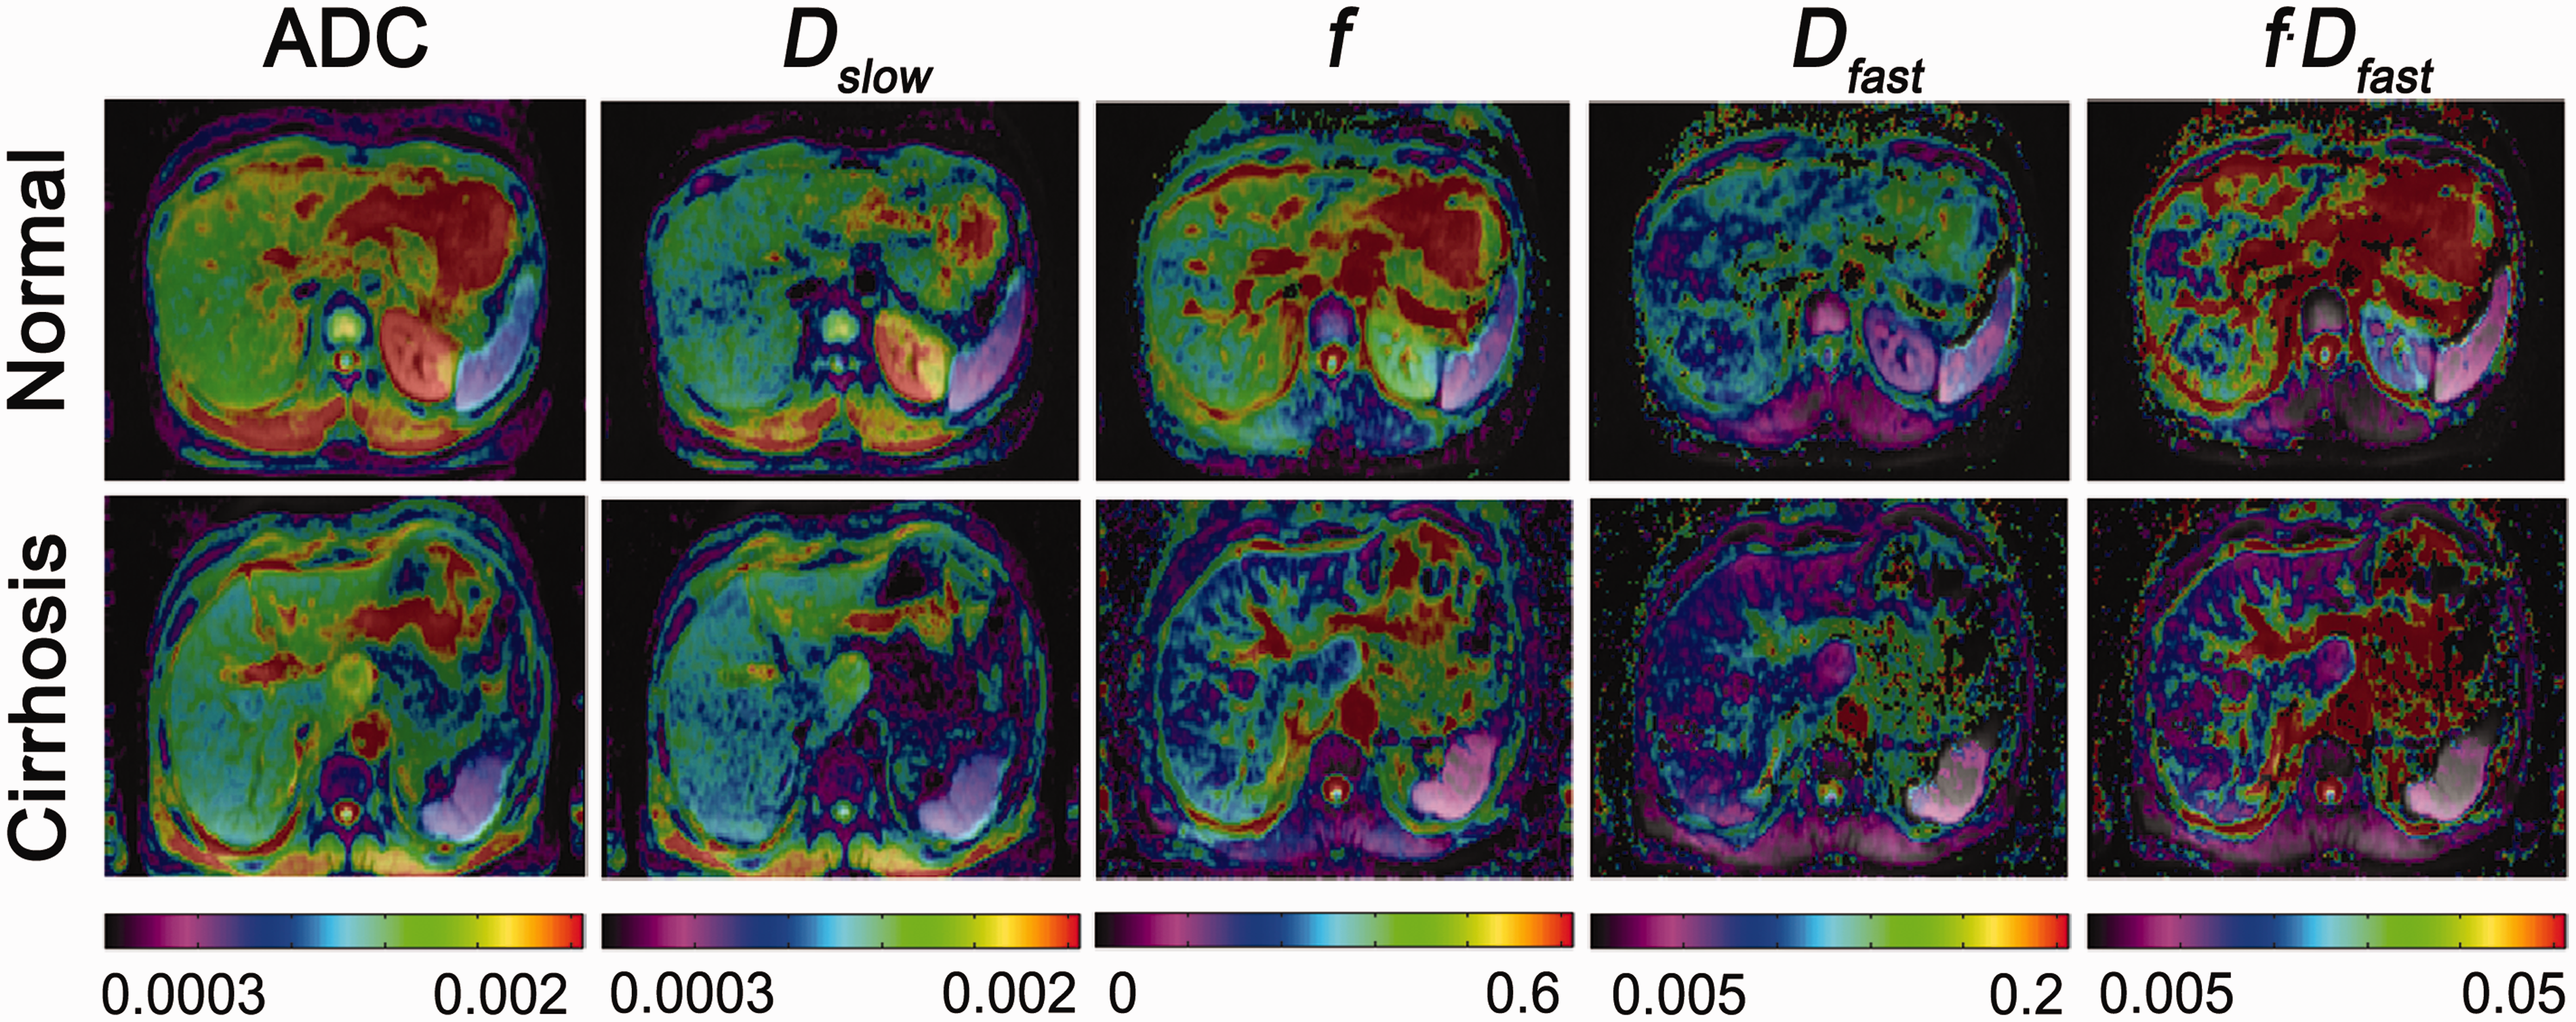
Influence of different b-value combinations on the DW image parameters
Values of the DW image parameters and their diagnostic performance in diagnosing severe hepatic fibrosis according to different b-value combinations.
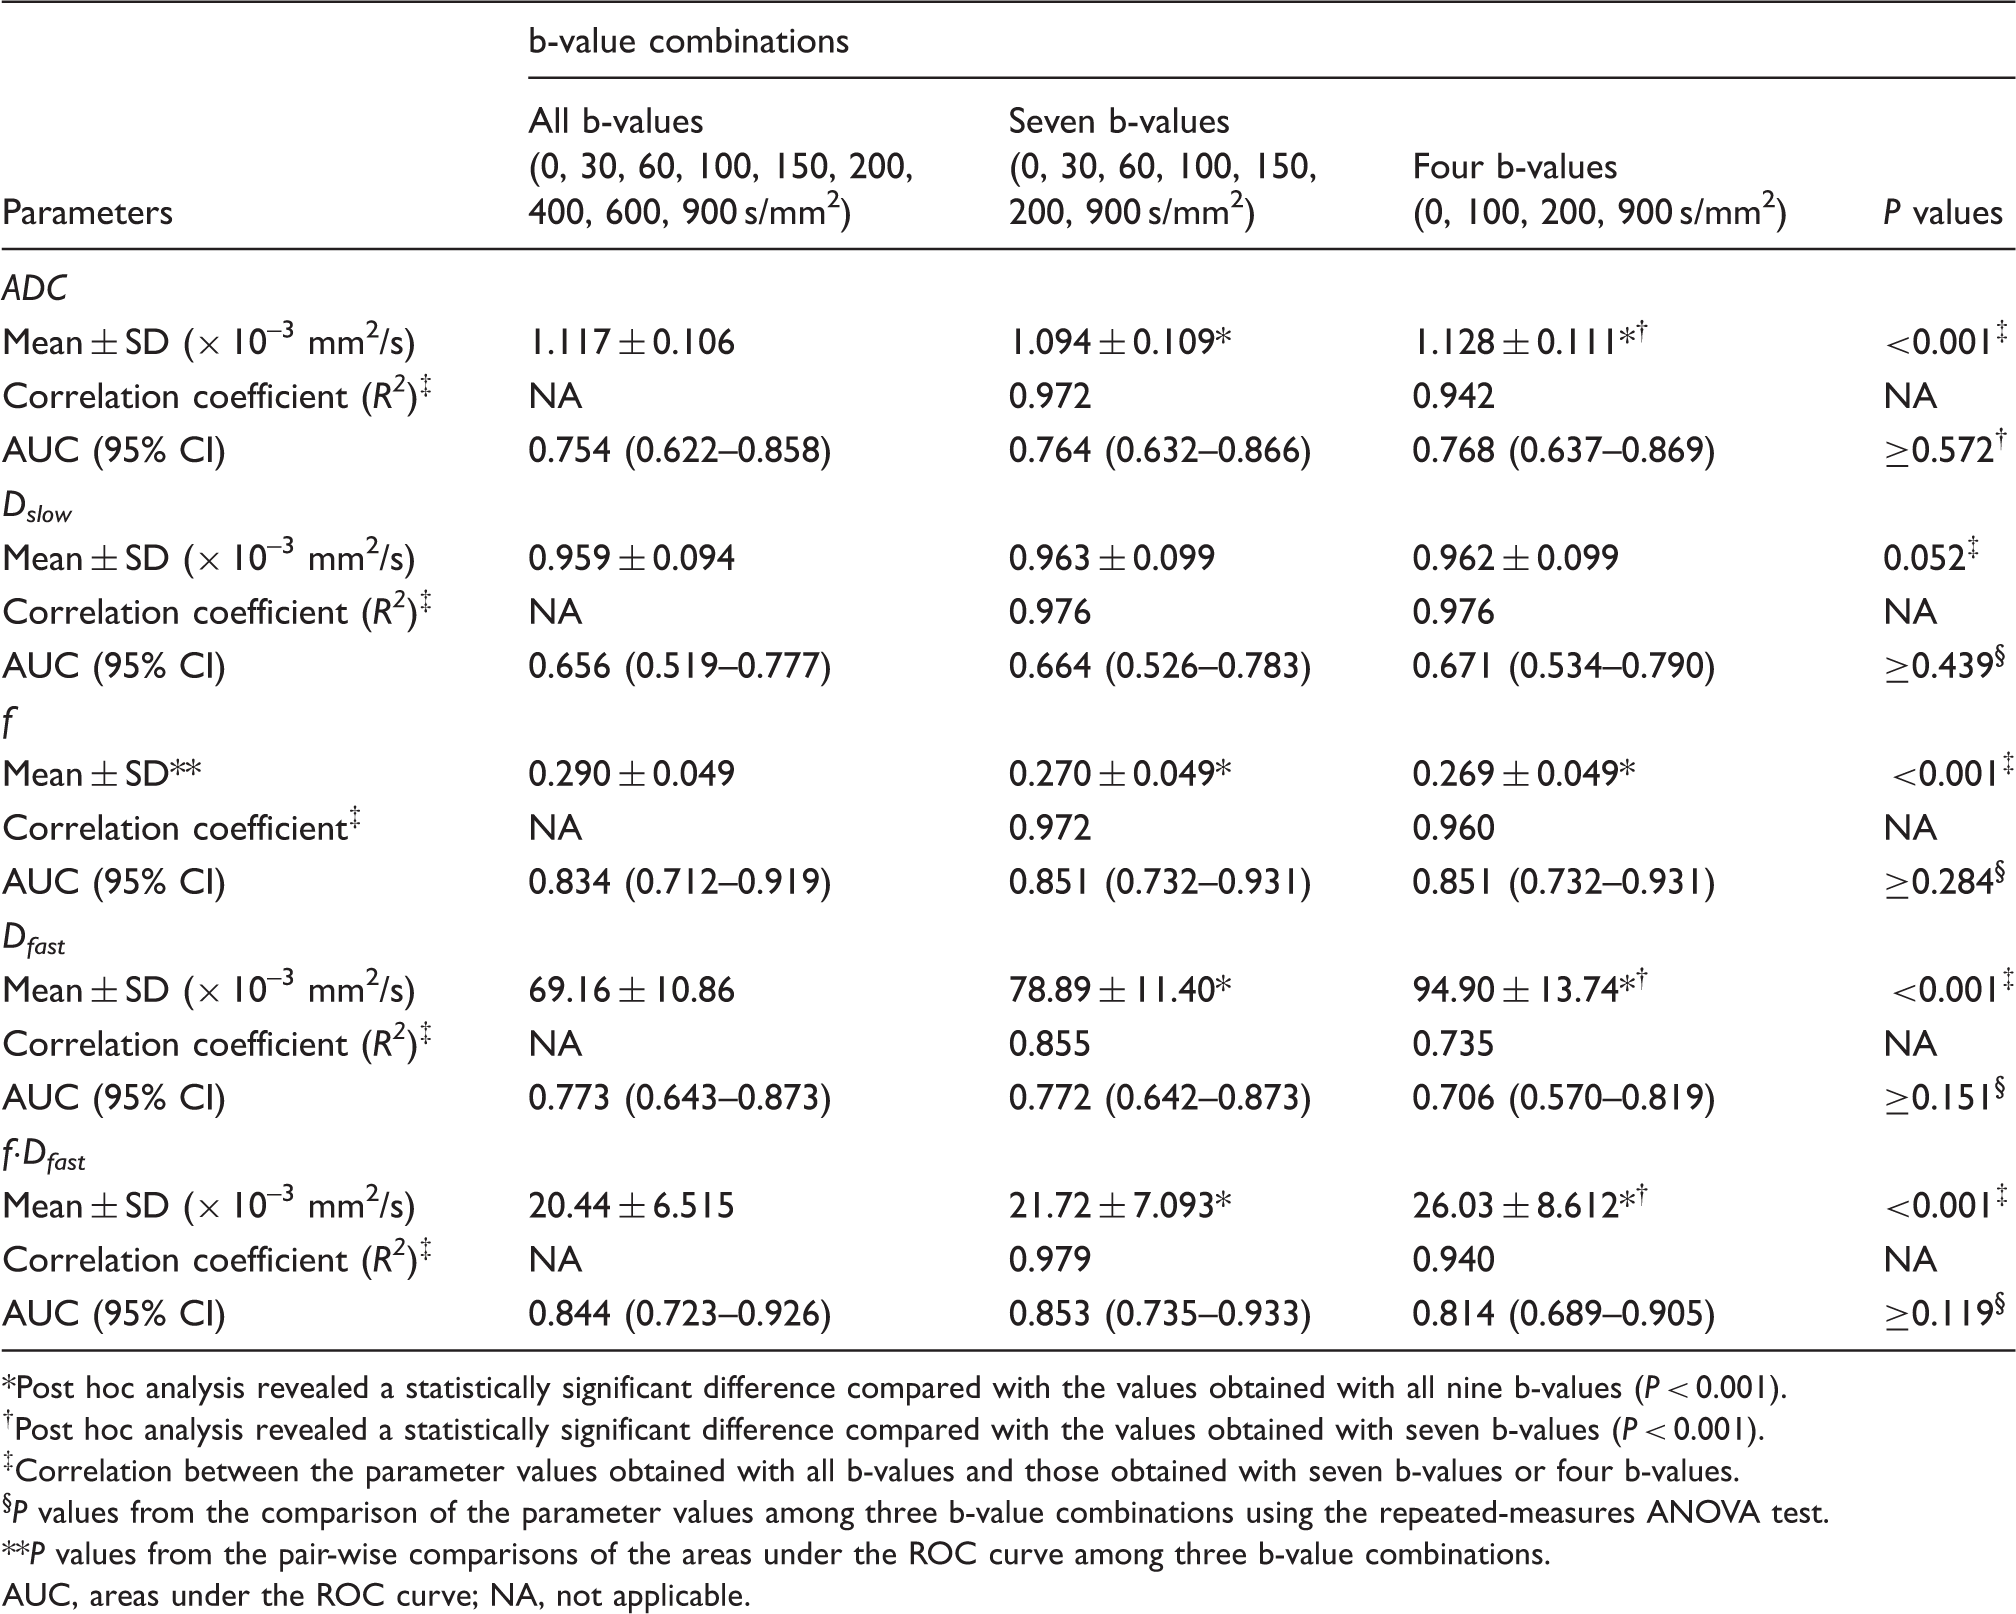
Post hoc analysis revealed a statistically significant difference compared with the values obtained with all nine b-values (P < 0.001).
Post hoc analysis revealed a statistically significant difference compared with the values obtained with seven b-values (P < 0.001).
Correlation between the parameter values obtained with all b-values and those obtained with seven b-values or four b-values.
P values from the comparison of the parameter values among three b-value combinations using the repeated-measures ANOVA test.
P values from the pair-wise comparisons of the areas under the ROC curve among three b-value combinations.
AUC, areas under the ROC curve; NA, not applicable.
Discussion
Our study demonstrated that ADC and perfusion-related parameters (f · Dfast, f, and Dfast) had a stronger correlation with the grade of liver fibrosis than the pure molecular diffusion parameter, Dslow. The ADC and the perfusion-related parameters showed a significant difference in different fibrosis stages, while no significant difference was noted for Dslow. Previous studies have also demonstrated findings consistent with ours. An animal experiment using rat models with liver fibrosis demonstrated that the decreased ADC correlated with increased liver fibrosis in living rats, although not after death, and thus suggesting a major contribution of liver perfusion to the change in ADC according to the degree of liver fibrosis (6). A previous human study also demonstrated a significant difference in Dfast, although no difference in Dslow between healthy and cirrhotic livers (10).
Liver fibrosis is associated with the changes in hepatic microcirculation known as sinusoidal capillarization (18,19). These changes result in an impaired bidirectional flow between hepatic sinusoids and the space of Disse (18), which may lead to a decreased functional vascular volume fraction of the liver (i.e. f), reduced flow velocity within the hepatic sinusoids, i.e. Dfast, and, consequently, overall hepatic blood flow, i.e. f · Dfast. Among all of the parameters evaluated in our study, f · Dfast showed the highest diagnostic performance for discriminating severe hepatic fibrosis (F ≥3) from less severe hepatic fibrosis (F ≤2). All perfusion-related parameters (f·Dfast, f, and Dfast) showed larger areas under the ROC curve than with ADC for the diagnosis of severe hepatic fibrosis, although the differences were not statistically significant in our study. Therefore, our findings suggest that the separate analysis of microcirculation and pure molecular diffusion using IVIM imaging may have an incremental value to conventional ADC-based DWI for classifying the severity of liver fibrosis.
Our study also demonstrated the feasibility of IVIM-based analysis of DW images using a smaller number of b-value data. The use of different b-value combinations resulted in significantly different ADC, f, Dfast, and f· Dfast values. However, interestingly, the diagnostic performances of three, different b-value combinations did not differ for diagnosing severe hepatic fibrosis. We also found strong linear correlations of the ADC and IVIM parameters across different b-value combinations. These findings indicate that, even though the absolute values of ADC and IVIM parameters change depending on the b-value combinations, the between-subject differences in those parameters may be maintained. Therefore, based on these results, we suggest that IVIM-based analysis of DW images using a smaller number of b-values, i.e. even four b-values, may be clinically applicable in order to obtain diffusion and perfusion-related parameters as a time-efficient alternative to IVIM imaging.
Besides IVIM imaging, MR- or ultrasound-based elastography techniques are currently available for liver fibrosis assessment (20,21). Although these techniques have better been validated for their diagnostic efficacies in assessing liver fibrosis than IVIM imaging (20,21), IVIM imaging may have several advantages. Elastography techniques utilizing mechanical or ultrasound-induced wave propagation may not be reliably applied to the patients with ascites, narrow intercostals spaces, or overweight status (22). In addition, unlike elastography techniques which require dedicated scanners or add-on devices (20,21), IVIM imaging based on DWI sequence can be performed on most up-to-date MR scanners.
Our study has several limitations. First, histopathologic confirmation of the liver fibrosis stage was not available in most patients with normal liver and in some patients with liver cirrhosis. However, we attempted to minimize the possibility of misclassification of the liver fibrosis stage for these patients without histological proof of liver fibrosis by applying strict clinical criteria for the clinical diagnosis of F0 and F4. Second, our results are limited by the relatively small sample size, particularly the small number of patients with intermediate-stage hepatic fibrosis. Third, we did not compare the diagnostic performance of the ADC and IVIM parameters with the other currently available methods for liver fibrosis assessment, such as MR- or ultrasound-based elastography techniques. Despite these limitations, our pilot study demonstrated the feasibility of IVIM imaging for the assessment of liver fibrosis. Further validation study including a larger number of study patients with various degrees of liver fibrosis is, therefore, warranted.
In conclusion, liver fibrosis and cirrhosis results in greater reduction in hepatic perfusion than pure molecular diffusion. IVIM imaging of the liver is a promising method for classifying the severity of liver fibrosis, with the product f · Dfast being the most accurate parameter. IVIM-based analysis of DW images acquired with a smaller number of b-values may offer comparable accuracy in classifying the severity of liver fibrosis to that of IVIM imaging with multiple b-values.
Footnotes
Conflict of interest
None declared.
Funding
This research was supported by the Basic Science Research Program through the National Research Foundation of Korea (NRF) which is funded by the Ministry of Education, Science and Technology (2012R1A1A1005326) and by a grant (2014-444) from the Asan Institute for Life Sciences, Asan Medical Center, Seoul, Republic of Korea.