
Abstract
Background
The clinical significance of microvascular obstruction (MO) in hypertrophic cardiomyopathy (HOCM) after percutaneous transluminal septal myocardial ablation (PTSMA) remains unknown.
Purpose
To assess the relationship between the location of MO and the improvement in symptoms and pressure gradient after PTSMA in patients with HOCM.
Material and Methods
Twenty-three patients with HOCM underwent MRI within 24 weeks after PTSMA. The MO was defined visually as the hypointense region adjacent to the left or right ventricular cavity, which was surrounded by myocardial infarction. The location of MO and improvement in clinical symptoms and pressure gradient at 3–6 months follow-up were assessed.
Results
MO was observed in 16 patients who underwent MRI within 7 weeks after PTSMA. Left-sided MO was observed in 12 patients, and right-sided MO was observed in four patients. Improvement in clinical symptoms and reduction in the pressure gradient were not sufficient in the patients with right-sided MO, while PTSMA was effective in the patients with the left-sided MO.
Conclusion
The location of MO identified by MRI may be related to the effectiveness of PTSMA at the short-term follow-up. The left-sided MO is related to complete improvement in clinical symptoms and pressure gradients.
Keywords
Introduction
Hypertrophic obstructive cardiomyopathy (HOCM) is characterized by myocardial hypertrophy obstructing the left ventricular outflow tract (LVOT). In HOCM, an increase in LVOT gradient can lead to reactive hypertrophy of the myocardium distinct from LVOT and the resultant decrease in coronary flow reserve (1–3). Consequently, HOCM is associated with chest pain or syncope during exercise, and its prognosis is worse than that of hypertrophic cardiomyopathy without LVOT obstruction (2,3). Percutaneous transluminal septal myocardial ablation (PTSMA) is a less invasive alternative to myectomy for the treatment of HOCM (4). Absolute alcohol is injected via the coronary septal branch arteries leading to myocardial infarction of the hypertrophied myocardium. PTSMA releases the LVOT obstruction, decreases reactive myocardial hypertrophy, and may improve clinical symptoms in patients with HOCM (5–7).
Magnetic resonance imaging (MRI) is useful for evaluating the efficiency of PTSMA (5,6,8,9). Cine steady-state free precession (SSFP) imaging quantifies myocardial wall thickness and mass, and visualizes jet flow crossing the LVOT (6,10). Late gadolinium enhancement (LGE) MRI is useful for recognizing and quantifying myocardial infarction after PTSMA (5,6,9). T2-weighted (T2W) and LGE MRI can also visualize myocardial infarction as well as microvascular obstruction (MO) at the early stage after PTSMA (9). The presence of MO on LGE MRI is related to impaired regional recovery after myocardial infarction due to coronary artery diseases (11,12). However, the clinical significance of MO after PTSMA has not been reported so far. The aim of this study was to assess the relationships between the location of MO and improvement in clinical symptoms and LVOT pressure gradient after PTSMA at the short-term follow-up in patients with HOCM.
Material and Methods
Patients
We enrolled consecutive 23 patients with HOCM, who underwent contrast-enhanced MRI within 24 weeks after PTSMA between February 2006 and December 2013. There were four men and 19 women (age range, 51–86 years; mean age, 67 years). HOCM was diagnosed as hypertrophic cardiomyopathy with the pressure gradient >30 mmHg on echocardiography at rest (1,4,5). All but one patient had asymmetrical septal hypertrophy with LVOT obstruction, and the other patient had a midventricular obstruction. One patient received PTSMA twice at the enrollment in this study. The patients were classified as New York Heart Association (NYHA) functional class II (n = 19) or III (n = 4): they presented with clinical symptoms associated with an increased pressure gradient (e.g. chest oppression, dyspnea on exercise), which were refractory to beta- blocker and cibenzoline (13,14). PTSMA was performed to the HOCM patients based on the criteria reported previously (4–8), and they were referred for MRI examination to evaluate cardiac function and myocardial infarction after PTSMA. They provided informed consent to participate in PTSMA and MRI, and these procedures were approved by the institutional review board.
Imaging procedure
Imaging parameters.
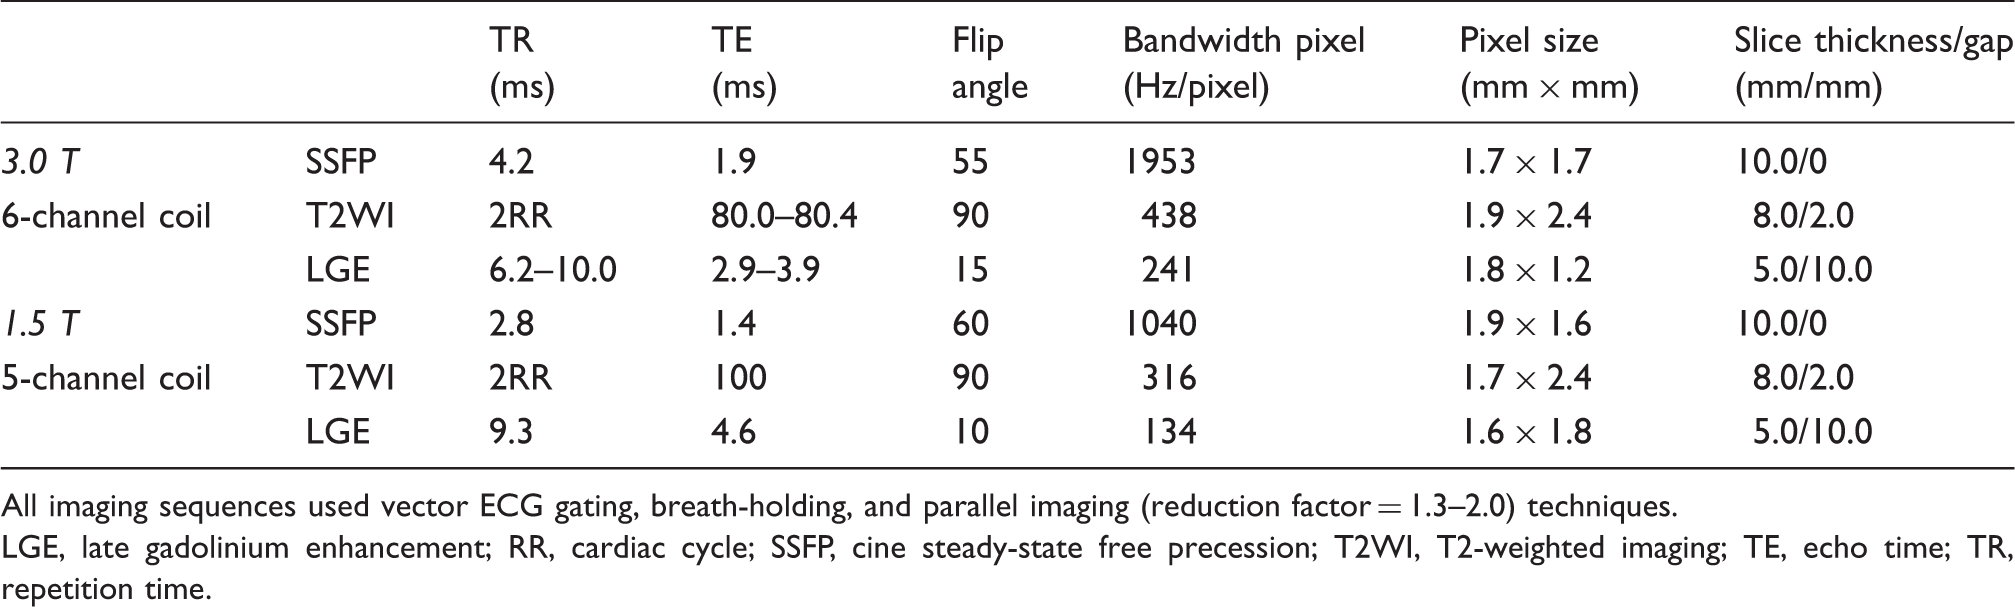
All imaging sequences used vector ECG gating, breath-holding, and parallel imaging (reduction factor = 1.3–2.0) techniques.
LGE, late gadolinium enhancement; RR, cardiac cycle; SSFP, cine steady-state free precession; T2WI, T2-weighted imaging; TE, echo time; TR, repetition time.
Image analysis
PTSMA-induced myocardial infarction was defined as the septal myocardium, which could receive blood supply from the septal branch arteries and showed high intensity on T2W and LGE MRI (5,6,8,9). MO was defined visually as the hypointense region adjacent to the left or right ventricular cavity, which was surrounded by the infarcted myocardium (9,12).
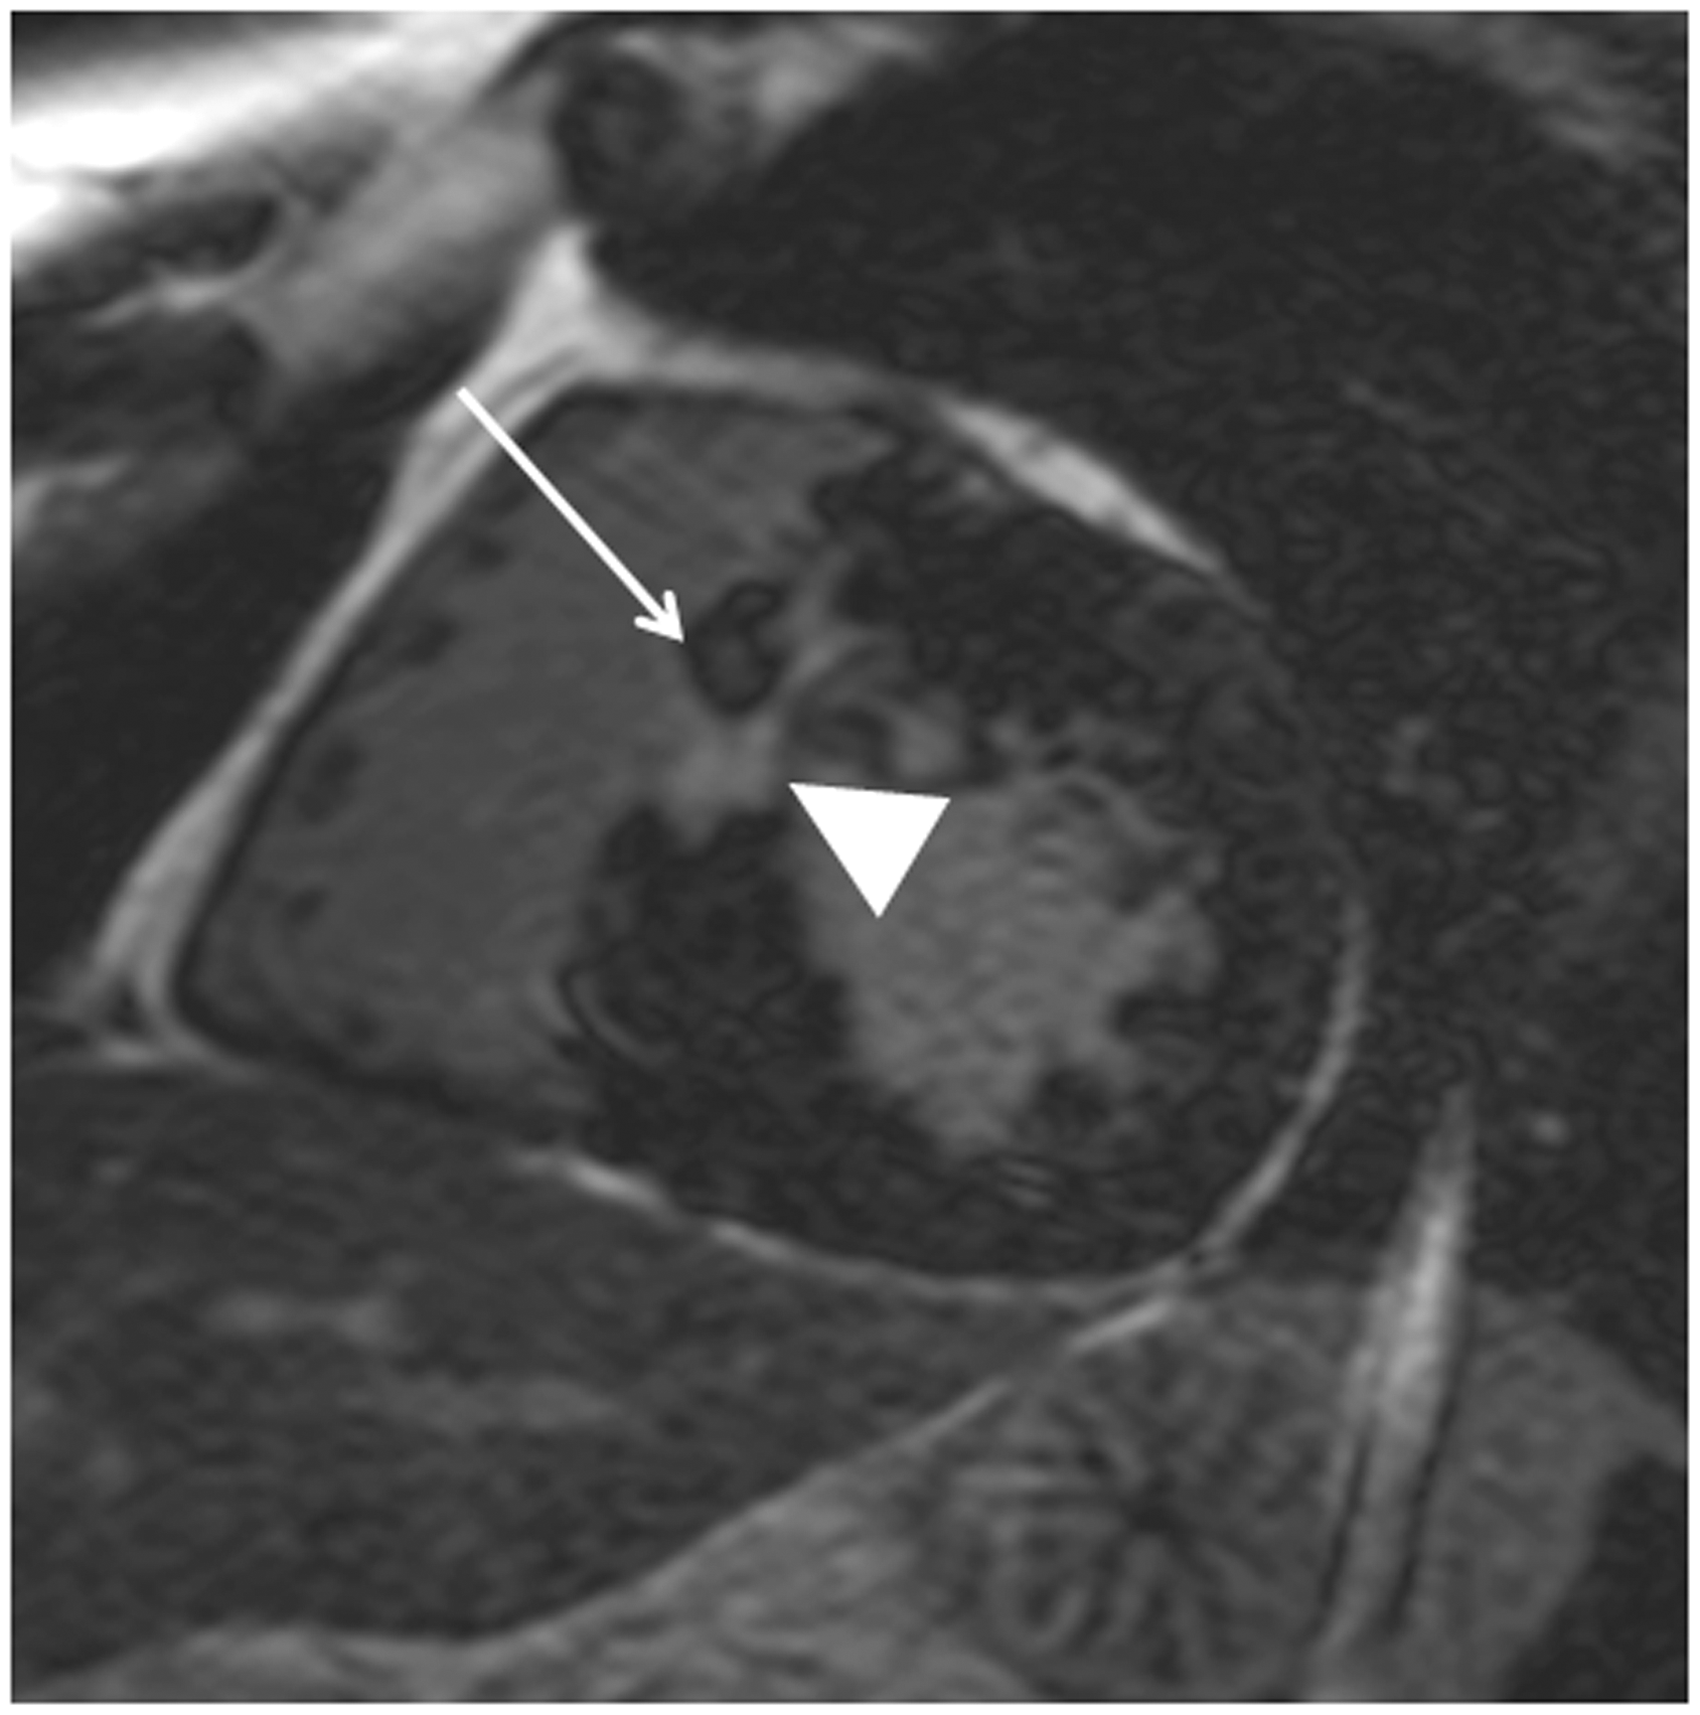
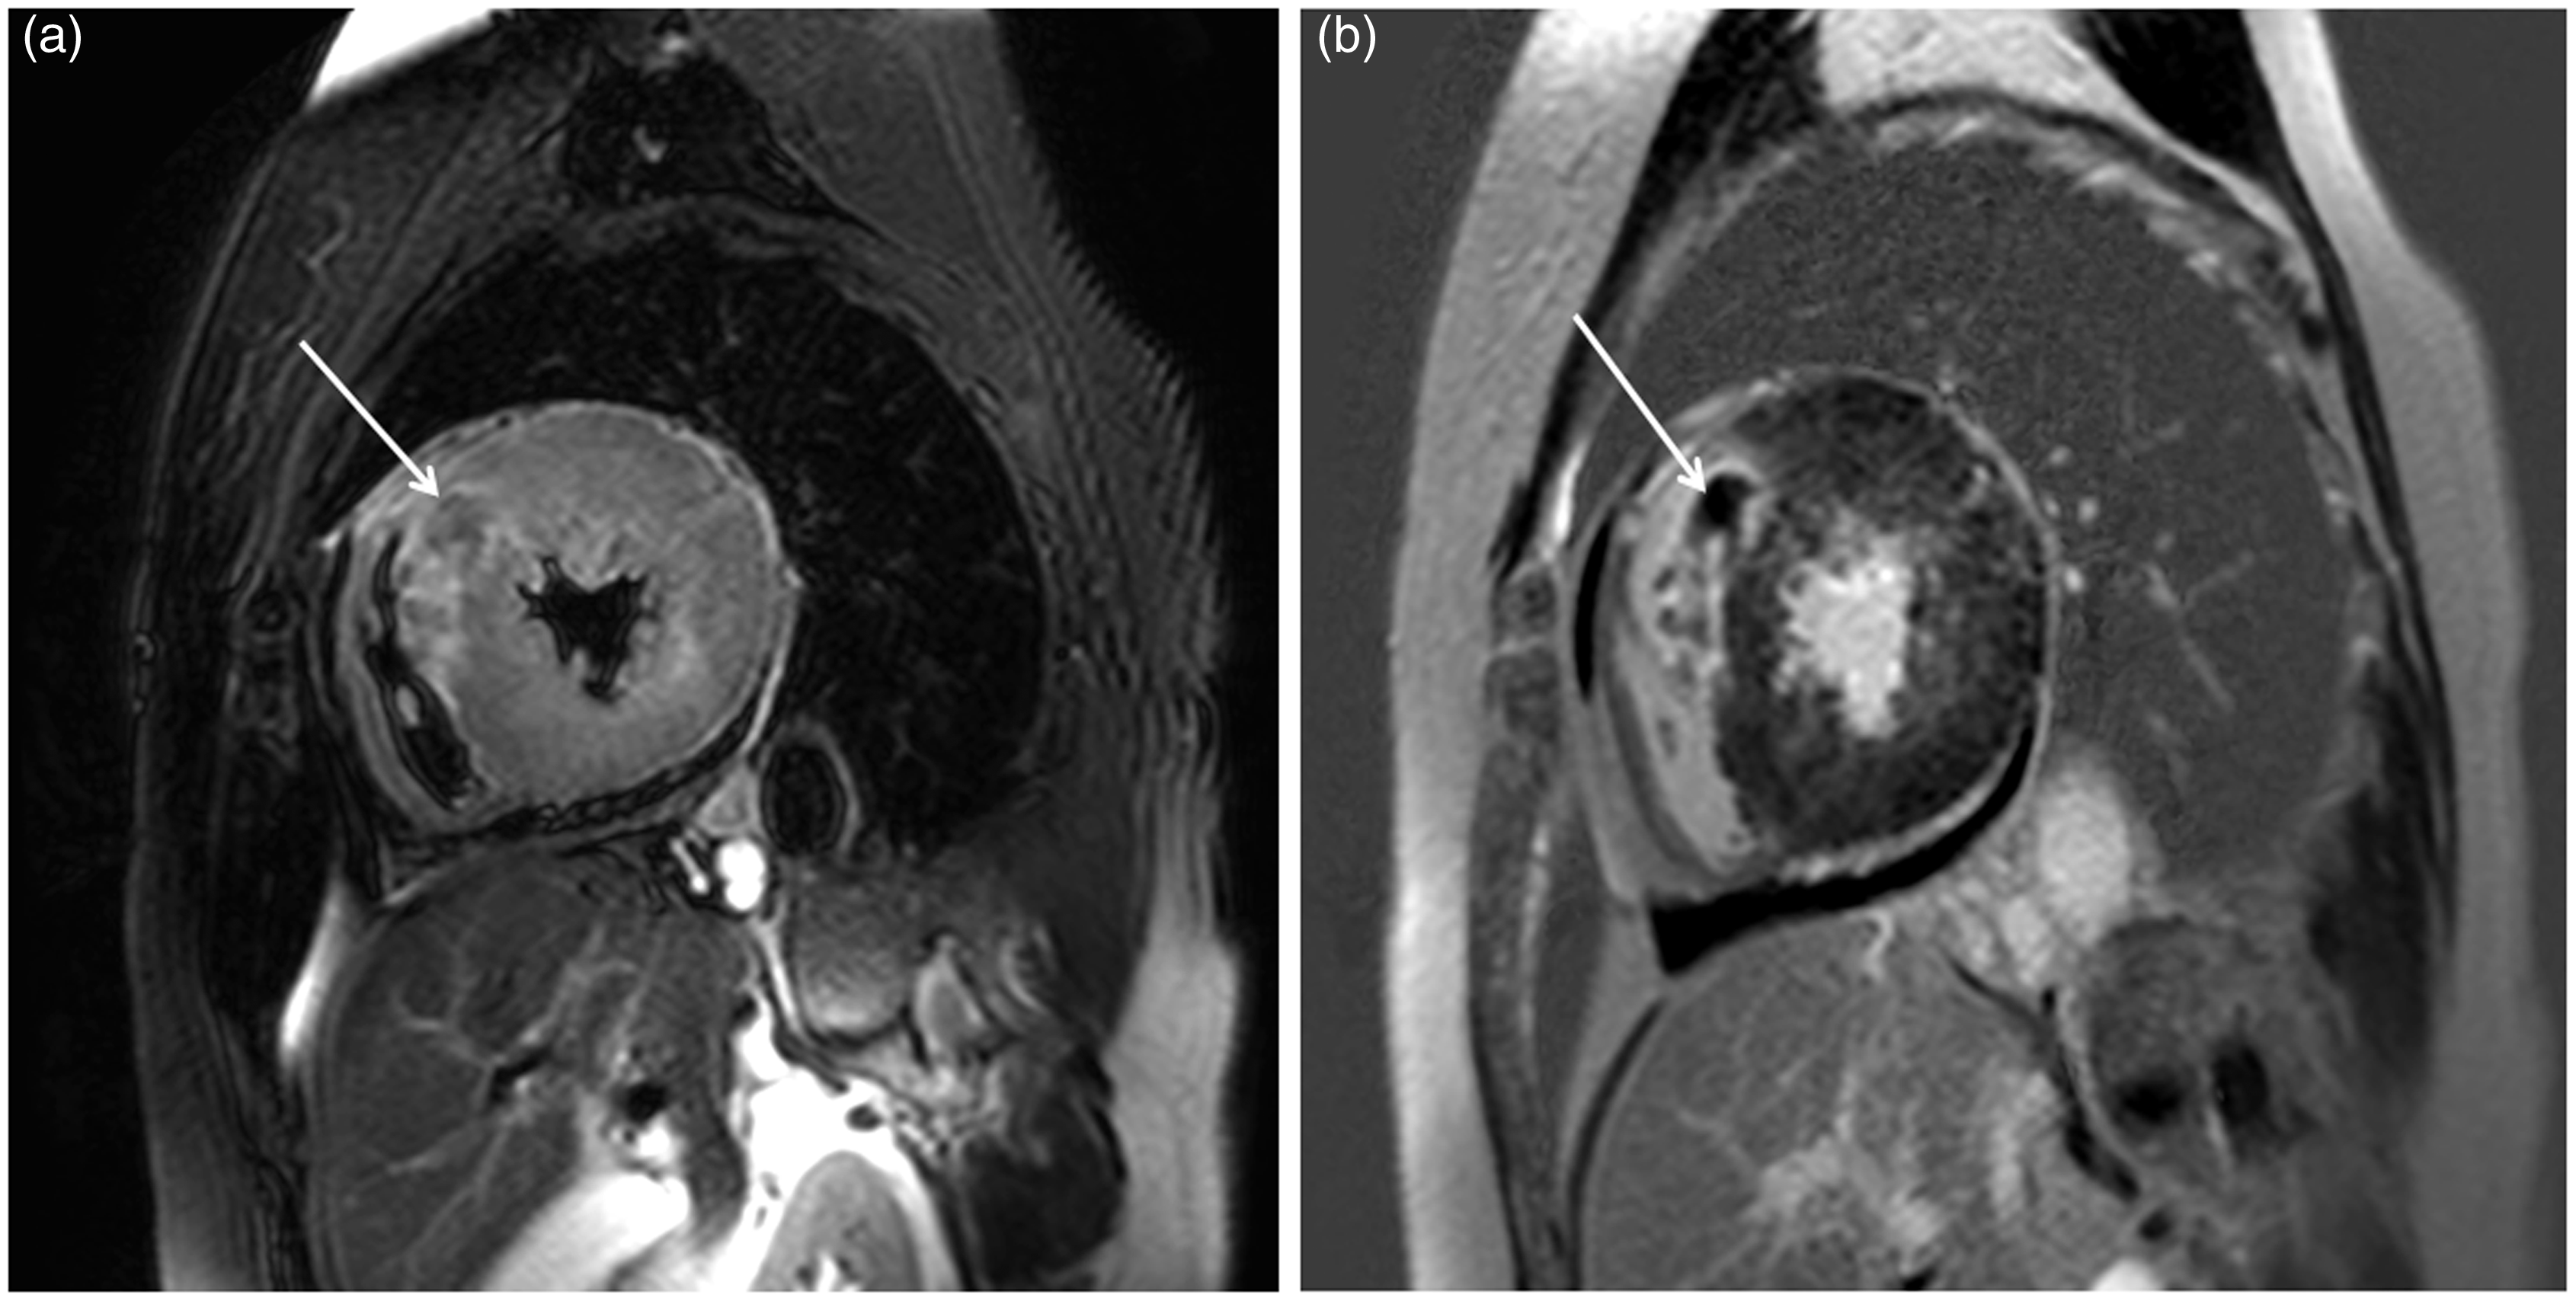
First, we evaluated the presence of MO in terms of the interval between PTSMA and MRI after the procedure. Second, we assessed the relationship between the location of MO and improvement in clinical symptoms or reduction in pressure gradient during the follow-up. The location of MO was defined as follows: left-sided MO was defined as the focal hypointense region surrounding infarction and adjacent to the left ventricular cavity (Fig. 1) and right-sided MO was defined as the focal hypointense region surrounding infarction and adjacent to the right ventricular cavity (Figs. 2 and 3). When both-sided MO was observed, the larger MO was defined. PTSMA was considered to be effective when the NYHA functional class was I and LVOT pressure gradient ≤30.0 mmHg estimated using echocardiography at rest at 3–6 months after PTSMA (4,5,7,9). We evaluated the relationship between the location of MO (left-sided or right-sided) and NYHA functional class (I or II–III) or LVOT pressure gradient (≤30 mmHg or >30 mmHg) after PTSMA using Fisher’s test. We also compared the injected alcohol dose between the patients with and without MO or between the patients with left-sided and right-sided MO using an unpaired t test. In addition, the changes in basal septal wall thickness at end diastole after PTSMA were compared between the patients with left-sided (n = 10) and right-sided MO (n = 4), who had undergone cine SSFP imaging both before and after PTSMA. The presence of myocardial LGE at the basal septum identified before PTSMA was also noted.
A 79-year-old woman with hypertrophic obstructive cardiomyopathy after percutaneous transluminal septal myocardial ablation (PTSMA). Late gadolinium enhancement MRI shows myocardial infarction (arrowhead) and microvascular obstruction adjacent to the left ventricular cavity (arrow). The clinical symptoms improved following PTSMA, and the left ventricular outflow tract pressure gradient was reduced from 130.0 mmHg to 1.0 mmHg. A 52-year-old man with hypertrophic obstructive cardiomyopathy after percutaneous transluminal septal myocardial ablation (PTSMA). MRI was performed 1.5 weeks after PTSMA. Late gadolinium enhancement MRI shows myocardial infarction (arrowhead) and microvascular obstruction adjacent to the right ventricle (arrow). The NYHA functional class was II after PTSMA in this patient. The left ventricular outflow tract pressure gradient was reduced from 108.0 mmHg to 63.0 mmHg, but it was still higher than 30 mmHg. A 61-year-old woman with hypertrophic obstructive cardiomyopathy after percutaneous transluminal septal myocardial ablation (PTSMA). MRI was performed 1.5 weeks after PTSMA. (a) T2W and (b) late gadolinium enhancement MRI show microvascular obstruction as a hypointense area adjacent to the right ventricle (arrow). The septal myocardium close to the left ventricular cavity is preserved. The left ventricular outflow tract pressure gradient is 111 mmHg after PTSMA, and the myocardial thickness of ablated septum has not changed (i.e. 28.8 mm).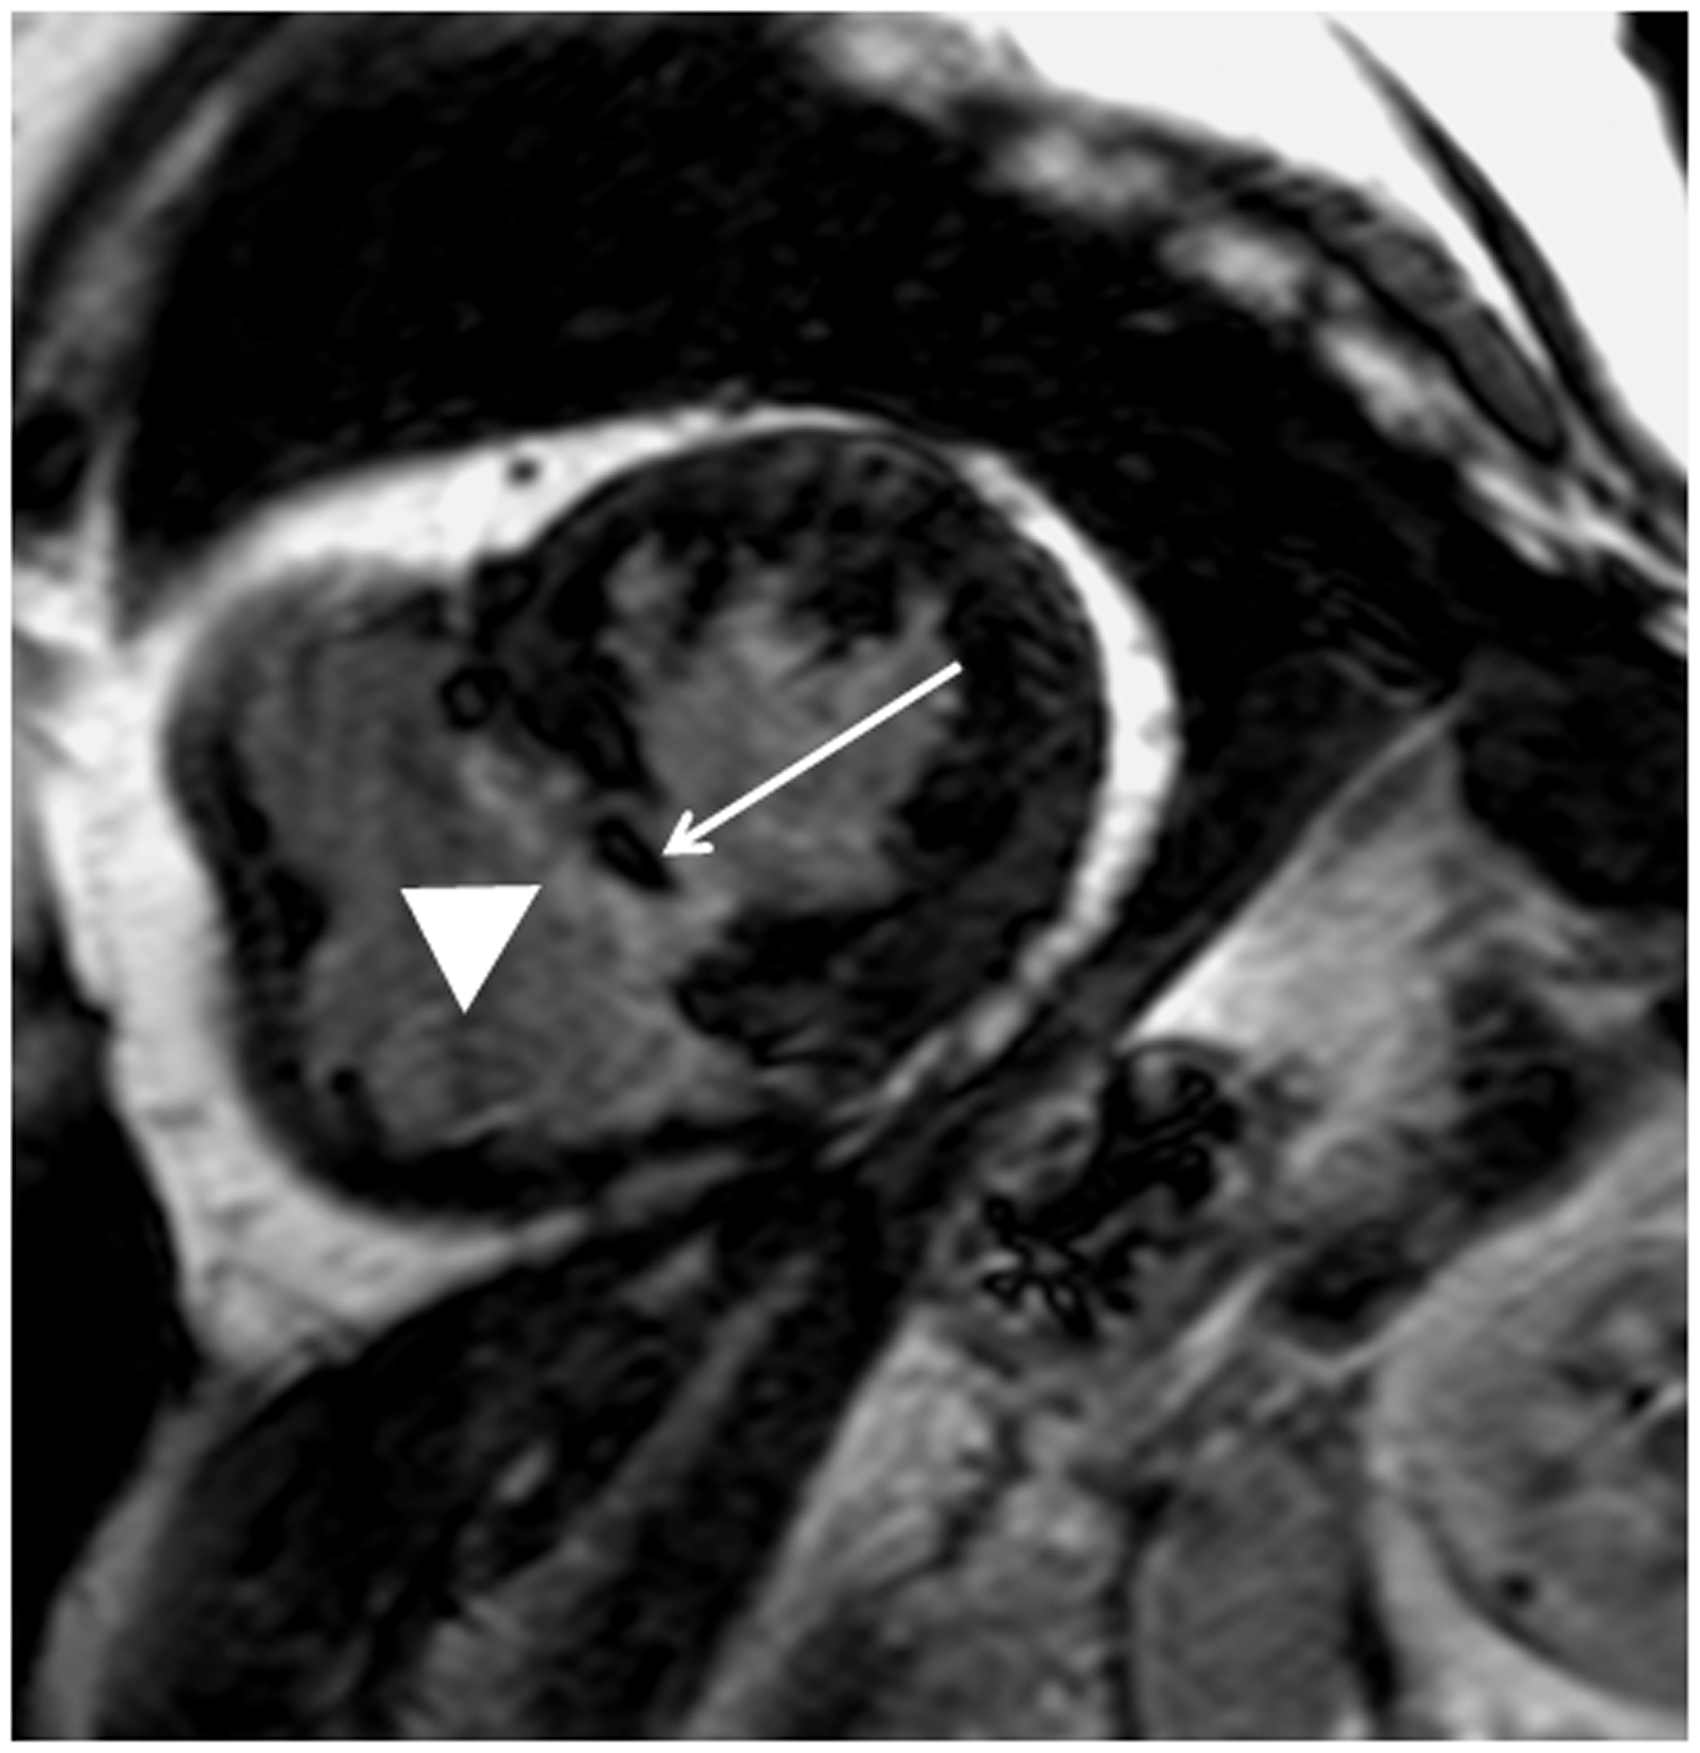
Results
MRI studies before PTSMA were performed in 14 HOCM patients. MRI studies after PTSMA were completed without any complications, and imaging analysis was successfully performed in all but one patient whose LGE MRI showed serious image blurring. Thus, further analysis of MRI images included 22 patients.
MO was observed in 16 patients who underwent MRI within 7 weeks after PTSMA (mean, 2.5 weeks; range, 1–7 weeks). The other six patients did not have MO, and they underwent MRI 7–24 weeks after PTSMA (mean, 12.8 weeks). There were no significant differences in the dose of injected alcohol between patients with and without MO (2.43 ± 1.30 mL vs. 3.45 ± 1.08 mL). Three patients underwent MRI 7 weeks after PTSMA: the patient with MO received 2.3 mL alcohol injection, and the two patients without MO received 2.5 and 2.8 mL alcohol injection.
Left-sided MO was observed in 12 of the 16 patients (Fig. 1), and right-sided MO was observed in the other four patients (Figs. 2 and 3). The alcohol dose used for PTSMA was similar between the patients with left-sided MO (2.07 ± 0.70 mL, 0.9–3.1 mL) and the patients with right-sided MO (3.75 ± 2.19 mL, 2.0–6.9 mL). The basal wall thickness did not change in 10 patients with left-sided MO (16.8 ± 2.0 mm to 16.0 ± 2.0 mm; P = 0.16 using a paired t test) and in four patients with right-side MO (25.7 ± 4.4 mm to 25.6 ± 4.4 mm). The patchy, midwall LGE at the basal septal myocardium was found before PTSMA in two patients with left-sided MO and in two patients with right-sided MO.
The NYHA functional class was reduced from II (n = 11) and from III (n = 1) to I in the patients with the left-sided MO. Three of the patients with right-sided MO had the NYHA functional class III and one patient had class II before PTSMA. The NYHA functional class improved from III to I in one patient but it was II in the three patients with right-sided MO. The LVOT pressure gradient at rest before PTSMA was similar between the 12 patients with left-sided MO (110.0 ± 37.8 mmHg, 60.0–174.0 mmHg) and the four patients with right-sided MO (113.3 ± 50.6 mmHg, 57.0–180.0 mmHg). After PTSMA, all but one patient with the left-sided MO had the pressure gradient below 30.0 mmHg (25.3 ± 30.8 mmHg, 1.0–55.0 mmHg), whereas the gradient was higher than 30.0 mmHg in all patients with the right-sided MO (82.0 ± 25.7 mmHg, 58.0–111.0 mmHg). There was a significant relationship between the location of MO and the NYHA functional class (P = 0.0027) or LVOT pressure gradient (P = 0.0049) after PTSMA. In the two patients with the right-sided MO and the NYHA functional class II after PTSMA, the dose or administration of cibenzoline changed.
Discussion
MO is the serious myocardial damage associated with myocardial infarction due to coronary artery diseases (11,12). MO is also found within myocardial infarction induced by PTSMA for HOCM (9). Thus, we sought to evaluate the relationship between its location and clinical effectiveness of PTSMA. MO was identified using T2W and LGE MRI performed within 7 weeks after PTSMA for HOCM. Right-sided MO was related to a less effective PTSMA at the short-term follow-up. In contrast, it was unlikely that the dose of injected alcohol, or septal wall thickness, or its change after PTSMA and myocardial LGE before PTSMA were related to the effectiveness of PTSMA.
T2W and LGE MRI performed within 7 weeks after PTSMA clearly visualized MO after PTSMA in HOCM patients. T2W imaging is sensitive to coagulation and hemorrhage in pathological tissue, which are investigated in the myocardium after PTSMA (15,16). LGE MRI identified MO as the hypointense region localized in the subendocardial layer and surrounded by infarction, which indicate no reflow and coagulation (11,12).
Four of the 16 patients had right-sided MO despite the fact that PTSMA was performed through the left coronary septal branch arteries. All patients with left-sided MO showed improvement in clinical symptoms, whereas those with right-sided MO had the NYHA functional class II or LVOT pressure gradient higher than 30 mmHg. The location of MO was significantly related to the effectiveness of PTSMA at the short-term follow-up. Consequently, two patients required a change in dose or time of administration of cibenzoline. Therefore, the right-sided MO might indicate the limited relief of the LVOT obstruction. Van Dockum et al. (5) have demonstrated that the right-sided location of septal infarction on LGE MRI is related to less reduction in the LVOT pressure gradient after PTSMA. MO was included to infarction and the clinical symptoms after PTSMA were not analyzed in that study. The distal septal branch may be ablated in the patients with right-sided infarction in their study. Because the location of MO may reflect subendocardial myocardium receiving the blood supply from the ablated arteries, the location strongly indicates the septal artery distribution (11,12,17,18). The interventricular septum composes of both ventricular myocardium, the numbers and length of septal branch arteries are variable, and there are rich anastomoses or complicated networks at the basal septum (17,18). These factors may allow the injected alcohol to flow into the right-sided myocardium of the basal septum. We can recognize the blood flow distribution at the hypertrophied basal septum and suggest the early effectiveness of PTSMA by paying attention on the location of MO.
This study had some limitations. First, the samples size was small. In addition, the patients with right-sided MO occupied only 25% of our study population. Similarly, van Dockum et al. (5) have reported that approximately 30% of the 24 HOCM patients had exclusively right-sided septal infarction after PTSMA. Further study with a larger population will be necessary to determine the significance of the right-sided MO after PTSMA. Second, three of the four patients with the right-sided MO had the NYHA functional class III before PTSMA. The septal wall thickness before PTSMA was likely greater in these patients. These might have contributed to the limited effectiveness of PTSMA in these patients. Third, the interval between PTSMA and MRI was various because of the temporal pacemaker implantation and the clinical status. Nonetheless, the present study indicates that MRI within 7 weeks after PTSMA is appropriate for identification of MO. Finally, the follow-up duration after PTSMA was relatively short. Indeed, the short-term evaluation remains inherently important to patients and clinicians who perform PTSMA. The long-term observation of clinical symptoms, laboratory data, echocardiography, and MRI are needed to determine the prognostic value of MO in patients with HOCM after PTSMA.
In conclusion, MRI performed within 7 weeks after PTSMA for HOCM are useful for identifying the presence and location of MO. Left-sided MO is related to complete improvement in clinical symptoms and pressure gradients, and right-sided MO may reflect a less effective PTSMA at the short-term follow-up.
Footnotes
Conflict of interest
None declared.
Funding
This research received no specific grant from any funding agency in the public, commercial, or not-for-profit sectors.