
Abstract
Background
Renal oncocytoma (RO) and chromophobe renal cell carcinoma (ChRCC) share histologic and some imaging features.
Purpose
To investigate the multidetector computed tomography (MDCT) characteristics of these two tumor types.
Material and Methods
Fifty-six patients with RO and 54 patients with ChRCC were studied retrospectively. MDCT was undertaken to investigate differences in tumor characteristics.
Results
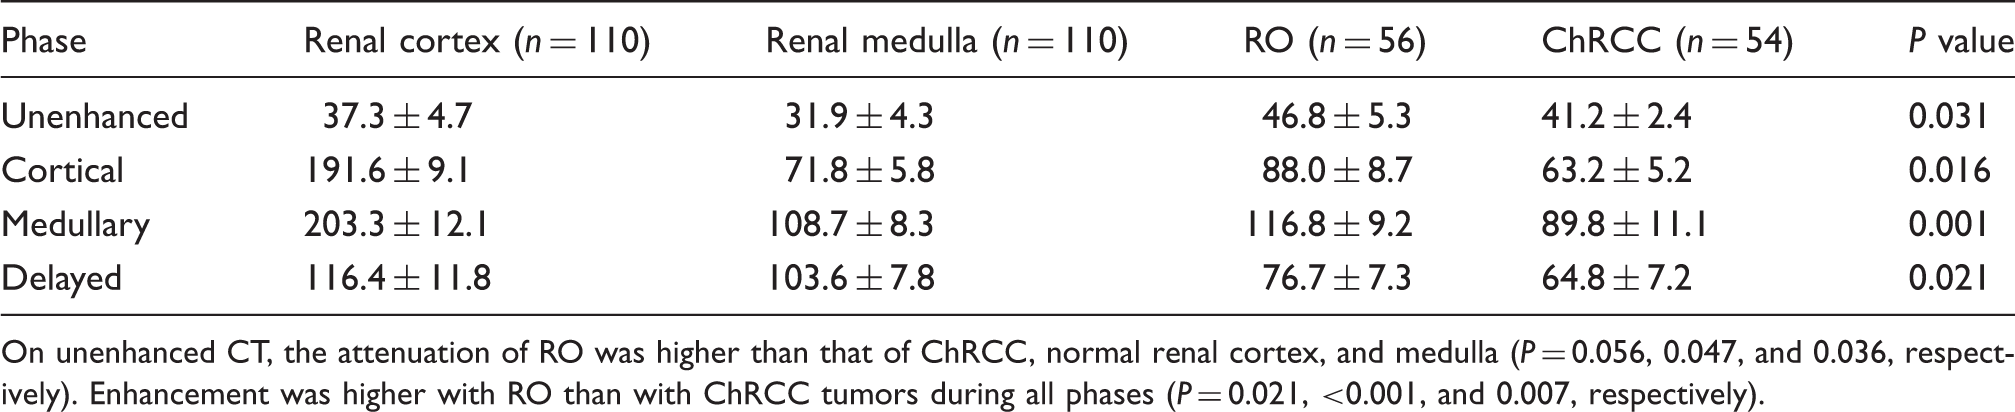
Calcifications were visible in 24 (42.8%) patients with RO and in 11 (20.4%) patients with ChRCC (P = 0.011). 26 patients with RO had stellate scars as did 14 patients with ChRCC (P = 0.025). Spoken-wheel-like enhancement was visible in 41 patients with RO and in 11 with ChRCC (P < 0.001). Thirty-nine (69.6%) patients with RO and nine (16.7%) patients with ChRCC showed segmental inversion (P < 0.001). Two patients with RO had retroperitoneal lymph node enlargement as did 13 patients with ChRCC (P = 0.002). Combined evaluation of stellate scar, spoken-wheel-like enhancement, and segmental enhancement inversion features were found to have a sensitivity of 99.1% (106 of 107), a specificity of 100% (3 of 3), a positive predictive value of 100% (106 of 106), and a negative predictive value of 75% (3 of 4). The attenuation of RO tumors was greater than that of ChRCC tumors, normal renal parenchyma on unenhanced CT (P = 0.031). Enhancement was higher with RO than with ChRCC tumors in all phases (P = 0.021, < 0.001, and 0.007, respectively).
Conclusion
CT imaging features such as stellate scar, spoken-wheel-like enhancement, and segmental enhancement inversion were more common in RO and they may help in differentiating RO from ChRCC.
Introduction
Chromophobe renal cell carcinoma (ChRCC) is postulated to arise from the intercalated cells of the renal cortex. It is interesting that ChRCC and renal oncocytoma (RO) have much in common regarding morphologic, histologic, immunohistochemical, and ultrastructural aspects (1,2). ROs develop from type B intercalated cells of the cortical collecting duct and are indistinguishable from ChRCCs on imaging studies, sharing features such as central scar, and spoke wheel pattern of enhancement (3). Despite these common features, RO and ChRCC exhibit differences in prognosis (4). RO is considered benign in that it does not usually show renal vein invasion, postoperative recurrence, or distant metastases. ChRCC is an RCC subtype with overall favorable prognosis compared with other RCCs, including slower growth and significantly lower rates of metastases, progression, and death (5,6). ChRCC is generally managed via partial nephrectomy when technically possible, and routine radical nephrectomy for this entity would be gross mismanagement, with needlessly exposing the patient to greater risk of reduced renal function and associated higher rate of cardiovascular events from the more extensive surgery (7). The purpose of the present study was to retrospectively characterize multidetector computed tomography (MDCT) characteristics which lead to the histological diagnosis of RO and ChRCC.
Material and Methods
Patients
This study was approved by the Institutional Research Ethics Committee. A search of pathology records and PACS system identified 56 patients with RO and 54 patients with ChRCC who were hospitalized at our hospital between 2001 and 2013. Details of the patient’s gender, surgery or biopsy confirmation, and clinical symptoms were recorded.
CT technique
CT examinations were performed by using a 16 detector row scanner (CT Lightspeed Ultra, GE Healthcare, Milwaukee, WI, USA; [n = 27]), or a 64 detector row scanner CT (Somatom Definition, Siemens Medical Solutions, Forchheim, Germany; [n = 83]). Intravenous contrast material (iopromide, Ultravist 370; Bayer Schering Pharma AG, Berlin, Germany) was administered at a dose of 2 mL per kg of body weight and at a rate of 3 mL/s to a maximum of 150 mL by using a power injector, or at a slower rate (minimum of 2 mL/s) if required when venous access was suboptimal. All patients underwent unenhanced, arterial phase (cortical phase), cortico-medullary phase (medullary phase), and excretory phase (delayed phase). Unenhanced imaging was performed before administering the intravenous contrast agent. The contrast-enhanced CT scans began after 20 s for the arterial phase (cortical phase), 65 s for the cortico-medullary phase (medullary phase), and 300 s for the excretory phase (delayed phase). The scanning parameters varied for the different scanners but were for all phases in the following ranges: tube voltage, 120 kVp (constant for all); tube current, 150–250 mA (depending on patient size); pitch, 0.891–1.6; section thickness, 1.25–5.0 mm; reconstruction interval, 2.5–5 mm, and rotation time, 0.5–0.75 s.
Imaging analysis
Two radiologists with more than 10 years of experience each, blinded to the final diagnosis, reviewed the CT images in consensus at a picture archiving and communication system (PACS) workstation. The parameters evaluated included tumor calcification and attenuation on unenhanced CT scans. The degree of enhancement on the different phases of the enhanced CT scans were thereafter assessed.
The attenuation of the tumor, normal renal cortex, and medulla were measured during all enhanced phases. The measured tumor area (the region of interest [ROI]) was at the center of the mass to avoid partial volume effects, however, intratumoral calcification and cystic components were excluded from the ROI if central necrosis or calcifications were considered. Normal renal cortex and medulla were measured using uninvolved homolateral renal cortex and medulla. Each 10 mm ROI was measured three times for each phase and the mean value was used.
The enhancement pattern of the tumor was classified as homogeneous or heterogeneous. The degree of enhancement was based on dynamic CT imaging using Hounsfield unit (HU) attenuation of the tumor, renal cortex, and medulla.
Statistical analysis
Statistical analysis was undertaken using SPSS version 17.0 statistical software (SPSS Inc, Chicago, IL, USA). Numeric data were expressed as means and standard deviations (±SD) and categorical data were expressed as percentages. Evaluated characteristics were compared between the two tumor types using chi-square test, analysis of variance (ANOVA); post-hoc test (Tukey) was performed after ANOVA. Values of P < 0.05 were considered statistically significant.
To assess the diagnostic performance of stellate scar, spoken-wheel-like enhancement, and segmental enhancement inversion in terms of differentiating ROs from ChRCCs, the sensitivity, specificity, and positive and negative predictive value of these signs were calculated.
Results
The study included 56 patients (26 women, 30 men) with RO and 54 patients (28 men, 26 women) with ChRCC. The presenting symptoms of RO and ChRCC included flank pain (25 and 28 patients), hematuria (34 and 26 patients), palpable mass (12 and 13 patients), and fever (22 and 34 patients) in each group, respectively.
Comparative study of CT appearances in RO and ChRCC.
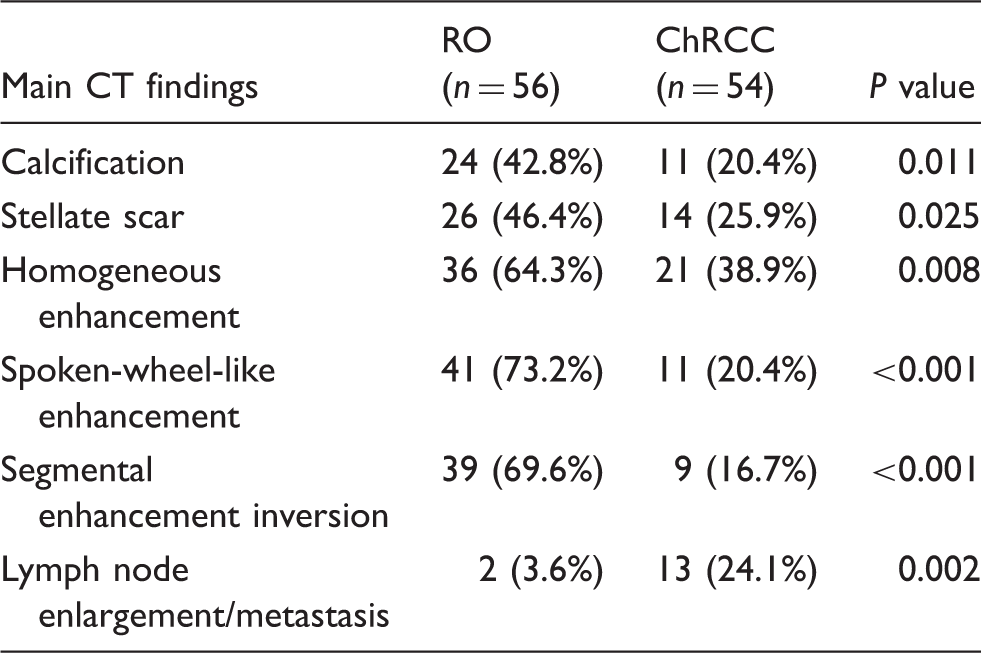
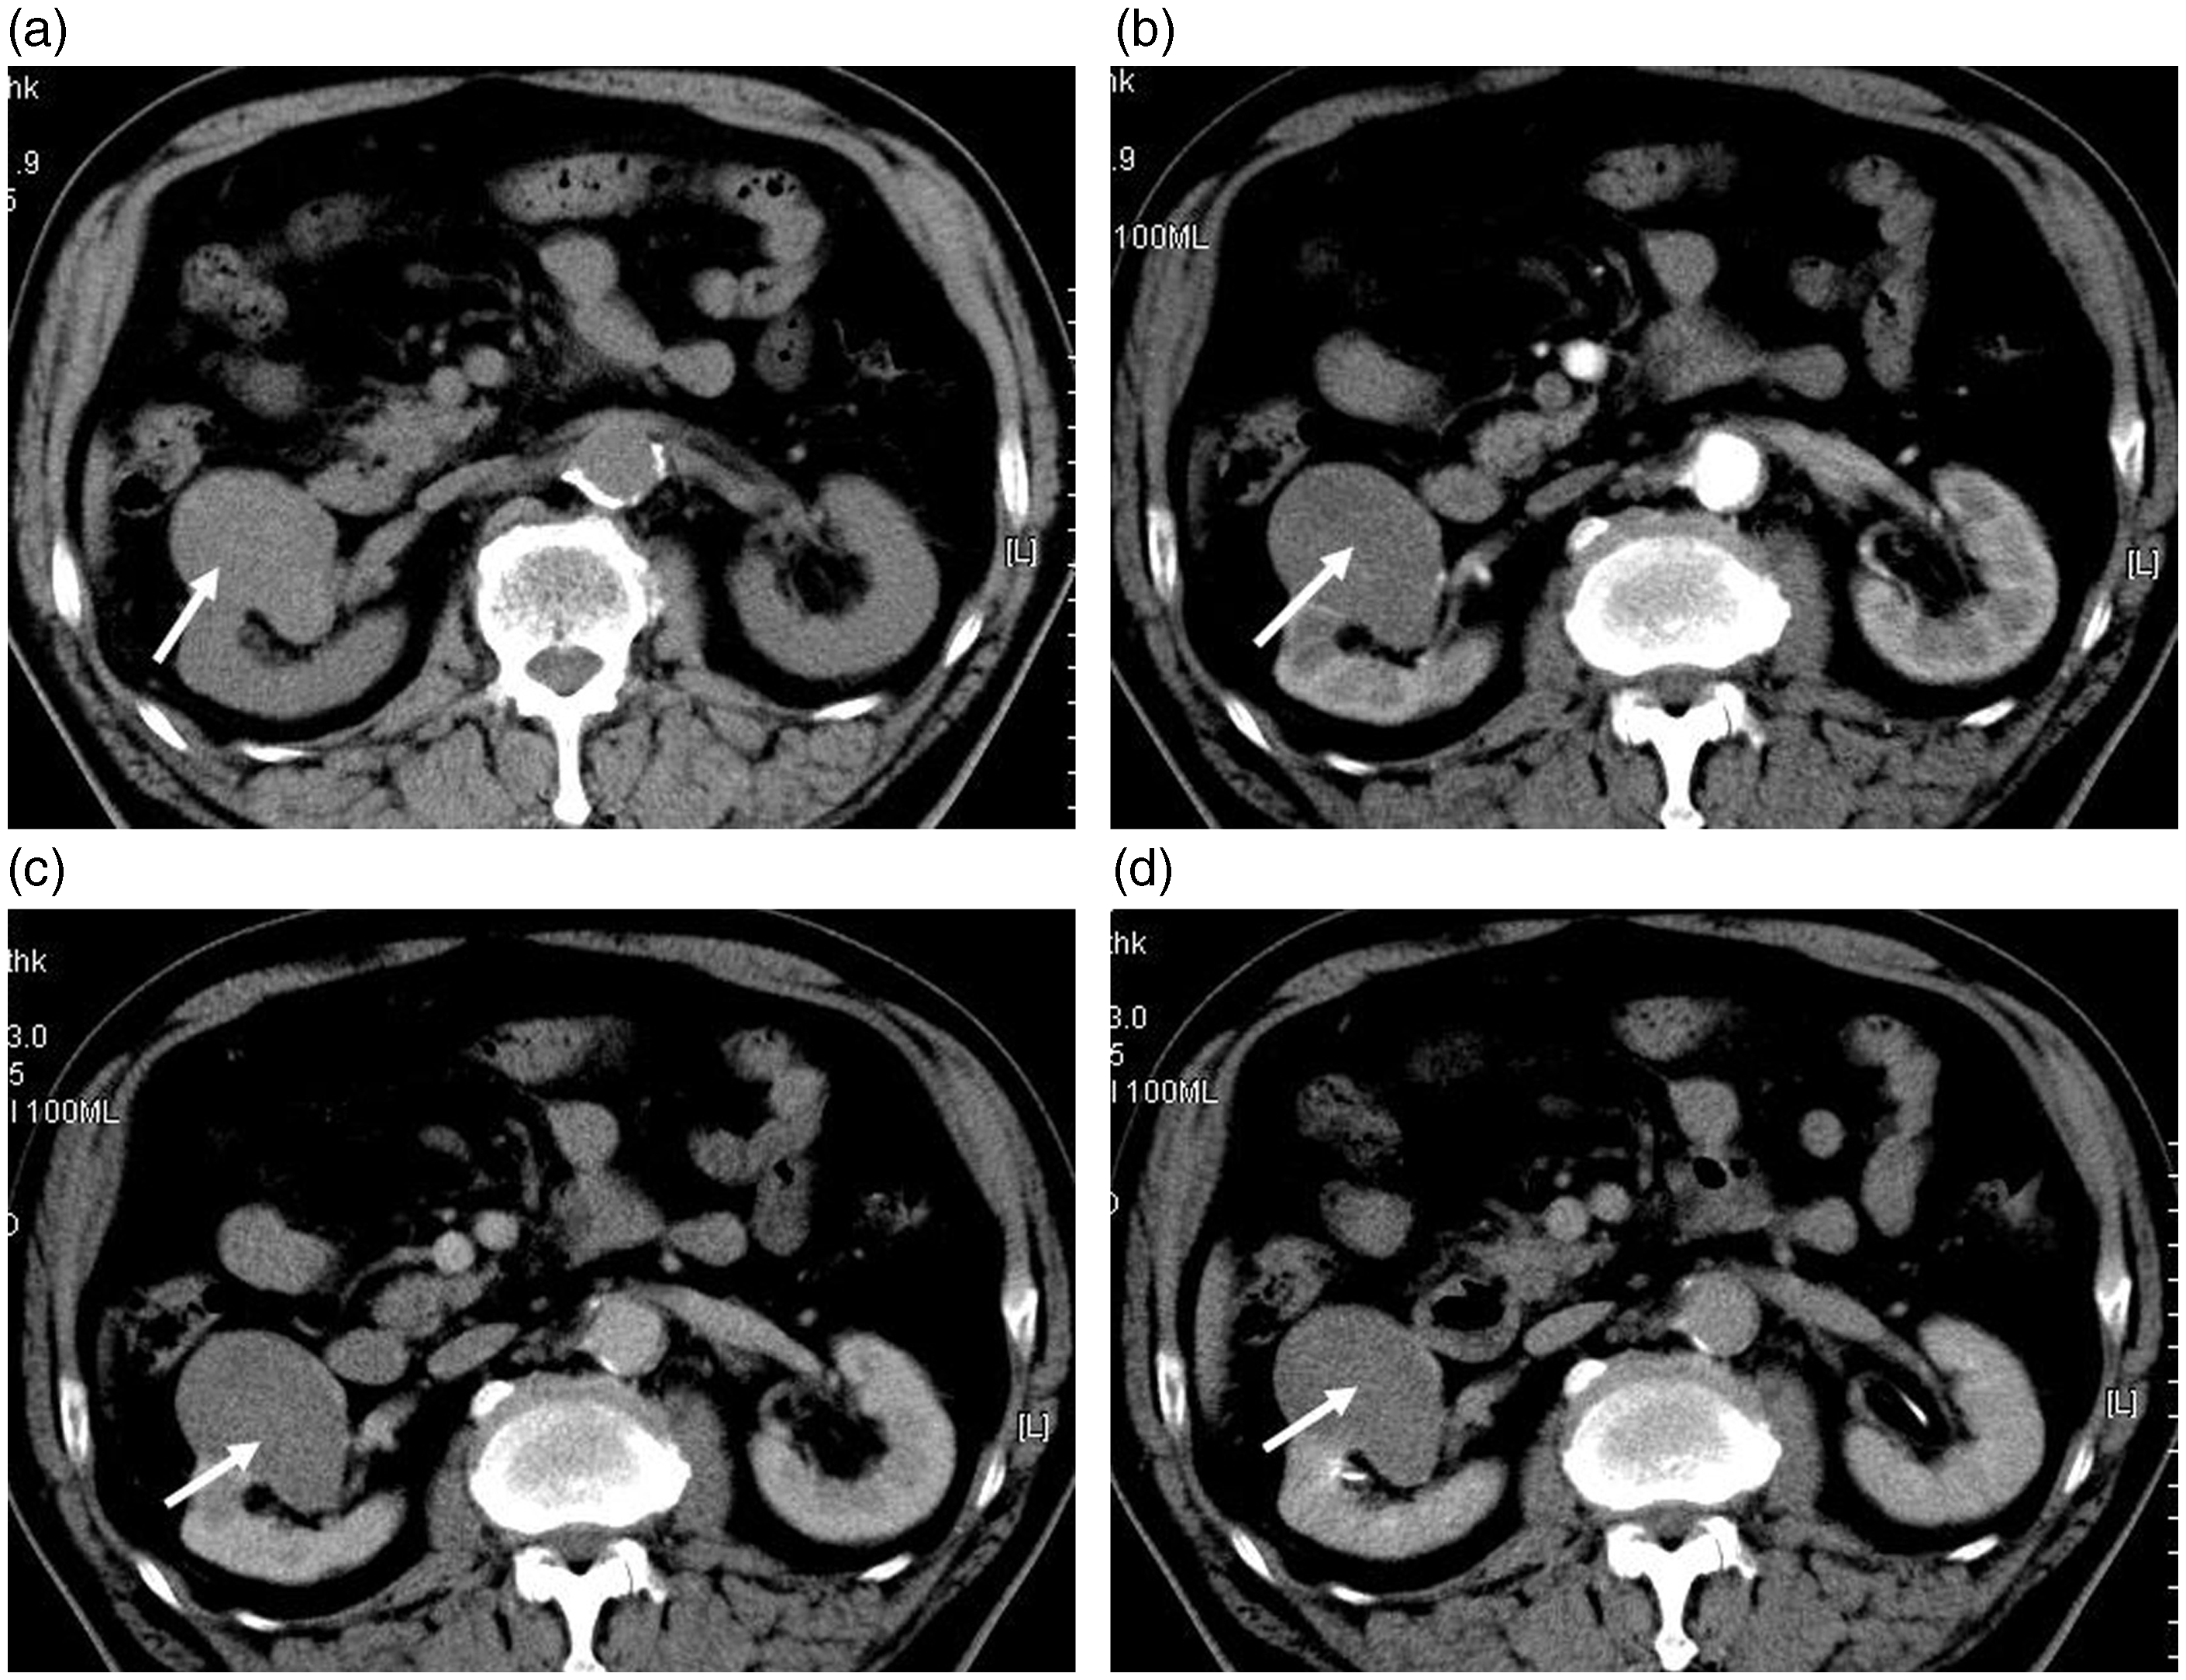
RO of left kidney in a 39-year-old-woman. (a) Unenhanced CT scan showed a mild hyperdense mass together with cystic component (arrow). The attenuation of the mass was 47 HU. (b) Contrast-enhanced CT scan showed spoken-wheel-like enhancement and stellate scar (black arrow) on the cortical phase. (c, d) Contrast-enhanced CT scan showed segmental enhancement inversion on corticomedullary and delayed phases (white and black arrows).
RO of left kidney in a 51-year-old-man. (a) Unenhanced CT scan showed a mild hyperdense mass (arrow). The attenuation of the mass was 47 HU. (b) Contrast-enhanced CT scan showed heterogeneous enhancement on the cortical phase. (c, d) Contrast-enhanced CT scan showed segmental enhancement inversion (white arrows) and stellate scar (black arrow) on corticomedullary and delayed phases.
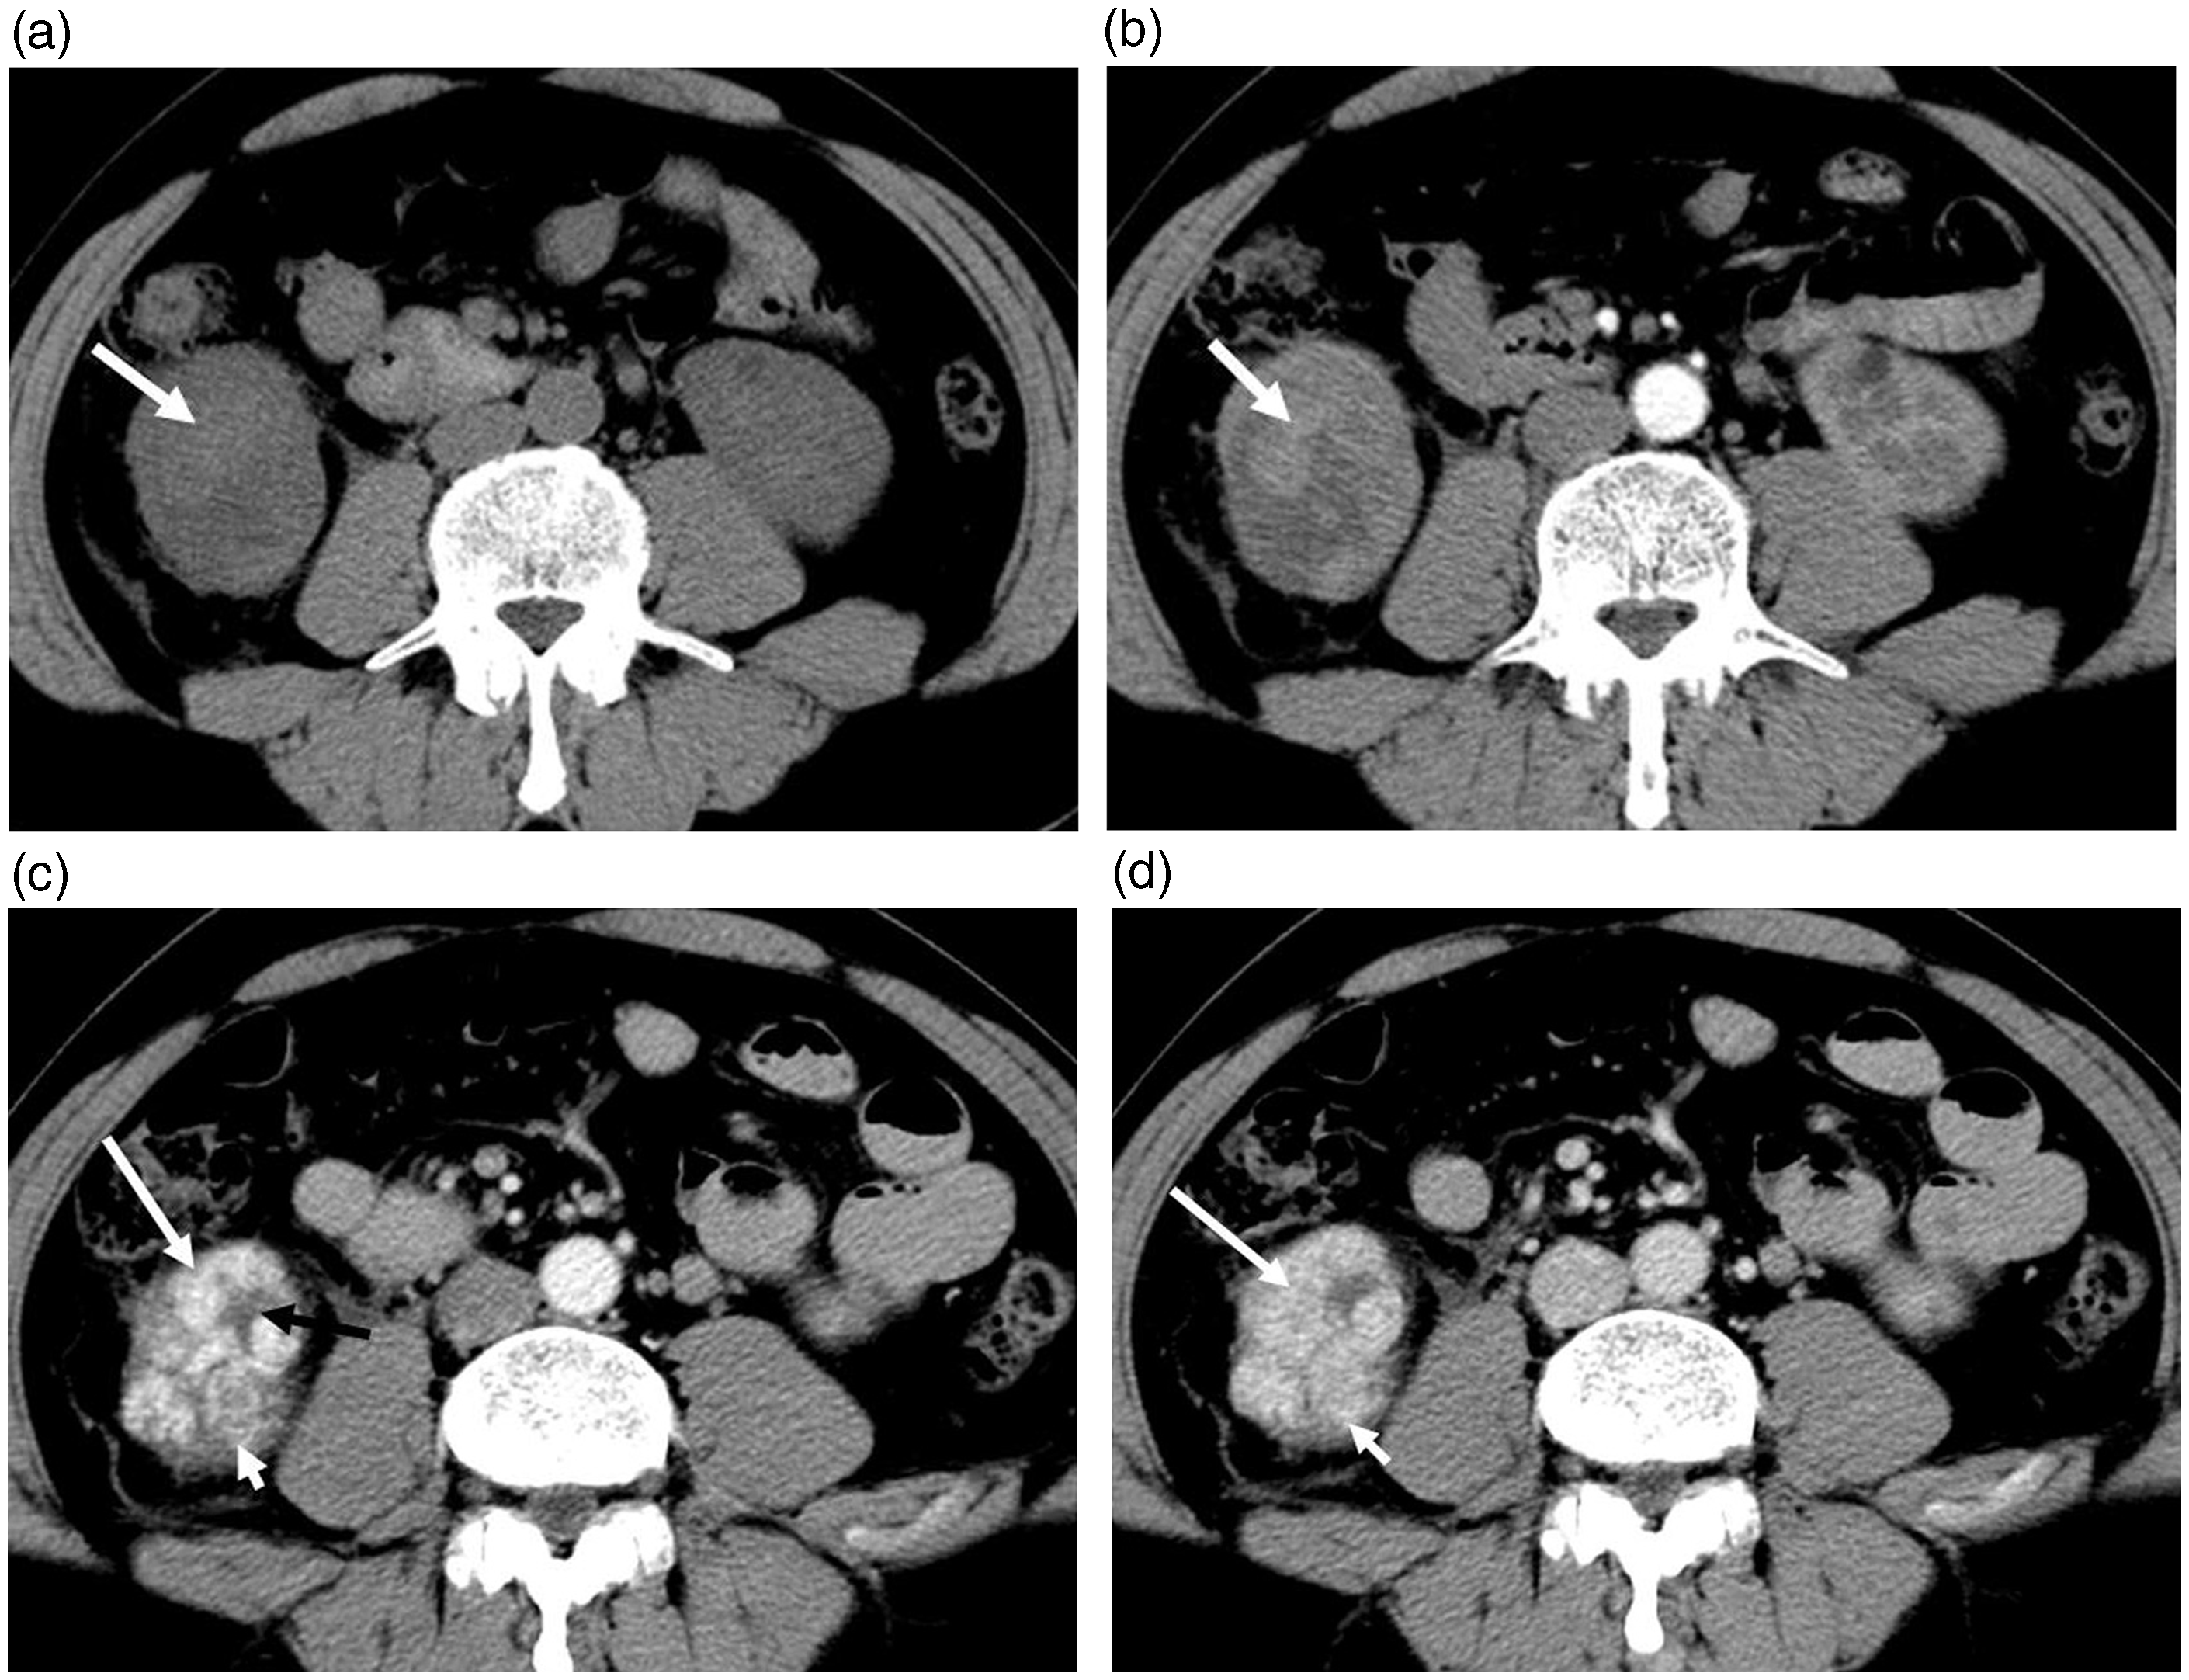
The CT values of RO, ChRCC, normal renal cortex, and medulla.
On unenhanced CT, the attenuation of RO was higher than that of ChRCC, normal renal cortex, and medulla (P = 0.056, 0.047, and 0.036, respectively). Enhancement was higher with RO than with ChRCC tumors during all phases (P = 0.021, <0.001, and 0.007, respectively).
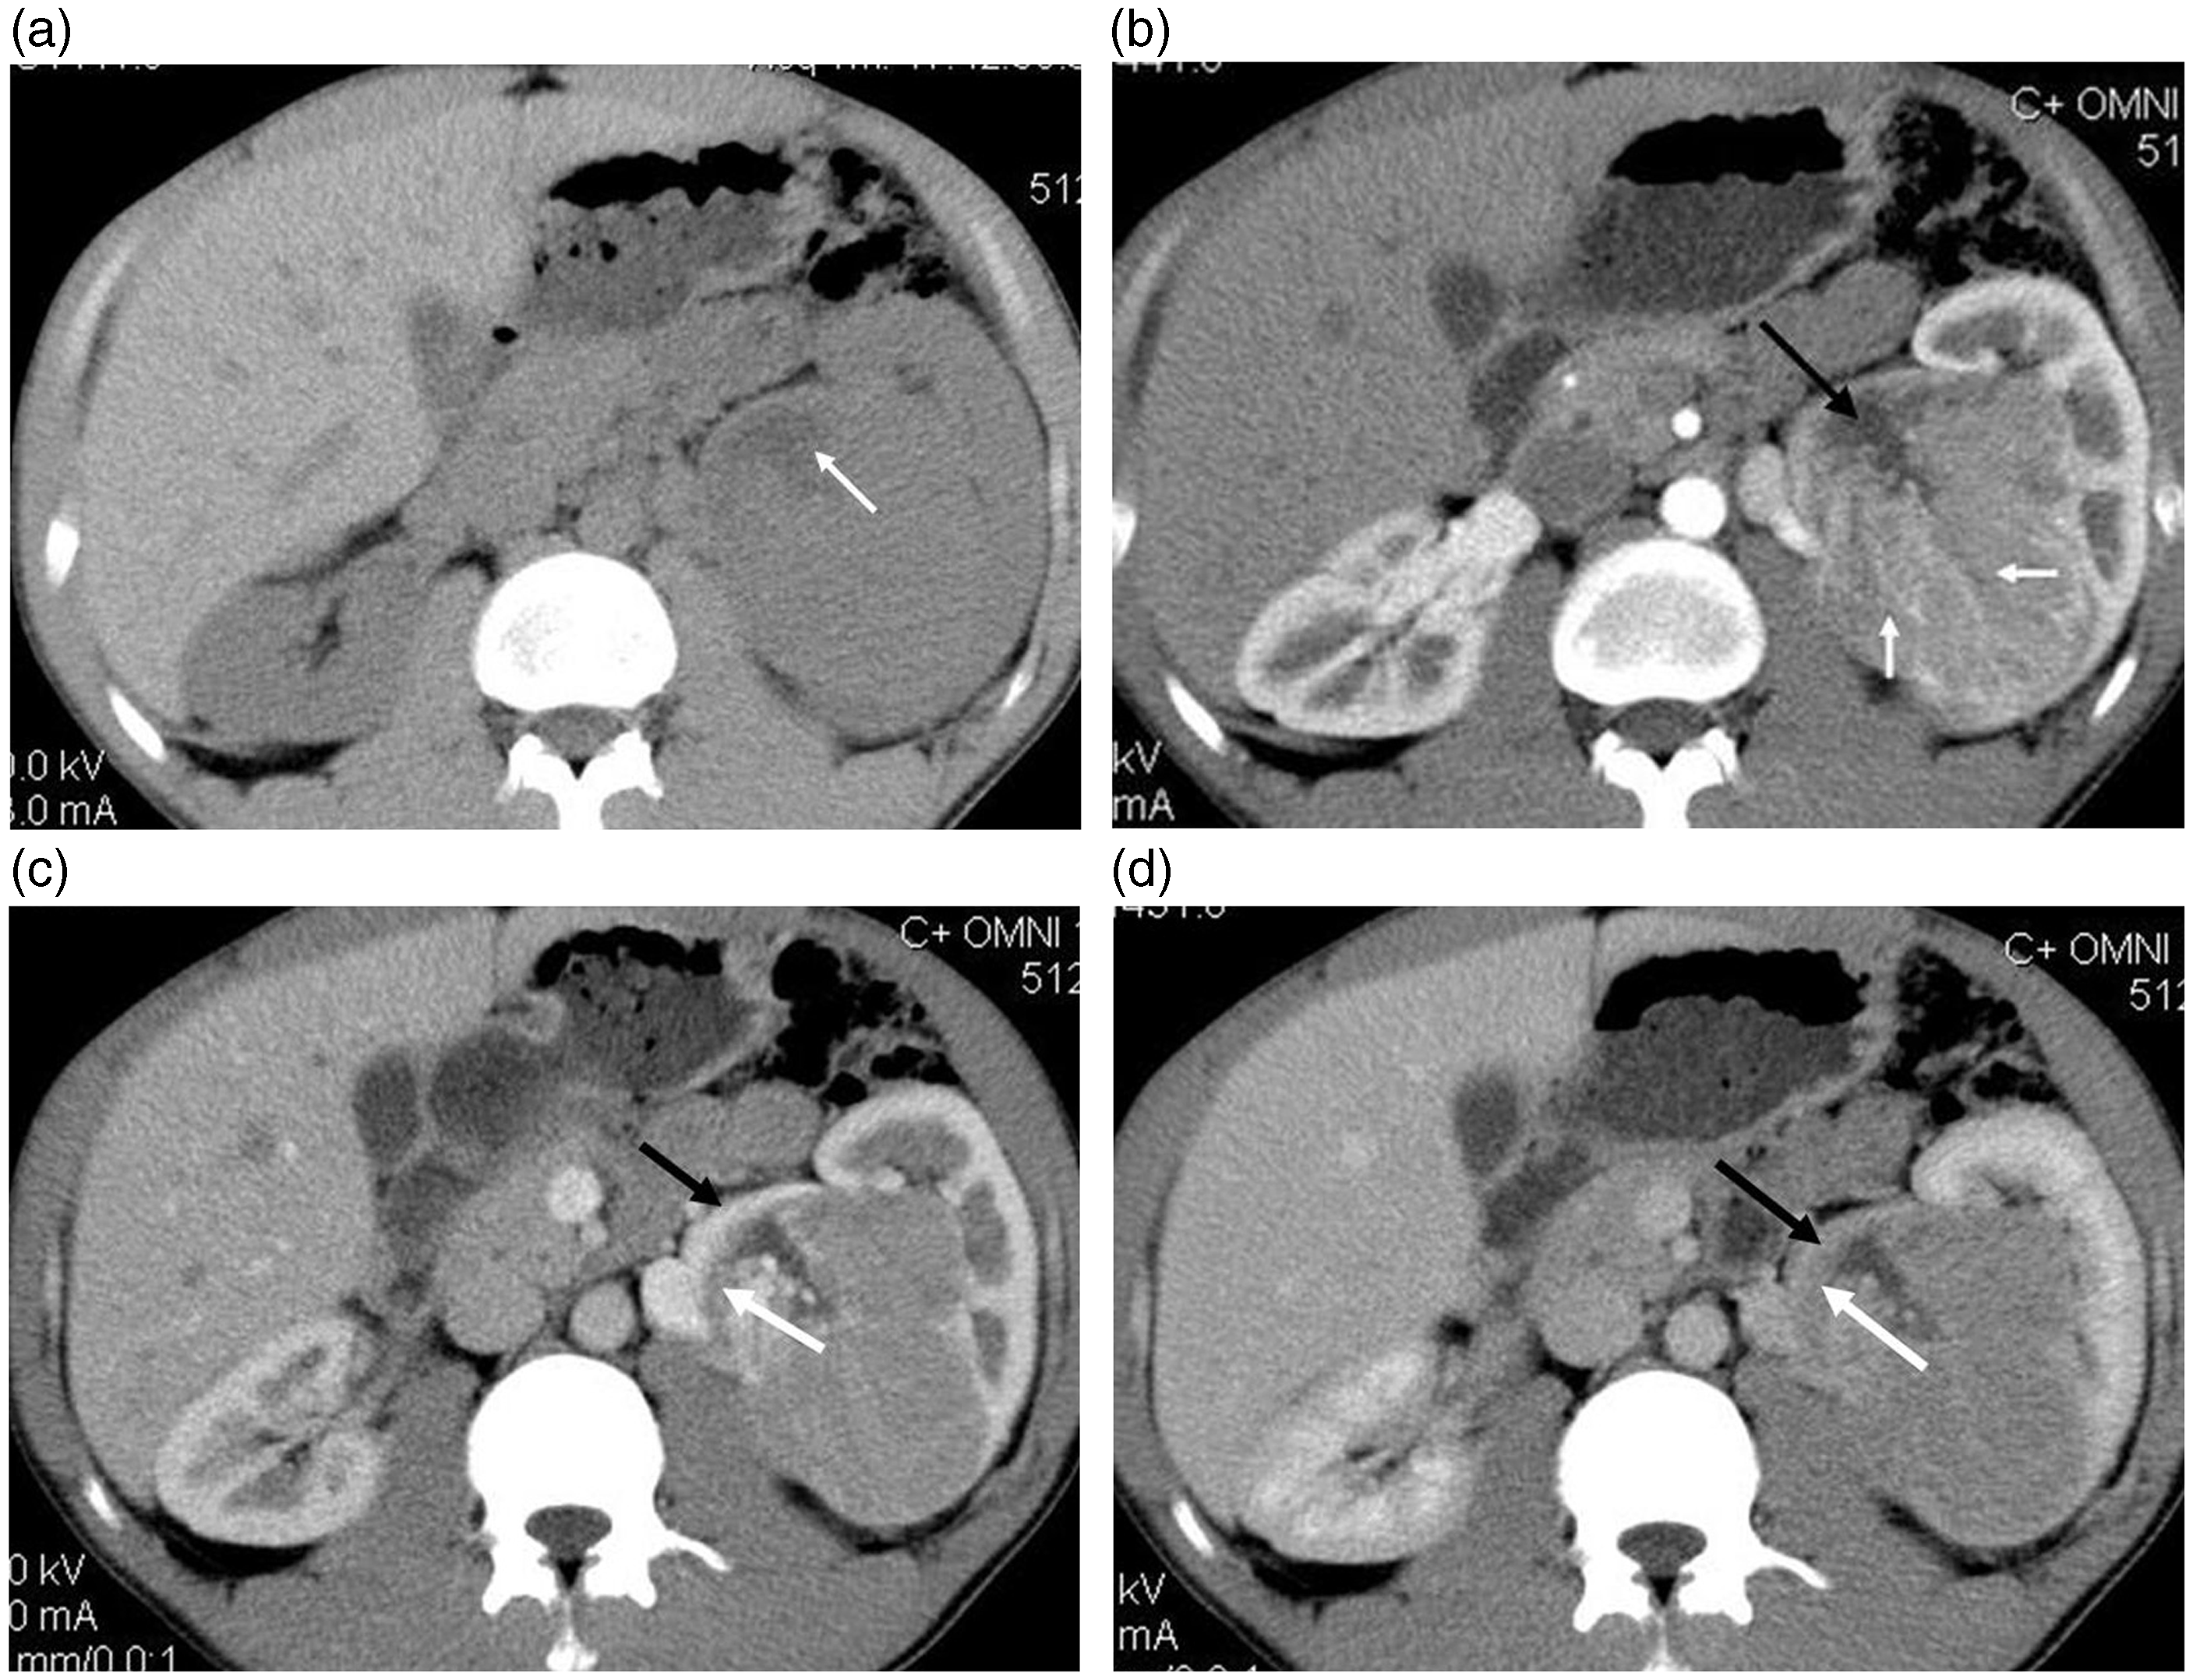
ChRCC of right kidney in a 72-year-old-man. (a) Unenhanced CT scan showed an iso-attenuation mass with a clearly defined margin (arrow). The attenuation of the mass was 42 HU. (b) Contrast-enhanced CT scan showed mild enhancement less than the cortex on the cortical phase (59 HU, arrow). (c) The attenuation of the tumor (72 HU) increased (arrow) during the medullary phase and (d) decreased (62 HU) during the delayed phase.
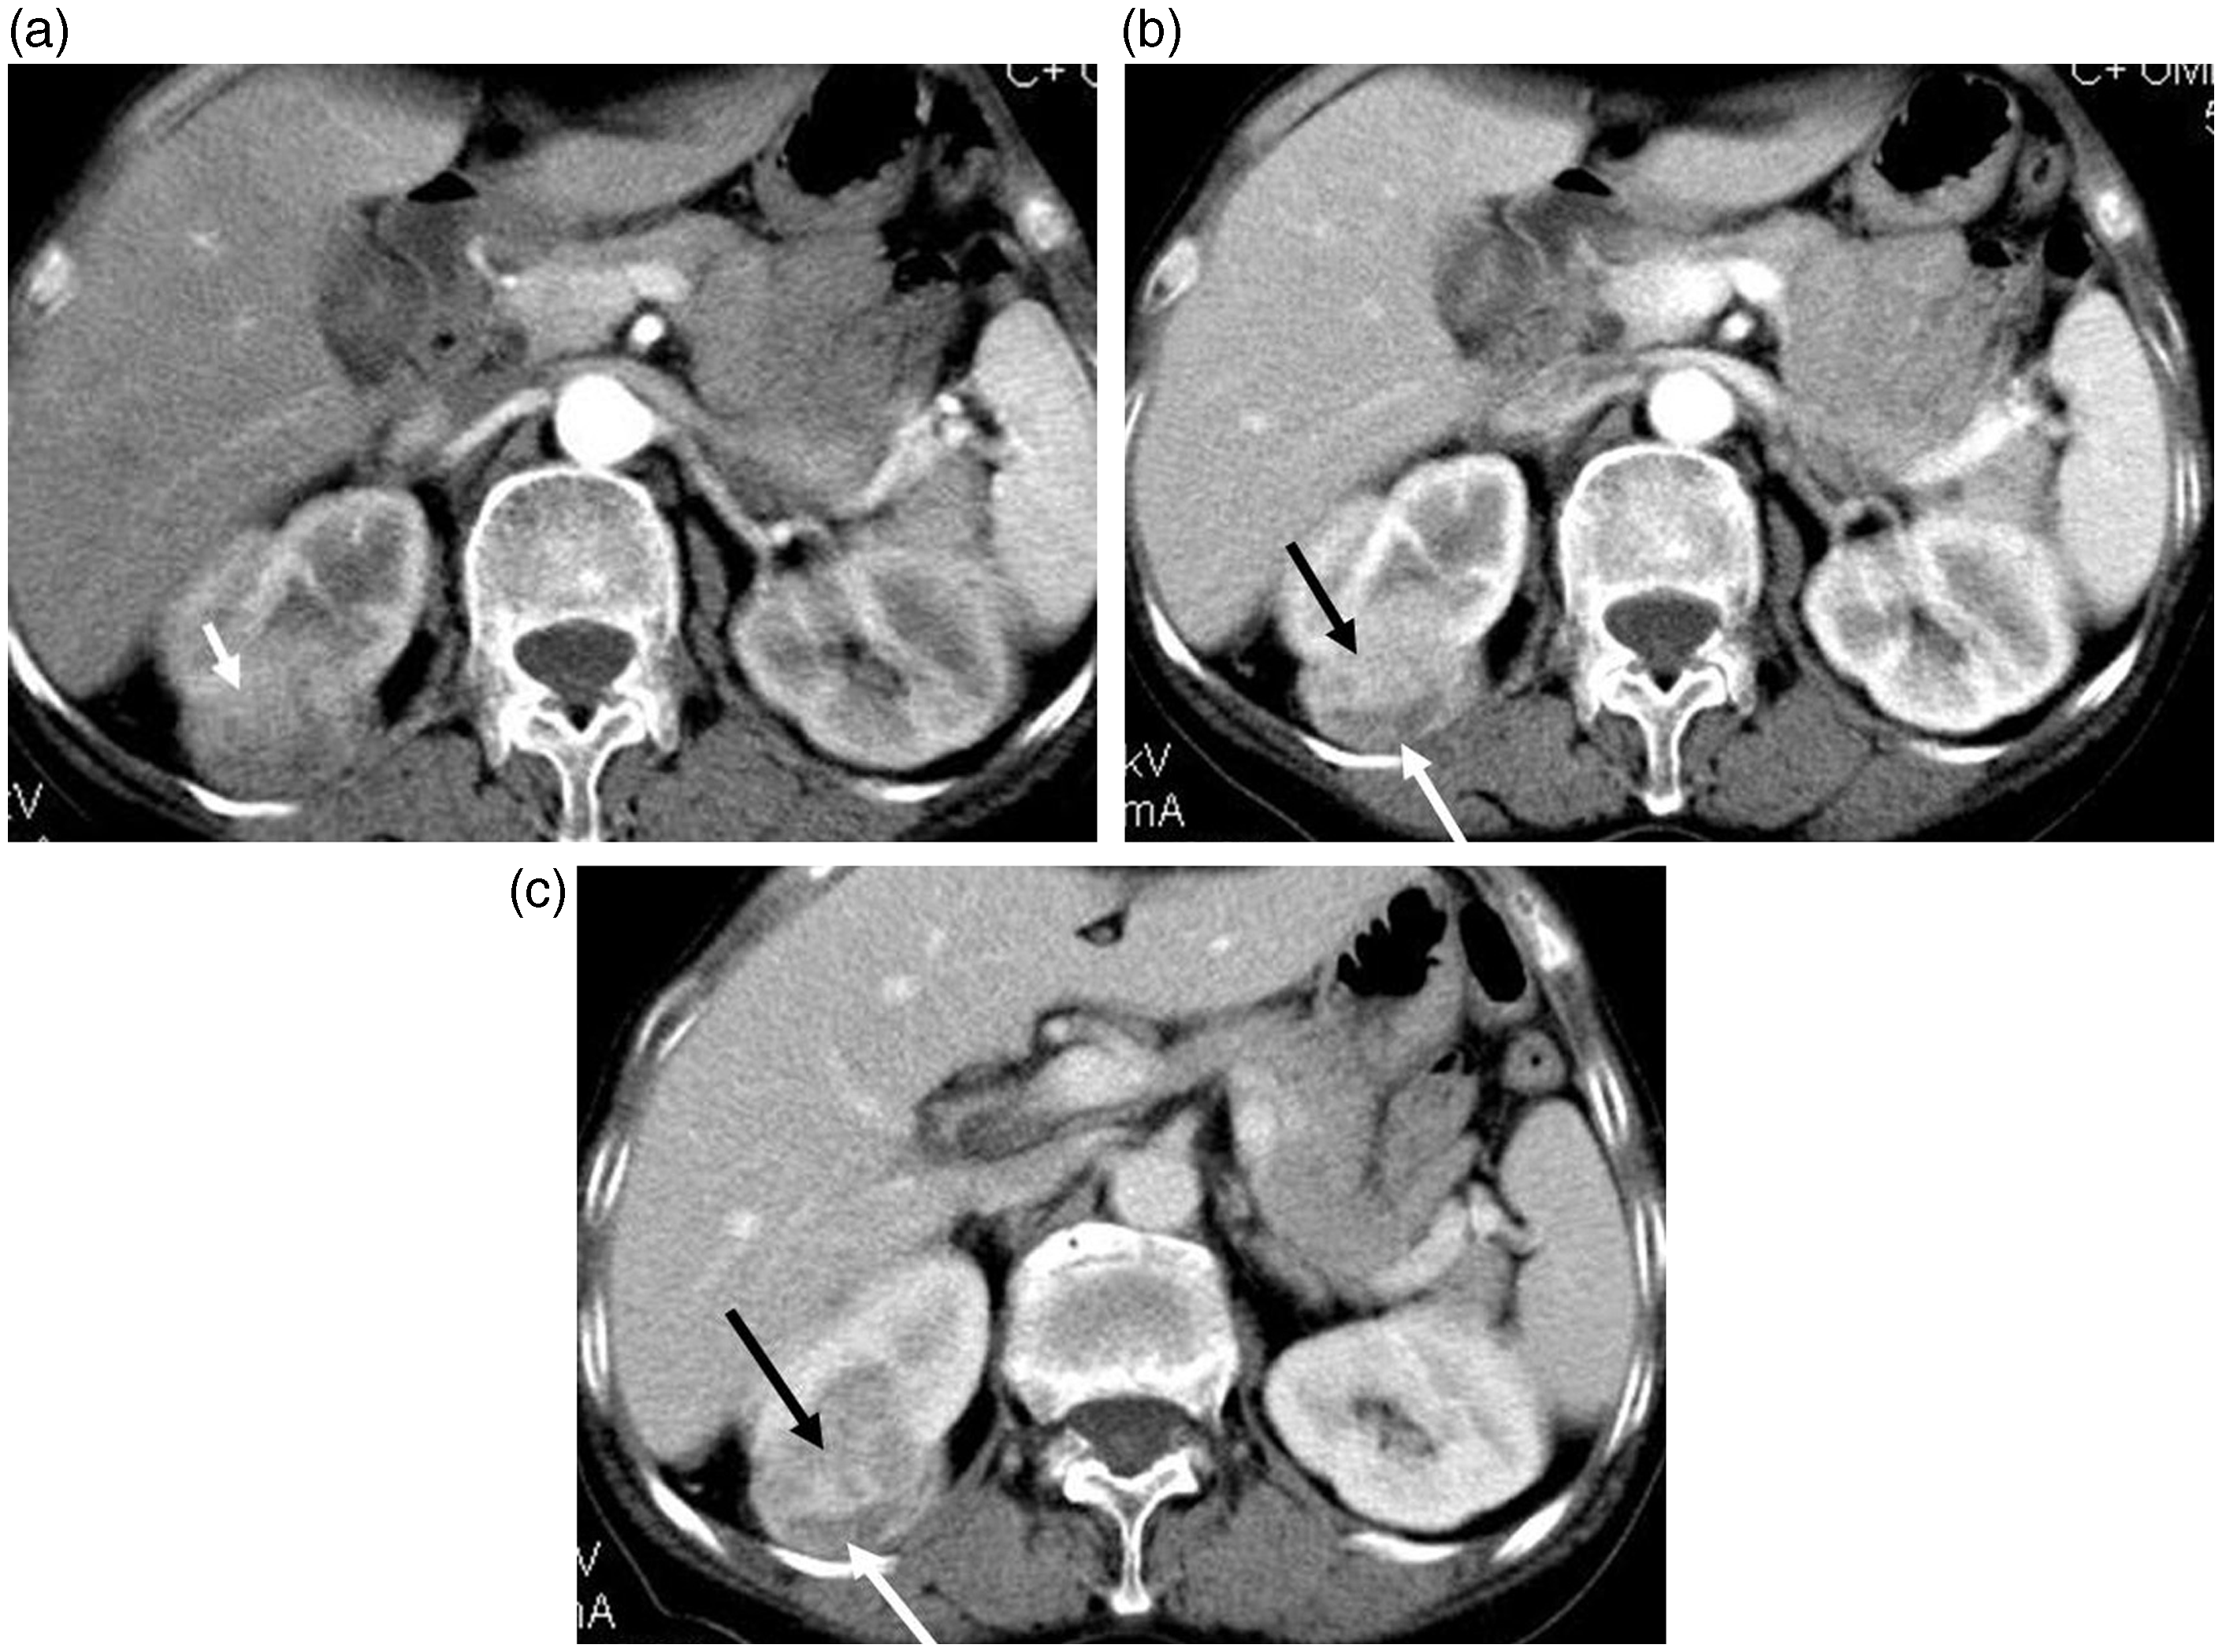
ChRCC of right kidney in a 57-year-old-man. (a) Mild, heterogeneous enhancement was noted on the cortical phase. (b, c) Contrast-enhanced CT scan showed segmental enhancement inversion on corticomedullary and delayed phases (black and white arrows).
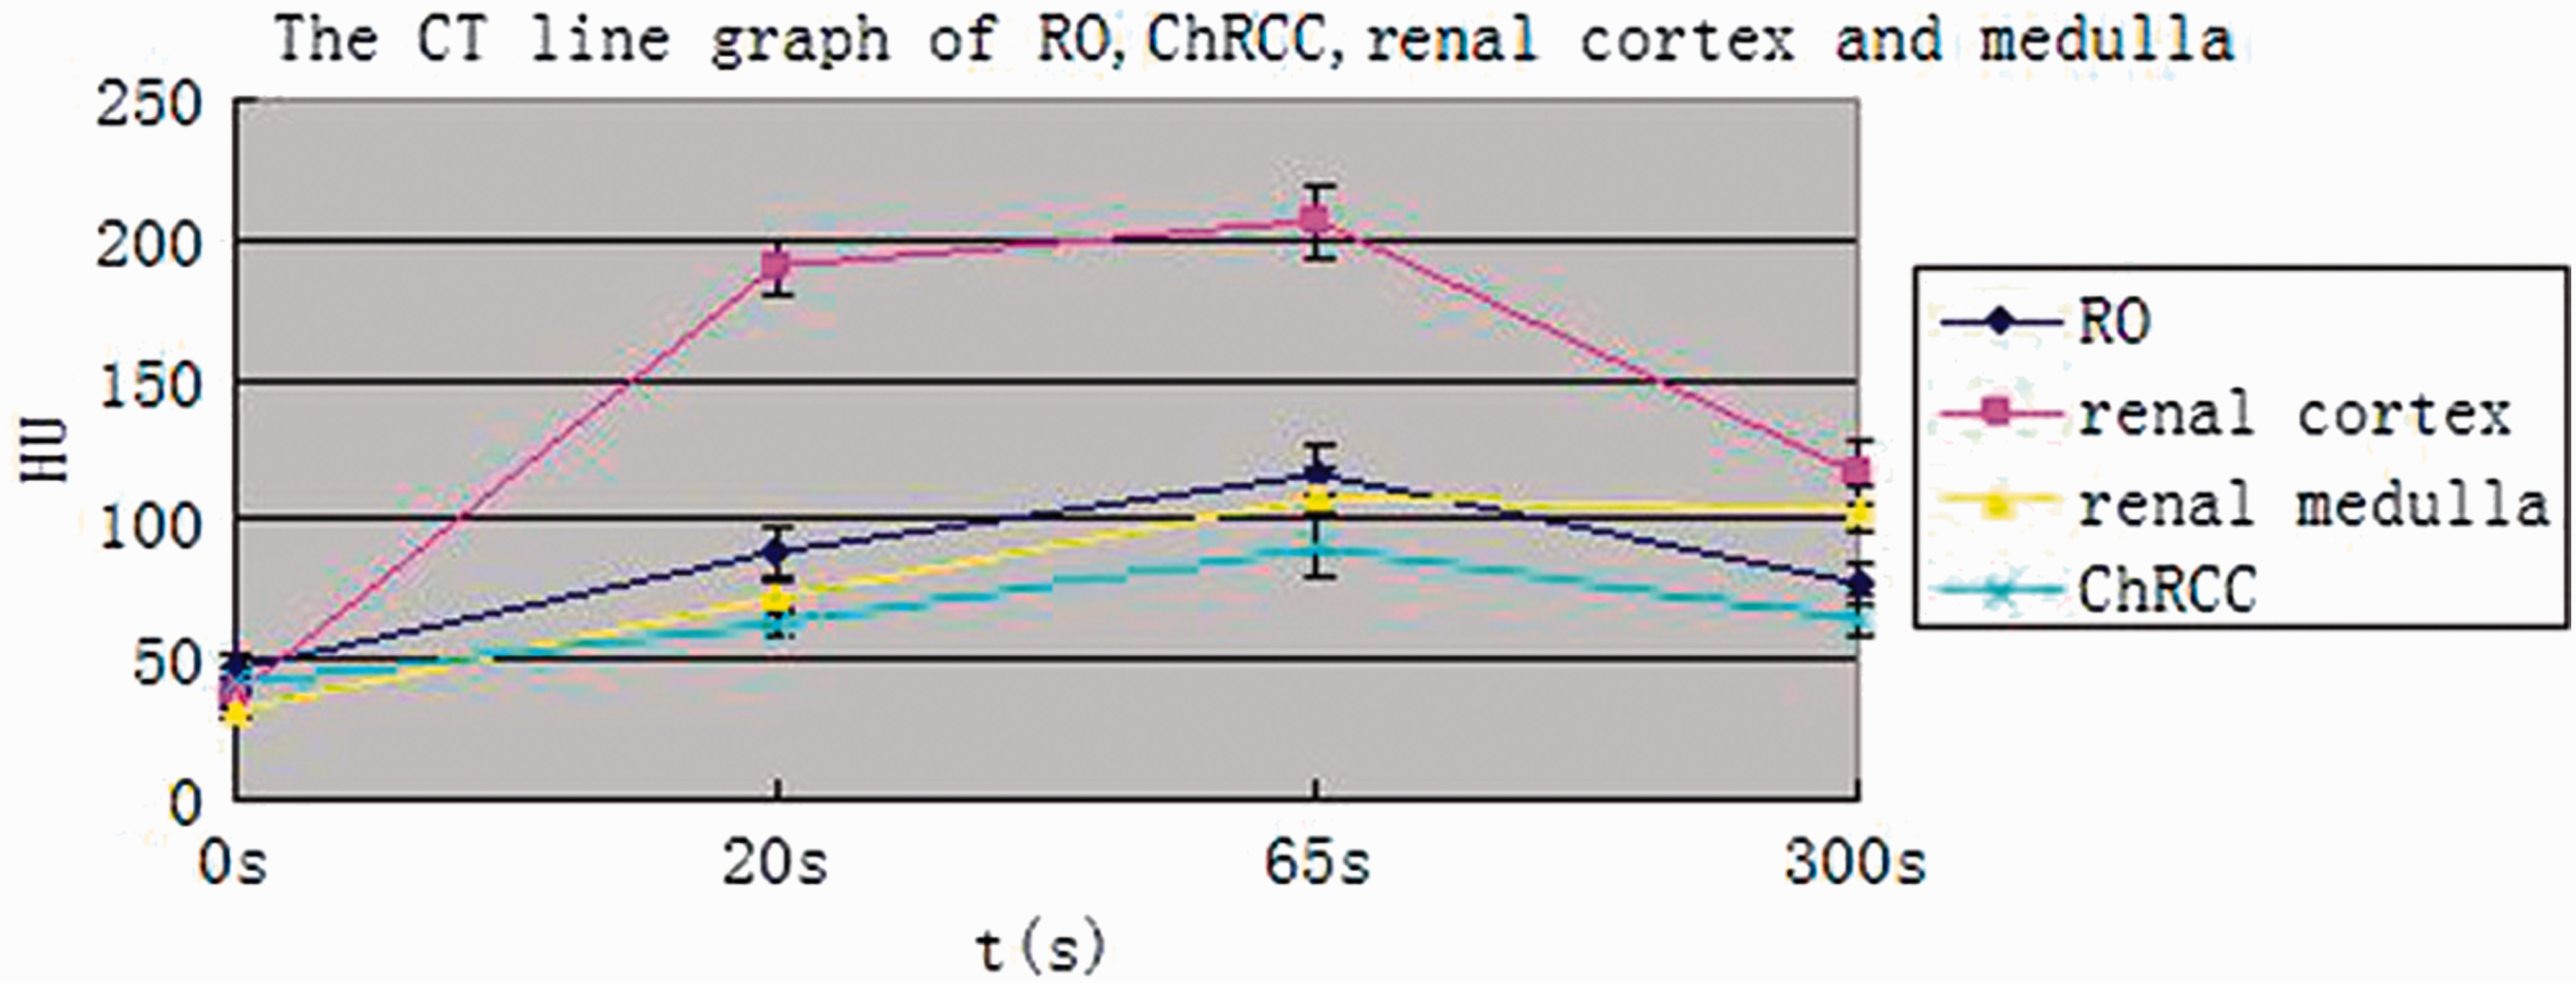
The CT line graph of RO, ChRCC, normal renal cortex, and medulla on unenhanced and enhanced phase.
Follow-up
Fifty-three patients with RO were followed up. Two patients died within 5 years due to complications unrelated to the tumors while the others were still alive.
Fifty-three patients with ChRCC were followed up. Fourteen patients died within 5 years after the initial diagnosis and with the others still alive.
Discussion
Renal oncocytoma (RO) and chromophobe renal renal cell carcinoma (ChRCC) are both uncommon subtypes of renal tumors. RO of the kidney is an uncommon benign epithelial tumor that can present at any age (8). RO constitutes less than 5% of all renal lesions and is postulated to arise from the type B intercalated cells of the cortical collecting duct. ChRCC constitutes less than 4.5% of all renal carcinomas and is postulated to arise from the intercalated cells of the renal cortex (9).
It is interesting that RO and ChRCC share ontogenetic and histologic features and some imaging findings (10). Because renal oncocytoma and ChRCC share a common histologic background, originating from the intercalated cells of the collecting duct, these two entities inevitably are similar regarding morphologic, histologic, immunohistochemical, and ultrastructural background (10). As a result, despite the low proportion of ChRCC among the subtypes of RCC, ChRCC has been known to cause confusion with RO in the preoperative diagnosis (11).
Our results show that RO are a heterogeneous hyperdense solid tumor together with calcifications or stellate scars on unenhanced CT. However, ChRCC is commonly an isodense or mild hyperdense mass together with cystic components. Other authors have reported that the pathologic basis of hyperdensity of a tumor on unenhanced CT is the presence of minimal intratumoral hemorrhage (hemosiderin deposition) or fibrous septa formation (12,13). Gakis (8) reported that calcifications in the tumors often suggest a benign tumor. In our study, there was evidence of calcifications in 24 of the RO tumors whereas 11 patients with ChRCC had evidence of calcifications (P = 0.011).
The differential diagnosis of a hyperdense renal solid mass can include clear cell renal cell carcinomas (14) and angiomyolipomas with minimal fat. Clear cell renal cell carcinomas larger than 3 cm usually show evidence of intratumoral necrosis, hemorrhage, cystic components, and calcifications. Papillary renal cell carcinoma is commonly homogeneous when poorly differentiated, but has often necrotic and cystic changes, hence appearing to be heterogeneous. Well-differentiated papillary renal cell carcinoma is usually regular in shape and has homogeneous density, dissimilar to RO.
In our study, the degree of enhancement of RO and ChRCC was lower than that of the normal renal cortex during all phases. Enhancement was higher with RO than with ChRCC tumors in all phases. RO enhanced less than cortical structures but more than medullary structures in all phases except for the delayed phase, where it enhanced less than medullary structures. ChRCC tumor enhancement was lower than that of the normal renal medulla in all phases. This enhancement pattern is atypical of hypervascular tumors such as clear cell renal cell carcinoma, renal medullary carcinoma (15), renal angiomyolipoma, and renal angioma (16). These findings suggest that it may be relatively easy to distinguish between ChRCC and tumors with hypervascularity on the basis of differences in enhancement.
In common with RO and ChRCC, papillary renal cell carcinoma, collecting duct carcinoma and renal lymphoma (17) are hypovascular compared to renal parenchyma on enhanced CT imaging. The majority of papillary renal cell carcinomas show slight enhancement during all enhancement phases. However, a previous study reported that the imaging findings with papillary renal cell carcinoma were similar to ChRCC (17).
Our results showed that the CT imaging features of RO and ChRCC are somewhat different, such as spoke-wheel like enhancement, segmental enhancement inversion, and stellate scar within masses during enhanced phases. Histopathological examinations confirm that spoke-wheel like enhancement are attributable to thick vessels running along the fibrous bands strongly stained by contrast material (18). Originally, the spoke-wheel arterial pattern on angiograms has been recognized as a characteristic finding of RO. However, it is unclear whether similar features can be demonstrated on enhanced CT scans. Additionally, no previous studies have described a spoke-wheel-like enhancement during dynamic CT scans in clear cell renal cell carcinomas (18). In our study there was evidence of spoken-wheel-like enhancement in 41 (73.2%) of the RO tumors whereas 11 (20.4%) of the patients with ChRCC had evidence of spoken-wheel-like enhancement, which significantly differentiate between ROs and ChRCCs (P < 0.001).
Woo (19) has reported that segmental enhancement inversion may be helpful in identifying RO. We defined segmental enhancement inversion as the contrast-enhanced biphasic renal CT finding of two distinct regions of enhancement of a renal mass in the corticomedullary phase in which the degree of enhancement reverses in the excretory (delayed) phase. The more enhanced segment correlated with compactly arranged tumor cells with scarcely intervening stroma, and the less enhanced segments correlated with abundant hyalinized stroma. In our study, 39 (69.6%) patients with RO and nine (16.7%) patients with ChRCC showed segmental inversion during the cortico-medullary and excretory phases, which significantly differentiate ROs from ChRCCs (P < 0.001). We infer that differences in stroma content are probably responsible for the observed segmental enhancement differences.
A central, sharply defined stellate scar is one of the characteristic CT findings of RO and present in 25–33% of large RO cases. However, Davidson (20) reported that the central scar found on CT scan is not specific of RO and can also be found in some renal cell carcinomas, but it is unclear whether ChRCC were included in this analysis. In our study, 26 (46.4%) patients with RO and 14 (25.9%) patients with ChRCC exhibited stellate scars (P = 0.025).
Retroperitoneal lymph node enlargement was found in only two patients with RO compared to 13 patients with ChRCC. Clear cell renal cell carcinoma is commonly associated with lymph node metastasis and renal vein infiltration (21,22). Hence, the differential biological behavior of the tumors may also provide useful diagnostic information.
Information regarding the clinical behavior of these two tumors is limited due to its rare incidence. Although the clinical course of these patients is rather indolent, routine follow-up is still mandatory. The correct distinction of these two tumors can lead to better understanding of their clinicopathologic differences, which should aid in developing individualized treatment plans.
Our study has several limitations. First, pathologic specimens were sectioned in a variety of planes, but only axial, sagittal, and coronal planes were available on CT images. Therefore, it was difficult to meticulously correlate the imaging findings with the histopathologic figures. Second, few patients were included in the study and finally, the retrospective nature of this study might have introduced some form of patient selection bias.
In conclusion, CT imaging features such as stellate scar, spoken-wheel-like enhancement, and segmental enhancement inversion were more common in RO than in ChRCCs and may help in differentiating RO from ChRCC.
Footnotes
Conflict of interest
None declared.
Funding
This research received no specific grant from any funding agency in the public, commercial, or not-for-profit sectors.