
Abstract
Background
Magnetic resonance (MR) volumetry is insensitive to subtle mesial temporal sclerosis (MTS), while T2 relaxometry is potential useful in detecting MTS, especially MTS in early course.
Purpose
To explore and compare the feasibility of T2 relaxometry and MR volumetry in evaluation of mesial temporal lobe epilepsy (MTLE) and lateralization of the epileptogenic zone, so as to optimize and enhance lesion depiction.
Material and Methods
For the 17 unilateral MTLE patients and 14 normal participants, the hippocampus and amygdala were contoured on axial T2-weighted (T2W) images and then co-registered onto T2 relaxation maps. Abnormal is defined as an elevated asymmetric ratio of larger than 2 SD. Visual and quantitative volumetric assessment were combined as outcomes of MR volumetry to distinguish MR-positive and MR-negative lesions. Operative and pathological findings were used as gold standard.
Results
T2 values of lesions were significantly elevated. In lateralizing the epileptogenic zones, T2 relaxometry yielded an overall accuracy of 94.1% (sensitivity 92.6%, specificity 100%), and MR volumetry yielded an overall accuracy of 82.4% (sensitivity 88.9%, specificity 57.1%), meaning a better performance of T2 relaxometry (P < 0.001, by chi-square test). For pathologically sclerotic structures, most (25/27) were recognized by T2 relaxometry, while 24 of 27 sclerotic structures were detected via MR volumetry. MR volumetry wrongly discerned three normal regions as MTS, while one MR-negative sclerotic hippocampus was detected by T2 relaxometry.
Conclusion
T2 relaxometry is feasible in non-invasive lateralization of epileptogenic zone, and more advantaged than MR volumetry in detecting MR-negative lesions, facilitating prompt diagnosis and longitudinal disease monitoring.
Introduction
Mesial temporal lobe epilepsy (MTLE), which involves the hippocampus, amygdala, and parahippocampal gyrus, is the commonest form of refractory epilepsy. As a primary cause of MTLE, mesial temporal sclerosis (MTS) is histologically characterized by neuronal cell loss and astrogliosis (1), as illustrated by mesial temporal atrophy (2,3) and associated increased T2-weighted (T2W) signals (4), and temporal lobe hypometabolism on interictal position emission tomography (5). Surgery is a potential treatment option for medically refractory MTLE patients. Nevertheless, precise presurgical localization of seizure onset zone is still problematic to some extent.
By now, diagnosis of MTLE is mainly based on seizure semiology, abnormality of electroencephalographic (EEG) physiology, and typical structural imaging findings. In other words, magnetic resonance (MR)-positive is a main reference in detecting lesions. With the development of imaging techniques, the reliability of visual assessment and MR volumetry have increased. Quantitative analysis of high-resolution images allows volumetric measurement, being able to lateralize 83–100% MTLE lesions independently by either manual volumetry or automated volumetry (6–8). Visual inspections and MR volumetry are usually sufficient for atrophy detection, however, subtle MTS as in early disease course is easily missed (9).
As a non-invasive imaging method, quantitative analyzing of T2 relaxation time or so-called T2 relaxometry can be used in tissue differentiation. As an established MR method, T2 relaxometry has been used in evaluation of the human body, notably in the detection of certain brain disease entities such as Alzheimer’s disease (AD), Parkinson’s disease (PD), and cerebral ischemia, with an appealing sensitivity by depicting increased T2W signal intensity (10,11). T2 is already proved sensitive to hydrations between macromolecular concentration and water molecules. For example, in evaluation of AD, high T2 value reflects slow water motion from high protein content of Alzheimer’s plaques. In histopathological evaluation of resected epileptogenic tissues with prolonged T2 relaxation times, astrogliosis and hippocampal neuron loss were the main findings (12). T2 value is associated with hydrations between some macromolecular and water molecules. With such, T2 imaging thus carries high potential in early disease detection as well as allowing quantitative analysis of associated biochemical composition. Hence, the feasibility of T2 relaxometry in localizing MTLE, especially the MR-negative lesions, will be evaluated, so as to optimize and enhance lesion depiction.
Material and Methods
Participant selection
Approval from our local institutional review board was obtained. Written informed consent was also obtained from all participants. Inclusion of patients in the patient group was based on the following criteria: (i) Patients diagnosed with unilateral MTLE by EEG and seizure semiology, and surgery-confirmed unilateral MTS; (ii) No other epileptogenic lesion or coexisting lesion in the brain; (iii) No previous history of epilepsy or brain surgery. Inclusion of participants in the normal group was based on the following criteria: (i) No known history of epilepsy or any brain disease or brain surgery; (ii) No identifiable structural brain lesions on MR imaging (MRI).
Due to the fact that age-related atrophy constitutes a major confounding factor, as well as that duration of epilepsy is positively correlated with severity of hippocampal atrophy, only adult patients aged less than 50 years and with more than 5 years’ duration of epilepsy were recruited in order to adjust for confounding factors. Based on the inclusion criteria, a total of 17 patients diagnosed with medically refractory unilateral MTLE (for at least 5 years of epilepsy duration) and proved by pathological findings were recruited during the last 3 years. Seventeen patients (7 men, 10 women; mean age ± SD, 33.6 ± 8.1 years; age range, 21–50 years) and 14 normal participants (8 men, 6 women; mean age ± SD, 32.2 ± 6.9 years; age range, 25–51 years) were included. There was no significant difference regarding the age between patients and normal participants (P = 0.916, using independent samples t-test). All of the 17 patients underwent temporal lobectomy via anterolateral approach. For the 34 substructures (hippocampus and amygdala) of mesial temporal lobe ipsilateral to epileptogenic zone in all patients, a total of 27 sclerotic substructures (16 hippocampi and 11 amygdala) and seven normal regions were detected.
Imaging protocol
All participants were scanned on a 3.0 Tesla MR scanner (Magnetom Verio 3.0 T, Siemens Healthcare, Erlangen, Germany) with an 8-channel head coil. The MRI protocol included both structural and functional imaging.
Conventional dedicated structural imaging for MTLE patients included: (i) 3D volumetric T1-weighted (T1W) magnetization-prepared rapid acquisition gradient echo (MPRAGE) (repetition time/echo time, 7.0/3.1 ms; flip angle, 8°; field of view [FOV], 250 × 250 mm; matrix, 256 × 256; section thickness, 1 mm; gap, 0 mm); (ii) Coronal oblique high resolution T2W (repetition time/echo time, 3747/80 ms; flip angle, 90°; FOV, 220 × 200 mm; matrix, 640 × 640; section thickness, 2 mm; gap, 1 mm); (iii) Coronal fluid-attenuated inversion recovery (FLAIR) T2W (repetition time/echo time, 11,000/120 ms; inversion time, 2800 ms; FOV, 230 × 201 mm; matrix, 512 × 512; section thickness, 2 mm; gap, 0.5 mm); (iv) Axial susceptibility weighted imaging T2*-weighted (T2*W) (repetition time/echo time, 28/23 ms; flip angle, 15°; FOV, 240 × 211 mm; matrix, 560 × 560; section thickness, 1 mm; gap, 0 mm].
T2 relaxometry image acquisition was performed in an axial plane perpendicular to the anterior/posterior commissure, from floor of temporal lobe to inferior frontal operculum, covering a total of 15 slices. The imaging parameters were: Multi-echo T2 relaxometry (repetition time/echo time, 1868/20 ms; FOV, 240 × 240 mm; matrix, 268 × 268; section thickness, 3 mm; gap, 0 mm). Total scanning time was 6 min 42 s for T2 relaxometry.
For T2 relaxometry, maps of relaxation times were automatically calculated using available software on the MR scanner based on the following expression: T2 = (TE2 − TE1)/[ln(S1/S2)], where S1 and S2 were signal intensity in early and late echo images, with echo time TE1 and TE2, respectively.
MRI analysis
Visual assessment and volumetry of the amygdala and hippocampus: hippocampal and amygdalar volumetric analysis was performed by FIRST (FMRIB’s Integrated Registration and Segmentation Tool) of FMRIB Software Library (FSL, Oxford, UK) following the standard procedures (13–15). To minimize the influence of individual differences, volumes were corrected for individual head size using total intracranial volume (TIV), which was the sum of volumes of gray matter, white matter, and cerebrospinal fluid (CSF). Measurement of volumes followed the analog procedure of voxel-based morphometry (16–18). Two figures were used to detect the atrophy: the absolute volume fraction (fraction of hippocampal or amygdalar volume in TIV) and corresponding right/left ratio.
As a necessary supplement, the amygdala and hippocampus were also visually assessed by two neuroradiologists (HC and JW, with 15 and 5 years of experiences in neuroimaging, respectively) independently for any asymmetry or atrophy, based on the oblique coronal T2W sequence and 3D T1W MPRAGE sequence. Results were recorded as either presence or absence for atrophy, and degree of atrophy was not graded or quantified.
For T2 relaxometry, region of interest (ROI) was separately drawn on the right- and left-sided mesial temporal structures for subsequent analysis. ROIs were manually drawn on T2W images to contour each region according to an established anatomical landmarks (19) by a neuroradiologist on each related slice so that the total volume of each region was involved. ROIs were double-checked by another neuroradiologist, and attention was particularly paid in avoiding inclusion of surrounding CSF. ROIs, including the amygdala and hippocampus, drawn on the T2W images were then co-registered to the corresponding T2 relaxation maps using ImageJ (NIH, Bethesda, MD, USA). Mean, standard deviation (SD), minimum, and maximum were measured by the ROI manager of ImageJ.
Statistical analysis
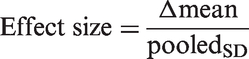
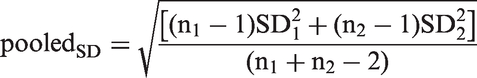
The correlations between relaxation times and age in healthy participants were measured. Group differences of T2 values for ROIs were assessed using multi-factor analysis of variance (ANOVA) followed by post hoc test (Bonferroni comparisons). The effect sizes of T2 relaxometry were calculated using the equations below:
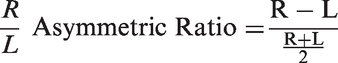
Right-left asymmetric ratio (R/L) was defined as:
As the basis of lateralization, variations of relaxation times and asymmetries were standardized according to the corresponding mean value and standard deviation of control group through z-score transformation:
Results
T2 relaxation values and corresponding lateralization and localization
As a potential confounding factor, age had no correlation with T2 relaxometry values of amygdala (AM, R2 = 0.027, P = 0.408), hippocampal head (HH, R2 = 0.077, P = 0.153), hippocampal body (HB, R2 = 0.013, P = 0.565), and hippocampal tail (HT, R2 = 0.009, P = 0.634). For the normal group, the hippocampal head carries the highest T2 values, followed by the amygdala, hippocampal body, and lastly hippocampal tail. Similar to previous reports (20,21), T2 relaxometry values are not homogeneous across hippocampus, but with a decreasing gradient in the anteroposterior axis. Among the four regions, there was no significant difference between the corresponding left- and right-sided individual region, hence right–left asymmetric ratios of normal participants were approximately zero.
T2 relaxation times of the two hemispheres and corresponding asymmetry in control participants.
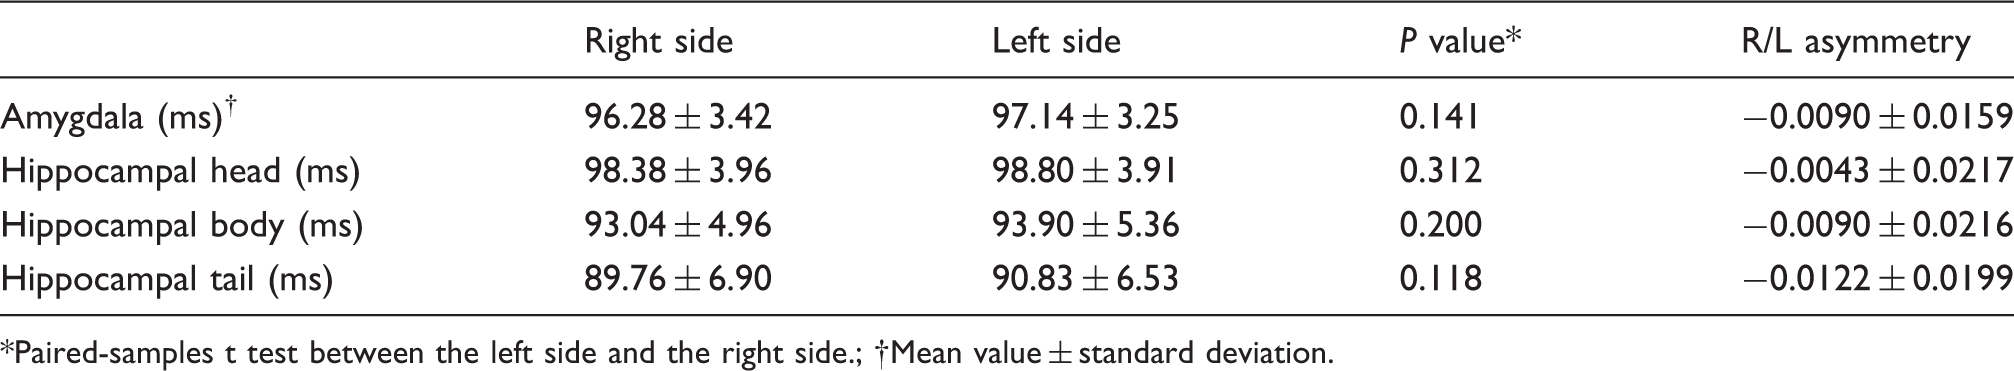
Paired-samples t test between the left side and the right side.
Mean value ± standard deviation.
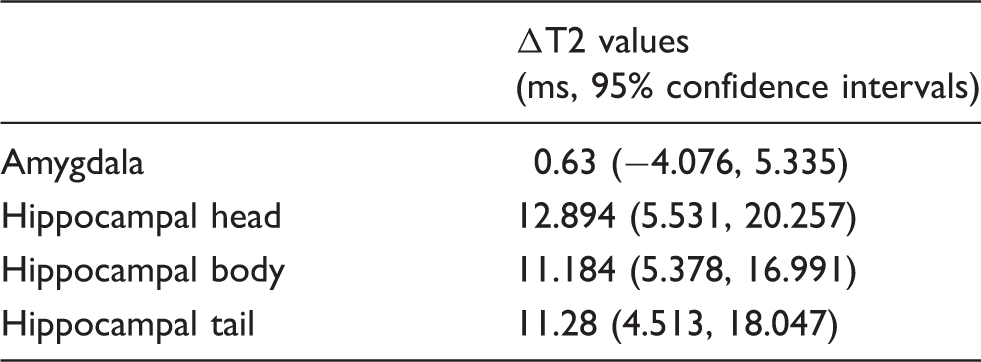
Group difference and the 95% confidence intervals between pathology-confirmed MTS and normal groups.
MR volumetry and corresponding lateralization and localization
Visual assessment and quantitative analysis of MR volumetry are complementary to each other in detection of atrophy, so a combined assessment of visual inspection and MR volumetry was commonly made to enhance the accuracy of lesion depictions (6,22,23). In normal group, no lateralization or volume asymmetry was observed between the right and left mesial temporal structures for all 14 participants.
In patients with unilateral MTLE, mean volume and volume fraction of hippocampus contralateral to the seizure focus were significantly greater than those of the ipsilateral side (3858 ± 635 vs. 2329 ± 820 mm3 for volume, P = 0.005; and 2.929 ± 0.759 vs. 1.92 ± 0.7‰ for volume fraction, P = 0.005, by paired samples t-test). There was no significant difference in amygdalar volume (563 ± 169 vs. 757 ± 236 mm3, P = 0.126) or volume fraction (0.512 ± 0.209 vs. 0.614 ± 0.183‰, P = 0.431) between ipsilateral and contralateral side.
Based on the quantitative volumetric analysis and visual assessment, all of the 16 pathologically sclerotic hippocampi revealed volume loss, while only 8/11 pathologically sclerotic amygdala showed volume loss ipsilateral to the epileptogenic zone, illustrated as significant elevated volumetric asymmetrical ratio. For MR volumetry, the hippocampal head was more severely affected than the hippocampal body and tail, while the amygdala was the least affected. For the mesial temporal lobe structures ipsilateral to the epileptogenic zone in all patients, a total of 24 atrophied regions were detected, while there were still three sclerotic amygdalae not detected via MR volumetry. Meanwhile, only 4/7 normal structures were correctly distinguished, which may be a result of complexity of mesial temporal lobe structures.
Comparison between T2 relaxometry and MR volumetry
Fig. 1 presents the details of z-score distribution of right-left asymmetric ratios. For pathologically sclerotic structures, most (25/27) of the z-scores of T2 relaxometry variations fall outside this limit, while 24/27 z-scores of MR volumetry variations fall outside this limit. A hippocampus with subtle sclerosis (MR-negative) was missed via MR volumetry, but detected by T2 relaxometry. On the other side, MR volumetry wrongly discerned three regions as MTS. Therefore, quantitative measurements of T2 relaxation time have rendered it a more powerful discriminating parameter and it is seemingly more suitable than volumetry in lateralization and localization showing a more stable performance. The effect sizes of T2 relaxometry, which reflected the capacity of discrimination, are listed in Table 3. In general, T2 relaxometry was more sensitive and more powerful than MR volumetry in discrimination and lateralization of the epileptogenic zone. The chi-square test showed that T2 relaxometry exhibited significant improvement (P = 0.036) in localization of unilateral MTLE when compared against MR volumetry.
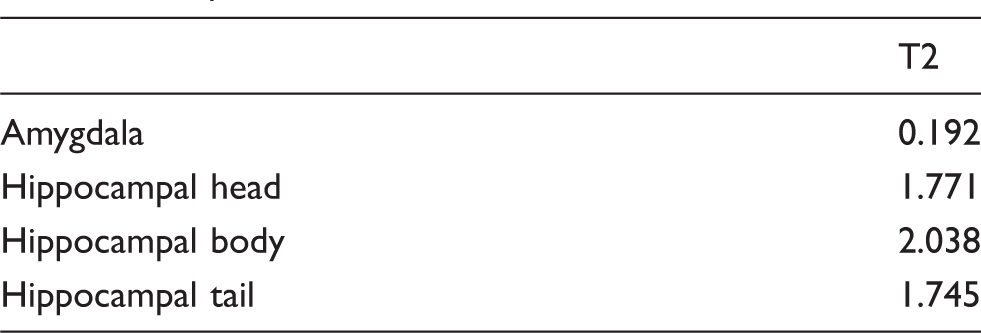
Distributions of right-left asymmetric ratios of T2 relaxometry. Data were regrouped as substructures with MTS and without MTS. Effect sizes of T2 values in discriminating abnormality of mesial temporal lobe.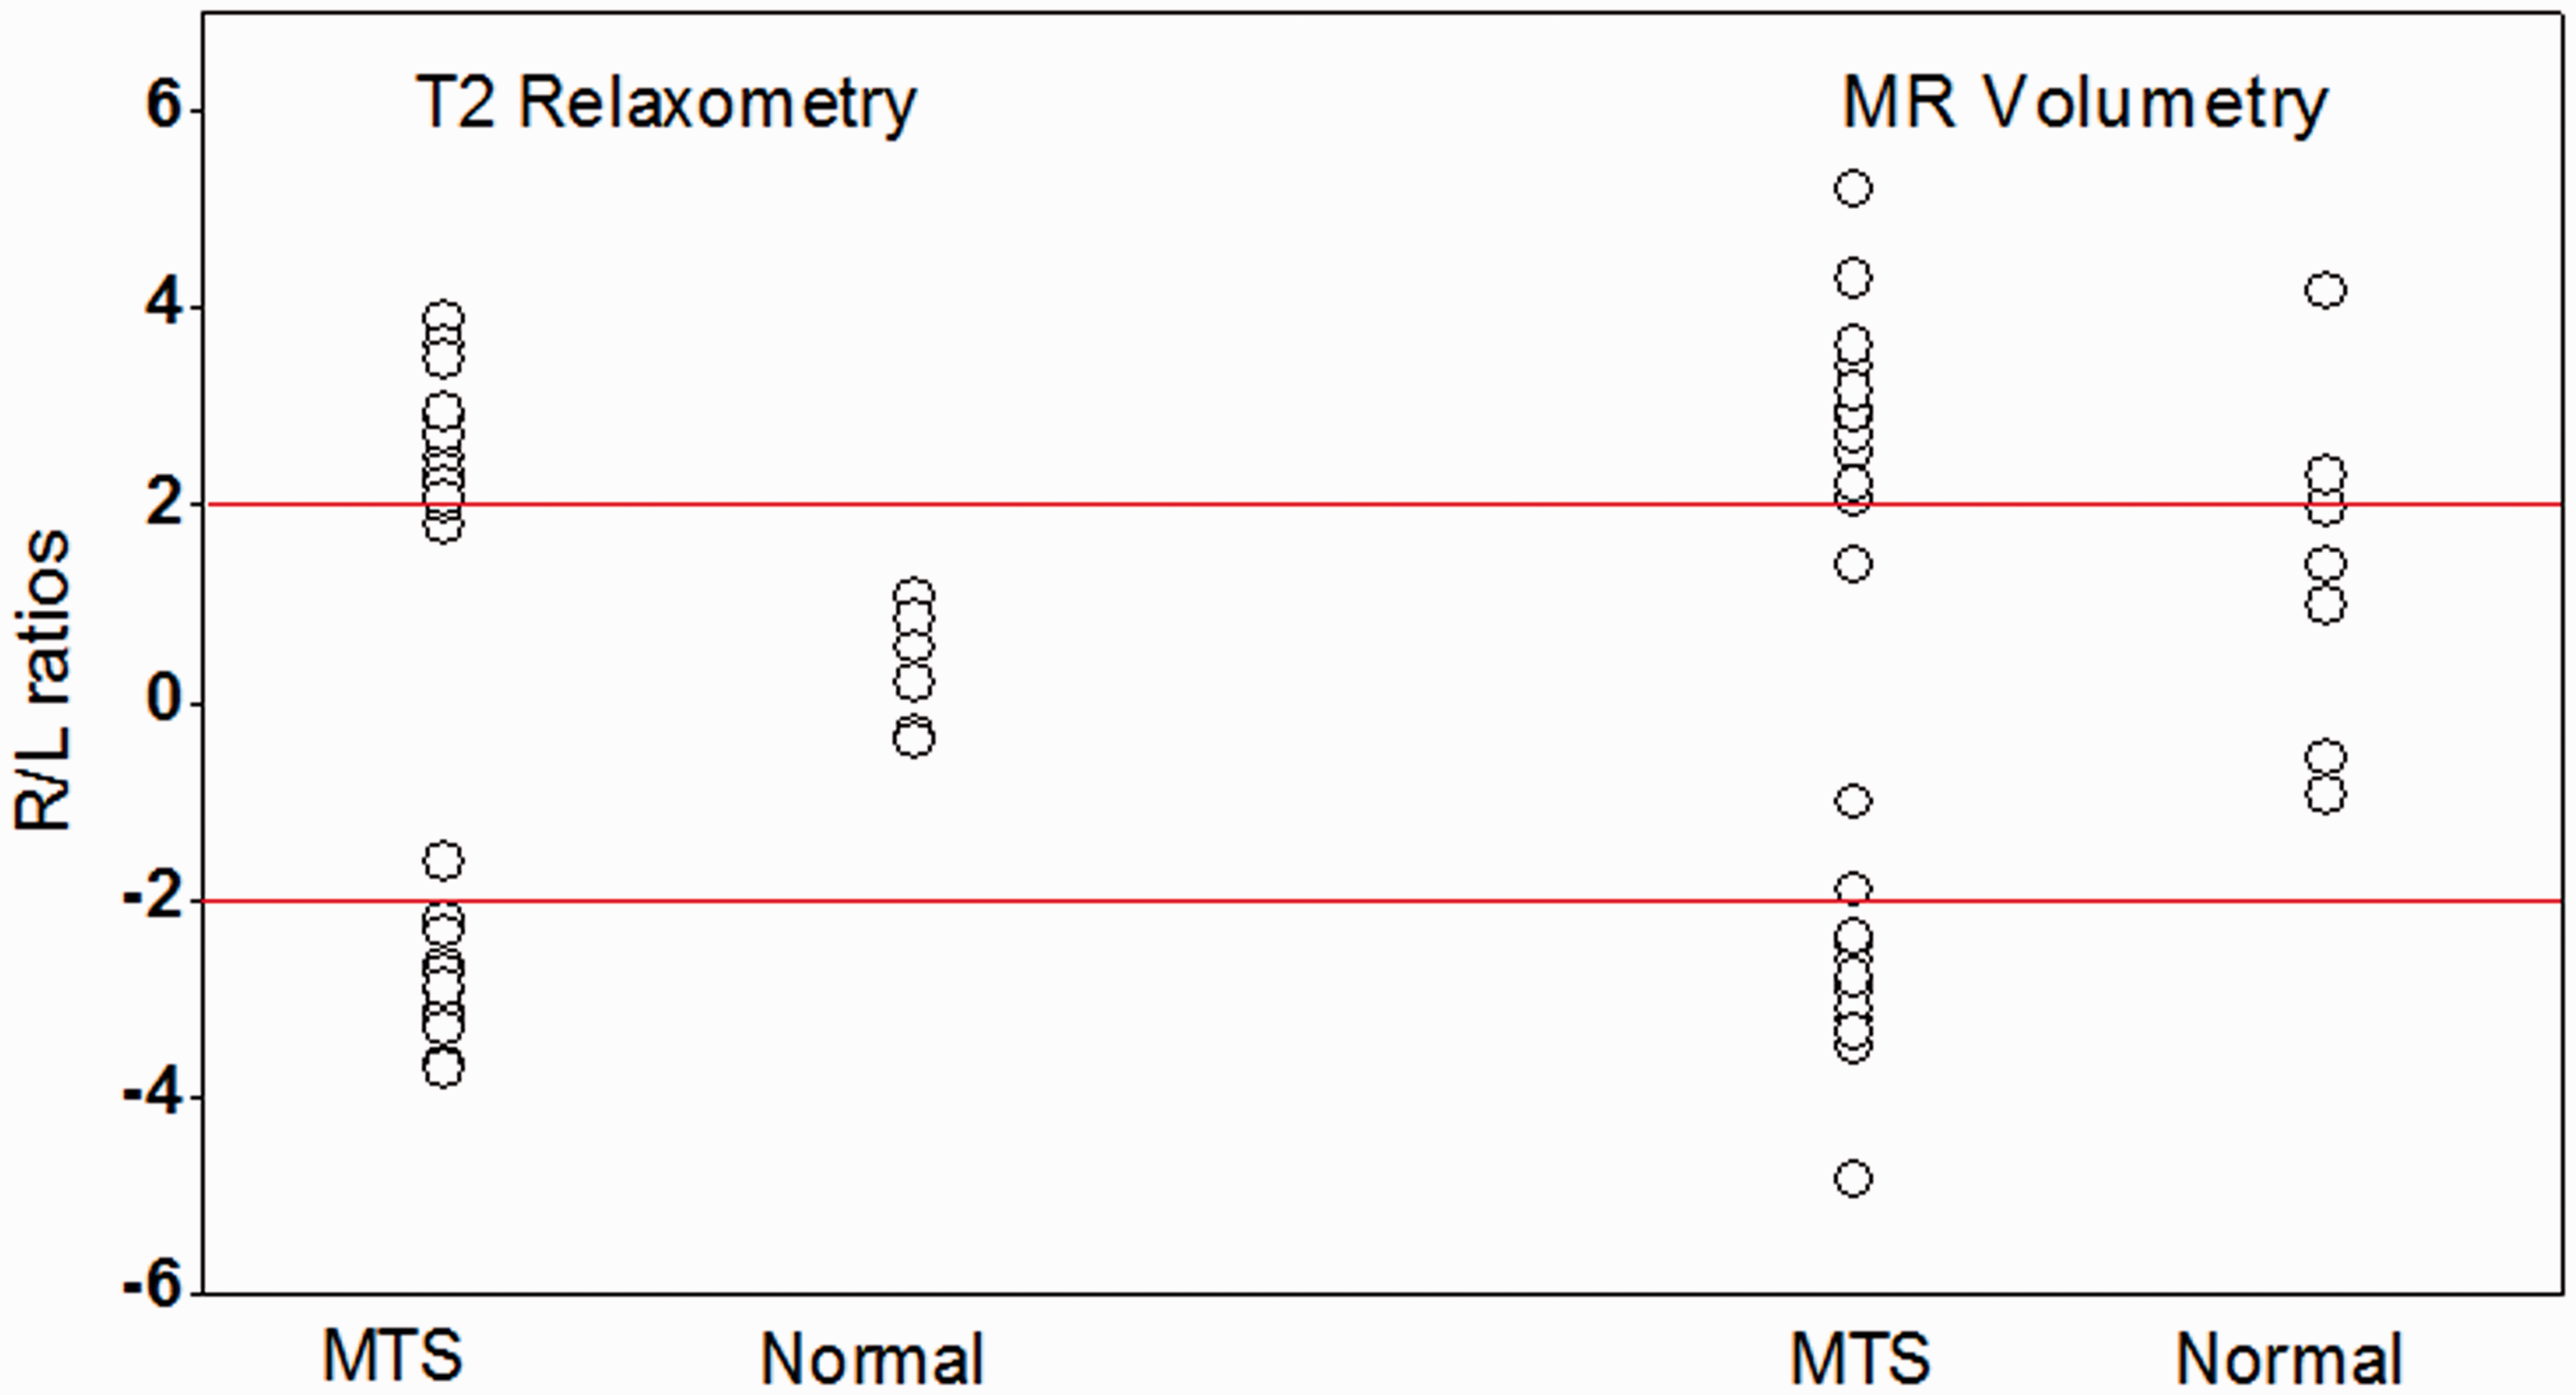
Color-coded parametric map allows direct visualization for easy reference. Fig. 2 shows the color-coded T2 relaxometry parametric map of a 33-year-old normal female participant and a 41-year-old female patient with left-sided MTLE, respectively. Pixels with higher T2 relaxation value (labeled in red) were demonstrated along left hippocampus of temporal lobe, which was confirmed by hematoxylin and eosin (H&E) staining.
Color-coded T2 relaxometry parametric maps of a normal participant (33-year-old woman, a) and a left-sided MTLE patient (41-year-old woman, b). Temporal lobe was contoured and pixels with elevated T2 values were shown in red. For the patient, loss, degeneration, and atrophy of hippocampal neurons can be observed from H&E staining of excision. The volumes of left amygdala, right amygdala, left hippocampus, and right hippocampus were 586, 792, 2178, and 4526 mm3, respectively.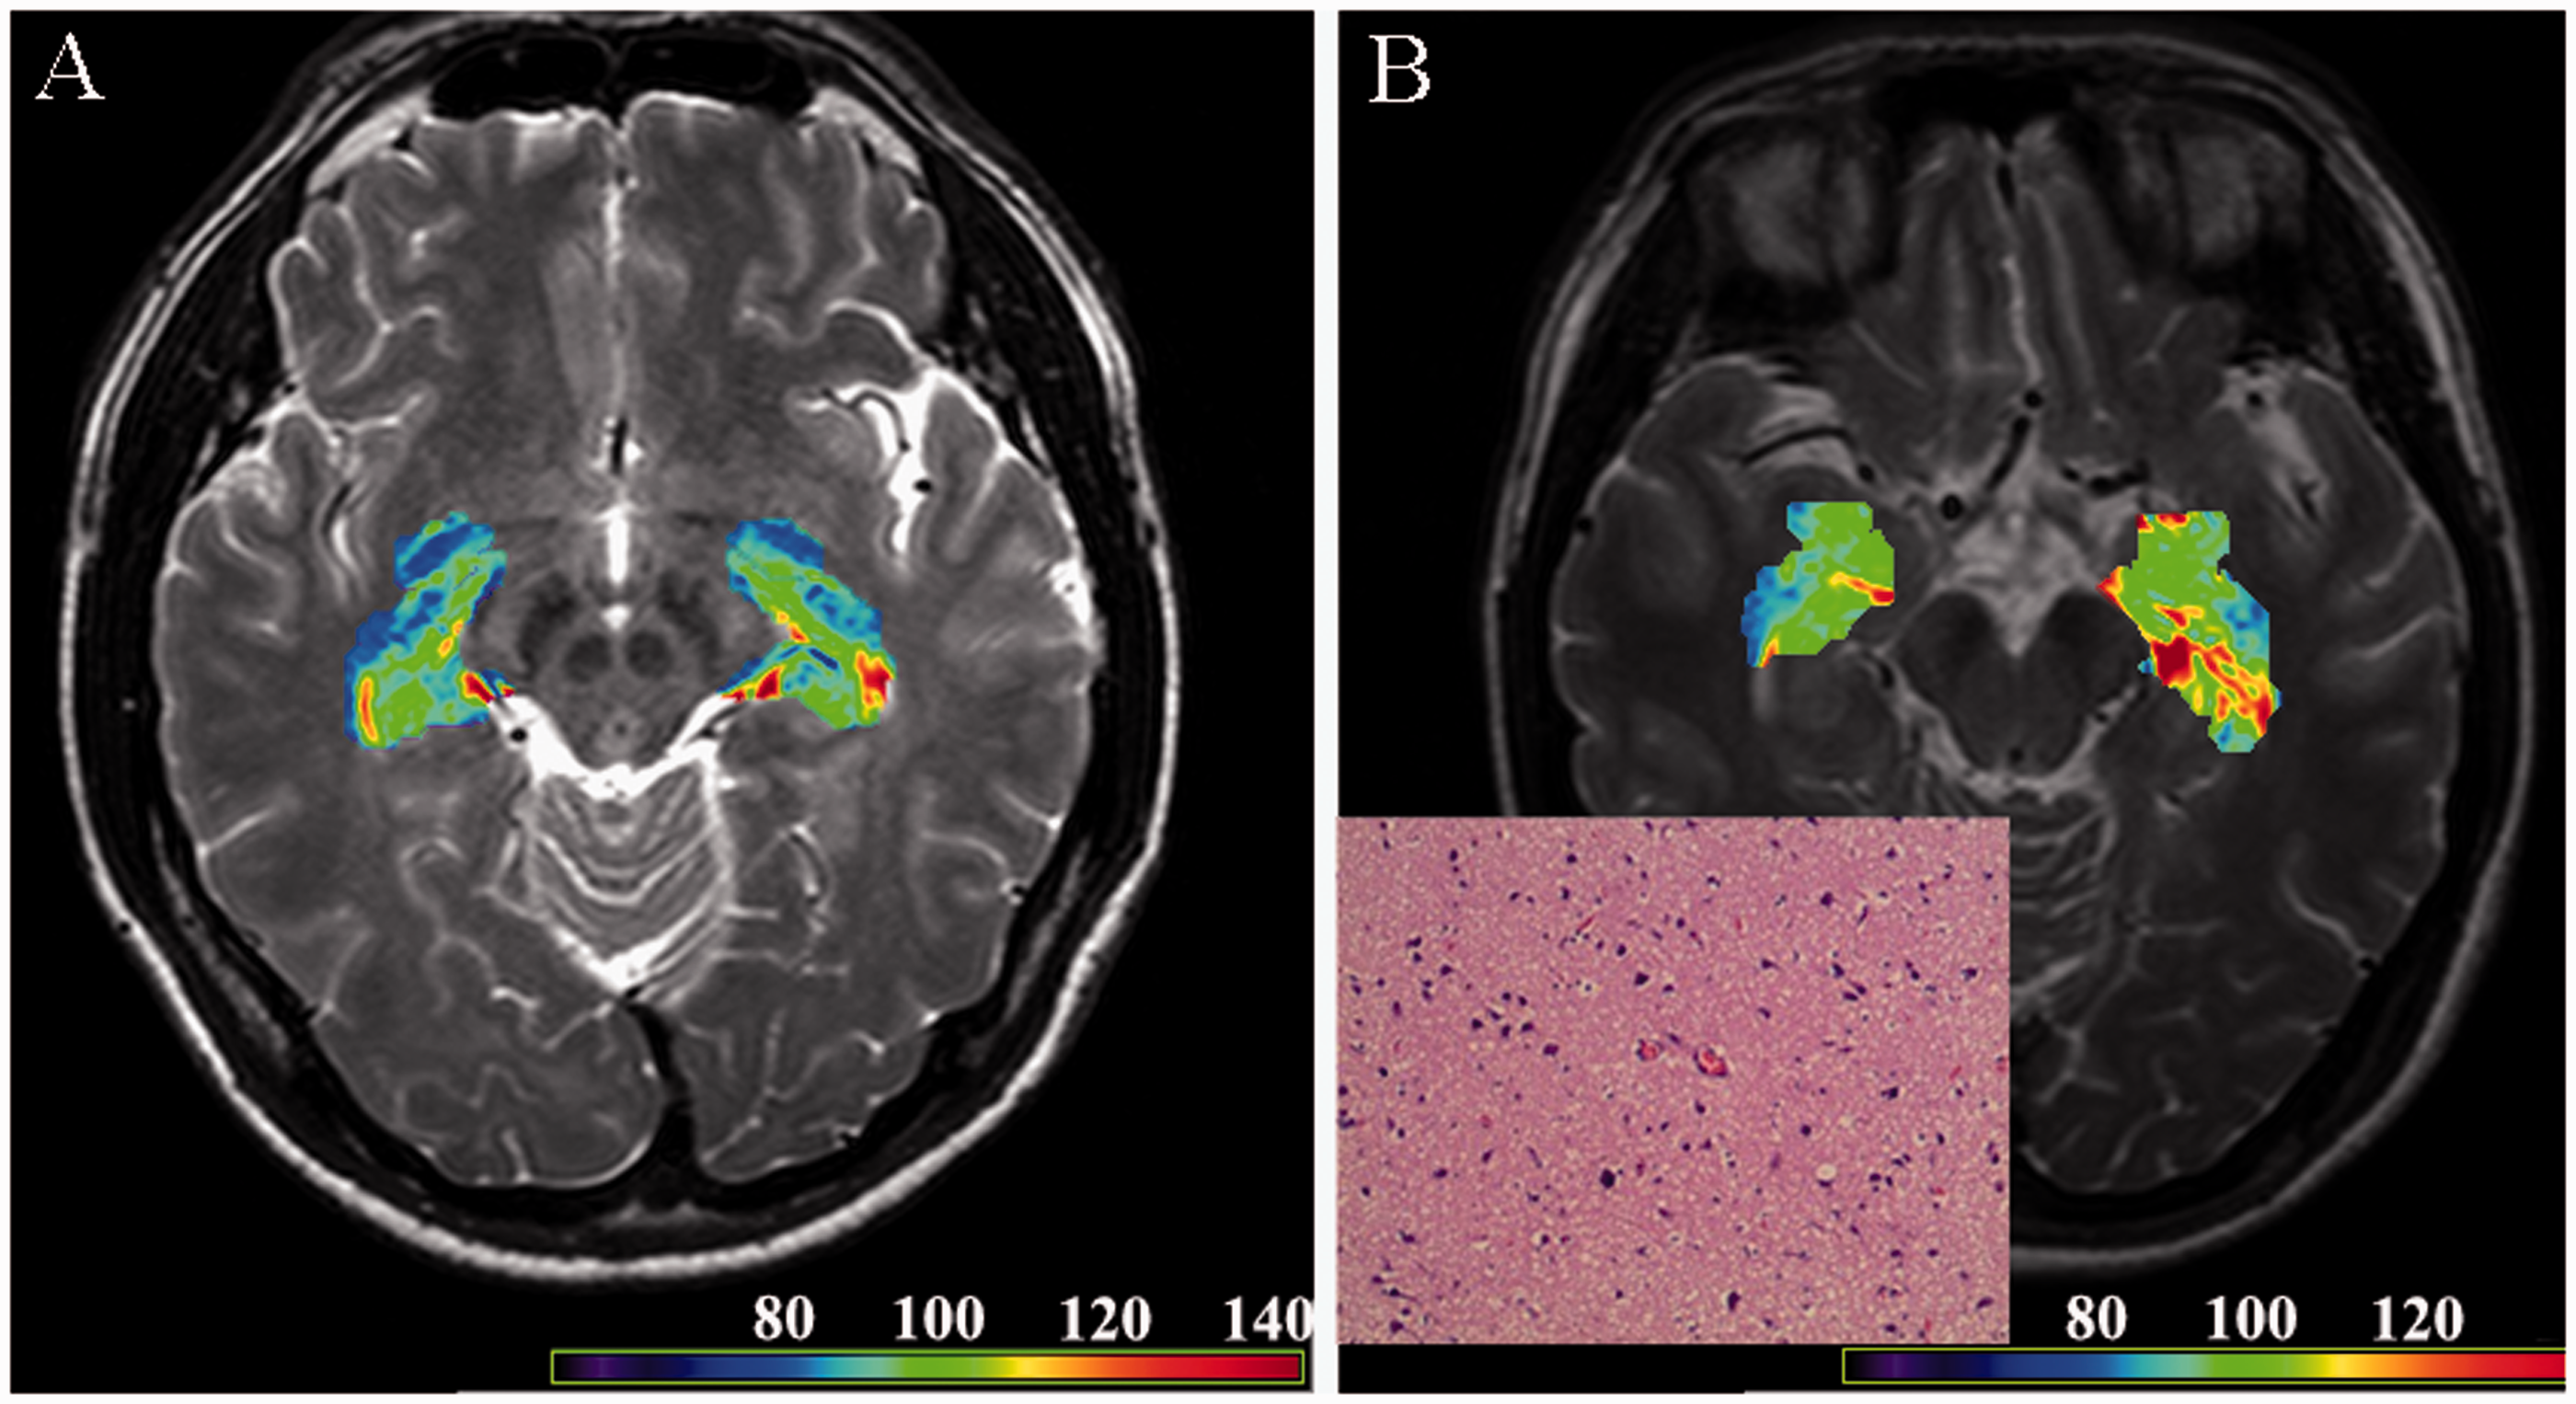
Discussion
The feasibility of T2 relaxometry and MR volumetry in evaluation of MTLE were evaluated and compared based on the operative and pathological findings. T2 relaxometry was proved more efficient in non-invasive lateralization of epileptogenic zone, and more advantaged than MR volumetry in detecting MR-negative lesions.
In a similar study for T2 relaxometry on patients with intractable MTLE, Bernasconi et al. showed that the epileptogenic zone in all (100%) patients with MR-positive MTLE and 82% of patients with MR-negative MTLE could be depicted by T2 relaxometry (12). Our study showed that T2 relaxometry had an overall accuracy of 94.1% in lateralization of the epileptogenic zone. The threshold to define abnormality varied as MR signals varied from one to another due to the settings of MR parameters and MR field intensity: 90 ms in a 1.5T scanner, and 118 ms in a 3T scanner (21). While in this study with a 3T scanner, it was 103 (mean + 2SD) ms for amygdala, 106 ms for HH, 103 ms for HB, and 102 ms for HT, implying that use of correction indexes or R/L ratios for comparison would be more appropriate, so as to decrease the influence from external technical conditions and decreasing gradient in the anteroposterior axis. In this study, T2 relaxation times of epileptogenic side increased significantly by about 10 ms in the hippocampus, as compared to the normal group. Those results were in concordance with the past literature (12,24), which showed similar results with prolongation of T2 relaxation times (8 to 20 ms compared with control participants, P < 0.01) in the diseased hippocampal head, body, and tail, but not the amygdala.
T2 is a biomarker of early epileptogenic degeneration to some extent. There is a correlation between hydrations and changes in the development of hippocampal epileptogenicity (25) that T2W signal increase in the hippocampus was mainly affected by gliosis in the dentate gyrus, where a high proportion of glial cells show abnormal activity. As shown in this study, the advantages of T2 relaxometry is shown especially when it is used in the evaluation of early MTS or those with no atrophic changes which often escape visual detection. In addition, the method of quantitative measurement provides a more sensitive and objective mean in determination of related diseases.
Besides structural MRI, PET and SPECT were often used for evaluation of TLE as well. Although there is a strong correlation between TLE and 18F-FDG for PET/CT, 99mTc-labeled HMPAO and ECD for SPECT (26–28), the needs for radiopharmaceutical will introduce some uncertainty, such as the individual difference on glucose uptake. Besides, the additional risk of radiation exposure to the patients is one concern.
Seizure is normally not driven by the whole related regions (29), so evaluation of the whole regional abnormalities can be easily confounded or averaged by normal components from the same region. For this reason, generation of the color-coded parametric map allows direct visualization for easy reference, avoiding such problem by detecting the abnormalities visually regardless of the anatomical boundary.
In this study, one of the major limitations was the small sample size, especially the relative small amount of MR-negative lesions, which partially contributed to the relatively greater coefficient of variation in relaxation times. Another limitation was the lack of intra-/inter-observer measurements.
In conclusion, we have proved that both T2 relaxometry and MR volumetry are able to lateralize the epileptogenic zone in patients with MTLE, especially that T2 relaxometry demonstrates a superior diagnostic overall accuracy (94.1%). It is notable that T2 relaxometry is of particular use in the evaluation of early MTS or those with no atrophic changes which often escape visual detection.
Footnotes
Declaration of conflicting interests
The author(s) declared no potential conflicts of interest with respect to the research, authorship, and/or publication of this article.
Funding
The author(s) received no financial support for the research, authorship, and/or publication of this article.