
Abstract
Background
Many publications have examined the relationship between apparent diffusion coefficient (ADC) values and tumor grade in endometrial cancer. Nevertheless, none were designed to evaluate according to the histopathological type of endometrioid and non-endometrioid tumors.
Purpose
To evaluate the role of diffusion-weighted imaging (DWI) in the differential diagnosis of endometrioid and non-endometrioid cancer of the uterus, by comparing them with contrast-enhanced magnetic resonance imaging (MRI) findings.
Material and Methods
Institutional review board approval and informed consent were obtained. The MRI findings of 63 patients with endometrial cancer were retrospectively evaluated and divided into four groups: Grades I, II, and III endometrioid tumors, and non-endometrioid tumors. ADC values, DWI quotients (b = 1000 s/mm2), and post-contrast signal intensities between lesions and the myometrium (b1000q-Cq values) were evaluated. The one-way-ANOVA, student’s t-test, Kruskal–Wallis test, and receiver operating characteristic (ROC) analysis were used for statistical evaluation.
Results
Mean ADC values were 0.86 ± 0.14 in Grade I, 0.80 ± 0.7 in Grade II, 0.71 ± 0.14 in Grade III for endometrioid tumors, and 0.70 ± 0.12 in non-endometrioid tumors. There was a significant difference in ADC values between Grade I and Grade III (P = 0.006), and non-endometrioid tumors (P = 0.003). The difference was also significant between Grades I + II and Grade III (P = 0.009), and non-endometrioid tumors (P = 0.004). Besides, there was a significant difference between endometrioid and non-endometrioid tumors (P = 0.022). However, when considering b1000q (F = 0.640, P = 0.593) and Cq (χ2 = 6.233; P = 0.101), no significant difference was detected among the groups.
Conclusion
The difference in ADC values between the endometrioid and non-endometrioid tumors was statistically significant. However, the difference in DWI and contrast-enhancement findings were not statistically significant. Furthermore, the mean ADC values had an inverse relationship with tumor grade in the endometrioid cancer group.
Keywords
Introduction
Diffusion-weighted imaging (DWI) demonstrates tissue characteristics based on the random diffusion motion of water molecules (1,2). Recent studies have shown that this technique is not only valuable for the detection of tumors, it may also be useful for the histological characterization of focal lesions (1,3,4). DWI with an apparent diffusion coefficient (ADC) demonstrates various features of microstructures, such as the restriction of water diffusion, tissue cellularity, and nuclear-to-cytoplasmic ratios (5). Tissue cellularity has been shown to be an important index of tumor grade according to previous publications (6,7). Theoretically, ADC values are expected to decrease when tumor grade increases due to the higher cellular density of higher grade tumors, which results in restricted water diffusion (1,7–9).
Recently, many publications have also been published about the relationship between ADC values and the tumor grade of endometrial cancer (1,10–12). On the other hand, some of these publications have shown that there is a relationship between ADC values and tumor grade, but some have not (1,3–5,10–12). In many of these publications, the endometrioid type of endometrial cancers was the only or the most frequent type of cancer included; as such, these studies compared the grades of the endometrioid tumors by ADC values (1,3–5,10–12). In clinical practice, the discrimination between endometrioid and non-endometrioid tumors is important, as low and intermediate endometrioid tumors are considered to be less aggressive and have a more favorable outcome than high-grade endometrioid tumors and non-endometrioid tumors (13). Furthermore, several studies have demonstrated that the outcome of high-grade endometrioid cancer is comparable to non-endometrioid cancer (14–18). There are only a few publications including a limited number of patients with non-endometrioid tumors in the radiology literature (19–21). Nevertheless, none of these studies was designed to evaluate the endometrial tumors according to the histopathological type of endometrioid and non-endometrioid tumors. To our knowledge, no such publication exists in the literature.
The main purpose of the current study was to assess the role of DWI in the differential diagnosis of endometrioid and non-endometrioid cancer of the uterus, and to compare their contrast-enhanced magnetic resonance imaging (MRI) findings.
Material and Methods
Patients and study protocol
Institutional review board approval was obtained for this retrospective study and informed consent was obtained from patients for participation in the research project. Sixty-three patients (mean age, 62.78 years ± 11.24 [SD]; age range: 39–60 years) with endometrial cancer diagnosis between 1 September 2010 and 15 December 2015 were included. The specimens for pathologic evaluation were obtained by endometrial biopsy or dilatation and curettage (D&C). MRI was performed within 1 week of the procedures that included biopsy from endometrial cavity or D&C. Final pathologic results were based on the surgical operation.
DWI images of 13 patients and post-contrast images of five patients did not allow optimal qualitative and/or quantitative evaluation because of the artifacts due to patient movement, bowel peristaltics, artifacts from femur prosthesis, inadequate visibility of the normal differentiation of endometrium and myometrium, or the endometrium being so thin that it did not allow measurements. These patients were also excluded from the study. Overall, the data from 50 patients’ DWI images and 42 patients’ post-contrast images were included in the study dataset, based on the final pathologic findings, in addition to clinical and laboratory findings.
These patients were retrospectively divided into four groups according to the final histopathologic results. Group I included 16 patients with Grade I endometrioid cancer (mean age, 57.50 years ± 11.04 [SD]; age range, 39–80 years); Group II included 11 patients with Grade II endometrioid cancer (mean age, 59.45 years ± 5.35 [SD]; age range, 53–68 years); Group III included 11 patients with Grade III endometrioid cancer (mean age, 65.45 years ± 10.80 [SD]; age range, 48–82 years); and Group IV included 12 patients with non-endometrioid cancer (mean age, 66.25 years ± 9.96 [SD]; age range, 49–79 years). The histopathology of the tumors was serous adenocarcinoma in five patients, mix type serous adenocarcinoma and endometrioid carcinoma in four patients, clear cell adenocarcinoma in two patients, and carcinosarcoma in one patient in this group.
MRI protocol
MRI sequence parameters.
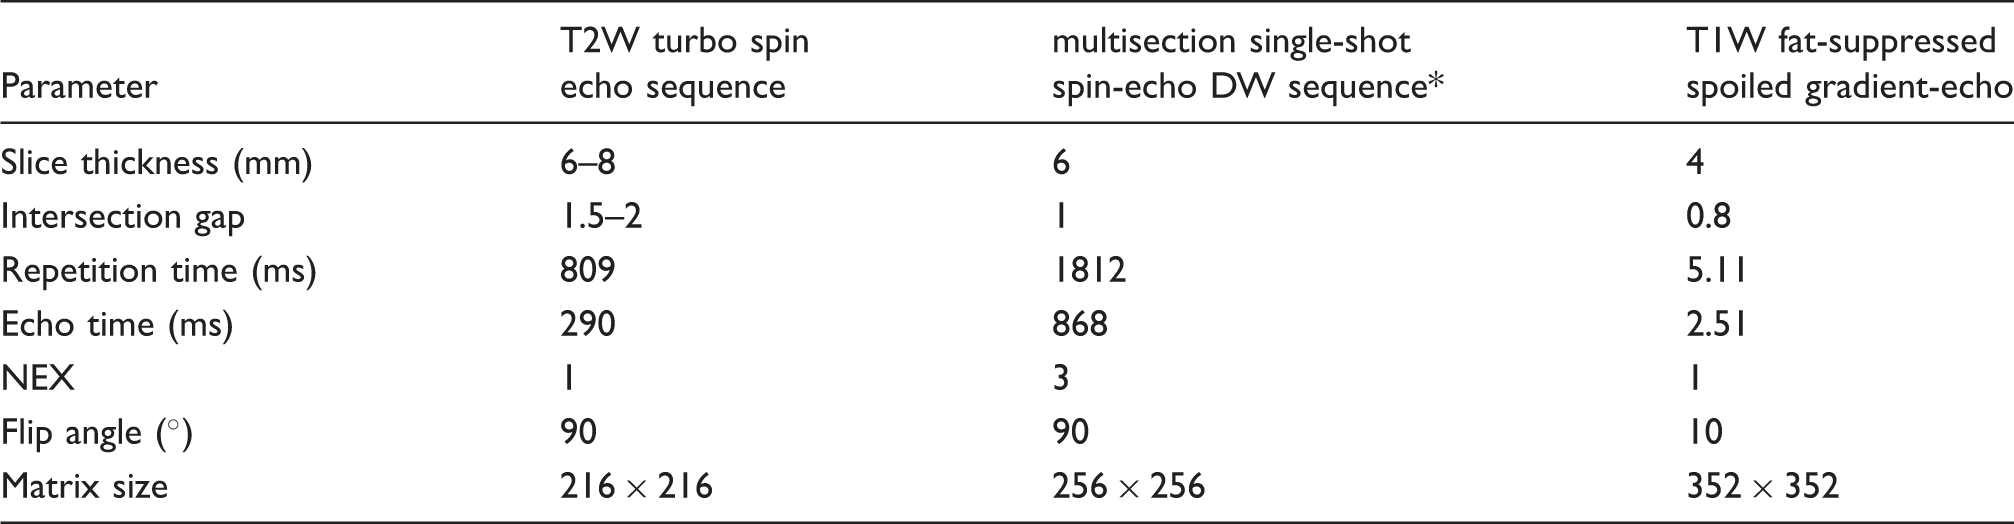
The b values were 0, 500, and 1000 s/mm2. The reduction factor and echo planar imaging factor of DW sequence were 2 and 53, respectively.
NEX, number of excitations.
Image analysis
Workstation (Extended Workspace Philips, Philips Medical Systems) images were evaluated by two observers (BB, an abdominal radiologist, and SS, a general radiologist, with 10 years and 5 years of MR experience, respectively) in consensus after the MR examination with the knowledge of the final pathology findings.
For the qualitative analysis, the signal intensity of the lesions on DWI (b = 1000 s/mm2) was visually evaluated. The lesion was isointense-hypointense if it had a signal intensity equal or lower to the myometrium, and hyperintense if it had a prominent higher signal intensity.
For the quantitative analysis, one of the authors (BB) placed regions of interest (ROIs) measuring at least 1 cm2 (size range, 1–4.8 cm2) on the lesions on DWI (b = 1000 s/mm2), ADC maps, and post-contrast images (delayed phases), avoiding obvious areas of inhomogeneity and artifacts. We also avoided the junctional zone of the uterus and the cystic-necrotic components of the lesions. The ROI was placed within the lesions in the area with the lowest ADC value on the ADC map and the highest intensity on DWI (b = 1000 s/mm2). In the post-contrast images, the ROI was placed on the areas with the most enhancement. At least three measurements were performed and averaged for each lesion. For the measurements taken from the myometrium, ROIs with at least 2 cm2 in size (size range, 2–2.5 cm2) were placed in the outer of the myometrium, avoiding the junctional zone. The ROIs were manually transposed from one sequence to another. All the ROIs were placed by the same radiologist (BB).
For a comparative analysis of the DWI (b = 1000 s/mm2) and contrast enhancement pattern, the average intensity within the lesions was divided by the intensity of the myometrium in the DWI and post-contrast images (b1000q = DWI signal-intensity lesion/DWI signal-intensity myometrium, Cq = post-contrast signal-intensity lesion/post-contrast signal-intensity myometrium).
Statistical analysis
Mean ± standard deviation, median, minimum, and maximum values were obtained for each group and subgroup.
Mean ADC values and DWI (b1000 s/mm2), and post-contrast quotients in all Groups. Data in the first line in the boxes are means ± standard deviations, and second line are the median (minimum–maximum).
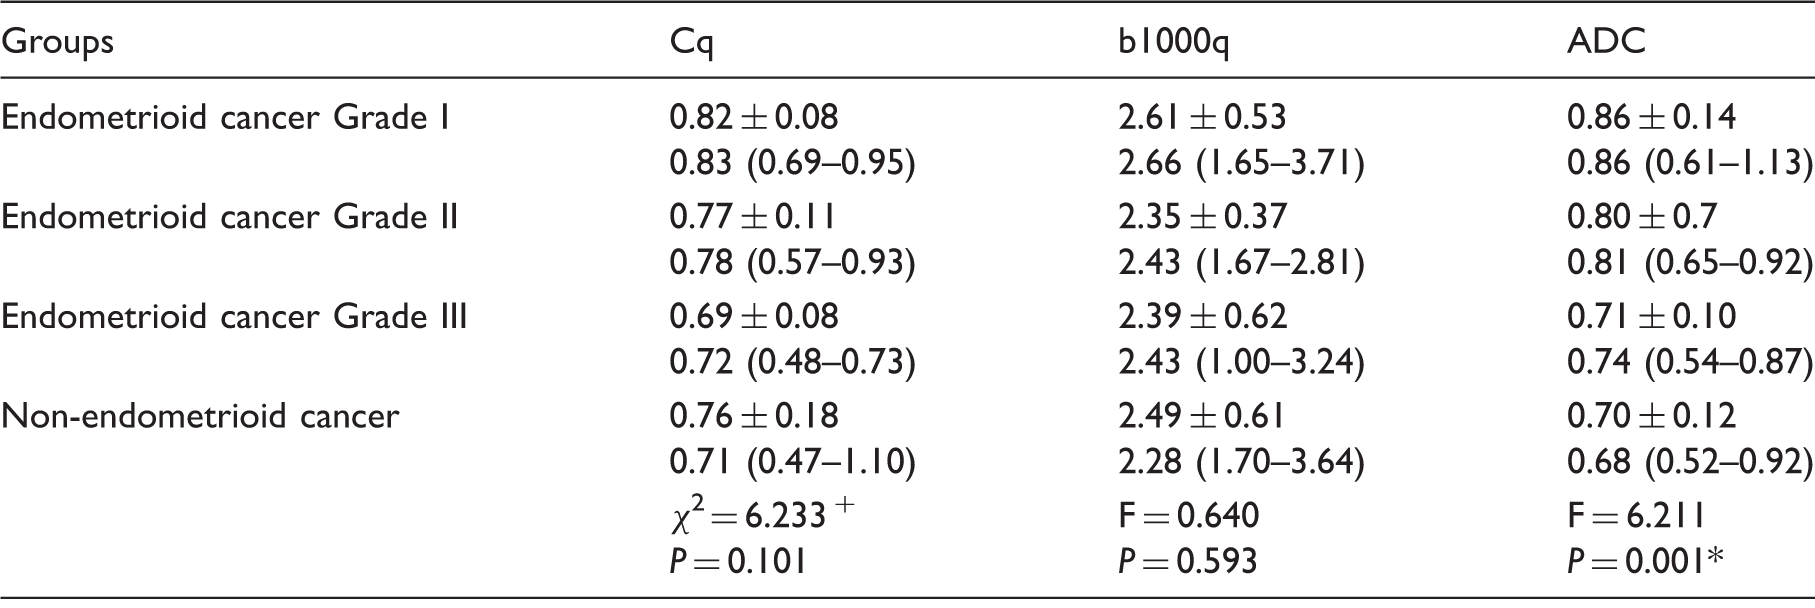
2, test statistics value for Kruskal–Wallis test; F, test statistics value for one-way ANOVA test.
Statistical significance.
Mean ADC values and DWI (b1000 s/mm2), and post-contrast quotients in all Groups. Data in the first line in the boxes are means ± standard deviations, and second line are the median (minimum–maximum).
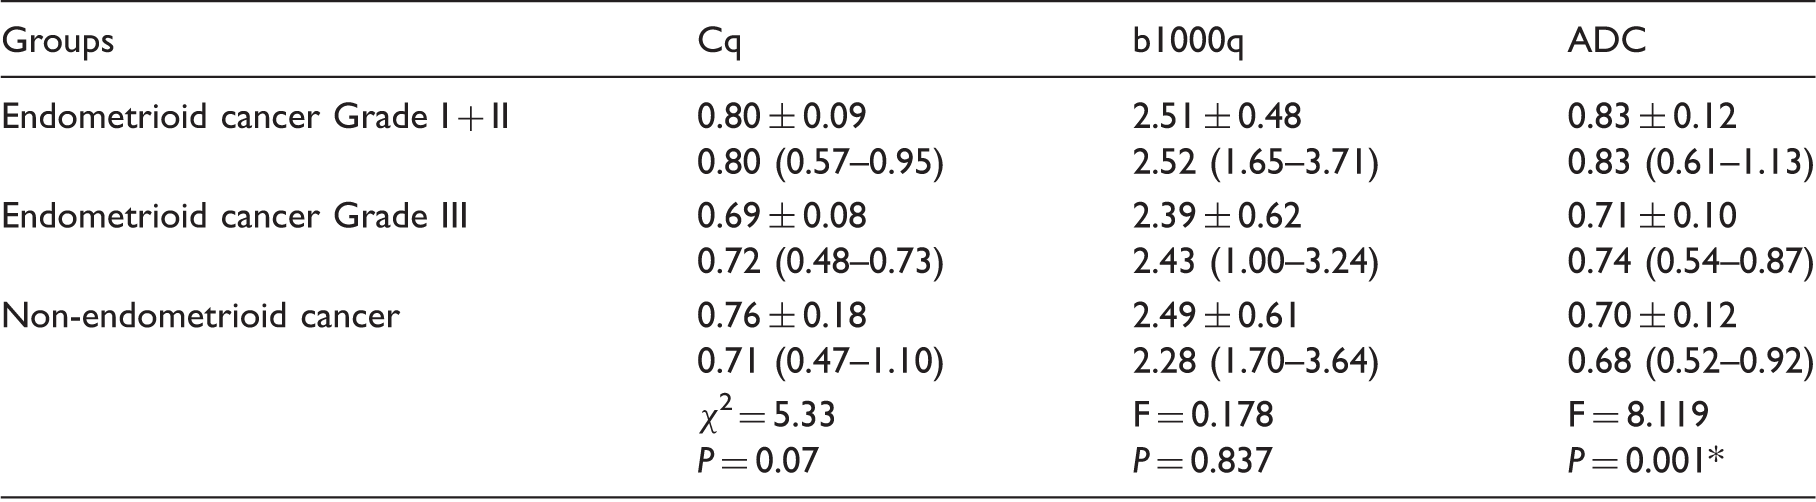
2, test statistics value for Kruskal–Wallis test; F, test statistics value for one-way ANOVA test.
Statistical significance.
Mean ADC values and DWI (b1000 s/mm2), and Post-contrast Quotients in all Groups. Data in the first line in the boxes are means ± standard deviations, and second line are the median (minimum-maximum).
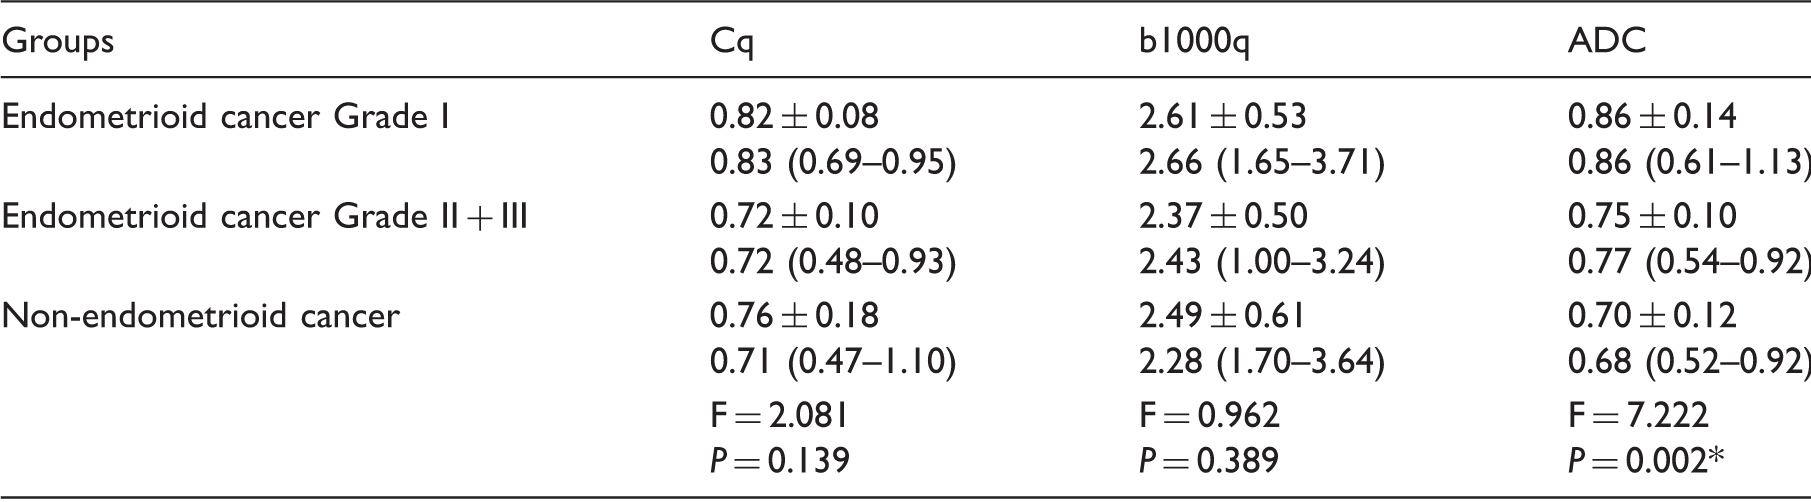
F, test statistics value for one-way ANOVA test.
Statistical significance.
Mean ADC values and DWI (b1000 s/mm2) and post-contrast quotients in all Groups. Data in the first line in the boxes are means ± standard deviations, and second line are the median (minimum–maximum).
t = test statistics value for Student’s t-test.
Statistical significance.
b1000q, ADC, and Cq values were analyzed using the receiver operating characteristics (ROC) curve analysis to compare the endometrioid cancer Grade I + II group with the endometrioid cancer Grade III + non-endometrioid cancer group. The cutoff values for ADC and Cq were determined with the ROC curve analysis.
IBM SPSS Version 21.0 (IBM Corp., Armonk, NY, USA) software was used. Significant differences were defined as P < 0.05.
Results
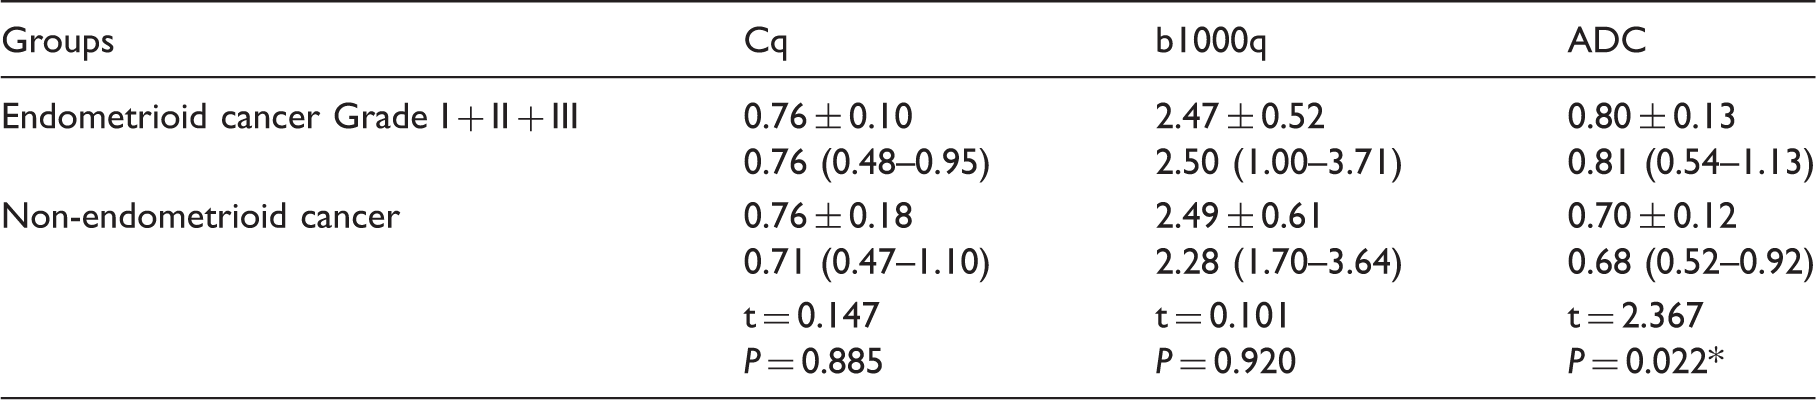
All the lesions were hyperintense on DWI by visual evaluation. The images belonging to the two different patient groups are presented in Figs. 1 and 2.
Images of a 54-year-old woman with a endometrioid type of endometrial carcinoma (Grade III). (a) Sagittal plane T2W and (b) T1W fat-suppressed post-contrast MR images demonstrate a polypoid lesion in the endometrial cavity (arrows on and b). (c) DWI MR image (reverse image) demonstrates water restriction within lesion, which appear as dark area (arrow). (d) ADC map shows that the lesion is hypointense (arrow), which corresponds with low ADC values. Images of a 71-year-old woman with a non-endometrioid type of endometrial carcinoma (serous adenocarcinoma). (a) Sagittal plane T2W MR image demonstrates a large prominent hypointense polypoid lesion consistent with a leiomyoma filling the endometrial cavity (thick black arrow). There is another lesion nearly isointense with myometrium, which is compressed by a leiomyoma at the level of the fundus (thin white arrows) (b) T1W fat-suppressed post-contrast MR images demonstrate nearly similar contrast enhancement pattern in both lesions (the thick arrow demonstrates leiomyoma, the thin arrows demonstrate tumoral lesion). The tumoral lesion shows deep myometrial invasion. (c) In the DWI MR image (reverse image), the leiomyoma demonstrates hypointensity (thick arrow) but the tumoral lesion demonstrates water restriction, which appears as dark areas (thin arrows). d) On the ADC map, both lesions are hypointense (arrows), which corresponds with low ADC values. The postoperative pathology results confirmed the leiomyoma and non-endometrioid type of endometrial carcinoma (serous adenocarcinoma).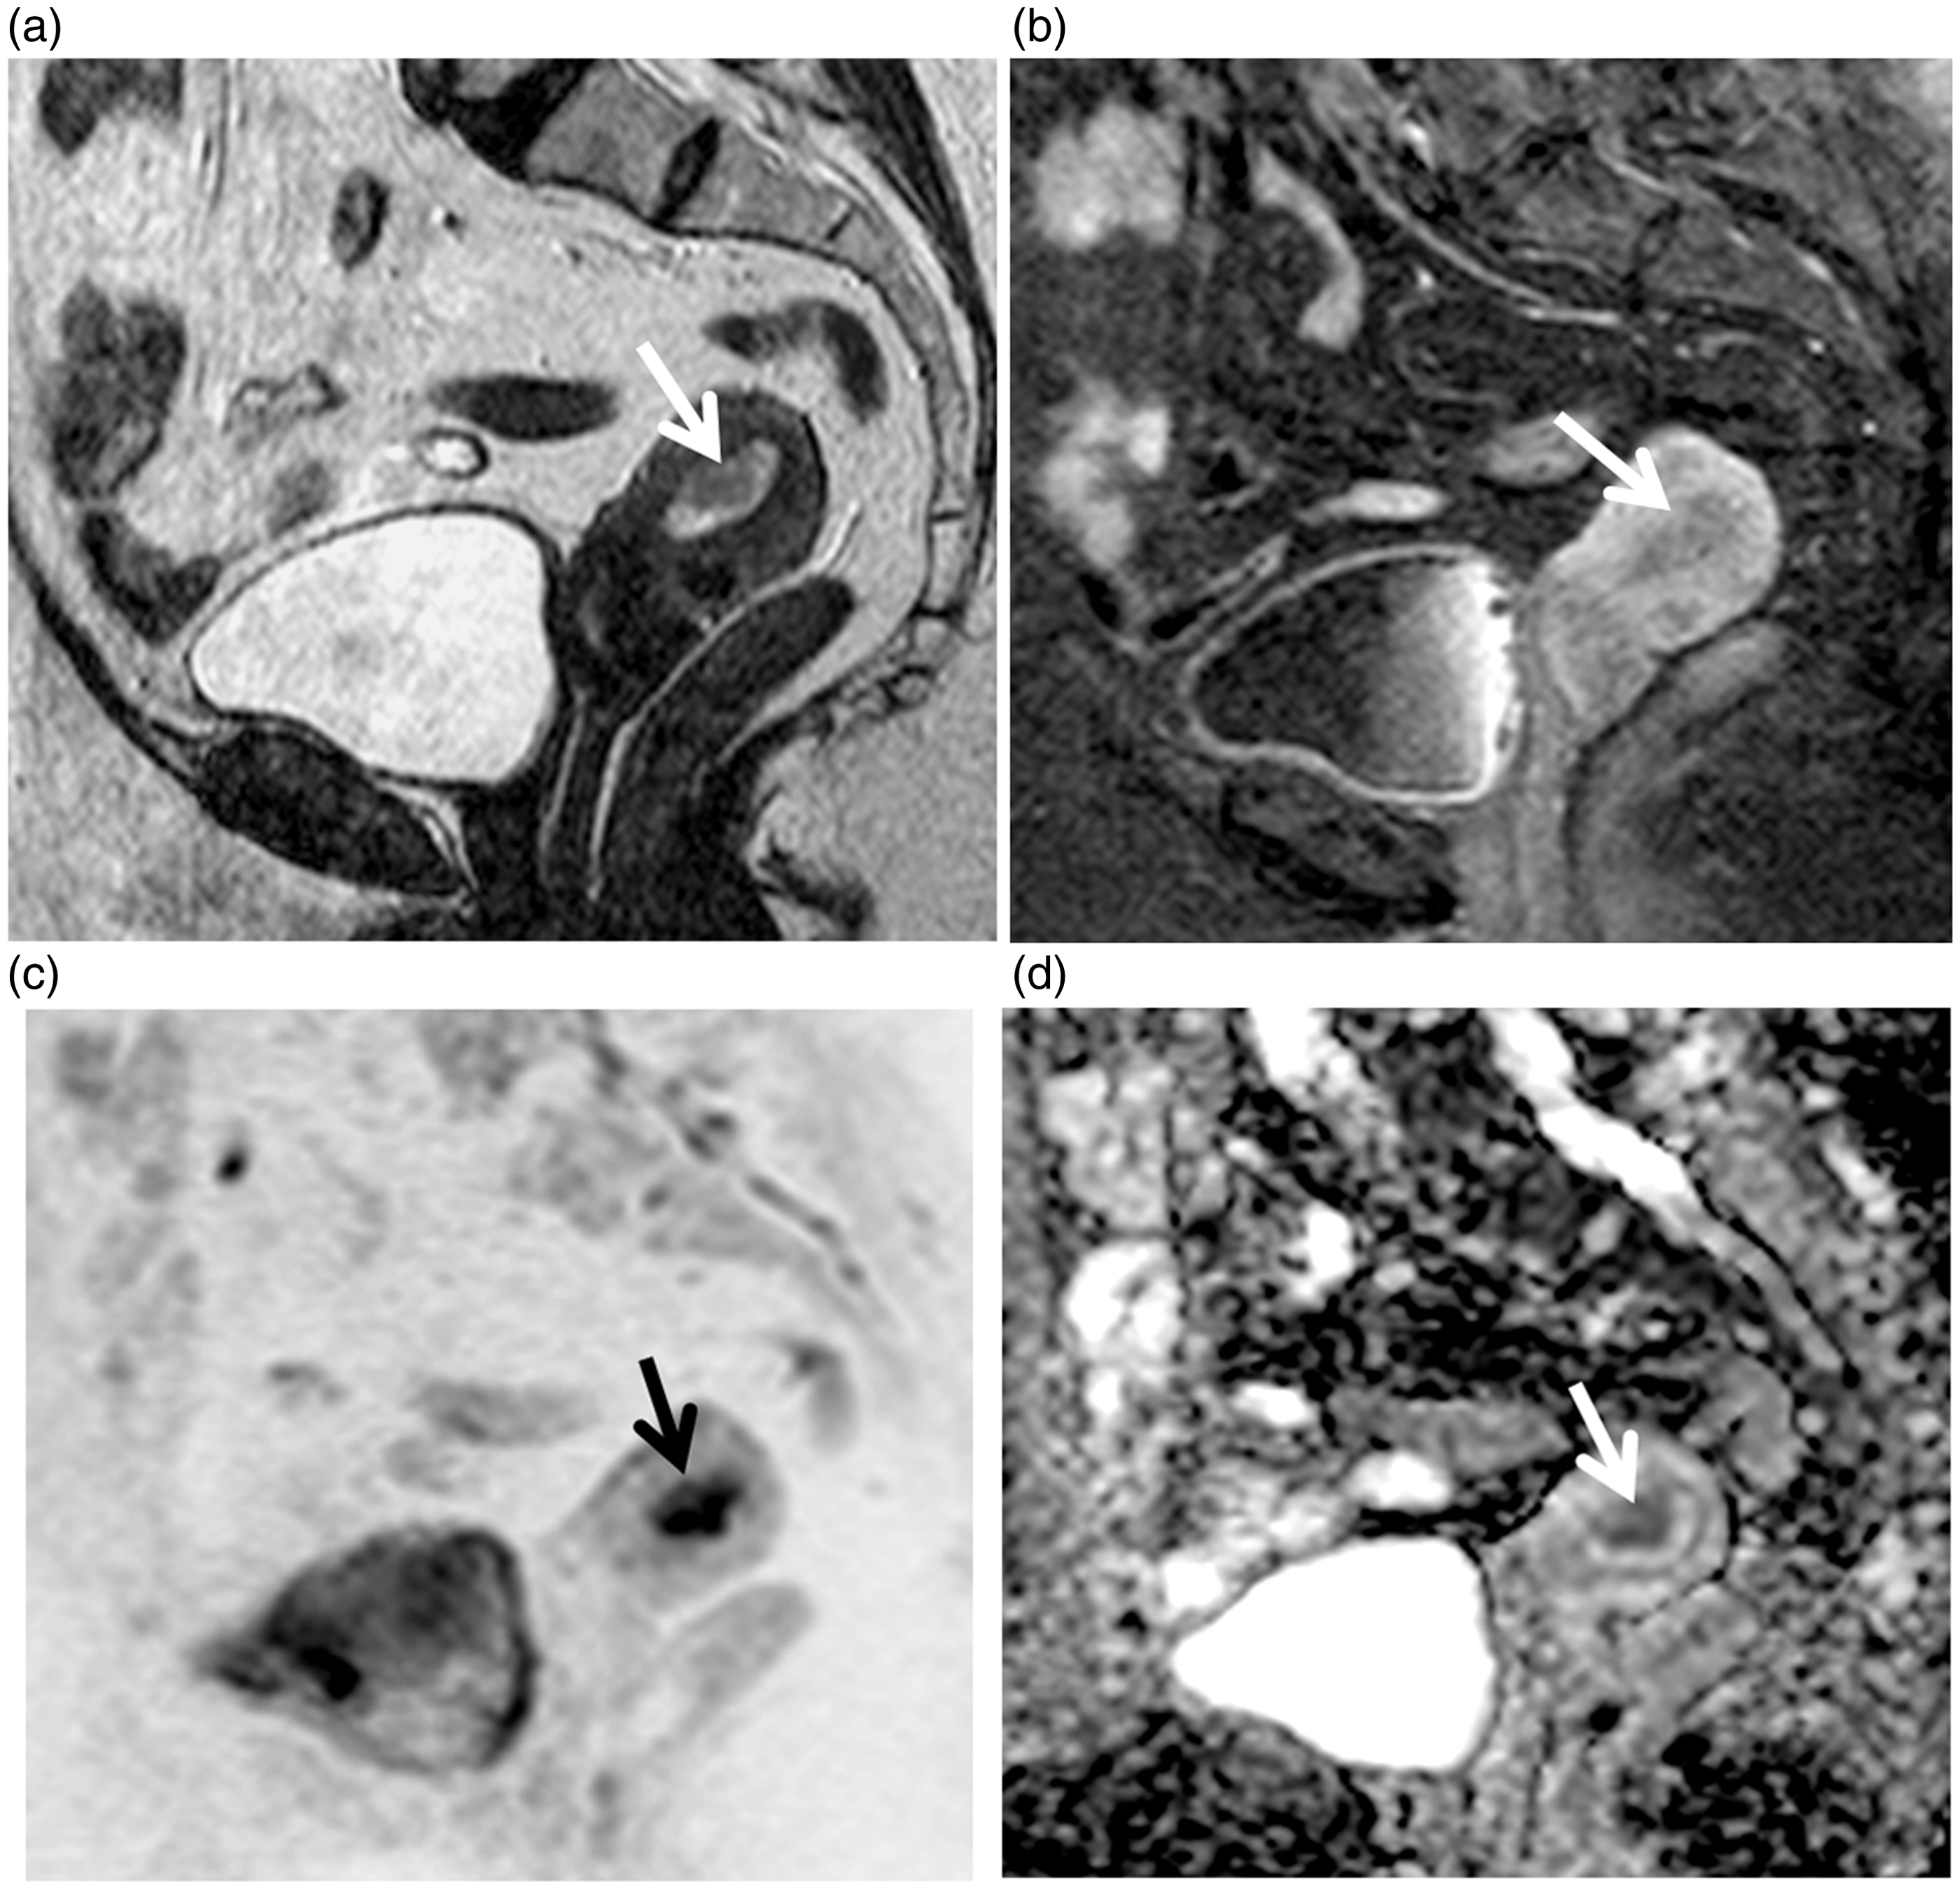
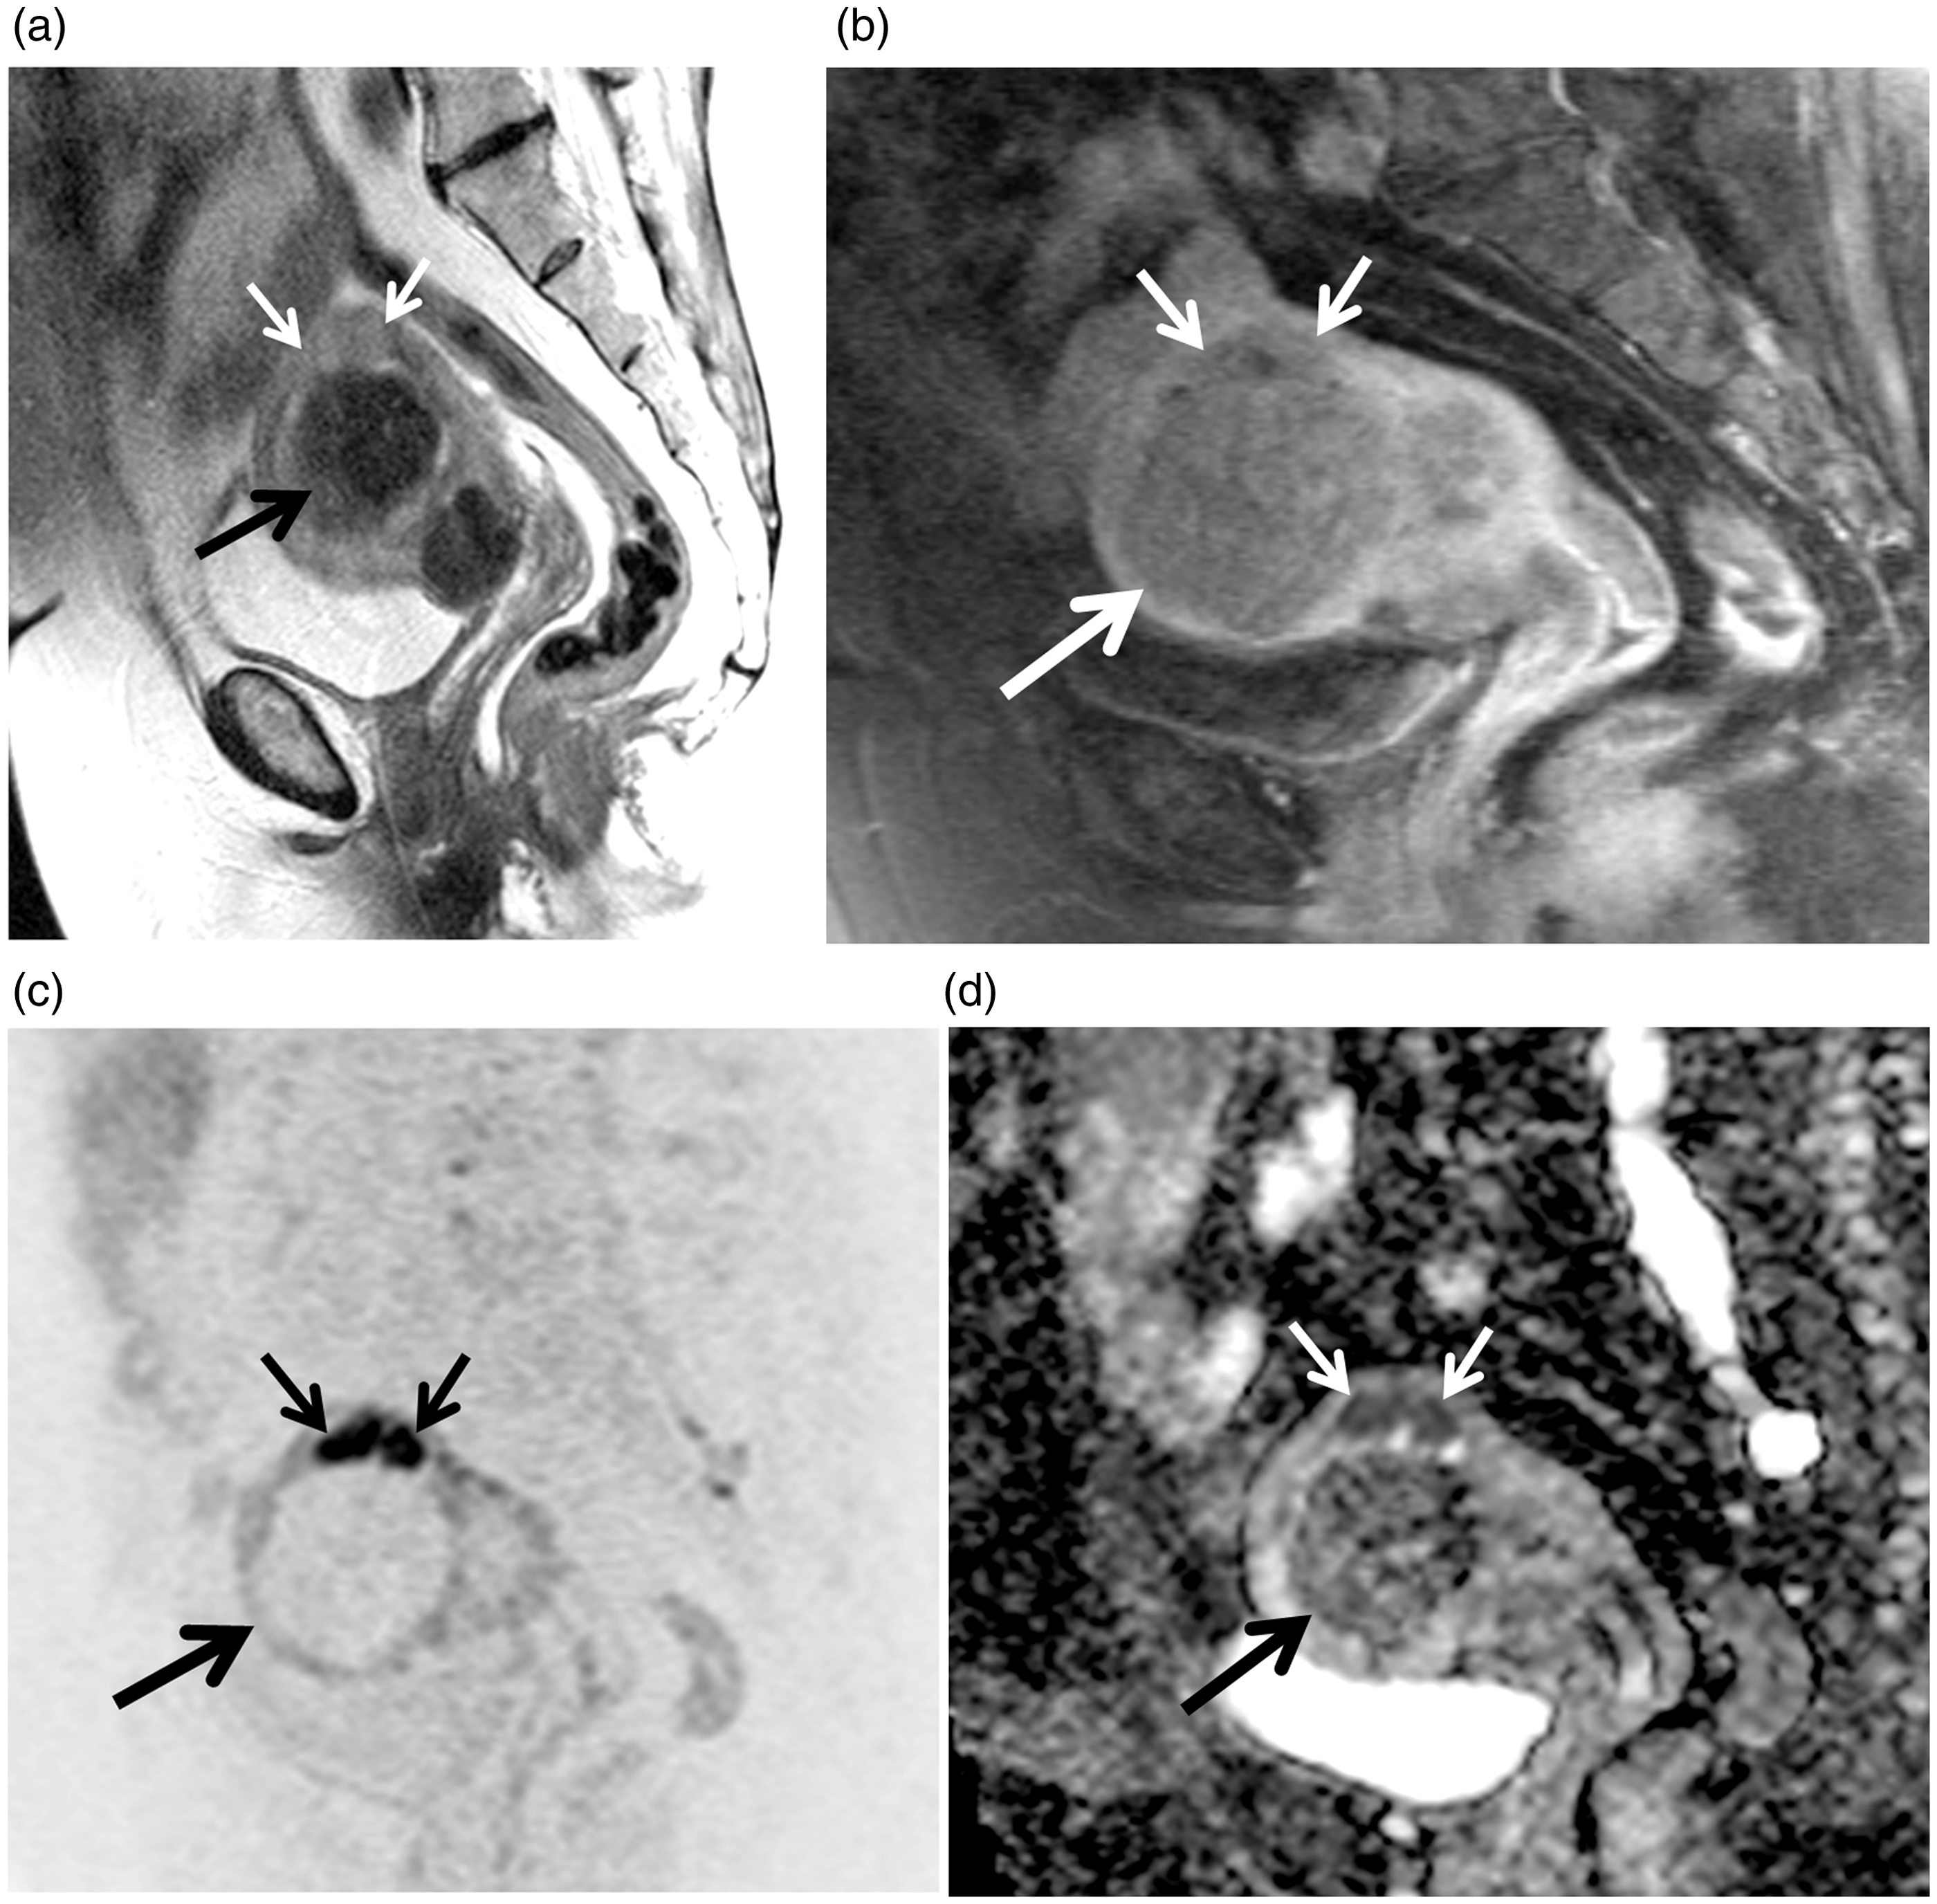
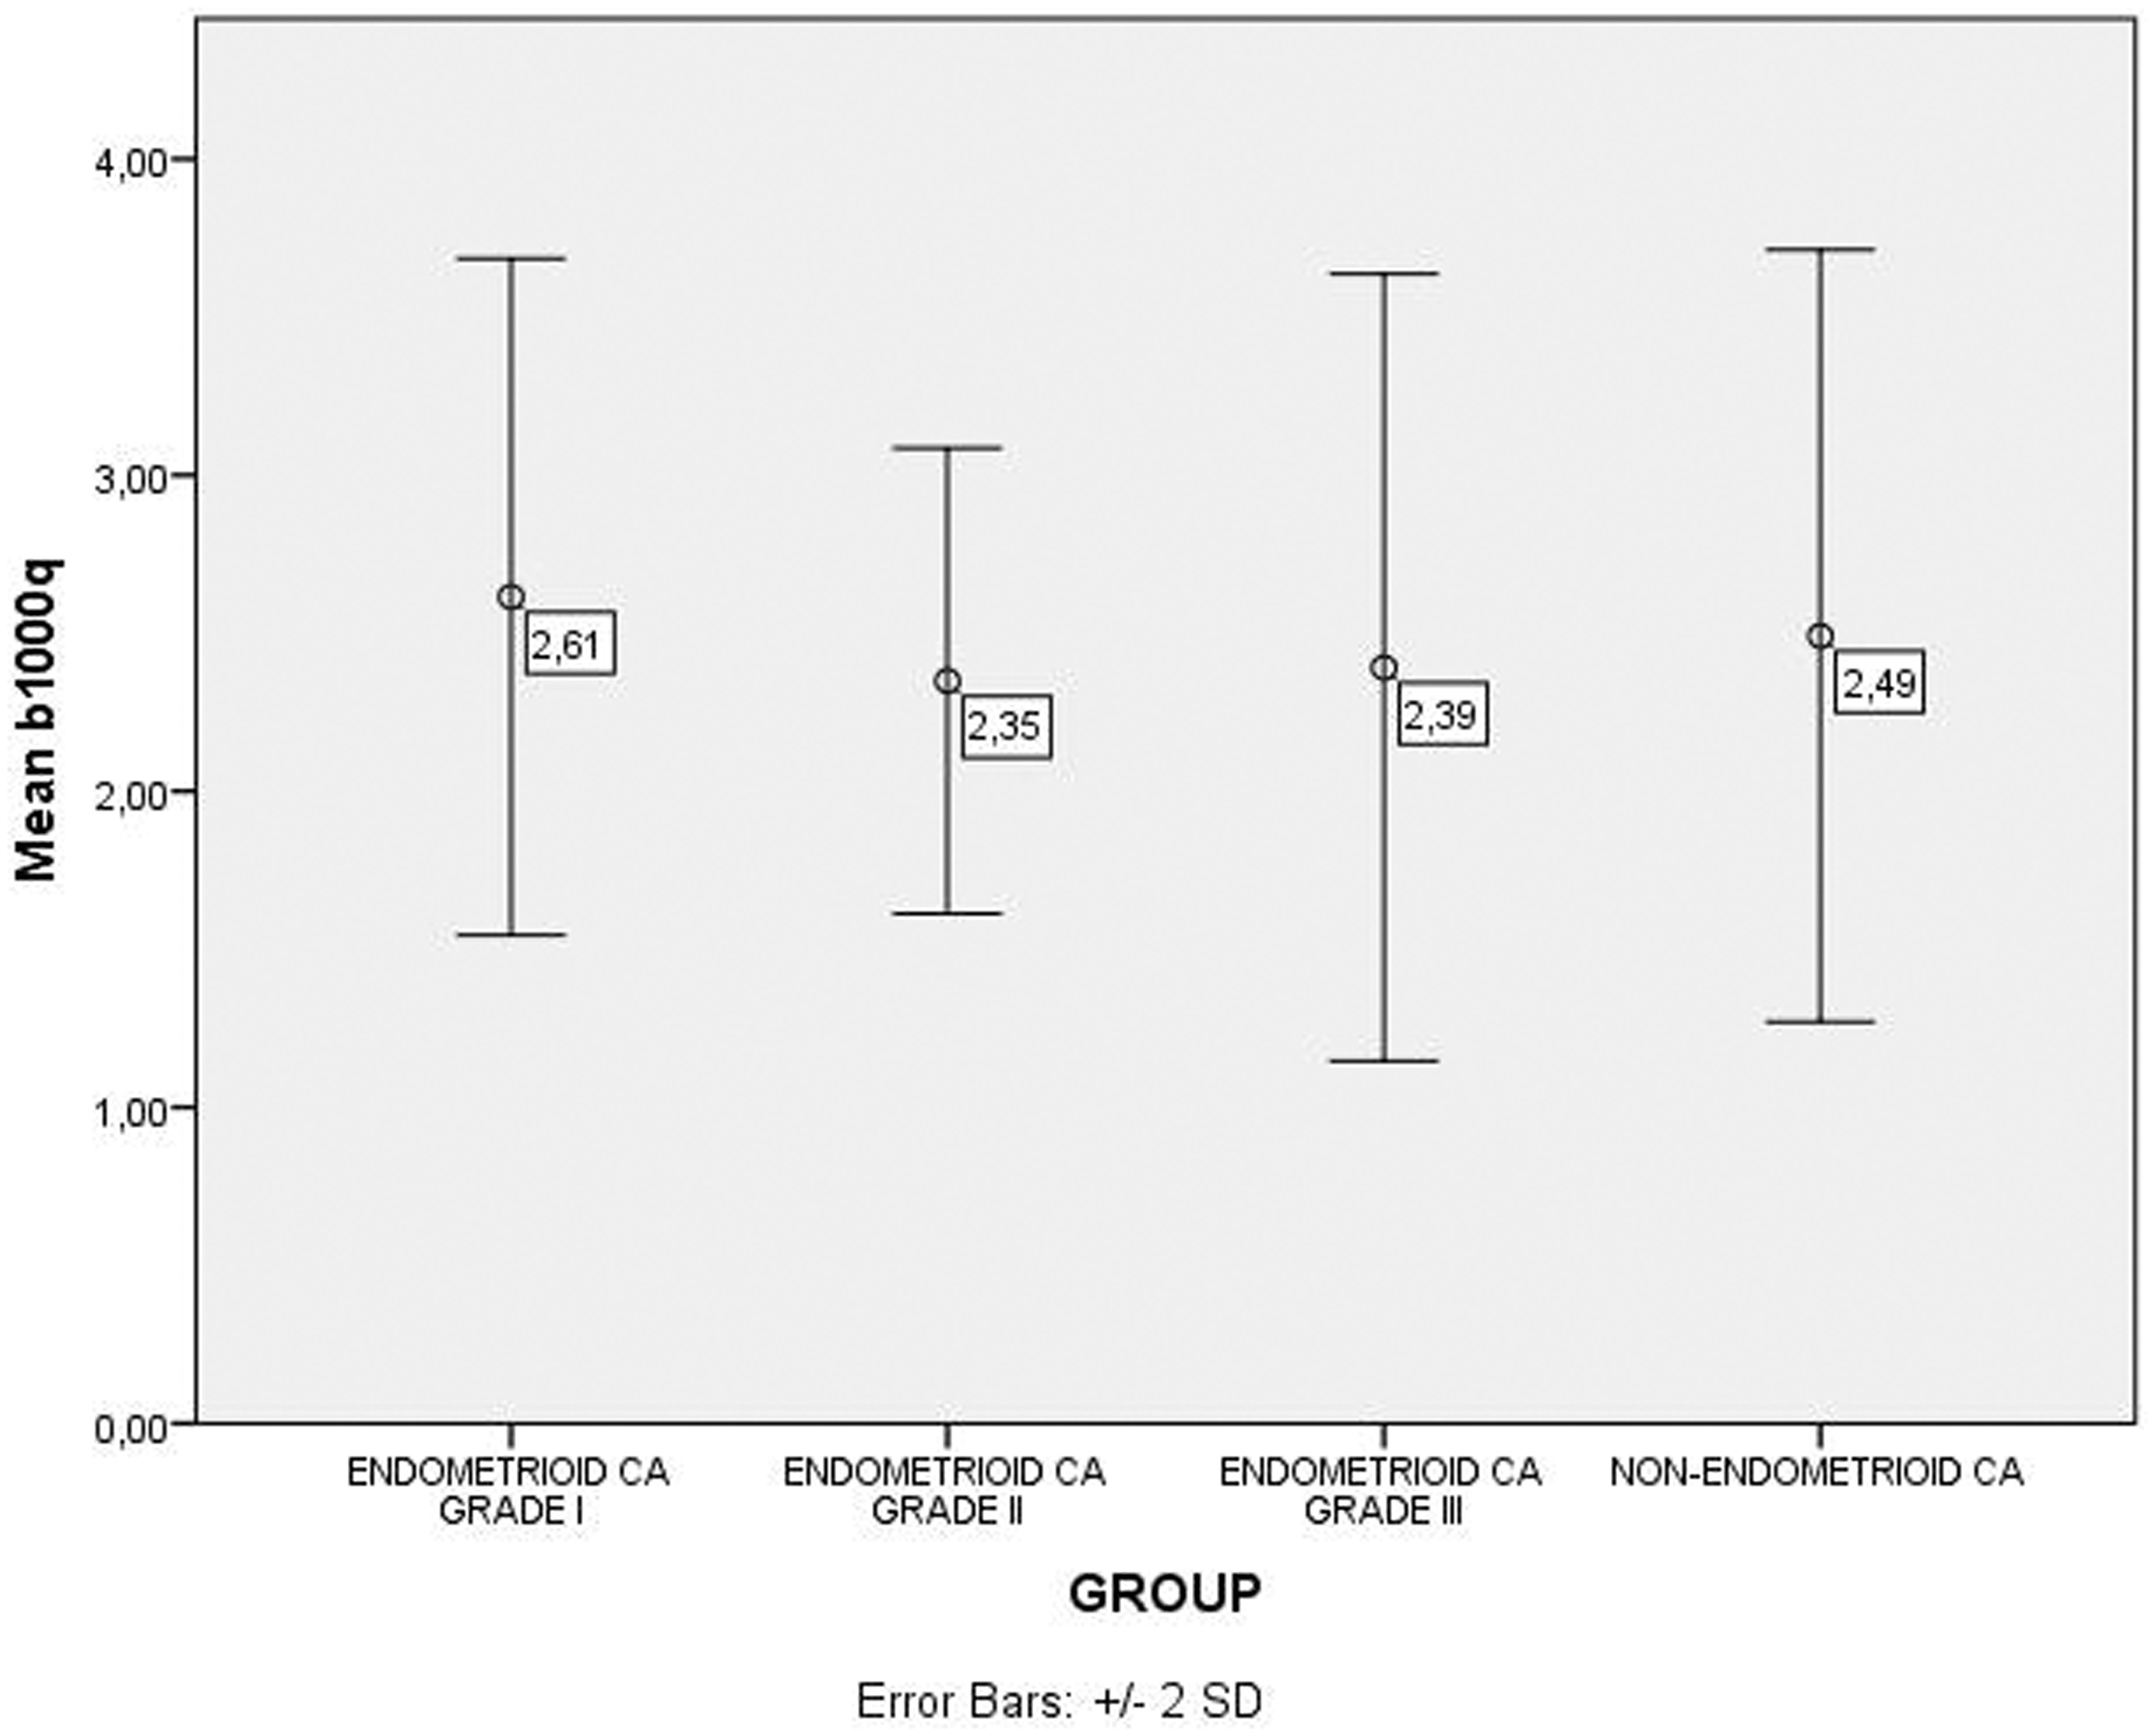
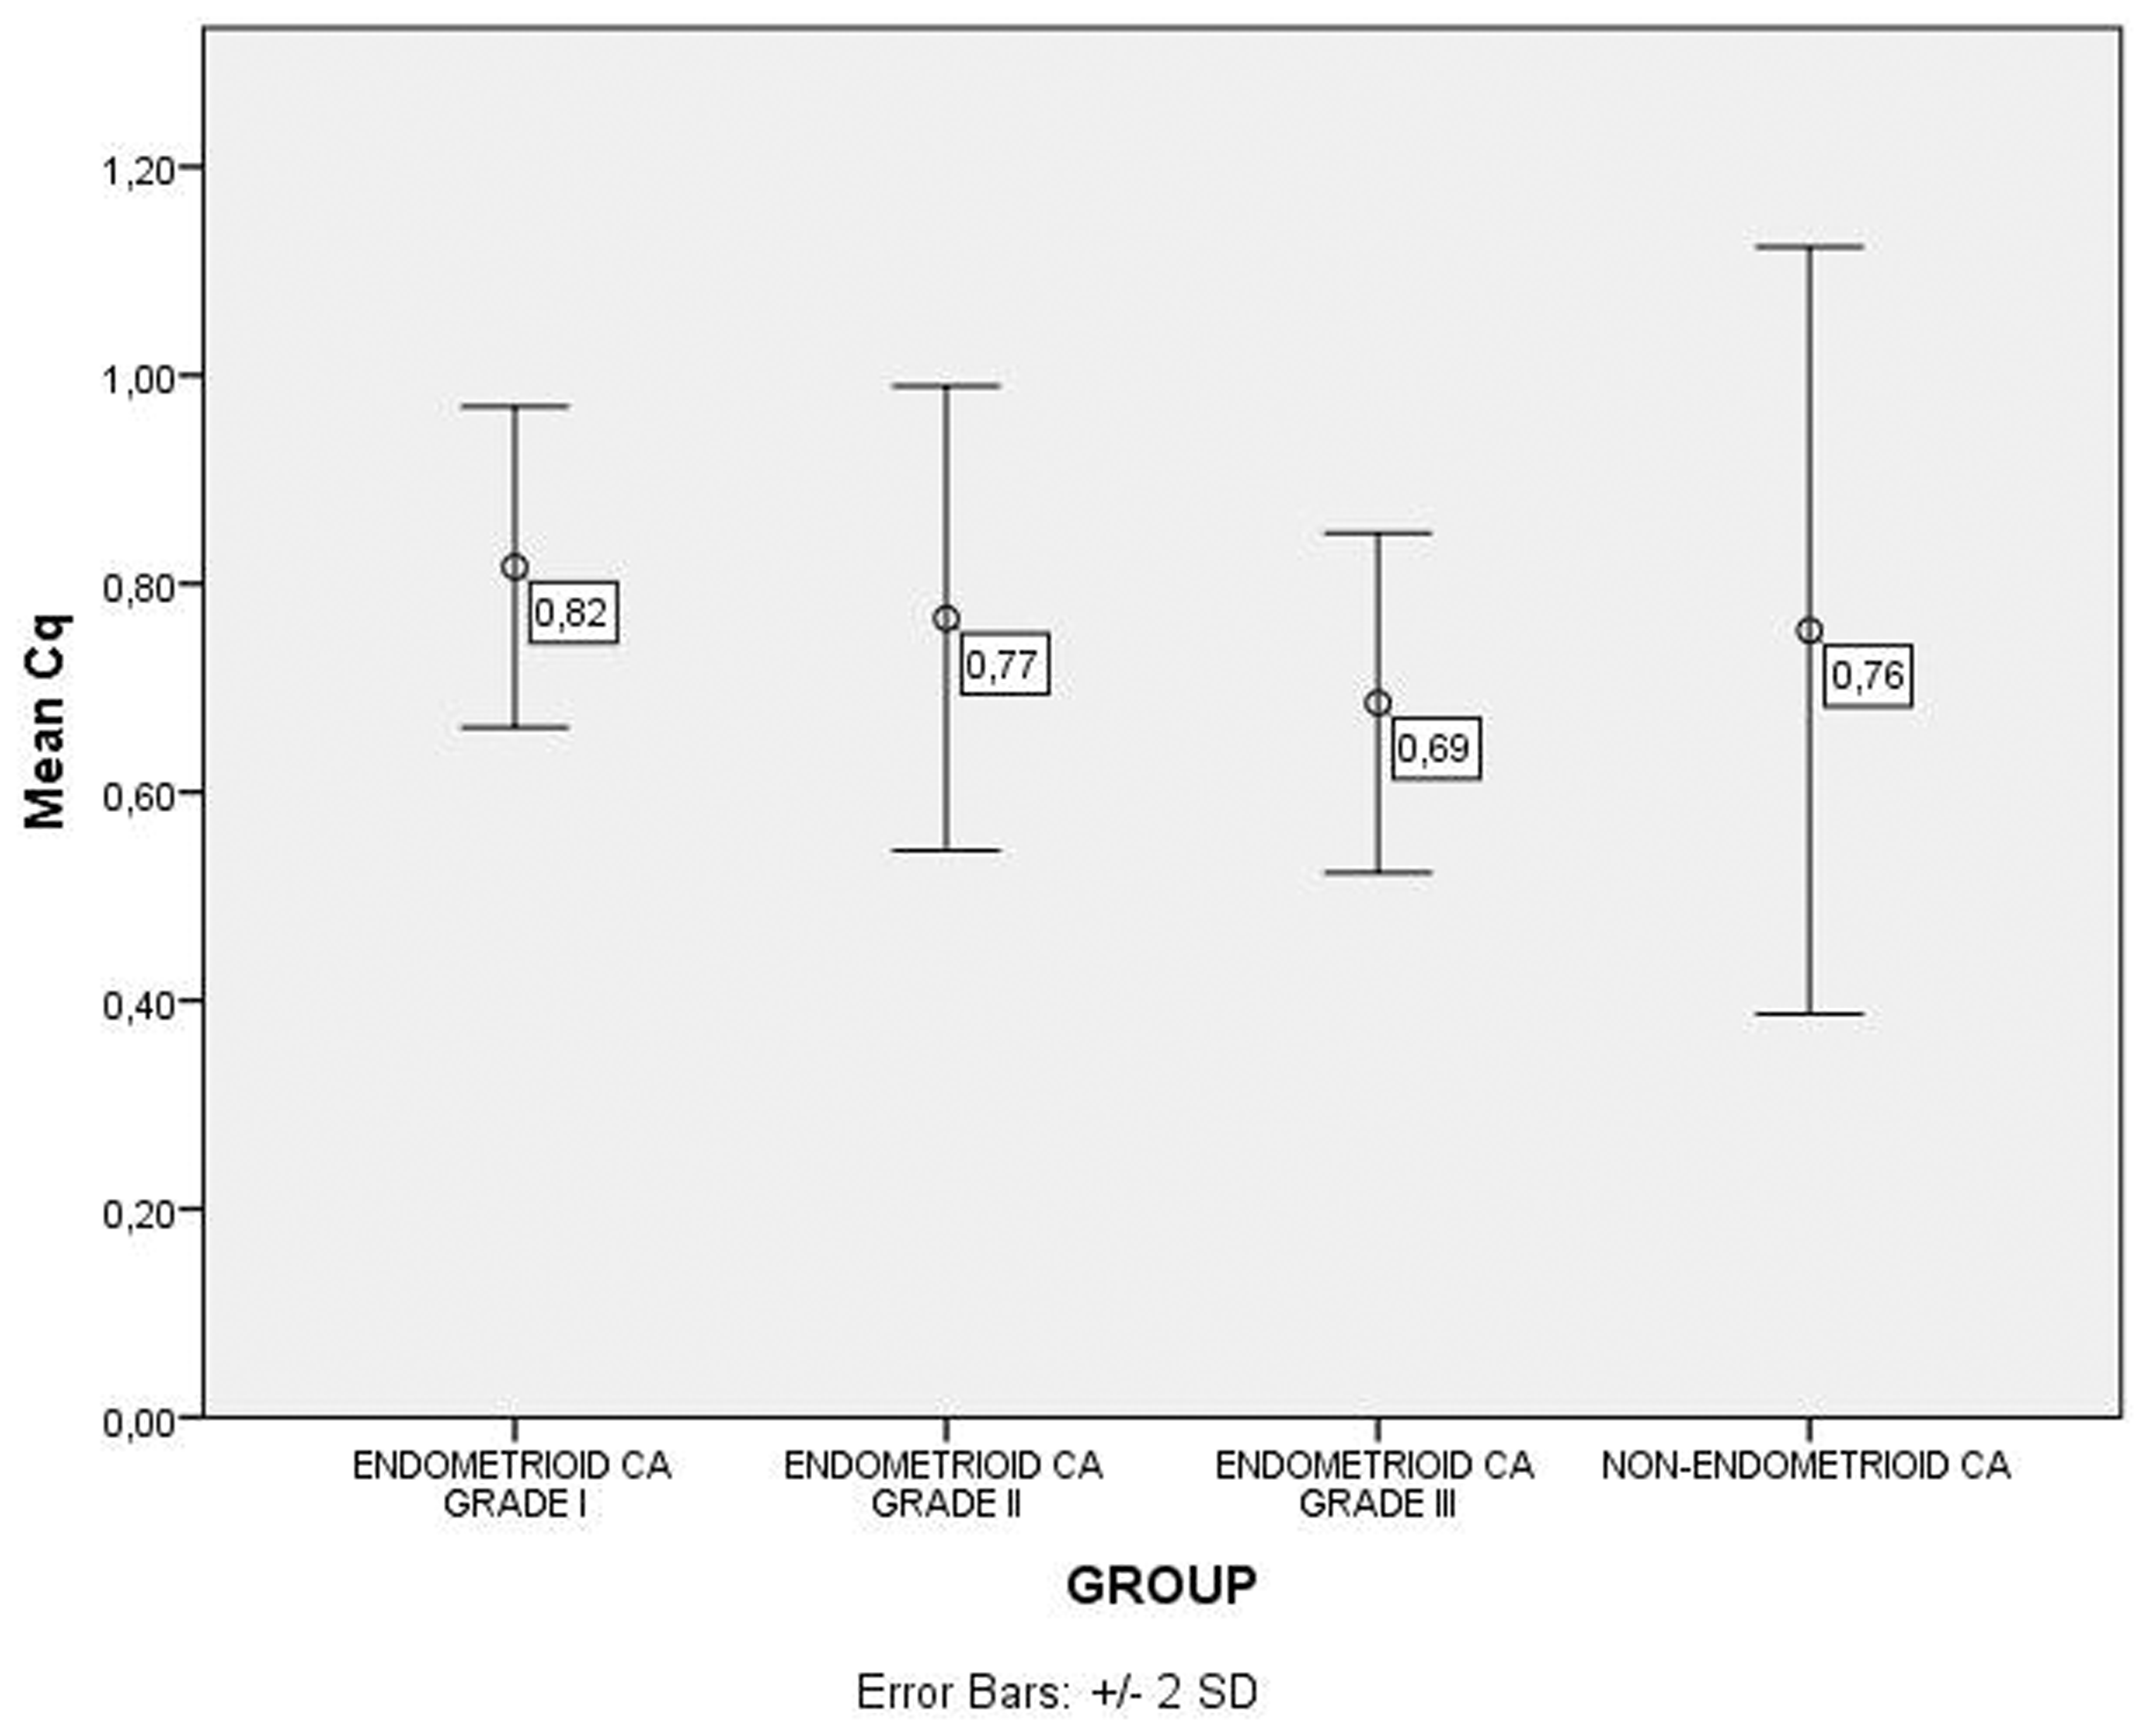
Mean ± standard deviations, medians, minimum and maximum ADC, b1000q, and Cq values in all groups and some particular groups are shown in Table 2. b1000q, ADC, and Cq values of the groups are shown in Figs. 3–5.
Distribution of ADC values in the groups (values represent mean values). Distribution of DWI (b = 1000 s/mm2) values (b1000q) in the groups (values represent mean values). Distribution of post-contrast (Cq) values in the groups (values represent mean values).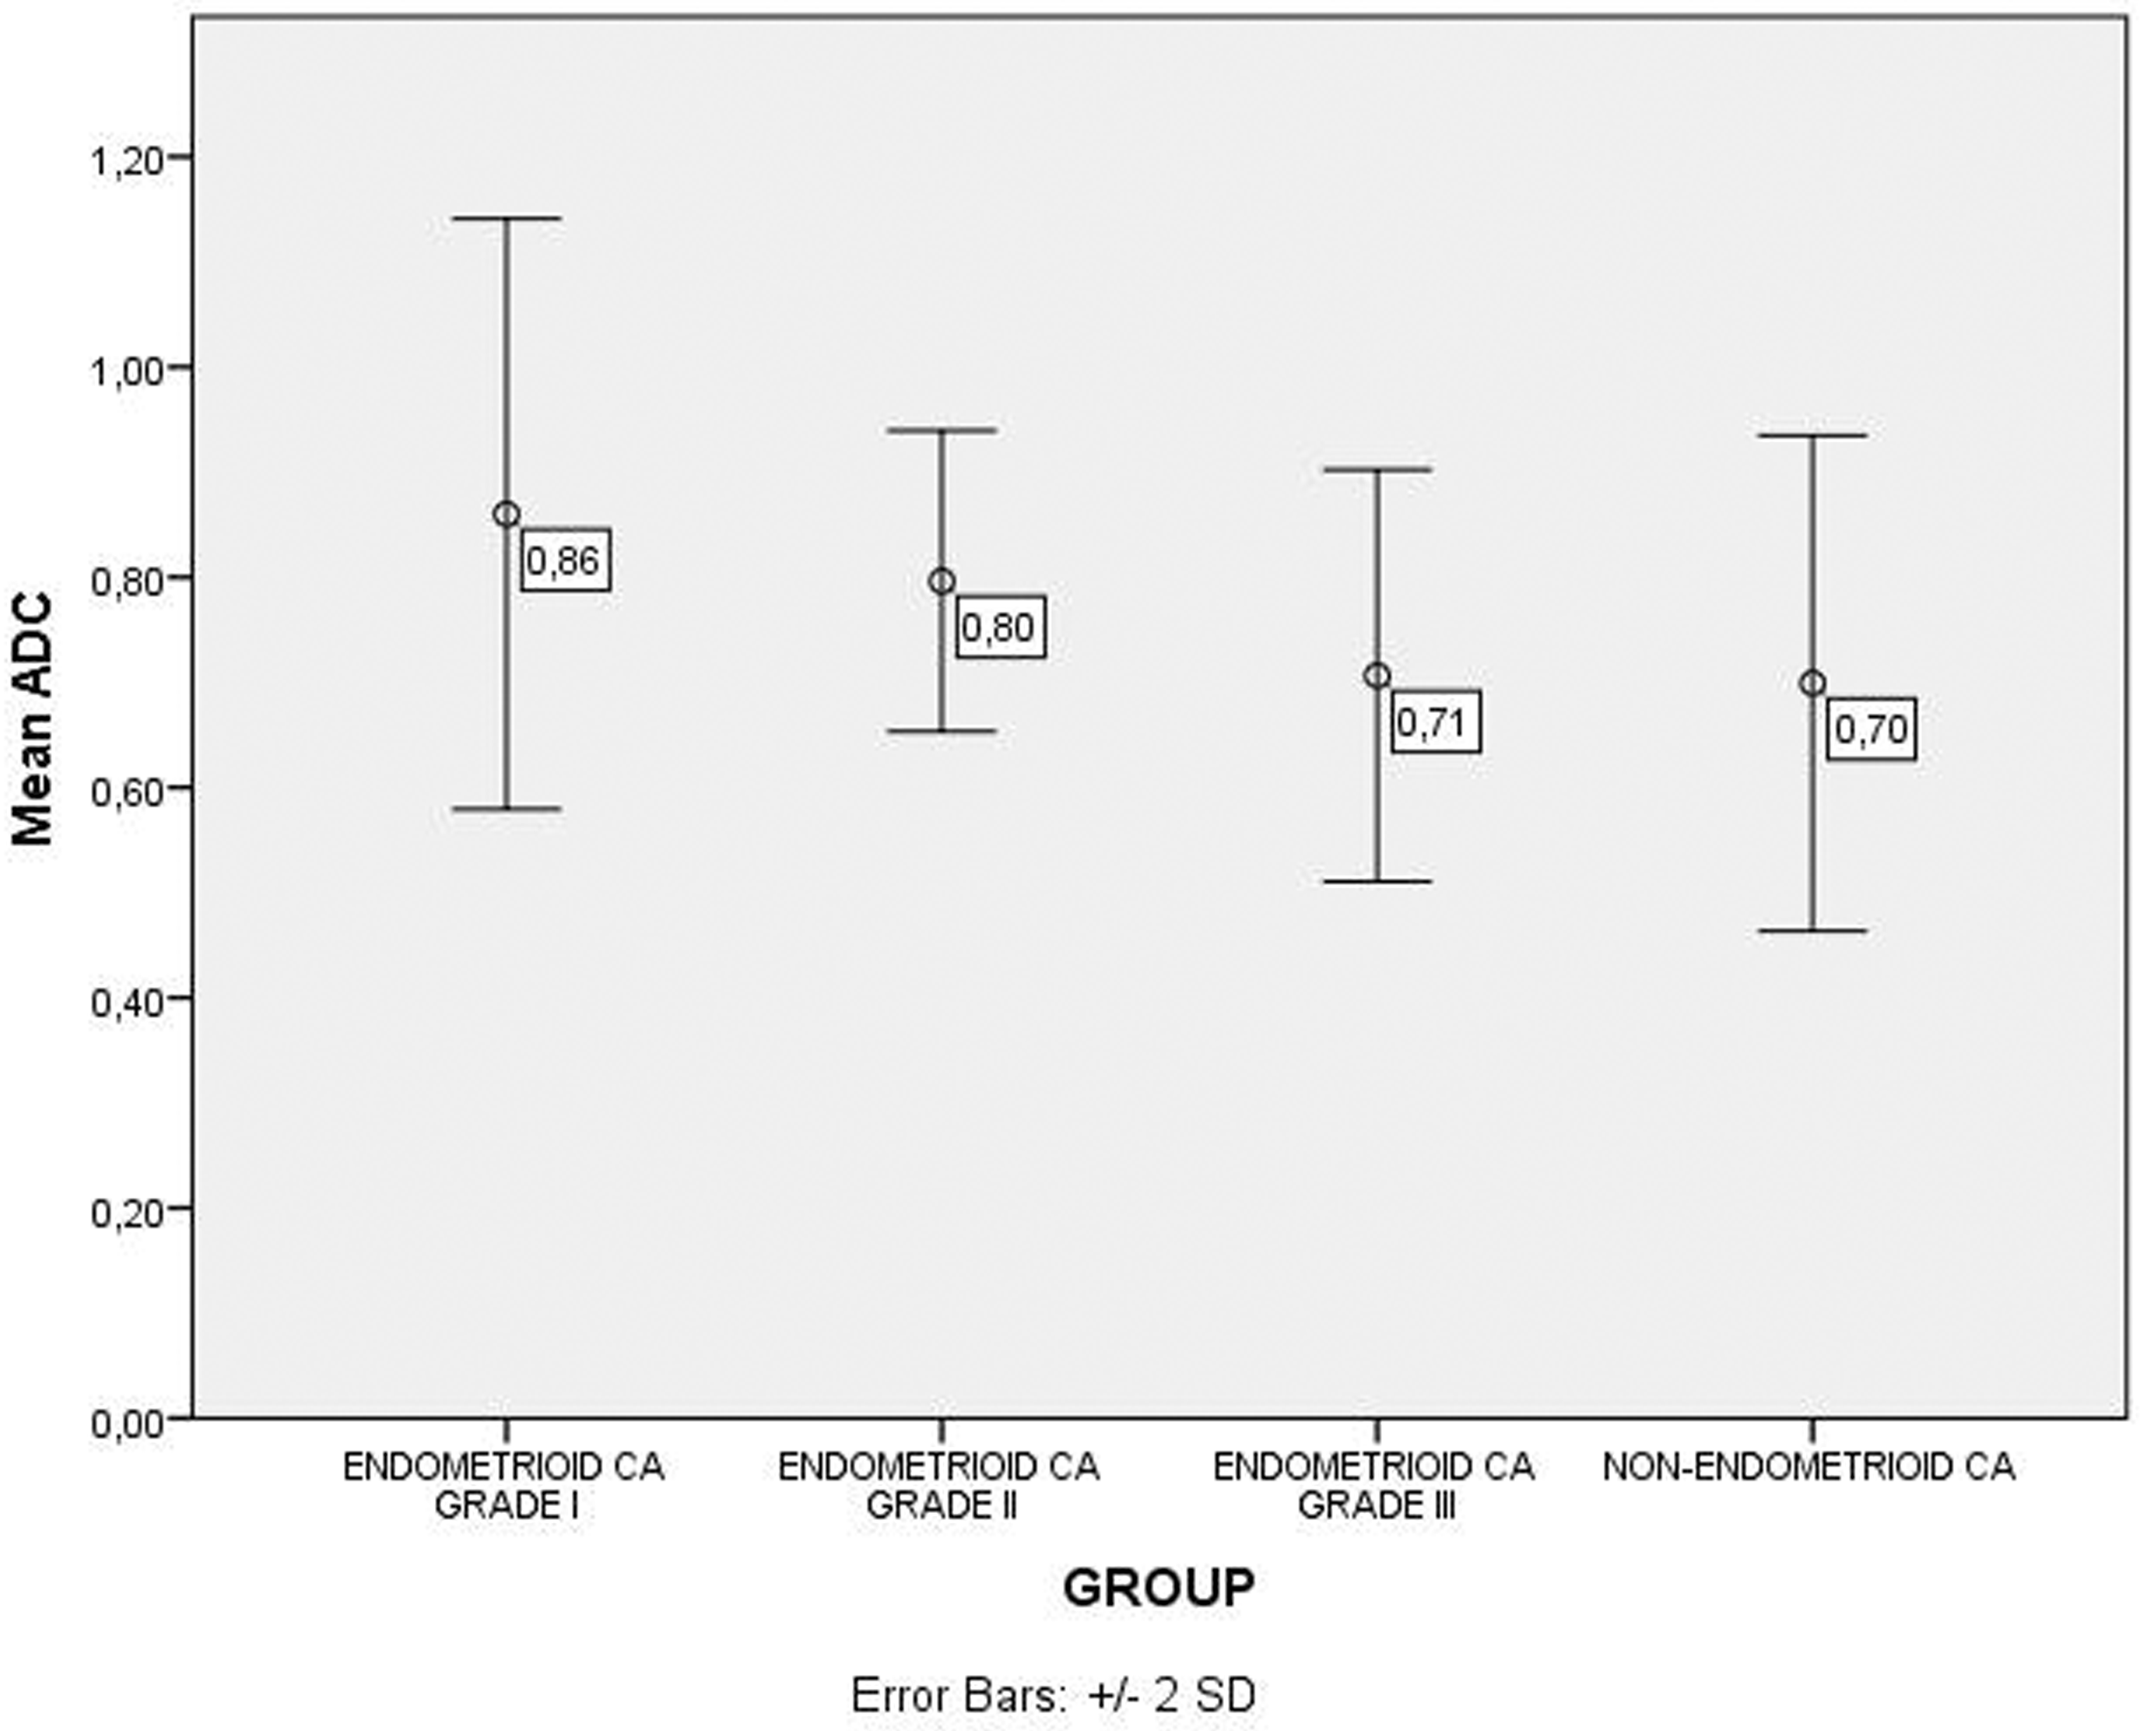
Endometrioid (each different Grade groups separately) and non-endometrioid groups were compared to each other and also compared with particular combined groups. The details are given in Tables 2–5. The results that were significant are listed in Tables 2–5.
When all groups were compared for ADC values, there was a significant difference between the Grade I endometrioid group and the Grade III endometrioid group (P = 0.006); the Grade I endometrioid group and the non-endometrioid group (P = 0.003) (Table 1); the Grade I + II endometrioid groups and the Grade III endometrioid group (P = 0.009), the Grade I + II endometrioid groups and the non-endometrioid group (P = 0.004) (Table 3); the Grade I endometrioid group and the Grade II + III endometrioid groups (P = 0.018) (Table 4); the Grade I + II + II endometrioid groups and the non-endometrioid group (t = 2.367, P = 0.022) (Table 5). However, considering b1000q (F = 0.640, P = 0.593) and Cq (χ2 = 6.233, P = 0.101), no significant difference was detected among the groups.
When comparing the endometrioid Grade I + II group with the endometrioid Grade III + non-endometrioid group, when the ADC cutoff value was 0.79, the sensitivity and specificity in the differential diagnosis of these groups were 82.6% and 70.4%, respectively (AUC, 0.795; 95% CI, 0.658–0.896). When the Cq cutoff value was 0.73, the sensitivity and specificity in the differential diagnosis of these groups were 75% and 76.2%, respectively (AUC, 0.687; 95% CI, 0.523–0.822). For the b1000q values, AUC was 0.538 (P = 0.656) and 95% CI was 0.391–0.680. Hence, a cutoff value could not be determined.
Discussion
This study revealed that the mean ADC values had an inverse relationship with tumor grade. As tumor grade increased, ADC values decreased (Fig. 3). The ADC values of non-endometrioid tumors also decreased, similar to the ADC values of high-grade endometrioid tumors (Fig. 3). These two groups with similar clinical prognoses (14–18) also had similar ADC values.
The higher ADC values of low-grade endometrioid tumors may be related to the low cellularity of these tumors and high water molecule motion; conversely, high-grade endometrioid tumors typically have high cellular density and therefore have lower ADC values (5,9). Moreover, in higher grade cancers, more of the cancer cells are arranged in a disorganized fashion and do not form glands as low-grade cancers, and the tumor cells are also larger, which could cause restricted diffusion of water molecules. When tumor cells are large, the extracellular space becomes small, thereby restricting water motion (4).
In our study, statistically significant differences were detected between the ADC values of low-grade endometrioid tumors, high-grade endometrioid tumors, and non-endometrioid tumors (Tables 2–5). However, in the literature, various results have been reported on the relationship between tumor grade and ADC (1,11,22). In the study by Shen et al., there was no significant correlation between ADC and tumor grade (P = 0.1915) (11). In another study performed by Takeuchi et al., where Grade I endometrial carcinomas constituted a group and Grades 2 and 3 another group, there was no statistical difference between their ADC values (22). The study of Seo et al. reported that the mean ADC value of Grades 2 or 3 was significantly lower than Grade I (P < 0.01) (4). Tamai et al. reported that the ADC value of Grade III tumors was significantly lower than that of Grade I and 2 tumors (P < 0.05), which is similar to our results (1). According to the criteria of the International Federation of Gynecology and Obstetrics (FIGO) grading system, the cellular density of the endometrial carcinoma is an important factor in determining histologic grade (23). Thus, a decrease in ADC values in high-grade endometrial carcinomas can be related to the restricted diffusion of water molecules, due to increased cellular density (1). However, cellularity is not the only determining factor for tumor grade, and other indicators such as nuclear atypia are also important; however, these factors cannot be assessed with DWI (9). Necrosis, which is seen in poorly differentiated carcinomas, can be a confounding factor, because ADC values increase in these cases (9). The conflicting results in the literature can be due to the degree of necrosis. Moreover, there is the possibility that cell membrane abnormalities, the stage of cell division, and the different pathological proteins produced might also participate in the movement of water molecules (4,9,24).
Also, different classification methods used for grouping tumor grades in the studies (such as Grade I + II versus Grade III, Grade I versus Grade II + III) and methodological differences in ROI measurements (ROI including all of the lesion versus ROI that does not include artifacts or cystic-necrotic areas) can play a role in explaining these controversial results reported in the literature. Another potential reason for these conflicting results is that ADC values may vary among different MRI systems. This significantly impacts the ADC values between different centers.
Endometrial carcinomas, which have various microscopic subtypes, may also be divided into two groups as Type I and Type II, depending on their clinical features and pathogenesis (25). Type I includes endometrioid histology with Grades I and II differentiation, whereas Type II includes Grade III endometrioid tumors and tumors with non-endometrioid histology (26). This division is clinically important because Type II endometrial carcinomas have a poor prognosis compared to Type I tumors. Using this classification, when the Type I endometrial carcinoma group, consisting of Grade I and Grade II endometrioid carcinomas, was compared to the Type II endometrial carcinoma group, which includes Grade III endometrioid carcinomas and non-endometrioid carcinomas, the difference in ADC values was statistically significant (P < 0.001). Additionally, when the ADC cutoff value was 0.79, the sensitivity and specificity in the differential diagnosis of these groups were 82.6% and 70.4%, respectively (AUC, 0.795; 95% CI, 0.658–0.896).
There are only a few studies in the literature that compare the contrast enhancement pattern with tumor grade or Type I–II endometrial cancers. In their study on dynamic contrast-enhanced (DCE) MRI, Fukunga et al. reported that endometrial carcinoma with strong (high level) enhancement on DCE-MRI was suggestive of Type II endometrial carcinoma and DCE-MRI could be useful for differentiating Type II from Type I tumors (27). Ippolito et al. also conducted a study on DCE-MRI and reported that significantly higher values (P < 0.001) of perfusion parameters were obtained for Grade I tumors, compared to those in Grade II and Grade III lesions (28). While we did not perform DCE-MRI in our study, we observed that Cq values (contrast enhancement pattern) did not show any statistically significant difference between the groups (Tables 2–5). Furthermore, no statistically significant difference was observed between the b1000q values among the groups (Tables 2–5).
This study had some limitations. The patient population size was limited. This was especially true for the non-endometrioid tumors group compared to the endometrioid tumors. Another limitation was that only the late phase contrast-enhanced images were used to evaluate enhancement patterns. However, the study design did not include the evaluation of early arterial phase or DCE-MRI findings.
The clinical implications of this study are especially important for patients in whom endometrial sampling cannot be performed or can be insufficient, such as in cases of cervical stenosis. It might be helpful if the imaging could alert the clinician to the possible diagnosis of high-grade tumors, as these tumors have the worst prognosis, DWI findings may be helpful for these patients’ management strategy.
As our study included a relatively small number of patients, our findings require validation in larger series.
In conclusion, the difference in ADC values between endometrioid and non-endometrioid tumors were statistically significant. However, the difference in diffusion-weighted and post-contrast T1-fat suppressed sequences’ signal intensity quotient values were not statistically significant. The mean ADC values had an inverse relationship with tumor grade in the endometrioid cancer group.
Footnotes
Declaration of Conflicting Interests
The author(s) declared no potential conflicts of interest with respect to the research, authorship, and/or publication of this article.
Funding
The author(s) received no financial support for the research, authorship, and/or publication of this article.