
Abstract
Background
Implantation of a transjugular intrahepatic portosystemic shunt (TIPS) induces changes of liver perfusion.
Purpose
To determine the changes in arterial, portal venous, and total perfusion of the liver parenchyma induced by TIPS using the technique of volume perfusion computed tomography (VPCT) and compare results with invasively measured hepatic intravascular pressure values.
Material and Methods
VPCT quantification of liver perfusion was performed in 23 patients (mean age, 62.5 ± 8.8 years) with portal hypertension in the pre-TIPS and post-TIPS setting, respectively. A commercially available software package was used for post-processing, enabling separate calculation of the dual (arterial [ALP] and portal venous [PVP]) blood supply and additionally of the hepatic perfusion index (HPI) (HPI = ALP/(ALP + PVP)*100%). Invasive pressure measurements were performed during the intervention, before and after TIPS placement. Liver function tests performed before and after the procedure were compared.
Results
Mean decrease of pressure gradient through TIPS was 13.3 mmHg. Mean normal values for ALP, PVP, and total perfusion (ALP + PVP) before TIPS were 15.9, 37.7, and 53.5 mL/100 mL/min, respectively, mean HPI was 35.4%. After TIPS, ALP increased to a mean value of 37.7 mL/100 mL/min, PVP decreased (15.7 mL/100 mL/min, P < 0.05), whereas total perfusion remained unchanged (53.4 mL/100 mL/min, P = 0.97). HPI increased (71.9%; P < 0.05). No correlation between invasive pressure measurement and VPCT parameters was observed. After TIPS, liver function tests were found to worsen with a significant increase of bilirubin (P < 0.05).
Conclusion
Following TIPS placement, ALP and HPI increased in all patients, whereas PVP markedly decreased. Interestingly, the magnitude of decrease in portosystemic pressure gradients was not found to correlate with VPCT parameters.
Keywords
Introduction
The liver receives a dual blood supply over the hepatic artery and the portal vein. The latter is normally responsible for about two-thirds to three-quarters of the total blood volume supplying the liver parenchyma. Twenty-five percent of the cardiac output is directed to the liver which therefore has adapted by means of high capacity and low perfusion pressure within the hepatic vascular system (1). Portal hypertension (PH) is defined as an increase in the portal pressure above normal ranges (normal range, 3–6 mmHg) due to increased intrahepatic resistance to blood flow (2). The most common cause of PH is liver cirrhosis. In cases of (i) variceal bleeding which cannot be treated sufficiently by endoscopy, (ii) refractory ascites, and/or (iii) hepatorenal syndrome, a transjugular intrahepatic portosystemic shunt (TIPS) can be implanted to reduce portal pressure (3,4). During this intervention, the intravascular pressure both in the liver veins and the portal vein can be directly (invasively) assessed. For this purpose, the hepatic venous pressure gradient (HVPG), which is defined as the gradient of hepatic portal venous pressure (HPP)—which can also be measured as wedged hepatic venous pressure (WHVP)—and the free hepatic venous pressure (FHVP) is used as an indicator for PH. Whereas HVPG usually is normal in liver cirrhosis, (sinusoidal)-related PH, HPP, and FHVP are increased. After TIPS implantation, a portal decompression can be reached in 95% of the patients (5), indicated by a drop of HPP and HVPG values and a concomitant increase in FHVP.
Volume perfusion computed tomography (VPCT) is a novel imaging technique that permits perfusion measurements coupled by software programs enabling separate calculation of arterial and portal venous liver perfusion (ALP and PVP, respectively).
The aim of this study was to determine the changes in arterial, portal venous (PV), and total perfusion of the liver parenchyma induced by TIPS and compare results with invasively measured hepatic intravascular pressure values. In a second step, we analyzed post-TIPS changes in liver parenchymal perfusion and their impact on liver function.
Material and Methods
Study population
This study was approved by the local ethics committee (project no. 76/2010B01). Written informed consent was obtained from all participants.
Twenty-three patients suffering from PH were examined in a prospective study design. Mean patient age was 62.5 ± 8.8 years (age range, 48–79 years). Advanced liver cirrhosis and complications related to PH requested decompression by TIPS placement in all patients. Inclusion criteria in this study were PH with indication for TIPS placement, age > 18 years, and normal kidney function. Exclusion criteria were age < 18 years, allergy of iodine contrast media, hyperthyroidism, congestive heart failure, severe pulmonary arterial hypertension, and severe coagulopathy.
The study population comprised 17 male and 6 female patients (n = 23). Liver cirrhosis was alcohol-induced (n = 14), secondary to chronic viral infection of the liver (n = 4), accompanying a non-alcoholic fatty liver disease (NAFLD) (n = 1), due to primary biliary cirrhosis (n = 1), and cryptogenic (n = 1). In two cases, PH was not caused by liver cirrhosis but associated with hemosiderosis (n = 1) or portal thrombosis (n = 1). According to the Child–Pugh classification (6), liver cirrhosis was class A in six cases, class B in 10 cases, and class C in five cases. Furthermore, an average MELD score (7) of 14.1 was calculated. Fifteen patients had a history of upper gastrointestinal tract bleeding, 22 patients had ascites. Esophageal varices were present or had been diagnosed before in 22 patients. Episodes with hepatic encephalopathy had occurred at least once in two patients before TIPS procedure and in four patients it became manifest after TIPS implantation.
Liver function parameters were available both in the pre- and post-TIPS setting. Perfusion of the liver parenchyma was measured accordingly also in the pre-TIPS and post-TIPS setting, respectively.
TIPS placement
TIPS placement was performed at our institution by two experienced radiologists (each with over 5 years of experience in this technique) in all patients. After pre-dilatation with a balloon catheter, TIPS was established using a self-expanding nitinol stent (12 or 14 mm in diameter) according to the standard-of-care procedure at our institution with stent post-dilatation to a diameter of 10 mm or 12 mm. Pressure measurement was performed during the intervention pre- and post-TIPS. HVPG was measured as the difference between HPP and FHVP. Technical success was defined as a portosystemic pressure gradient after TIPS placement of 10 mmHg or below.
CT data acquisition
CT studies were performed using a multi-slice scanner (SOMATOM Definition AS and Definition Flash- Siemens Healthcare, Forchheim, Germany).
The CT protocol consisted of a non-enhanced abdominal low-dose CT (40 mAs; 100 kV; SL, 5.0 mm; collimation, 128 × 0.6 mm; tube rotation time, 0.5 s; pitch, 0.6), which was obtained to localize the liver porta. Subsequently, a scan range of 6.9 cm z-axis coverage was planned over the involved liver, followed by a VPCT using an adaptive spiral scanning technique in shuttle mode. Perfusion parameters were: 80 kV; 100/120 mAs (for patients</>70 kg, respectively); collimation, 64 × 0.6 mm with z-flying focal spot; and 26 CT-whole coverages of the liver volume within a total scan time of 40 s. The mean radiation exposure for liver perfusion measurements was 7.5 mSv. Contrast medium was administered by using a dual-head pump injector (Stellant, Medtron, Saarbruecken, Germany). For this purpose, 50 mL Ultravist 370 (Bayer Vital, Leverkusen, Germany) were injected in all patients irrespective of patients’ weight at a flow rate of 5 mL/s in an antecubital vein followed by a saline flush of 50 mL NaCl at 5 mL/s. All images were transferred to an external workstation (Multi-Modality Workplace, Siemens, Erlangen, Germany) for analysis. An abdominal scan in portal vein phase was also obtained.
CT data analysis
Two experienced radiologists with 5 and 2 years of experience in performing and evaluating VPCT (MH and HP) analyzed the datasets blinded to the other reader’s results. Quantitative perfusion analysis was performed using a commercially available software package (Siemens Healthcare, Erlangen, Germany) based on a separate calculation of the dual (ALP and PVP) blood supply based on a maximum-slope approach. For the arterial input function, a region of interest (ROI) was placed into the spleen; for the PV perfusion, a ROI was placed into the central extrahepatic portal vein.
To gain hepatic perfusion parameters, a volume-of-interest (VOI) analysis was used. VOIs were drawn manually into the liver defining three large areas (mean volume, 9.02 ± 2.16 cm3) in the peripheral region of the left lobe, right lobe, and caudate portion of the liver with a minimum distance of 5 mm to the liver margin (Figs. 1 and 2). Care was taken to exclude vessels. The following parameters were obtained: hepatic arterial enhancement (ALP); maximum portal vein enhancement (PVP); and the hepatic perfusion index (HPI), which was calculated as the following: HPI = ALP/(ALP + PVP)*100%.
Example of a 57-year-old patient with class A liver cirrhosis. Refractory ascites led to TIPS implantation. In the pre-TIPS VPCT measurement (top) a VOI is placed in the right lobe of the liver. With a mean HPI of 24.04%, there is no hyperarterialisation in this setting. In the post-TIPS imaging (bottom) of the same patient HPI increased to 57.79%, ALP increased and PVP decreased. Example of a 62-year-old patient with class B liver cirrhosis. Variceal bleeding led to TIPS implantation. In the pre-TIPS VPCT (top) measurement HPI is already remarkably increased (mean 92.45%). The post TIPS imaging of the patient (bottom) shows further increase in HPI (96.20%), increase of ALP (55.02 to 81.35 mL/100 mL/min) and a decrease of PVP (4.87 to 3.36 mL/100 mL/min).

Statistical analysis
All parameters are displayed as mean ± SD. Paired t-test was used in case of repetitive measurement of a parameter in one patient. P values ≤ 0.05 were regarded as statistically significant. Correlation was analyzed using Pearson in the case of normal data distribution and Spearman in the case of non-normal distribution.
Results
TIPS implantation and invasive pressure measurement
Results of invasive pressure measurement (mmHg) pre- and post-TIPS.

FHVP, free hepatic venous pressure; HPP, hepatic portal venous pressure; HVPG, hepatic venous pressure gradient.
Hepatic perfusion measured by VPCT
Pre-TIPS VPCT measurement was carried out between 0 and 45 days (median, 3 days) before TIPS placement. Post-TIPS measurement was carried out between 0 and 45 days after TIPS placement (median, 1 day). Measurements of VPCT parameters did not differ between the two experienced radiologists (P > 0.05).
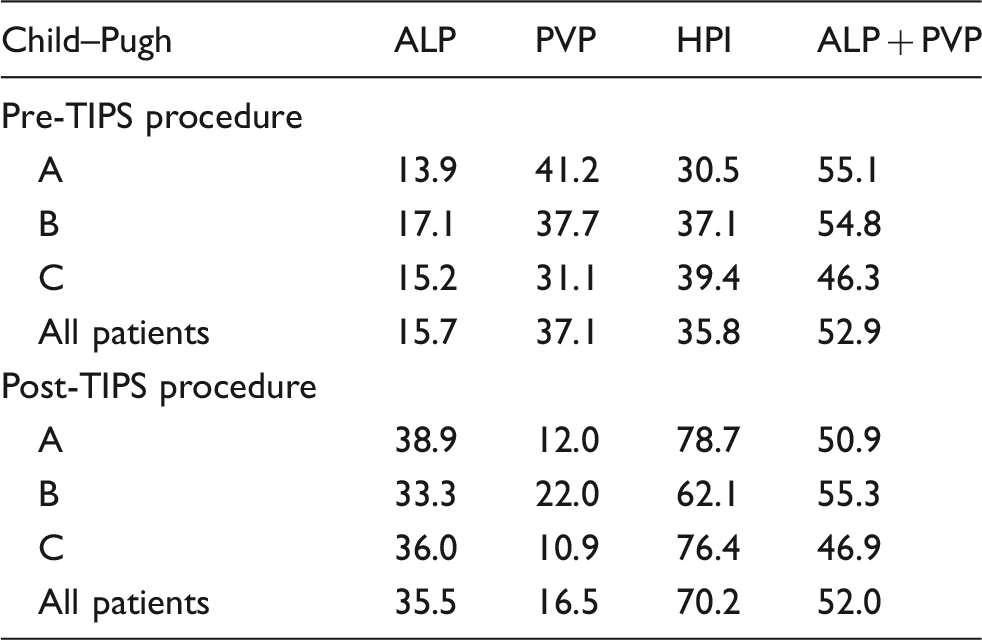
Portal flow was prograde in all patients before TIPS implantation, with a range of 15–40 cm/s (mean, 21.0 cm/s). Examples of VPCT measurements pre- and post-TIPS in patients with class A and class B liver cirrhosis are depicted in Figs. 1 and 2. Fig. 3 shows the changes of liver perfusion due to TIPS implantation measured by VPCT. ALP and HPI increased (15.9 versus 37.7 mL/100 mL/min and 35.4 versus 71.9%, respectively, P < 0.05), PVP decreased (37.7 versus 15.7 mL/100 mL/min, P < 0.05), and whole liver perfusion (ALP + PVP) remained stable (53.5 versus 53.4 mL/100 mL/min, P = 0.97). Patients in different stages of liver cirrhosis did not differ significantly from each other regarding the VPCT parameters (P > 0.05) (Table 2). Patients with stage A cirrhosis had a higher increase in arterial liver perfusion after TIPS (+198.4% versus +114.6%), higher decrease in PV perfusion (–64.8% versus –38.6%) and a higher increase of HPI (+167.0% versus +88.0%) compared to stage B patients, without reaching statistical significance.
VPCT perfusion parameters pre- and post-TIPS (in mL/ 100 mL/min) regarding ALP, PVP, and ALP + PVP and in % regarding HPI. VPCT parameters according to Child & Pugh liver cirrhosis stage pre- and post-TIPS procedure. ALP and PVP measured values are expressed as mL/100 mL/min; HPI is expressed as %. ALP, arterial liver perfusion; HPI, hepatic perfusion index; PVP, portal venous perfusion.
The two patients suffering from PH in association with a non-cirrhotic disease did not differ significantly from the other 21 patients with liver cirrhosis (P > 0.05).
Laboratory and clinical data
Liver function tests pre- and post-TIPS.

Statistically significant change (P < 0.05).
ALT, alanine aminotransaminase; AP, alkaline phosphatase; AST, aspartate transaminase; GGT, gamma glutamyl transpeptidase; PT, prothrombin time.
Discussion
In this prospective study, we could show that VPCT can reliably objectify the changes in the dual liver perfusion induced by TIPS placement. Our results show that following TIPS implantation, ALP increased, PVP decreased, whereas total liver perfusion remained constant. Expectedly, HPI increased from 35.4% to 71.9%. At this point, our results are consistent with those previously reported in the literature (8–10). Differences in liver perfusion dependent on the Child–Pugh stage showed that patients with stage A cirrhosis had a higher increase in ALP after TIPS (+186.9% versus + 114.6%), a higher decrease in PVP (–54.9% versus –38.6%) and a higher increase of HPI (+154.1% versus +88.0%) compared to stage B patients. Considering the fact that the measured perfusion values did not significantly differ throughout the different cirrhosis stages in our cohort, these results could represent a more intact hepatic arterial buffer response in lower liver cirrhosis stages (11). Knowingly, between two-thirds and three-quarters of the liver perfusion are usually provided through the portal vein, whereas the rest is supplied by the hepatic artery. After TIPS placement, this relation changes in favor of the arterial perfusion, which is methodically inherent as PV blood is thus shunted away from the liver. The mechanism responsible for the compensation of decreased portal blood flow by increased hepatic arterial flow has been elucidated in previous pathophysiological studies and is known as the hepatic arterial buffer response (11,12). Accordingly, the hepatic arterial blood flow changes so as to buffer the impact of portal flow alterations on the total hepatic blood flow, hence tending to regulate the total hepatic flow at a constant level (12). The hepatic arterial buffer response was first demonstrated in animal studies using complicated invasive animal tests (1). Later, non-invasive CT-dynamic studies showed an immediate decrease in the hepatic portal perfusion (8) or significant increase of hepatic arterial flow after TIPS (13). Interestingly, previous reports using CT-technology yielded partly divergent results which presumably reflect inadequate protocols due to technical limitations like table movement speed, z-axis coverage, temporal resolution, inadequate display of the aorta, the portal vein and the hepatic artery or equivalent arterial vessels. Hence, some authors using single slice perfusion CT stated that TIPS placement caused an increase in arterial perfusion whereas PV perfusion and total hepatic perfusion decreased (14). The reason for this discrepancy resides presumably in the lower (2–7 s) temporal resolution, which affects accurate assessment of the peak enhancement during the first pass.
Up to now, imaging of such complex physiological and pathophysiological phenomena was not possible, at least in terms of flow quantification. However, with the emerging new technique of VPCT empowered by dedicated perfusion quantification software, the dual hepatic blood supply can now be accurately assessed in the whole liver (15,16).
In this study, we set out to look for changes in the interaction of the two blood suppliers of the liver caused by TIPS placement. For this purpose, we correlated results of indirect measurements of blood flow in the liver (PVP and ALP) with those of the directly measured intravasal pressure values HPP and FHVP and the resulting pressure gradients (HVPG). In particular, the mean HVPG was found to decrease from 21.8 ± 6 to 8.5 ± 3 mmHg after TIPS, representing a great amount of PV blood being shunted away from the liver. This could be demonstrated indirectly by VPCT showing that PVP decreased significantly after TIPS. Hence, VPCT delivers reliable information about the balance between portal vein and hepatic artery for hepatic blood supply. The clinical relevance of indirect measurements of blood flow changes in the liver results from its non-invasive character and potentially repeated application. VPCT, thus, indirectly delivers precious information about alterations in the hepatic blood supply either due to severe liver parenchyma disorders or TIPS failure. As in higher stages of liver cirrhosis a change of the portal flow direction can occur, which would have had an impact on the measurement parameters, we considered also the flow direction in every patient, which proved prograde in all cases (17).
TIPS-induced changes of hemodynamics harbor the risk of distinct complications. Among them, hepatic encephalopathy is frequent in the post-TIPS setting (18,19). In our study cohort, 17% (4/23) of the patients developed one or more transient episodes of hepatic encephalopathy after TIPS placement. This is consistent with the literature, where an incidence of up to 42% has been reported (20), which substantially depends on the definition and stringent usage of exclusion criteria used to exclude diminution of the liver function post-TIPS (21). Diminution of liver function after TIPS placement may attain different degrees of clinical significance. In our study, liver function tests exhibited a significant impairment and elevation of serum bilirubin values. Similarly to a previous report by Tsushima et al., prothrombin time was not affected by TIPS placement in our study (22). According to earlier reports an acute elevation of hepatobiliary enzymes post-TIPS is frequent, but usually transient (20,23). The same authors pointed out that exaggerated laboratory elevation or a prolonged increase over one week may herald a poorer clinical outcome. However, contradictory observations on this issue have been reported up to now (24,25). Interestingly and contrary to earlier reports claiming ischemia as the cause for the temporary deterioration of liver function, our data show that the total amount of hepatic blood supply remains stable in the post-TIPS phase (20). So, the responsible mechanism for this phenomenon has to be regarded as still unclear. The potential role of direct mechanical insult to the liver parenchyma during TIPS placement has also been addressed (20). However, in our series there were no signs of parenchymal damage in the immediate post-TIPS setting. The fact that bilirubinemia was found in most of the patients in our series makes other rare TIPS-related complications like bilhemia (26) as potential reasons for bilirubin elevation less likely.
There are some limitations of our study. First, time spans between VPCT measurement and TIPS implantation and between TIPS implantation and VPCT measurement were not the same in all patients and therefore especially VPCT measurements after TIPS might reflect different phases of this adaptive process in the liver. Second, the time interval between TIPS placement and subsequent liver function tests varied also, which might influence conclusions about the time point of liver function deterioration.
In conclusion, we could show that VPCT can quantify changes in liver perfusion induced by TIPS placement. The TIPS procedure induces an increase in arterial perfusion and a decrease in portal perfusion whereas the total liver perfusion remains unchanged, coupled by a transitory increase in liver enzymes. However, VPCT parameters do not correlate with the invasively measured pressures.
Footnotes
Declaration of Conflicting Interests
The author(s) declared no potential conflicts of interest with respect to the research, authorship, and/or publication of this article.
Funding
The author(s) received no financial support for the research, authorship, and/or publication of this article.