





Abstract
Background
Despite the advantages of ultrasound (US) in the management of rheumatoid arthritis (RA) patients, power Doppler (PD) US may be highly dependent on the type of US machine used.
Purpose
To present a method to calibrate the PD signal of two models of US machines by use of a flow phantom and finger joints of patients with RA.
Material and Methods
For the phantom study, the PD signal count was measured in the flow phantom perfusing blood mimicking fluid at various injection rates and pulse repetition frequencies (PRFs). The quantitative PD index was calculated with ImageJ. For the clinical study, the second and third metacarpophalangeal joints of five consecutive patients with RA were examined. The quantitative PD index was measured at various PRFs by use of two models of machine (the same models as the phantom study).
Results
For the phantom and clinical studies, negative correlations were found between the PRF and the quantitative PD index when the flow velocity was constant and positive correlations between flow velocity and the quantitative PD index at constant PRF. There was a significant difference in the depiction performance of synovial blood flow between the two models, which can be calibrated by adjusting the PRF values derived from the phantom study in each model.
Conclusion
Signal calibration of pannus vascularity between US machines may be possible by adjusting the PRF value according to flow phantom data. Different US machines can thus provide equivalent examination results concerning the pannus vascularity.
Introduction
Ultrasound (US) can depict soft tissue hyperemia in musculoskeletal inflammatory disease (1) and allows a sensitive detection of synovitis (2). Disease activity and treatment response may be estimated by power Doppler (PD) US in rheumatoid arthritis (RA) patients (3). Despite the advantages of US in the management of RA patients, PDUS may be highly dependent on the type of US machine used (4), as there are significant machine-to-machine disagreements for signal quantification (5,6).
The sensitivity of PD is affected by factors and parameters such as machine specification, deterioration of the transducer, transmit frequency, Doppler gain, pulse repetition frequency (PRF), and wall filter adjustments. All of these factors and parameters are soures of disagreement for PD sensitivity; however, they may conversely be potential candidates for calibration of PD signal quantification between different US systems.
We previously demonstrated that the signal calibration of various models of US machines is possible by adjustment of the PRF setting utilizing the relationship between PRF and quantitative PD (7,8). However, a limitation of previous studies (7,8) is the use of normal saline and microbubbles as the perfusion solution. Conclusions drawn from microbubbles have to be handled very carefully due to the influence of bubble cavitation. To solve this problem, it is necessary to use a flow phantom for PD quantification using blood mimicking fluid (6,9) which is not affected by bubble cavitation.
In this study, we hypothesize that we can calibrate the PD signal in the finger joints of two US models using a flow phantom with blood mimicking fluid, so that the two models can provide equivalent examination results concerning pannus vascularity. The relationship between the PRF, the quantitative PD index, and the flow velocity on each machine was first analyzed using a phantom. A similar method was then applied and validated in the clinical situation.
Material and Methods
Phantom study
The positive PD signal count was measured at various injection rates (flow velocity) and PRFs. A flow phantom (Hemodialyzer FLX-18 GW, Nikkiso Co., Ltd., Tokyo, Japan) in a tub filled with water was connected to an angiography injector PRESS PRO (Nemoto Kyorindo, Tokyo, Japan), and blood mimicking fluid (6,9) was injected with similar settings in previous studies.
Two US machine models were used: Avius (HITACHI Aloka, Tokyo, Japan); and LOGIQ E9 (GE Healthcare, Piscataway, NJ, USA.). For Avius, using a linear probe 6–14 MHz, PRFs (500, 650, 800, 1000, and 1300 Hz) at preset were adjusted: FINGER; depth, 1.75 cm; color focus, 1 cm; Doppler gain, 40; color flow mapping filter, M; transmit power, 1.0; frame rate, 8–10. During quantitative PD measurements, the probe was located parallel to the flow direction in the phantom. For maximum flow velocity measurement, the probe was placed at 50° to the flow direction. For LOGIQ E9, using a linear probe, ML6-15, PRFs (600, 800, 1000, 1200, and 1500 Hz) at preset were adjusted: MSK superficial; depth, 2.75 cm; color focus, 1.5 cm; Doppler gain, 15; transmit power, 0.4; frame rate, 10. For both models, the level of wall filter was automatically determined according to PRF settings by linked controls. The transmit frequencies were 7.5 MHz for Avius and 15 MHz for LOGIQ.
The PRF setting as described above was selected because PRFs beyond these are not used in clinical situations. Here, the usage of “PRF” is not universally defined, but only a parameter value defined by the manufacturer.
The injection rate of the angiography injector was set to 1.2, 1.5, 1.8, 2.1, and 2.4 mL/s because we were interested in the flow depiction of the US machine at low injection rates or slow flow. The flow velocity was measured in the perfusion cartridge at various injection rates (1.2–2.4 mL/s) at a constant PRF of 1000 Hz by using the Doppler spectral analysis of the Avius.
The capillary flow phantom was modified as proposed by Veltmann et al. (10). The flow phantom contained 10,000 tubes with an inside diameter of 210 µ that were distributed equally over the whole cross-sectional area of the phantom (7,8). The blood mimicking fluid entered the capillaries at the entry chamber, streamed through, and left the capillaries from the exit chamber at the other end of the phantom. There were no confounding Doppler signals from bubbles in other phantom fluids or vessel-wall motion by perfusing the phantom with normal saline.
Doppler signals at flow rates of 1.2, 1.5, 1.8, 2.1, and 2.4 mL/s were examined for maximum flow velocity in the Avius, which was calculated automatically on a console by tracing the velocity line developed by spectral Doppler sonography. From movie data obtained in phantom experiments at various flow rates and PRF settings, a sonographer selected one still image for each experiment and measured the quantitative PD index (the summation of the colored pixels in a 0.5 cm × 1 cm rectangular region of interest [ROI]) using ImageJ (https://imagej.nih.gov/ij/). Still images were selected when the flow signal was stable and free of artifacts. Each measurement was performed three times, and the mean value for the quantitative PD index was calculated.
Clinical study
Baseline patient characteristics.
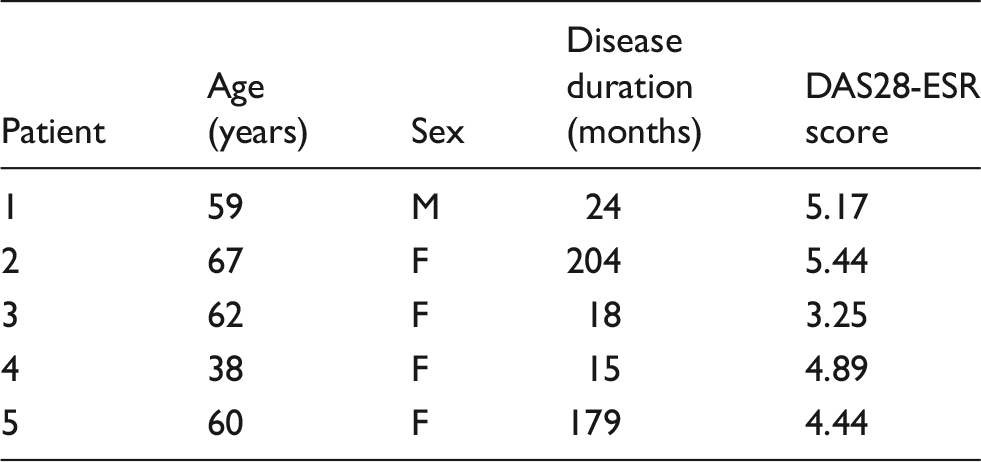
DAS28-ESR score, Disease Activity Score in 28 joints calculated with erythrocyte sedimentation rate.
Images were obtained following the Guidelines for musculoskeletal US in rheumatology (12) at a room temperature of 24℃. The positive PD signal count was measured at various PRFs with the same models and by the same radiological technologist as the phantom study. Two US machine models were used: Avius (HITACHI Aloka, Tokyo, Japan); and LOGIQ E9 (GE Healthcare, Piscataway, NJ, USA.). For Avius, using a linear probe 6–14 MHz, PRFs (500, 650, 800, 1000, and 1300 Hz) at preset were adjusted: FINGER; color flow mapping filter, M; transmit power, 1.0; frame rate, 8–10. For LOGIQ E9, using a linear probe, ML6-15, PRFs (600, 800, 1000, 1200, and 1500 Hz) at preset were adjusted: MSK superficial; transmit power, 0.4; frame rate, 10. For both machines, PDUS was performed by single view mode, the horizontal width of the ROI was set to full screen, and Doppler gain was kept stable at 38–40 for Avius and 20 for LOGIQ E9.
In the semi-quantitative grading assessment, still images with various PRF settings of the two US machine models were randomly assigned and then evaluated by one radiological technologist with more than 10 years of experience in joint US. Each evaluation was performed three times. The value by majority vote was applied out of the three semi-quantitative grading results for each image. For inter-observer repeatability assessment, one medical technologist with more than 10 years of experience in joint US graded the same images. A semi-quantitative grading system defined by Szkudlarek et al. (grade 0, no flow in the synovium; grade 1, single vessel signals; grade 2, confluent vessel signals in less than half of the area of the synovium; grade 3, vessel signals in more than half of the area of the synovium) was used (13).
The quantitative PD index (the summation of the colored pixels in the MCP joint in a manually defined ROI) of 50 still images was measured using ImageJ. Each measurement was performed three times and the mean value for the quantitative PD index was applied.
Statistical analysis
Statistical analyses were performed with the use of Microsoft Excel 2010 and PASW Statistics 22. Correlations between two variables were examined with the use of a parametric test (Pearson’s correlation test). The intra-observer US agreement was calculated using unweighted Cohen’s kappa. The kappa value measures agreement between pairs of observers, eliminating random concordance. A kappa value was translated as 0 representing less than chance agreement, 0.01–0.20 slight agreement, 0.21–0.40 fair agreement, 0.41–0.60 moderate agreement, 0.61–0.80 substantial agreement, and 0.80–0.99 almost perfect agreement.
Results
Phantom study
A positive correlation was found between injection rate and flow velocity when the PRF was constant with a correlation coefficient of 0.9969.
For Avius, negative correlations were found between the PRF and the quantitative PD index when the flow velocity was constant (correlation coefficient of −0.9549 ± 0.02258 [−0.9220 to −0.9852] for the mean ± SD [range], P < 0.05) (Fig. 1a), and positive correlations between flow velocity and the quantitative PD index at a constant PRF (correlation coefficient of 0.9544 ± 0.03851 [0.8880–0.9915] for mean ± SD [range], P < 0.05) (Fig. 1a).
(a) Avius (HITACHI Aloka) in the phantom study, the relationship between the PRF (Hz) and the QPD index (%) with variable flow velocity. (b) LOGIQ E9 (GE) in the phantom study, the relationship between the PRF (Hz) and the QPD index (%) with variable flow velocity. PRF, pulse repetition frequency; QPD index, quantitative power Doppler index.
For LOGIQ E9, negative correlations were found between the PRF and quantitative PD index (only at 2.1, 2.4 mL/s flow velocity) when the flow velocity was constant (correlation coefficient of −0.9123 ± 0.004259 [−0.9081 to −0.9166] for mean ± SD [range], P < 0.05) (Fig. 1b) and positive correlations between flow velocity and the quantitative PD index (except at 1500 Hz PRF) at a constant PRF (correlation coefficient of 0.9268 ± 0.01505 [0.9089–0.9503] for mean ± SD [range], P < 0.05) (Fig. 1b).
For both US machine models, negative correlations were found between the PRF and the quantitative PD index when the flow velocity was constant and positive correlations between the flow velocity and the quantitative PD index at a constant PRF.
Further, a conversion formula of the relationship of the PRF between Avius and LOGIQ E9 was created using an equation of the relationship between the PRF and the quantitative PD index of each machine (approximate expression) in 2.1, 2.4 mL/s flow velocity, where negative correlations were found between the PRF and the quantitative PD index: y = 0.3656 x + 983.7 (x = PRF of LOGIQ E9 [Hz], y = PRF of Avius [Hz]) (Fig. 2).
Relationship of the PRF between Avius (HITACHI Aloka) and LOGIQ E9 in the phantom and clinical study. PRF, pulse repetition frequency; MCP, metacarpophalangeal joint.
Clinical study
For the intra-observer US agreement, the unweighted kappa value showed a good correlation (kappa value = 0.78), while inter-observer US agreement represented a moderate correlation (kappa value = 0.418).
Grading score of Avius in clinical study.

Preset.
MCP, metacarpophalangeal joint.
Grading score of LOGIQ E9 in clinical study.

Preset.
MCP, metacarpophalangeal joint.
Fig. 3a and b shows the results of the quantitative assessment for joints with positive Doppler signals. For Avius, negative correlations were found between the PRF and the quantitative PD index at all MCP joints (correlation coefficient of −0.9777 ± 0.01810 [−0.9454 to −0.9969] for the mean ± SD [range], P < 0.05) (Fig. 3a). For LOGIQ E9, negative correlations were found between the PRF and the quantitative PD index at all MCP joints (correlation coefficient of −0.9788 ± 0.02023 [−0.9423 to −0.9951] for the mean ± SD [range], P < 0.05) (Fig. 3b). Although the quantitative PD index of LOGIQ E9 was lower than that of Avius, there was overlap between the PRF of Avius and LOGIQ E9. A relationship of PRF were also found between Avius and LOGIQ E9 (Fig. 2). This was generally in concordance with the results of the phantom study (Fig. 2). An example of difference in image appearance, grading score, and quantitative PD index due to variable PRF values for Avius (HITACHI Aloka) and LOGIQ E9 (GE) is displayed in Fig. 4.
(a) Avius (HITACHI Aloka) in the clinical study, the relationship between the PRF (Hz) and the QPD index (%). (b) LOGIQ E9 (GE) in the clinical study, the relationship between the PRF (Hz) and the QPD index (%). PRF, pulse repetition frequency; QPD index, quantitative power Doppler index; MCP, metacarpophalangeal joint. Difference in image appearance, grading score, and QPD index due to variable PRF values on Avius (HITACHI Aloka) and LOGIQ E9 (GE) in the second MCP joint of the right hand in a 67-year-old woman with RA.

For 15 MCP joints of four participants, no flow signal was detected at any PRF settings of the two US systems.
Discussion
The utility of US in rheumatic diseases is recognized worldwide and PDUS is becoming a powerful tool for clinicians dealing with patients with RA. However, the lack of standardization of machine settings prevents the production of reliable evidence produced via multicenter trials. This may be a fundamental issue in addition to the choice of grading system when considering the conduction of a clinical trial.
In this study, a method to calibrate the PD signal of two models of US machine was developed by use of a flow phantom with blood mimicking fluid. Furthermore, the difference in the depiction of performance between these machines in application to PD ultrasonography in RA patients was clarified.
For the phantom study, a relationship was demonstrated between signal counts from the two US machines by a simple equation, using the PRF as a variable. The sensitivity of the PD is affected by the PRF adjustments. Generally, when a high PRF is chosen, it is assumed that the investigator is interested in high velocities of the pannus vascularity, and therefore filters that remove low flow to eliminate noise are applied (so-called linked controls). Selecting a high PRF therefore makes the system insensitive to lower velocities because of the linked controls (14). However, the direct cause of the negative correlation between the PRF and the quantitative PD index cannot be determined because the linked controls are differently implemented for each US system.
For the clinical study, although there is a considerable difference in depiction performance of synovial blood flow between Avius and LOGIQ E9, a relationship of the PRF between Avius and LOGIQ E9 was found. This was generally in concordance with the results of the phantom study. For the PRF setting in this study, the results of the grading score changed as a result of PRF adjustment in one in five MCP joints for Avius, and two in five MCP joints for LOGIQ E9. Negative correlations were also found between the PRF and the quantitative PD index in quantitative assessment. For the turning point of the grade evaluation in the semi-quantitative assessment, there is a possibility that PRF adjustment affects the evaluation for pannus vascularity. This concern is highlighted when considering our modest inter-observer US agreement (kappa value = 0.418) compared with those of 0.6–0.8 in previous studies (13,15).
Furthermore, a different quantitative PD index was found by PRF setting adjustment in the quantitative assessment even though the grading score was the same. This poses an obstacle to conducting a multi-center investigation, for example, of the treatment effect of a newly developed therapeutic agent by the use of US. We suggest that a calibration tool be introduced between different US systems, followed by quantitative metrics rather than semi-quantitative grading for multi-center investigation.
There are a few limitations to this study. The fine and complex fractal structure of the vessel tree in vivo could not be simulated by our approach. However, the purpose of this study was to evaluate the possibility of the calibration of the flow signal, but was not confined to the signal purely from the flow of the capillary velocity. The combination of the parameter settings such as depth, focus, and gain were different between the systems in both phantom and clinical studies. The rationale in using different settings for different machines lies in the fact that the first priority of the various parameter settings is to maximize the detection ability of the flow signal.
In conclusion, signal calibration of pannus vascularity between US machines may be possible by adjusting the PRF value according to the flow phantom data. The different US machines can thus provide equivalent examination results concerning the pannus vascularity.
Footnotes
Acknowledgments
The authors thank Dr. Marcin Szkudlarek and Dr. Juhani M. Koski for their kind and helpful advice. This study was accomplished with a contribution from Nikkiso Co., Ltd., who provided the perfusion cartridge, and from Nemoto Kyorindo Co., Ltd., who prepared the angiography injector in this study.
Declaration of Conflicting Interests
The author(s) declared no potential conflicts of interest with respect to the research, authorship, and/or publication of this article.
Funding
The author(s) disclosed receipt of the following financial support for the research, authorship, and/or publication of this article: This study was supported by a research grant from the Ministry of Education, Culture, Sports, Science, and Technology, Japan (24591437).