
Abstract
Background
Dynamic contrast-enhanced magnetic resonance imaging (DCE-MRI) has been used for assessing orbital lymphoproliferative disorders (OLPDs). However, only the mean values of quantitative parameters were obtained in previous studies and tumor heterogeneity was ignored.
Purpose
To assess the value of DCE-MRI derived histogram parameters in differentiating malignant from benign OLPDs.
Material and Methods
Forty-eight OLPDs patients (25 malignant and 23 benign) who had undergone DCE-MRI for pre-treatment evaluation were retrospectively included. Histogram parameters of Ktrans, kep, and ve were calculated and compared between two groups using the independent sample’s t-test. Receiver operating characteristic (ROC) curve analyses were used to determine the diagnostic value of each significant parameter. Multivariate stepwise logistic regression analysis was used to identify the independent predictors of malignant OLPDs.
Results
Tenth kep, mean kep, median kep, and 90th kep were significantly higher in the malignant OLPD group than in the benign OLPD group. Tenth ve was significantly lower in the malignant OLPD group than in the benign OLPD group. Ninetieth kep was the only independent predictor of malignant OLPDs (P = 0.019), with an area under ROC curve of 0.828, a sensitivity of 92.00%, and a specificity of 78.26% at a cut-off value of 1.057 min−1.
Conclusion
Histogram analysis of DCE-MRI derived parameters may help to differentiate malignant from benign OLPDs. The 90th kep hold the potential as an independent predictor for malignant OLPDs.
Introduction
Orbital lymphoproliferative disorders (OLPDs) represent a broad spectrum of benign and malignant diseases, including lymphoid hyperplasia, atypical lymphoid hyperplasia, ocular adnexal lymphoma, idiopathic inflammatory pseudotumor, and IgG4-related ophthalmic disease (1). Low-dose radiation therapy is considered the first-line treatment for orbital lymphoma, while benign OLPDs require corticosteroid therapy (2,3). Therefore, accurate prospective differentiation of benign and malignant OLPDs is highly clinically important. The value of the clinical information is limited because of the notable overlap between two entities.
Conventional magnetic resonance imaging (MRI) plays a very important role on the delineation of orbital tumors in clinical practice (4). Despite Haradome et al. reporting that “flow void sign” was more associated with benign OLPDs, the imaging features on conventional MRI were usually non-specific for the differentiation (1). Besides that, dependence on the experience of the reader restricts the wide application of conventional MRI features. Therefore, quantitative MRI techniques which allow for less dependence on the expertise of the reader may offer greater predictive value in the differential diagnosis of OLPDs.
Recently, dynamic contrast-enhanced MRI (DCE-MRI) which provides non-invasive assessment of tumor perfusion and vascularity, has been widely applied in the field of orbital imaging (2–8). Previously, Hu et al. used DCE-MRI to differentiate malignant from benign OLPDs; they found that ve (volume fraction of the extracellular extravascular space) and kep (reflux rate constant from extracellular extravascular space to blood plasma) might be potential imaging biomarkers for differentiating malignant from benign OLPDs (6). However, only the mean value of the pharmacokinetic parameters was used as the differentiating metric, which would underestimate the heterogeneity of the tumors. Heterogeneity is an intrinsic characteristic of tumors, which makes tumor tissue different from normal tissue (9). Previous studies have indicated that assessment of tumor heterogeneity was very crucial for tumor diagnosis, prognosis prediction, and treatment monitor (9–11).
Histogram analysis is a widely used tool for heterogeneity quantification, particularly for MRI features, which are not always well visualized with naked eye (11,12). Histogram analysis of DCE-MRI has been proven to be more effective in differentiating primary central nervous system lymphoma and atypical glioblastoma (GBM), predicting the progression of enhancing lesions in GBM patients after standard treatment and detecting local tumor recurrence after definitive treatment of head and neck squamous cell carcinoma (13–16). In the field of orbital imaging, histogram analysis of apparent diffusion coefficient (ADC) maps has been used to demonstrate the tumor heterogeneity and has been proven to be promising for improving the performance of diffusion-weighted imaging (DWI) for differentiating malignant from benign orbital tumor (17). However, to the best of our knowledge, no study has applied histogram analysis of DCE-MRI in the differentiation of benign and malignant OPLDs till now.
Therefore, the purpose of this study was to assess the performance of DCE-MRI in differentiating malignant from benign OPLDs by using histogram analysis approach.
Material and Methods
Study participants
This retrospective study was approved by our institutional review board and informed consent was waived. Between March 2013 and May 2017, a total of 71 consecutive OLPDs patients underwent orbital MRI examination for pre-treatment evaluation in our hospital. Twenty-three patients were excluded for the following reasons: (i) DCE-MRI was not scanned (n = 15); (ii) the image quality was not adequate for further analysis (n = 1); (iii) the diameter of the lesion was < 1 cm (n = 2); (iv) secondary lymphoma (n = 2); (v) the patient had a prior history of corticosteroid or radiation therapy before MRI scan (n = 3). Finally, 48 consecutive patients (32 men, 16 women; mean age = 56.4 ± 15.9 years) were included in our study.
Clinical characteristics of the patients.
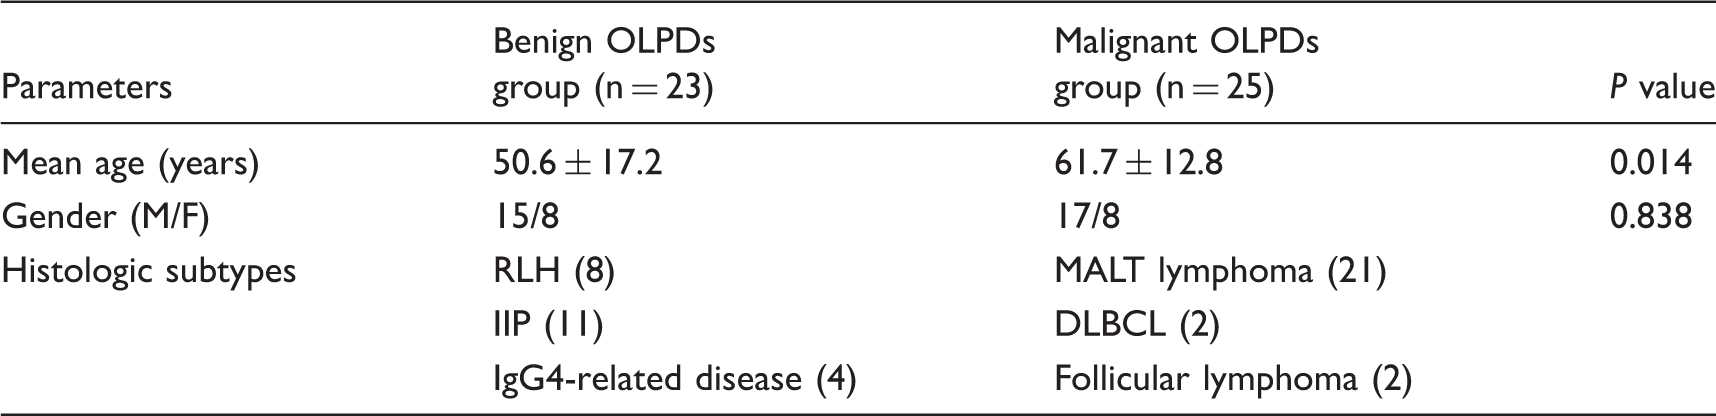
Data in parentheses indicates the number of the corresponding patients in our study.
OLPD, orbital lymphoproliferative disorder; M, male; F, female; MALT, mucosa-associated lymphoid tissue; DLBCL, diffuse large B-cell lymphoma; IIP, idiopathic inflammatory pseudotumor; RLH, reactive lymphoid hyperplasia.
MRI protocol
All patients were examined using a 3.0-T MRI system (Verio; Siemens, Germany) with a 12-channel head coil. Conventional MR sequences included unenhanced axial T1-weighted (T1W) imaging (TR/TE = 600/10 ms, slice thickness = 3 mm, matrix = 384 × 292, field of view [FOV] = 19 × 19 cm), axial T2-weighted (T2W) imaging (TR/TE = 4700/79 ms, slice thickness = 3 mm, matrix =384 × 292, FOV = 19 × 19 cm) with fat saturation, and coronal T2W imaging (TR/TE = 3500/79 ms, slice thickness = 3.5 mm, matrix = 384 × 307, FOV = 20 × 20 cm) with fat saturation.
DCE-MRI was performed using a two-dimensional (2D) turbo fast low angle shot (FLASH) sequence with integrated parallel acquisition technique (iPAT) in the axial plane. Before the injection of contrast material, pre-contrast T1W sequences (flip angle [FA] = 5°) was completed, which allows conversion of the changes of MR signal intensity into those of the gadolinium concentration during passage of the contrast agent. Gadolinium-diethylene triamine pentaacetic acid (Magnevist; Bayer Schering Pharma AG, Berlin, Germany) was then intravenously bolus injected via a power injector at the rate of 4 mL/s and a dose of 0.1 mmol/kg, followed by a flush of 20 mL of normal saline. DCE-MRI consisted of five baseline sets and 90 contrast-enhanced sets of images (total = 95 dynamics) with a temporal resolution of 3.3 s, and completed over a period of 5 min 15 s. Other detailed imaging parameters for the DCE-MRI were as follows: TR/TE = 474.66/1.43 ms; FA = 12°, average = 1, FOV = 230 mm, matrix = 128 ×128, section thickness = 4.5 mm, number of sections = 7. Axial, coronal, and sagittal T1W images were collected after DCE-MRI.
Image data analysis
All DCE-MRI data were analyzed by using a dedicated image processing software (OmniKinetics; GE Healthcare) (6). Pharmacokinetic parameters (the volume transfer constant between the plasma and the extracellular extravascular space [EES], Ktrans; the volume fraction of the EES, ve; and the reflux rate constant from EES to blood plasma, kep) were calculated by using the extended Tofts model (18). In terms of the arterial input function (AIF), it was extracted by manually drawing a small circle region of interest (ROI) on the ipsilateral internal carotid artery that located proximal to the tumor.
Two radiologists (with six and four years of experience in head and neck radiology, respectively) independently drew the ROIs manually. They were blinded to the clinical information, pathological results and study design. ROIs were drawn on all the slices those encompassed as much as tumor area. With conventional T2W and contrast-enhanced T1W images used as reference, visual necrotic, hemorrhagic areas, and surrounding blood vessels were excluded. In case of bilateral lesions, the lesion with the larger diameter was selected for analysis.
After the ROIs were drawn on each slice of the tumor foci, they were summated to derive the voxel-by-voxel values for histogram analysis. The histograms were plotted with the parametric values on the x-axis. The relative frequency was plotted on the y-axis of the histograms as a percentage of the total tumor volume. Histogram parameters consisting of mean, median, 10th percentiles, 90th percentiles, skewness, and kurtosis of Ktrans, ve, and kep were calculated based on DCE–MRI parameter maps. The nth percentile point is the point at which n% of the voxel values that form the histogram were found to the left of the histogram (14). The average of the two measurement results of two readers was used for further statistical analysis.
Statistical analyses
Each parameter was assessed for normality using the Kolmogorov–Smirnov test. The distribution of patient gender between benign and malignant OLPDs groups was compared using the chi-square test. The patient age and DCE-MRI histogram parameters between the two groups were compared using the independent samples t-test. Receiver operating characteristic (ROC) curves were constructed to determine the diagnostic performance of each significant pharmacokinetic parameter for differentiating malignant from benign OLPDs at its optimum threshold. Then, clinical characteristics and quantitative parameters which were shown to have univariate association with malignant OLPDs were included into a multivariable stepwise logistic regression analysis to identify the independent predictors of malignant OLPDs.
Inter-observer agreement for pharmacokinetic parameters was assessed using the two-way intraclass correlation coefficient (ICC). ICCs were interpreted as follows: 0.00-0.20 = poor agreement; 0.21–0.40 = fair agreement; 0.41–0.60 = moderate agreement; 0.61–0.80 = strong agreement; and 0.81–1.00 = almost perfect agreement (3). All statistical analyses were performed by using the statistical software MedCalc (version 11.0, MedCalc, Mariakerke, Belgium). A two-sided P value < 0.05 was considered statistically significant.
Results
A significant difference was observed in patient age between two groups (P = 0.014), while no difference on the distribution of patient gender (P = 0.838) (Table 1).
Histogram parameters of the benign and malignant OLPD groups.
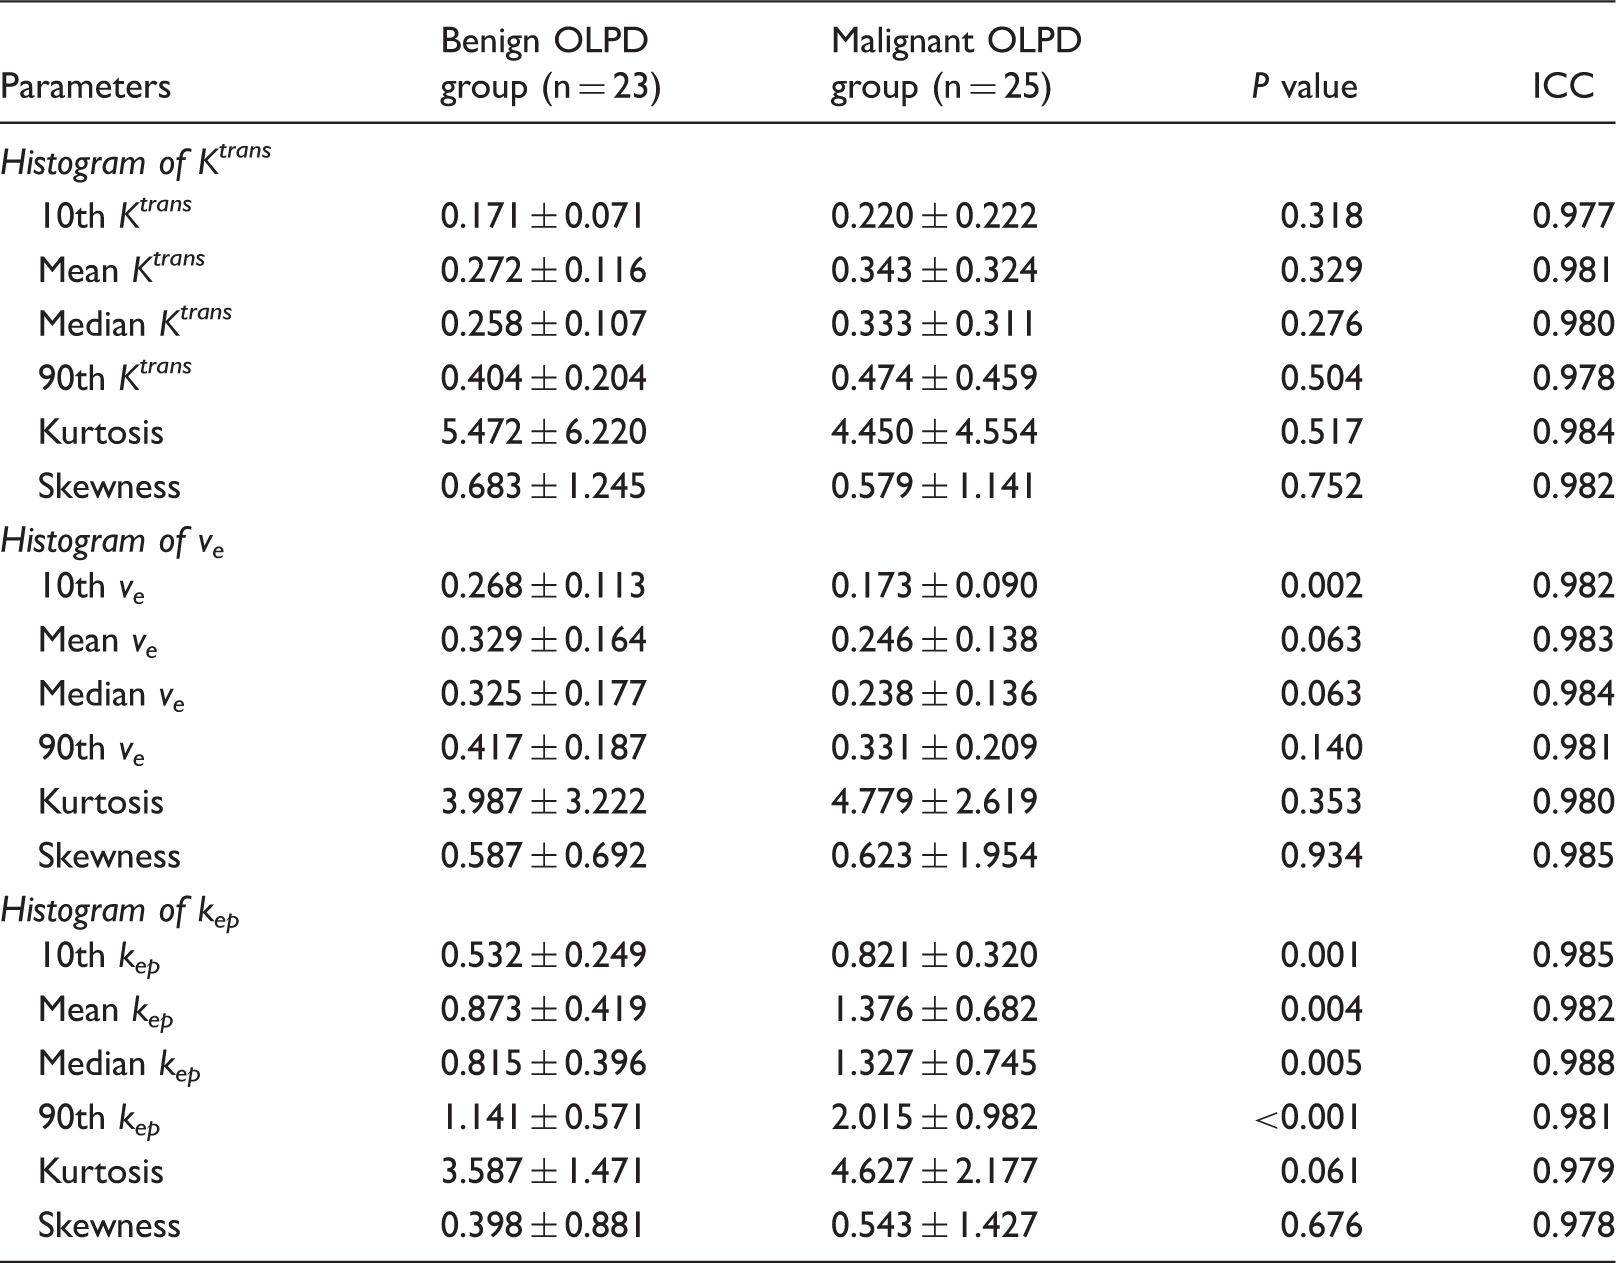
Except for P vales, data are reported as mean ± standard deviation. Unit for Ktrans and kep is × min−1.
OLPD, orbital lymphoproliferative disorder.
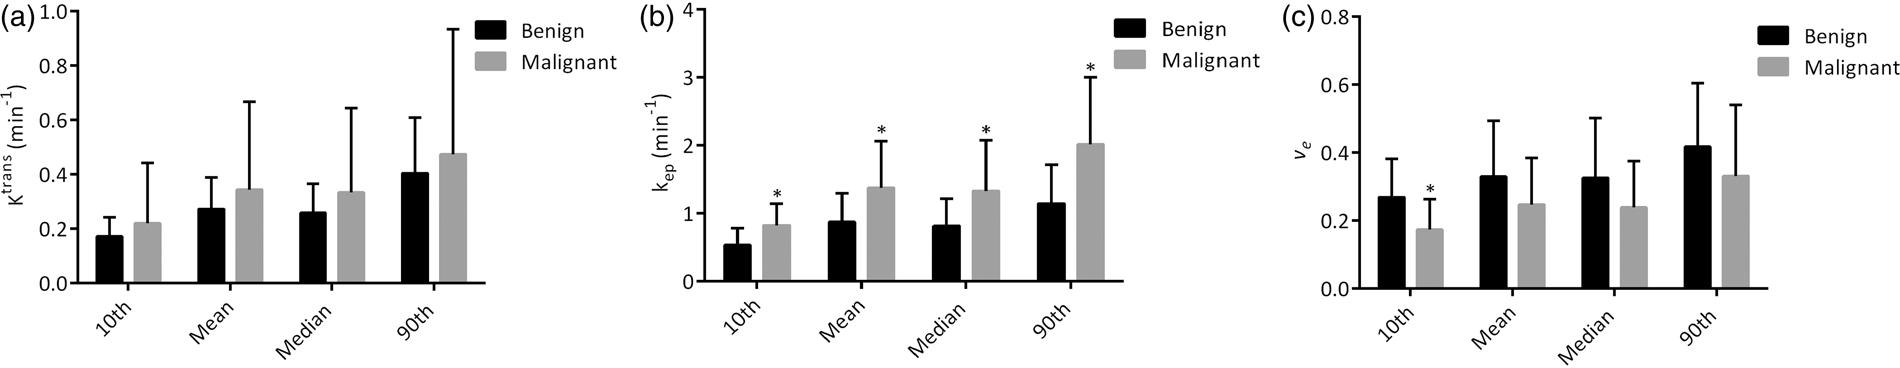
Boxplots for (a) Ktrans, (b) kep, and (c) ve histogram parameters between malignant and benign OLPDs groups. * indicates the difference between the two groups is significant.
ROC curve analyses of the significant histogram parameters for differentiating malignant from benign OLPDs.

Data in parentheses are 95% confidence intervals. Unit for Ktrans and kep is × min−1.
OLPD, orbital lymphoproliferative disorder.
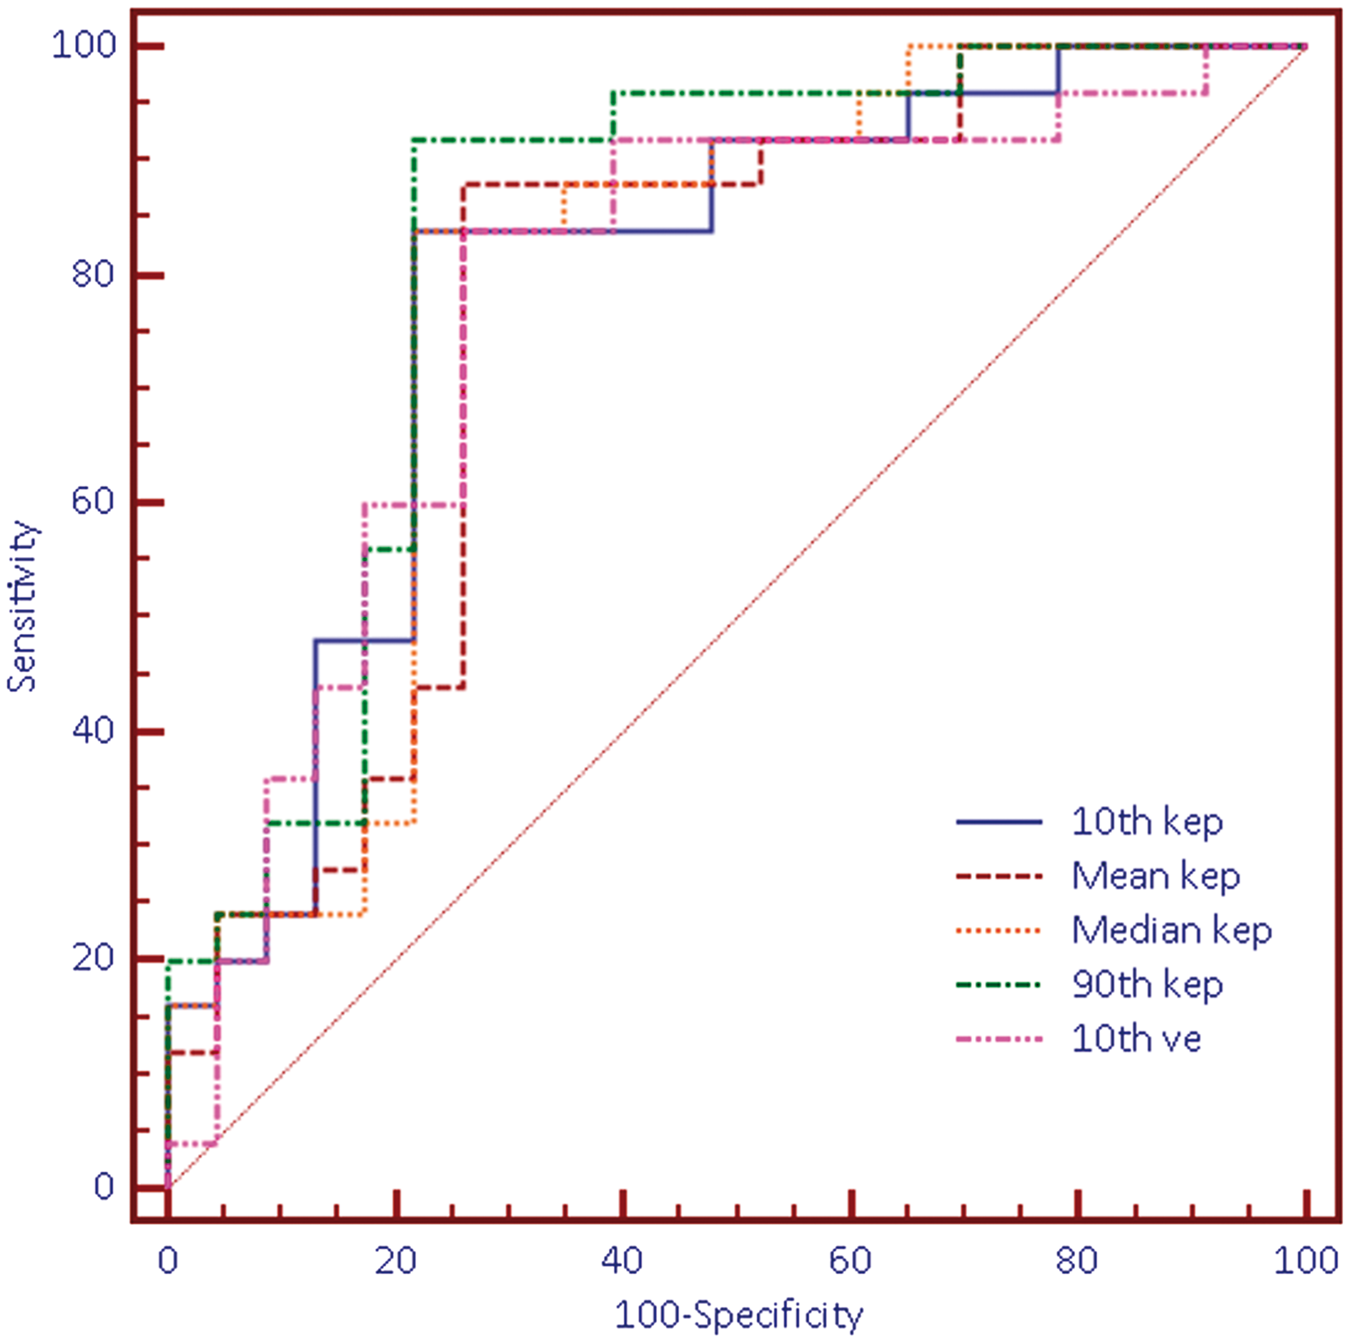
ROC curves of five significant histogram parameters for differentiating malignant from benign OLPDs.
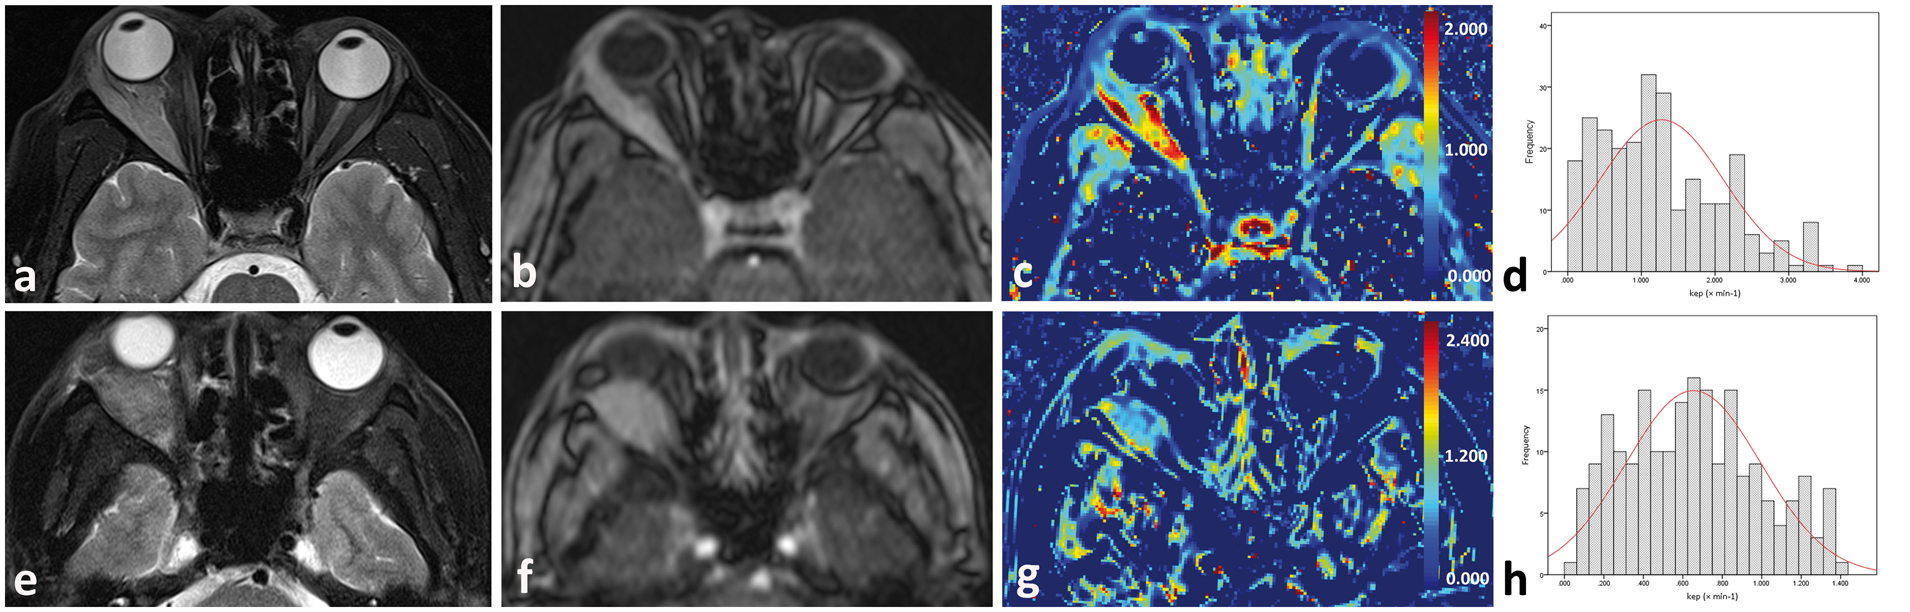
Representative MR images and histogram maps in patients with MALT lymphoma (a–d) and reactive lymphoid hyperplasia (e–h). Compared with the adjacent muscles, both masses showed relatively high signal intensity on T2W images (a, e) and markedly enhancement on contrast-enhanced T1W images (b, f). As the colored kep maps (third column) showed, lymphoma (c) demonstrated significantly higher kep values than reactive lymphoid hyperplasia (g). Meanwhile, histogram distribution of kep maps showed higher kep values and frequency in the patient with lymphoma (d) than that in the patient with reactive lymphoid hyperplasia (h).
Multivariable stepwise logistic regression analysis results for identifying the independent predictors of malignant OLPDs.
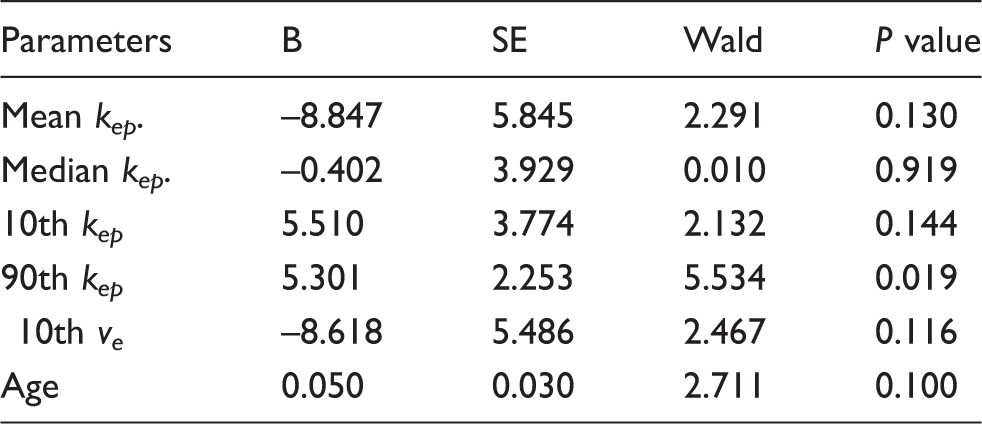
OLPD, orbital lymphoproliferative disorder; SE, standard error.
Discussion
In this study, we investigated the predicting value of DCE-MRI derived histogram parameters in differentiating malignant from benign OLPDs. Among various pharmacokinetic parameters, 10th kep, mean kep, median kep, and 90th kep were significantly higher in the malignant OLPDs group than in the benign OLPDs group, while 10th ve were significantly lower in the malignant OLPDs group. In the further analysis using multivariate stepwise logistic regression analysis, 90th kep was found to be the only independent differentiating variable for malignant OLPDs.
Ktrans is a pharmacokinetic parameter well-known for reflecting vascular perfusion and permeability (19). Previously, Ro et al. applied DCE-MRI for differentiating malignant from benign orbital tumors (7). They reported that Ktrans was significantly higher in malignant masses than in benign masses. For satisfying tumor growth, malignant tumors were usually associated with a higher proportion of immature and hyper-permeable vessels, and therefore they would show higher Ktrans than benign mimics (20). However, similar results were not seen in our study; we speculated that this conflicting result was because we only studied OLPDs. Previously, Haradome et al. reported that benign OLPDs were also characterized by high vascularization and its contrast enhancement ratio was even higher than that of lymphoma (1). Therefore, it was not surprising that the difference of Ktrans did not reach significant between malignant and benign OLPDs groups.
ve is a quantitative metric reflecting the volume of EES on DCE-MRI (21). Previously, Hu et al. reported that malignant OLPDs showed significantly lower ve than benign mimics (6). They explained that interstitial edema within benign OLPDs would broaden the extracellular space, while high cellularity within lymphoma would limit the extracellular space; therefore, ve would differ significantly between two groups. In our study, malignant OLPDs also showed relatively lower ve-related histogram parameters than benign mimics. However, only the difference of the 10th ve reached significance, while that of the 90th, mean, and median ve did not. ADC was commonly viewed as an imaging metric that inversely associated with tumor cellularity (22). However, previous two studies reported that ve was not related to ADC in GBM and breast cancer (23,24). Therefore, based on these findings, we thought that tumor cellularity was indeed a crucial factor affecting ve, otherwise ve would not demonstrate such-like change trend. However, cellularity might not be the sole factor affecting ve, future radio-pathological correlation study is needed to reveal the more accurate physiological meaning of ve.
kep is the reflux rate constant from EES to blood plasma (19). Previously, Ro et al reported that kep was significantly higher in malignant orbital masses (7). Similarly, Hu et al reported that malignant OLPDs showed higher kep than benign OLPDs, as seen in our study (6). Both Ktrans and kep were quantitative parameters associated with vascular permeability, why did kep differ between the two groups while Ktrans did not? In our opinion, it could be explained using prior findings. As we explained above, due to the high vascularization, both malignant and benign OLPDs showed high Ktran, and no difference was found. However, the EES of malignant OLPDs was smaller than that of benign OLPDs (6). Therefore, within the same examination time, the contrast in the malignant tumors would begin to wash out from the EES to the draining vein earlier than the benign mimics, thus kep would differ significantly between two groups.
Heterogeneity is an intrinsic characteristic of tumors; accurate assessment of tumor heterogeneity was of high clinical importance for tumor diagnosis, prognosis prediction, and treatment monitor (9–11). In our study, compared with mean kep, 90th kep showed better diagnostic efficiency and might be the independent differentiating variable for malignant OLPDs. Improved differentiating performance achieved by histogram analysis of DCE-MRI might lead to a more targeted diagnostic and therapeutic approach. Therefore, our results suggested that histogram analysis of DCE-MRI could effectively delineate the tumor heterogeneity and serve as a useful adjunctive diagnostic method for assessing OLPDs.
Our study had several limitations. First, it was a retrospective study with a relatively small number of patients. Further study with more patients is warranted to strength the statistical power and confirm our results. Second, ROIs placements were performed in a manual pattern, which was prone to measurement variability. A semi-automatic lesion segmentation can provide a reduction in variability and improvement in reproducibility (25). Third, the malignant group was dominated by the relative indolent MALT lymphoma. Future studies should enroll more lymphoma types and subgroup analysis among different lymphoma types would be more valuable. Fourth, DCE-MRI protocol and data analysis have not been generalized and standardized. Therefore, the specific cut-off value derived in our study could not be generally used in other study groups. Finally, some other advanced MRI techniques had also been proven to be useful for diagnosing orbital lesions, such as DWI (26,27). A multi-parametric model of advanced MRI techniques would be more promising for solving this clinical problem.
In conclusion, the present study demonstrated that histogram parameters derived from DCE-MRI, including 10th kep, mean kep, median kep, 90th kep, and 10th ve, may help to differentiate malignant from benign OLPDs. In particular, the 90th kep holds potential as a candidate imaging biomarker for differentiation in future prospective studies.
Footnotes
Declaration of Conflicting Interests
The author(s) declared no potential conflicts of interest with respect to the research, authorship, and/or publication of this article.
Funding
The author(s) disclosed receipt of the following financial support for the research, authorship, and/or publication of this article: This work was supported by Jiangsu Province’s Young Medical Talents Program (QNRC2016560 to Xu XQ).