
Abstract
Background
Texture analysis has been done on several radiological modalities to stage, differentiate, and predict prognosis in many oncologic tumors.
Purpose
To determine the diagnostic accuracy of discriminating glioblastoma (GBM) from single brain metastasis (MET) by assessing the heterogeneity of both the solid tumor and the peritumoral edema with magnetic resonance imaging (MRI) texture analysis (MRTA).
Material and Methods
Preoperative MRI examinations done on a 3-T scanner of 43 patients were included: 22 GBM and 21 MET. MRTA was performed on diffusion tensor imaging (DTI) in a representative region of interest (ROI). The MRTA was assessed using a commercially available research software program (TexRAD) which applies a filtration histogram technique for characterizing tumor and peritumoral heterogeneity. The filtration step selectively filters and extracts texture features at different anatomical scales varying from 2 mm (fine) to 6 mm (coarse). Heterogeneity quantification was obtained by the statistical parameter entropy. A threshold value to differentiate GBM from MET with sensitivity and specificity was calculated by receiver operating characteristic (ROC) analysis.
Results
Quantifying the heterogeneity of the solid part of the tumor showed no significant difference between GBM and MET. However, the heterogeneity of the GBMs peritumoral edema was significantly higher than the edema surrounding MET, differentiating them with a sensitivity of 80% and specificity of 90%.
Conclusion
Assessing the peritumoral heterogeneity can increase the radiological diagnostic accuracy when discriminating GBM and MET. This will facilitate the medical staging and optimize the planning for surgical resection of the tumor and postoperative management.
Keywords
Introduction
In adults, glioblastomas (GBMs) account for 40–50% of primary malignant brain tumors (1) and can present as multifocal or multicentric tumors (2). Brain metastases (MET) are more frequent than GBM and evolve in 9–17% of all cancer patients; of these, approximately 50% are single lesions (3). Some patients with unknown systemic cancer can present with a MET (4).
Distinguishing one tumor from the other is important for treatment planning, but this can at times be challenging using magnetic resonance imaging (MRI) (5,6). With a tentative diagnosis of GBM, preoperative 5-aminolevulonic acid (5-ALA) can be administered to facilitate surgical resection (7). Metastases < 3 cm in diameter can either be treated by stereotactic radiosurgery or surgical resection (8). The preferred surgical technique for MET is en bloc resection, in contrast to the piecemeal resection which can be done for GBM (9). Additionally, patients with a suspected MET need a full diagnostic work-up to identify the primary tumor and dissemination status.
The classical appearance of MET on conventional MRI include: excessive peritumoral edema; well circumscribed with contrast enhancement; and sometimes with hemorrhage. However, these features are very unspecific. One major distinguishing morphological feature between GBM and MET is the infiltration of neoplastic cells into the surrounding tissue of GBMs, which is difficult to assess using conventional MRI (10).
Diffusion tensor imaging (DTI) is an advanced sequence that assesses the movement of water molecules in several directions. From this the amount of destruction of nerve fibers, which can occur secondary to tumor infiltration, can be displayed in constructed maps such as fractional anisotropy (FA) and apparent diffusion coefficient (ADC) (11,12).
MRI texture analysis (MRTA) assesses the distribution of signal intensity at a pixel level within a lesion to quantify the heterogeneity (13). The destruction and distortion reflected on DTI could change the degree of texture heterogeneity within the peritumoral region especially in GBMs.
The purpose of this study was to explore the possibility of using MRTA on DTI metrics, in both the solid tumor component and the peritumoral edema to differentiating GBM and MET.
Material and Methods
The regional ethics committee was consulted and requirement for informed patient consent was waived as this is a single institution retrospective study on archived anonymized data on patients with GBM and MET.
The inclusion criteria included patients with a histological diagnosis of GBM and patients with single brain metastasis. All patients with visible hemorrhage (high signal on T1 images), multiple lesions, and infratentorial lesions were excluded. In total, 43 patients were included: 22 GBM patients with a mean age of 58 years (age range = 35–73 years) diagnosed between August 2011 and September 2012; and 21 MET patients with a mean age of 63 year (age range = 52–74 years) diagnosed between February 2009 and October 2013. The primary cancer organs were: lung (n = 5); breast (n = 5); skin (n = 4); renal (n = 3); gastrointestinal tract (n = 2); genitalia (n = 1); and in one patient the primary site was never identified. Due to some technical difficulties with image transfer, three of the FA patients’ images were unable to be analyzed. The diagnosis was determined by the 2007 histopathology classification of tumors of the central nervous system according to the World Health Organization (WHO) (10).
MRI
All patients were examined preoperatively with the same imaging acquisition protocol on a 3-T whole-body MRI system (Signal HDx, GE Healthcare, Milwaukee, WI, USA). The MRI protocol, performed in this order, consisted of a T1 inversion recovery (T1 IR) sequence with the following parameters: TR/TE/TI = 2500/9.6/920 ms; field of view (FOV) = 240 ×240 mm; matrix size = 384 × 224; slice thickness =5 mm; slice gap = 1.5 mm. The T2-weighted sequence was performed with: TR/TE = 6000/95 ms; FOV =240 × 240 mm; matrix size = 480 × 480; slice thickness = 5 mm; slice gap = 1 mm. The fluid-attenuated inversion-recovery (FLAIR) sequence was performed with: TR/TE/TI = 9500/120/2250 ms; FOV = 240 ×240 mm; matrix size = 384 × 224; slice thickness =5 mm; slice gap = 1.5 mm. DTI acquisition time was 3 min and performed in the axial plane by using a single-shot spin-echo echo-planar imaging sequence with the following parameters: TR/TE = 10000/82.1 ms; FOV = 240 × 240 mm; matrix size = 128 ×128 mm; slice thickness = 3 mm; slice gap = 0 mm; and a total of 37 slices. Diffusion gradient encoding was in 25 directions: b = 0 and 1000 s/mm2, parallel imaging (sensitivity encoding factor = 2) was used to reduce spatial distortion associated with the echo-planar imaging. The FA and ADC maps were constructed using the software, Functool 14.03.01, provided by the MRI manufacturer, GE Medical System.
After contrast medium gadopentate dimeglumine (Magnevist, Bayer Schering Pharma, Berlin, Germany), a three-dimensional (3D) isotropic spoiled gradient echo (SPGR) sequence was performed using the following parameters: TR/TE = 7.8/3 ms; FOV = 256 × 256 mm; matrix size = 256 × 256 mm; slice thickness = 1 mm. The total acquisition time is 41 min 45 s.
MRTA data evaluation
The axial Digital Imaging and Communications in Medicine (DICOM) images of the DTI sequence, FA, and ADC were retrieved from the preoperative brain tumor imaging study protocol and used for texture analysis. A commercially available texture analysis research software (TexRAD – www.texrad.com, part of Feedback Plc, Cambridge, UK) was used to analyze the images. Using the software, a manually drawn region of interest (ROI) was placed on the axial slice with the largest cross-section of solid tumor with guidance from the contrast-enhanced T1-weighted (T1W) sequence. Studies have shown that molecular and cellular alterations can be found anywhere within the peritumoral T2 signal intensity (14), but 90% of recurrences in GBM occur in the immediate zone surrounding the solid tumor component (15). Hence, in this study the peritumoral edema was defined as the hyperintense region on FLAIR images within 1 cm surrounding the enhancing tumor. FLAIR images and ADC maps were used as visual guidance when the ROI was manually drawn 1 cm around the tumor. The same ROI was used for both the ADC and FA maps on the same slice.
All ROIs were drawn in consensus by two neuroradiologists (KS AS) and cystic, necrotic, hemorrhagic regions and large vessels that might influence the texture parameters were avoided.
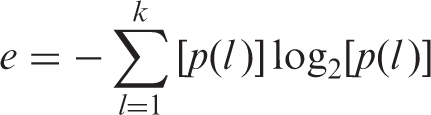
The software uses a filtration-histogram technique, where the initial filtration step employs a Laplacian of Gaussian (LoG) band-pass filtration. This extracts and highlights image features at different sizes corresponding to spatial scale filter (SSF) causing a blurring effect. The filters are in the range of 2–6 mm in width (radius) where SSF2 = fine, SSF3–5 = medium, and SSF6 =coarse texture features (Fig. 1). Histogram quantification was performed with and without filtration using a statistical parameter entropy (equation below), calculating the irregularity of the pixel intensity distribution.
Texture analysis illustration. Axial post-contrast T1W images of (A) MET and (B) GBM. 1, 2 ADC and FA maps of the peritumoral edema of the metastasis and of the GBM, respectively. SSF: (a) fine filtration, (b) medium filtration, and (c) coarse filtration.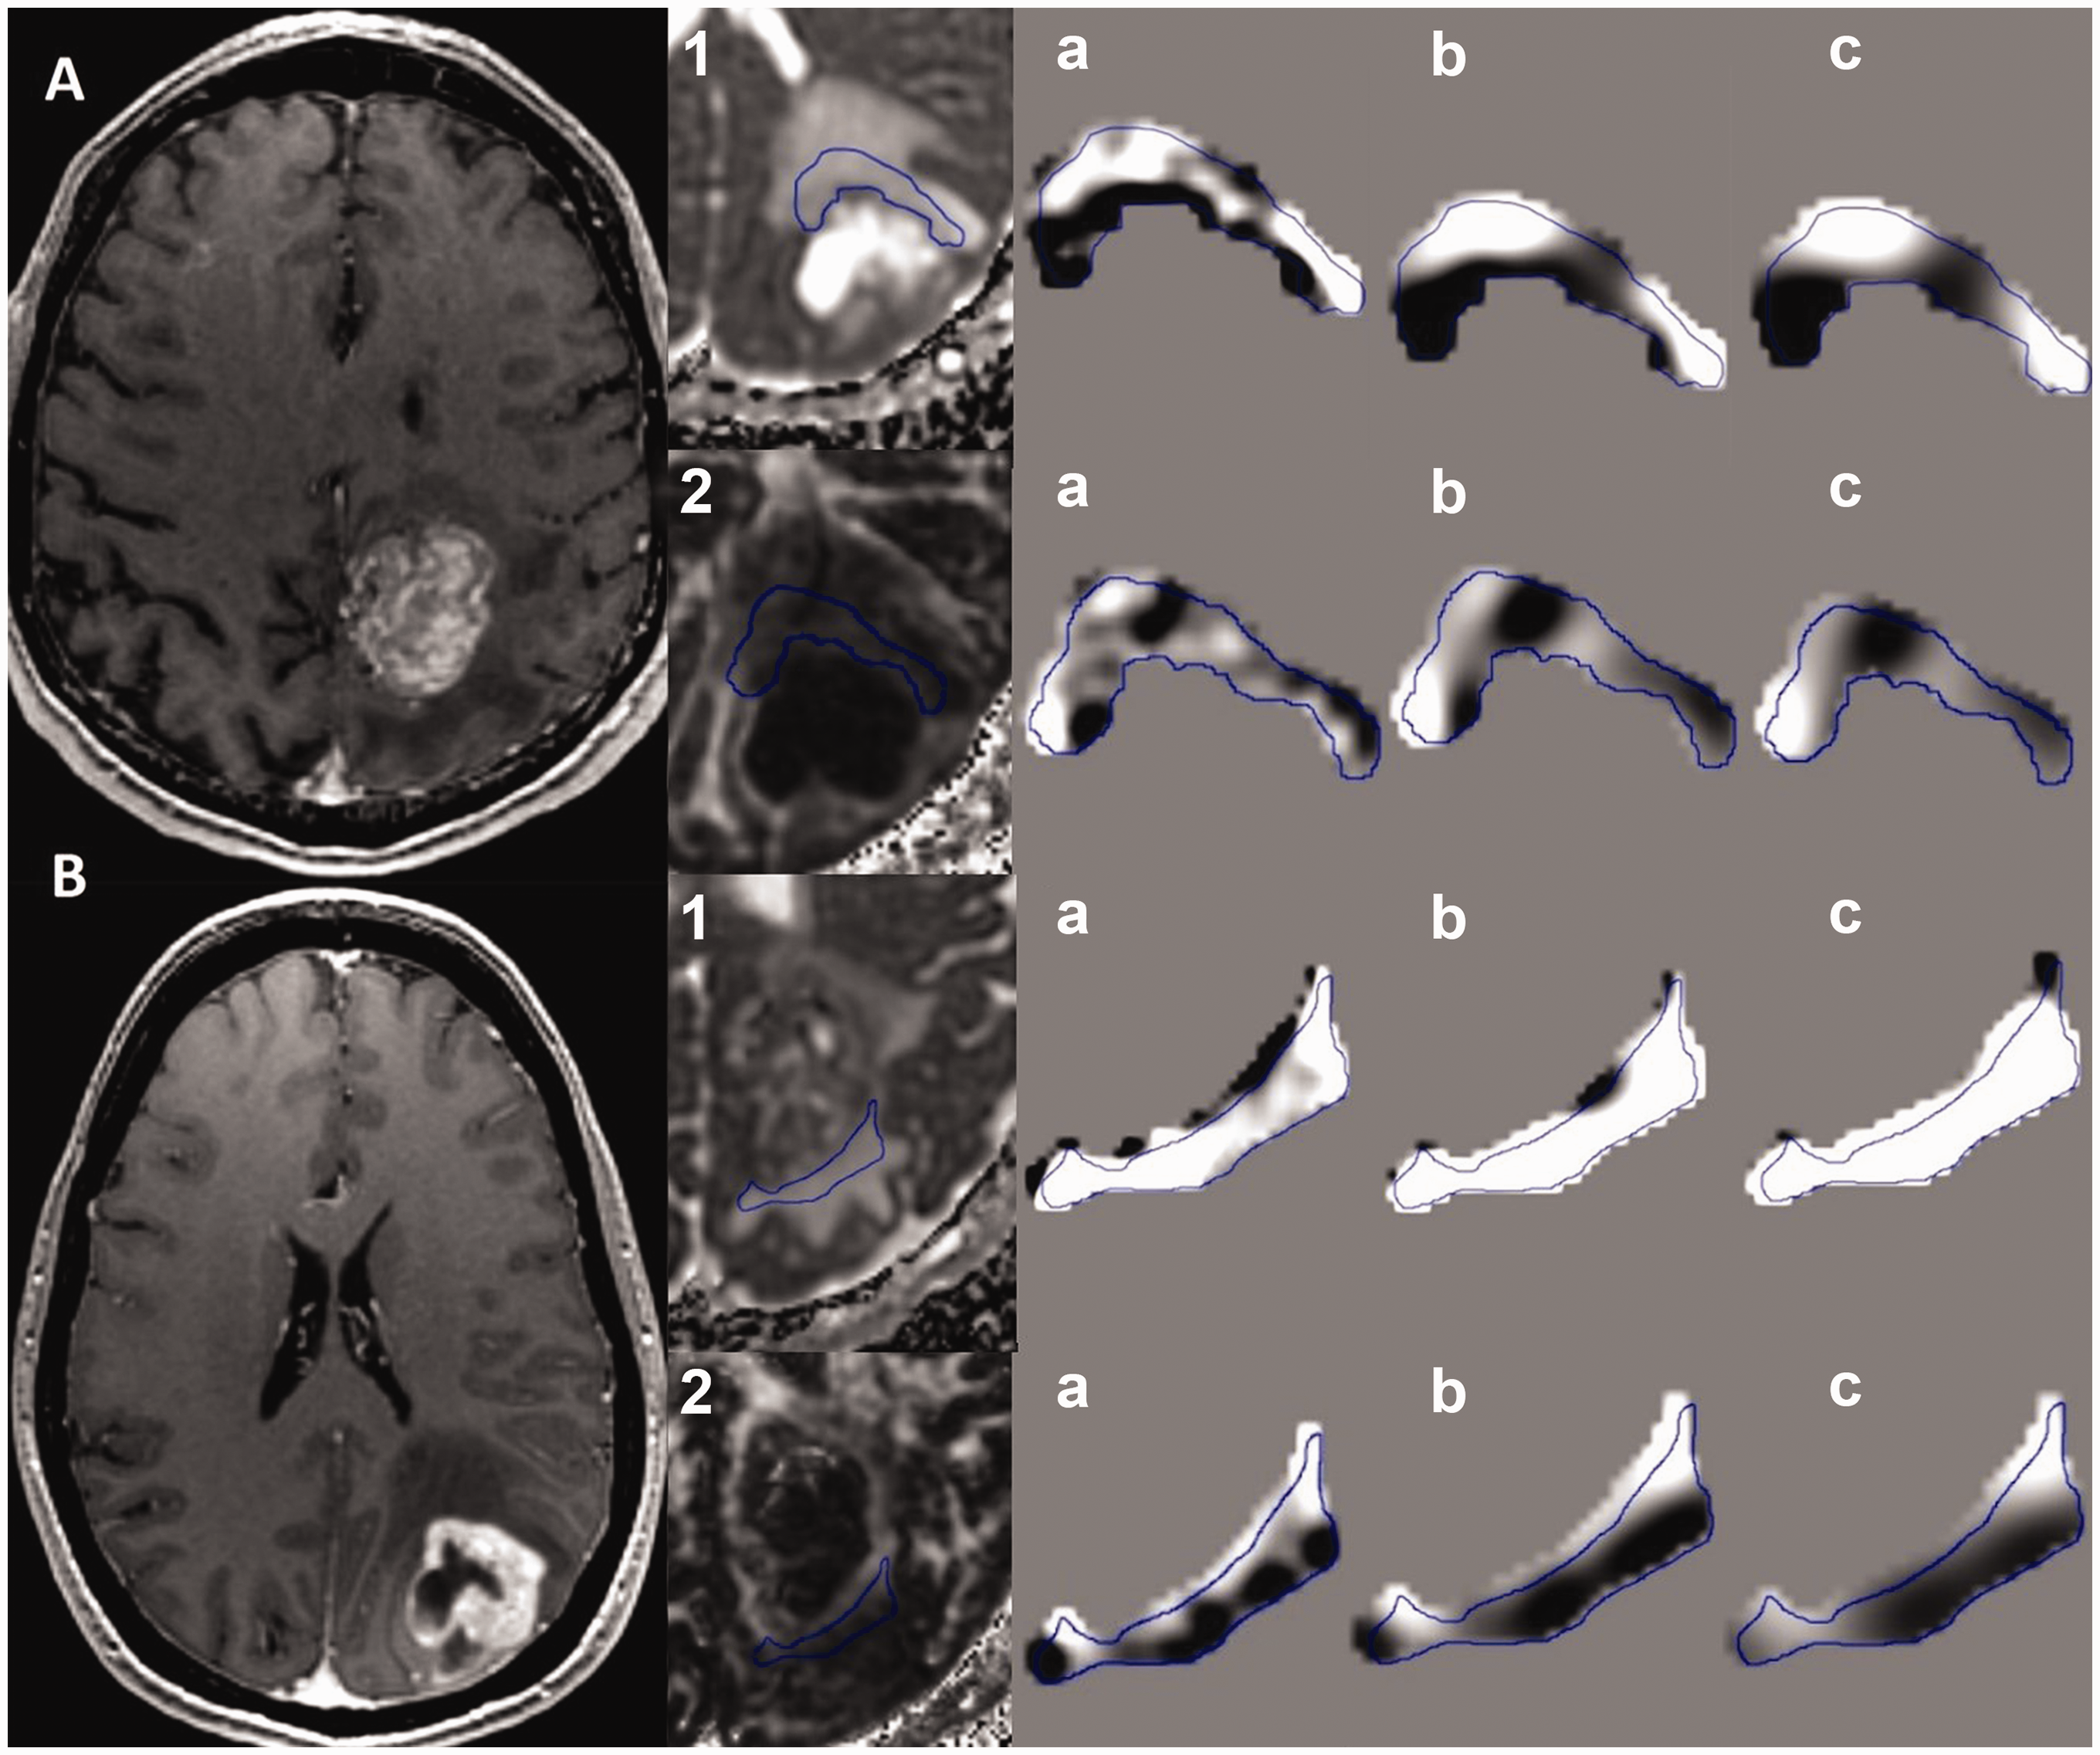
The structure of the brain changes throughout a lifetime and the axons are thought to reduce by up to 50% throughout life (16). This could influence the results of the peritumoral edema from patient to patient, as it also contains normal brain tissue. To try to correct for this, an additional step of normalizing the data was done. We divided the quantified textures parameters within the peritumoral edema with the quantified textures parameters within a ROI drawn in the contralateral normal appearing sentrum semiovale (peritumoral edema texture parameters ratios). The solid tumor texture values and the peritumoral edema textures values and ratios were analyzed. Last, combining the best parameter for FA and ADC maps was done in order to increase the diagnostic value.
Statistical analysis
Textural difference between GBM and MET was analyzed using the non-parametric Mann–Whitney test. Parameters with a significant difference on the test were assessed for diagnostic performance using receiver operating characteristic (ROC) analysis and for combined results an initial regression analysis was performed to obtain predictive values before ROC analysis. The ROC curve was further used to calculate the area under the curve (AUC). The optimal thresholds and their sensitivity and specificity with positive predictive value (PPV) and negative predictive value (NPV) were reported. Statistical significance was set to 5% and was performed on SPSS 22.0.0.1 (Chicago, IL, USA) and MedCalc (MedCalc software, Mariakierke, Belgium).
Results
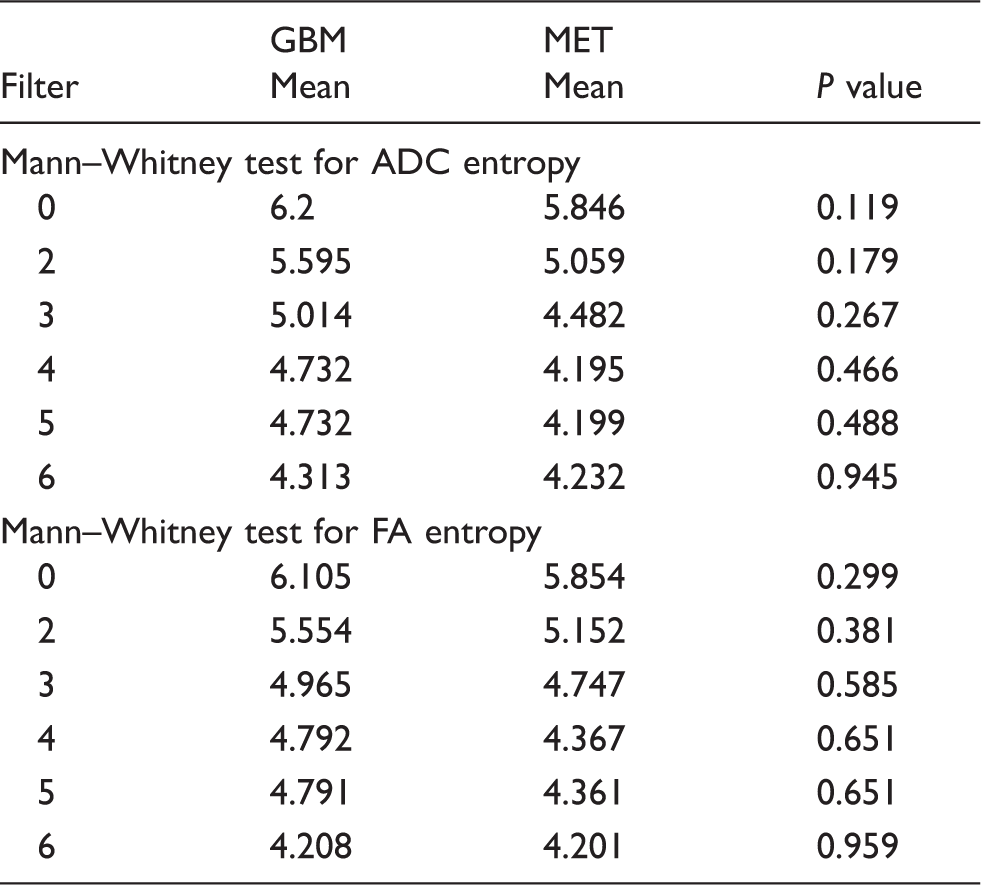
There is no significant difference between the heterogeneity of the solid component of the tumor in GBM and MET for any of the filters on the Mann–Whitney analysis, with an almost total overlap of values between the two tumors (Fig. 2 and Table 1).
Boxplots of (a) ADC entropy values and (b) FA entropy values in the intratumoral lesion in GBM and MET. The solid line in the box represents the median value, while the edges indicate the 75% confidence intervals. Circles represent outliers and asterisk represent extreme outliers. Mann–Whitney test for entropy on DTI metrics in the solid tumor in differentiation of GBM from MET. ADC, apparent diffusion coefficient; DTI, diffusion tensor imaging; FA, fractional anisotropy; GBM, glioblastoma; MET, metastasis.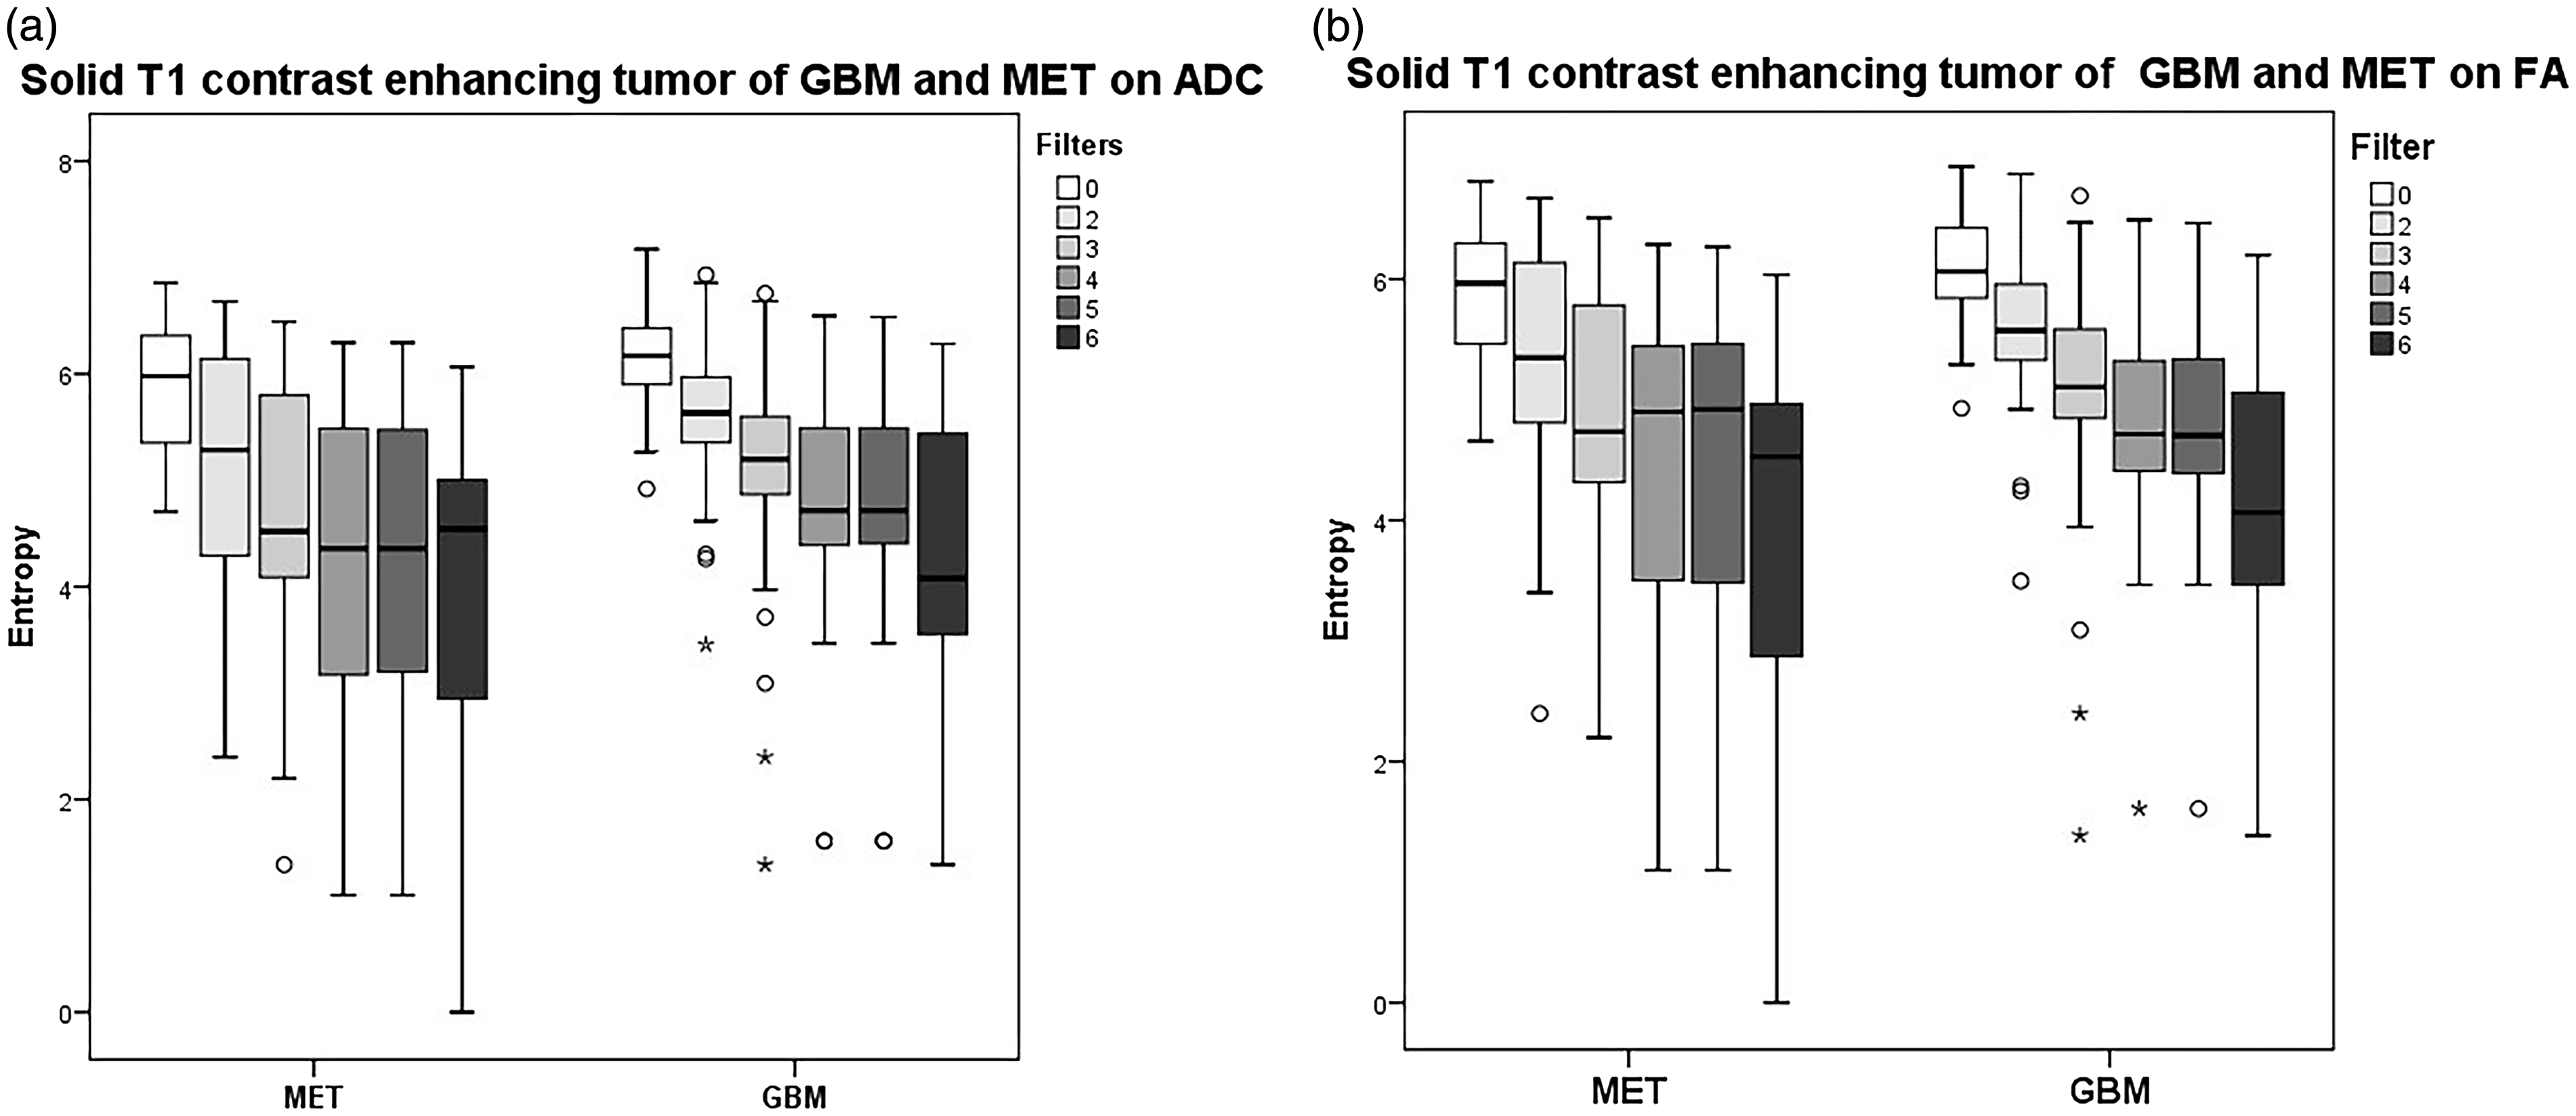
Mann–Whitney test for all texture parameters on DTI metrics in the peritumoral edema in differentiation of GBM from MET.
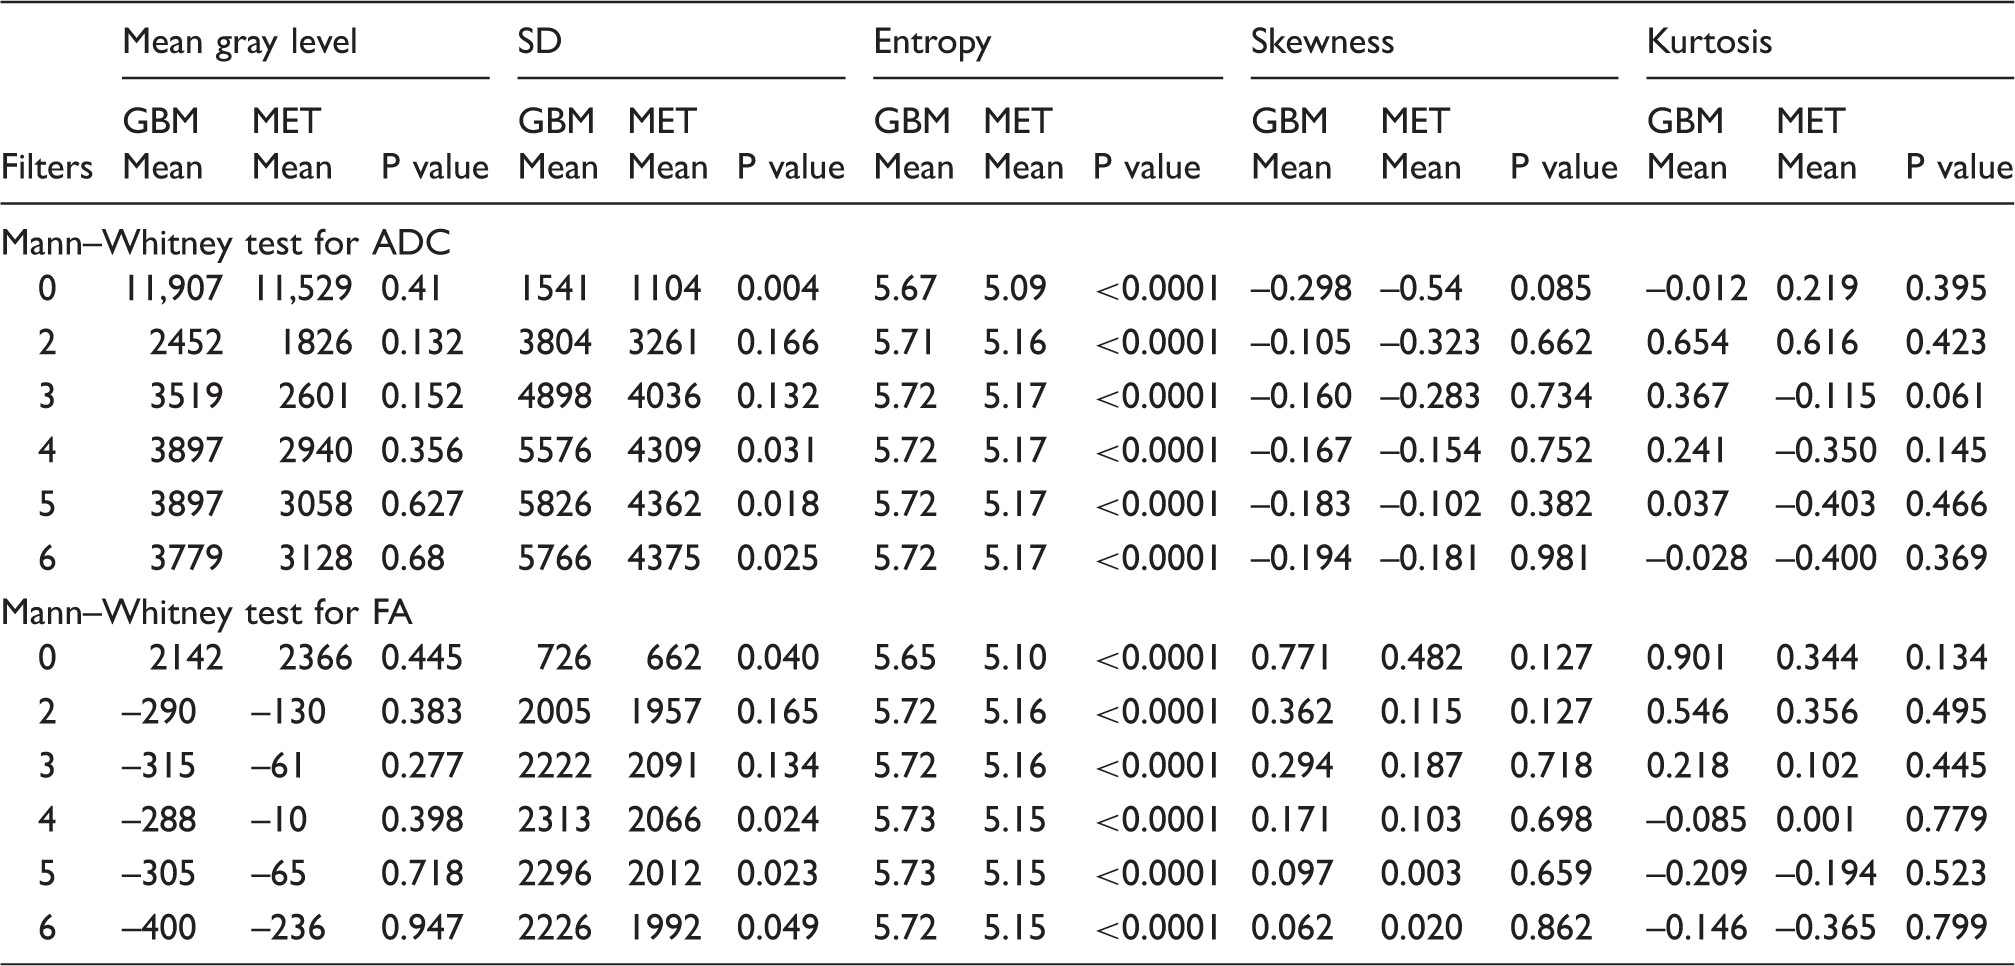
ADC, apparent diffusion coefficient; DTI, diffusion tensor imaging; FA, fractional anisotropy; GBM, glioblastoma; MET, metastasis.
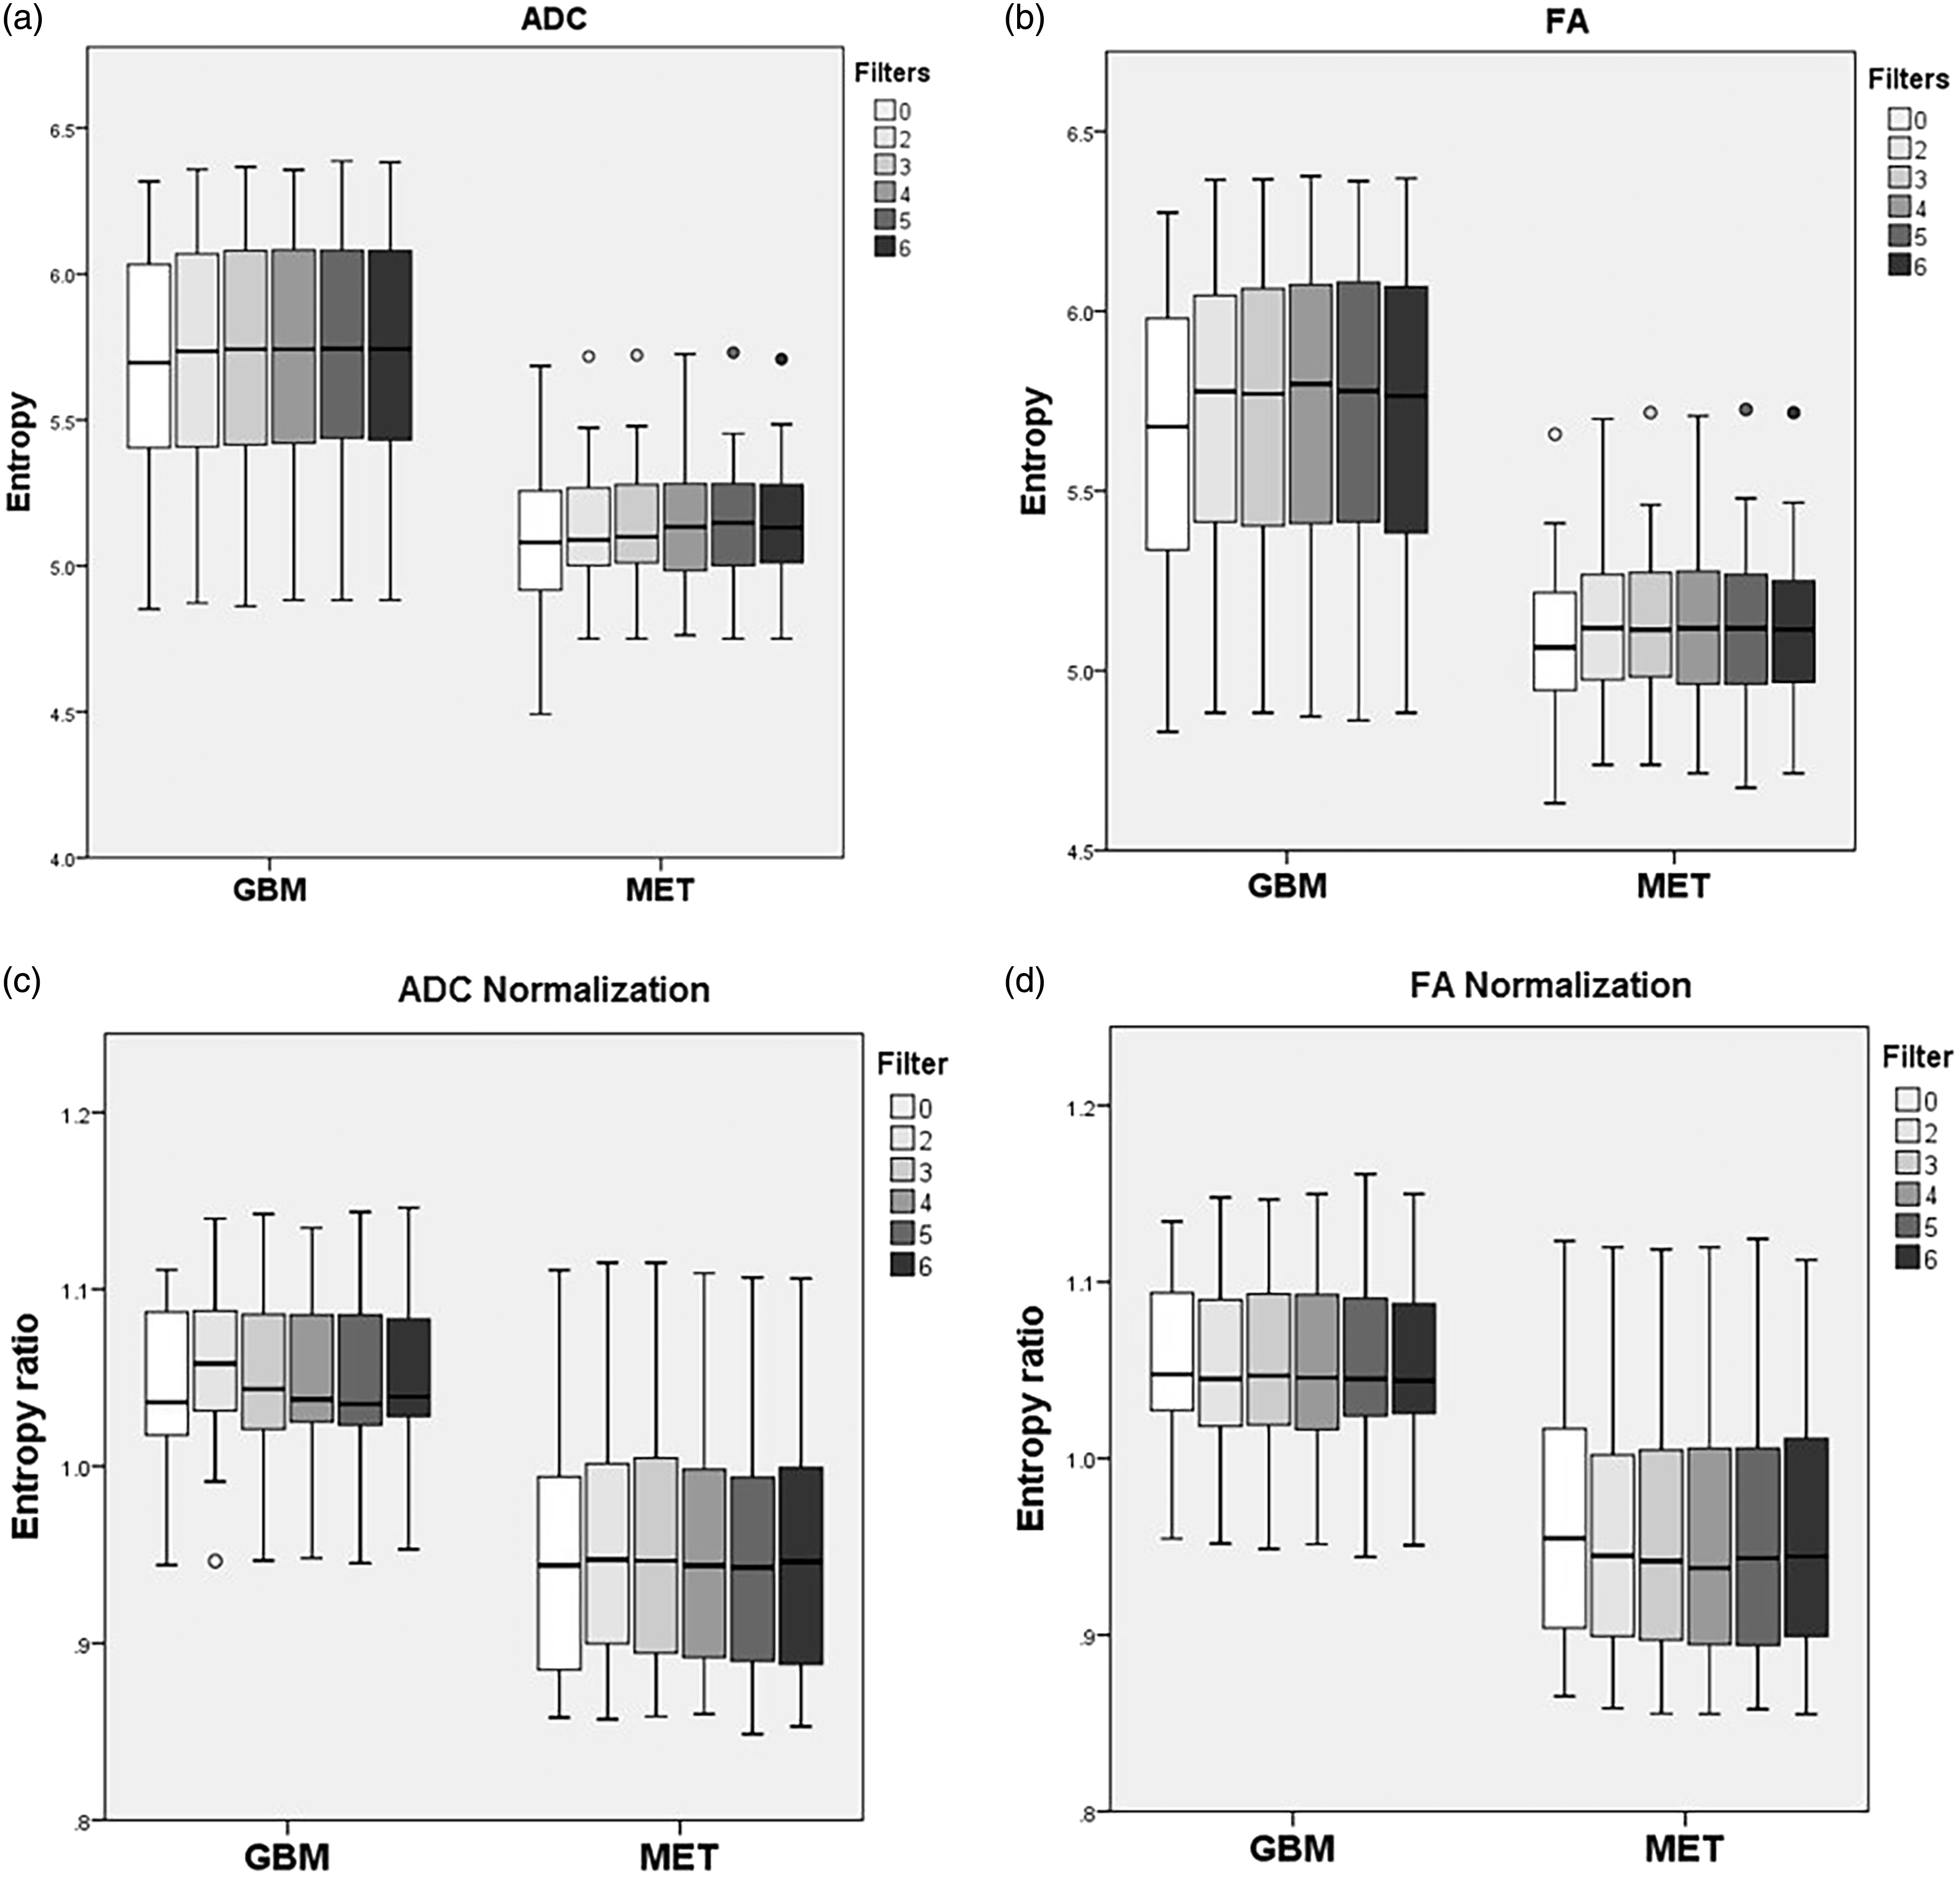
Boxplots illustrating the difference between GBM and MET with entropy values and ratios in the peritumoral edema, showing all the filters on (a) ADC values, (b) ADC ratios, (c) FA values, and (d) FA ratios.
ROC analysis measuring sensitivity, specificity, NPV, PPV, and AUC using texture analysis parameter entropy on DTI metrics in the peritumoral edema in differentiation of GBM from MET.
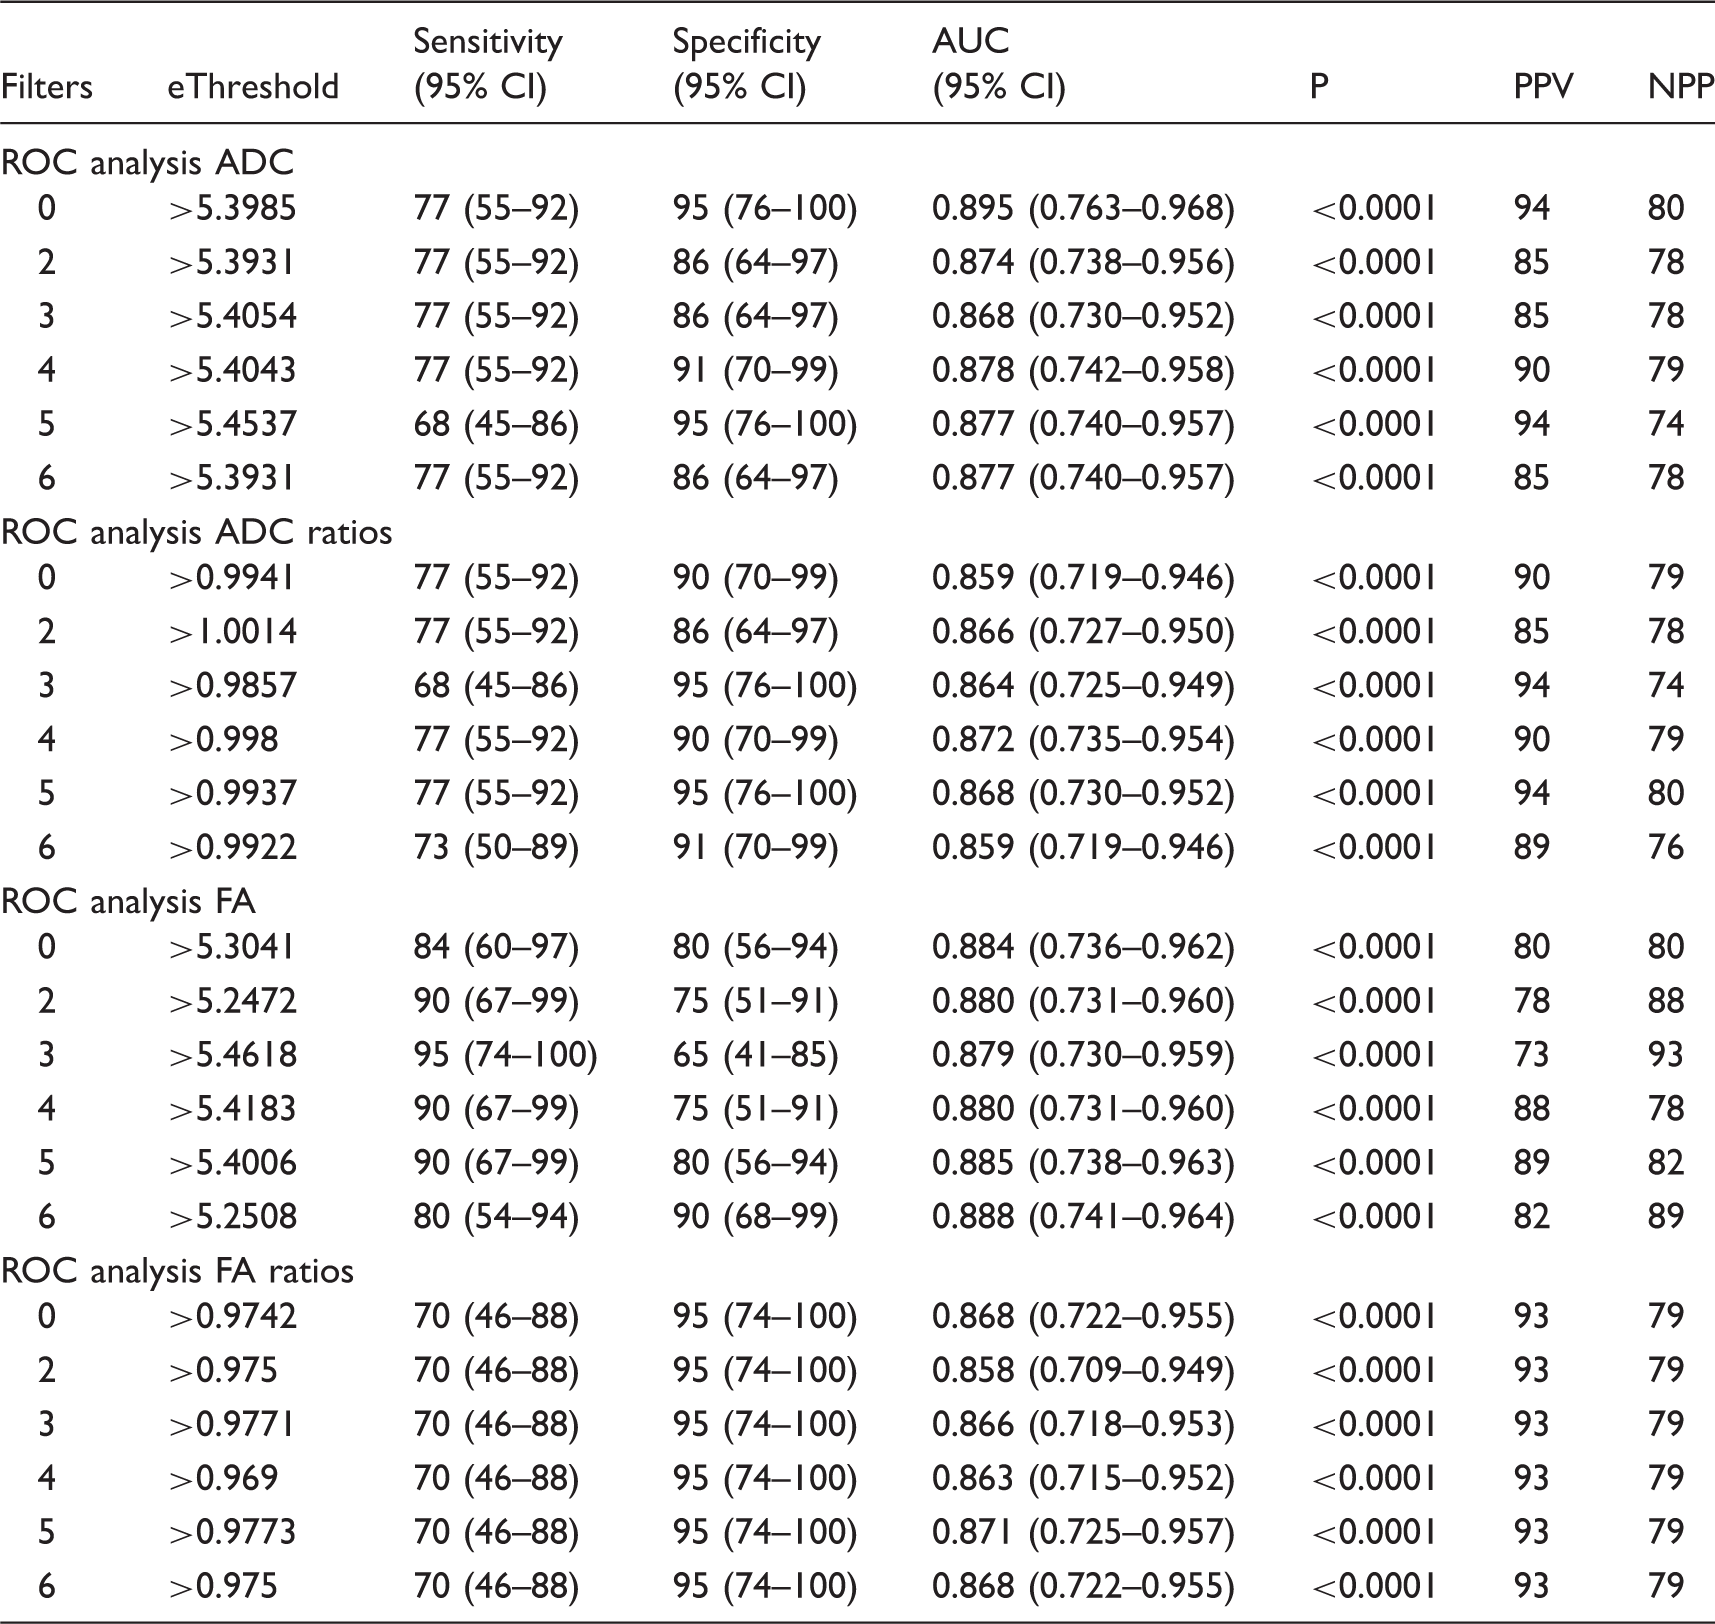
ADC, apparent diffusion coefficient; AUC, area under the curve; CI, confidence interval; DTI, diffusion tensor imaging; e, entropy; FA, fractional anisotropy; GBM, glioblastoma; MET, metastasis; NPV, negative predictive value; PPV, positive predictive value.
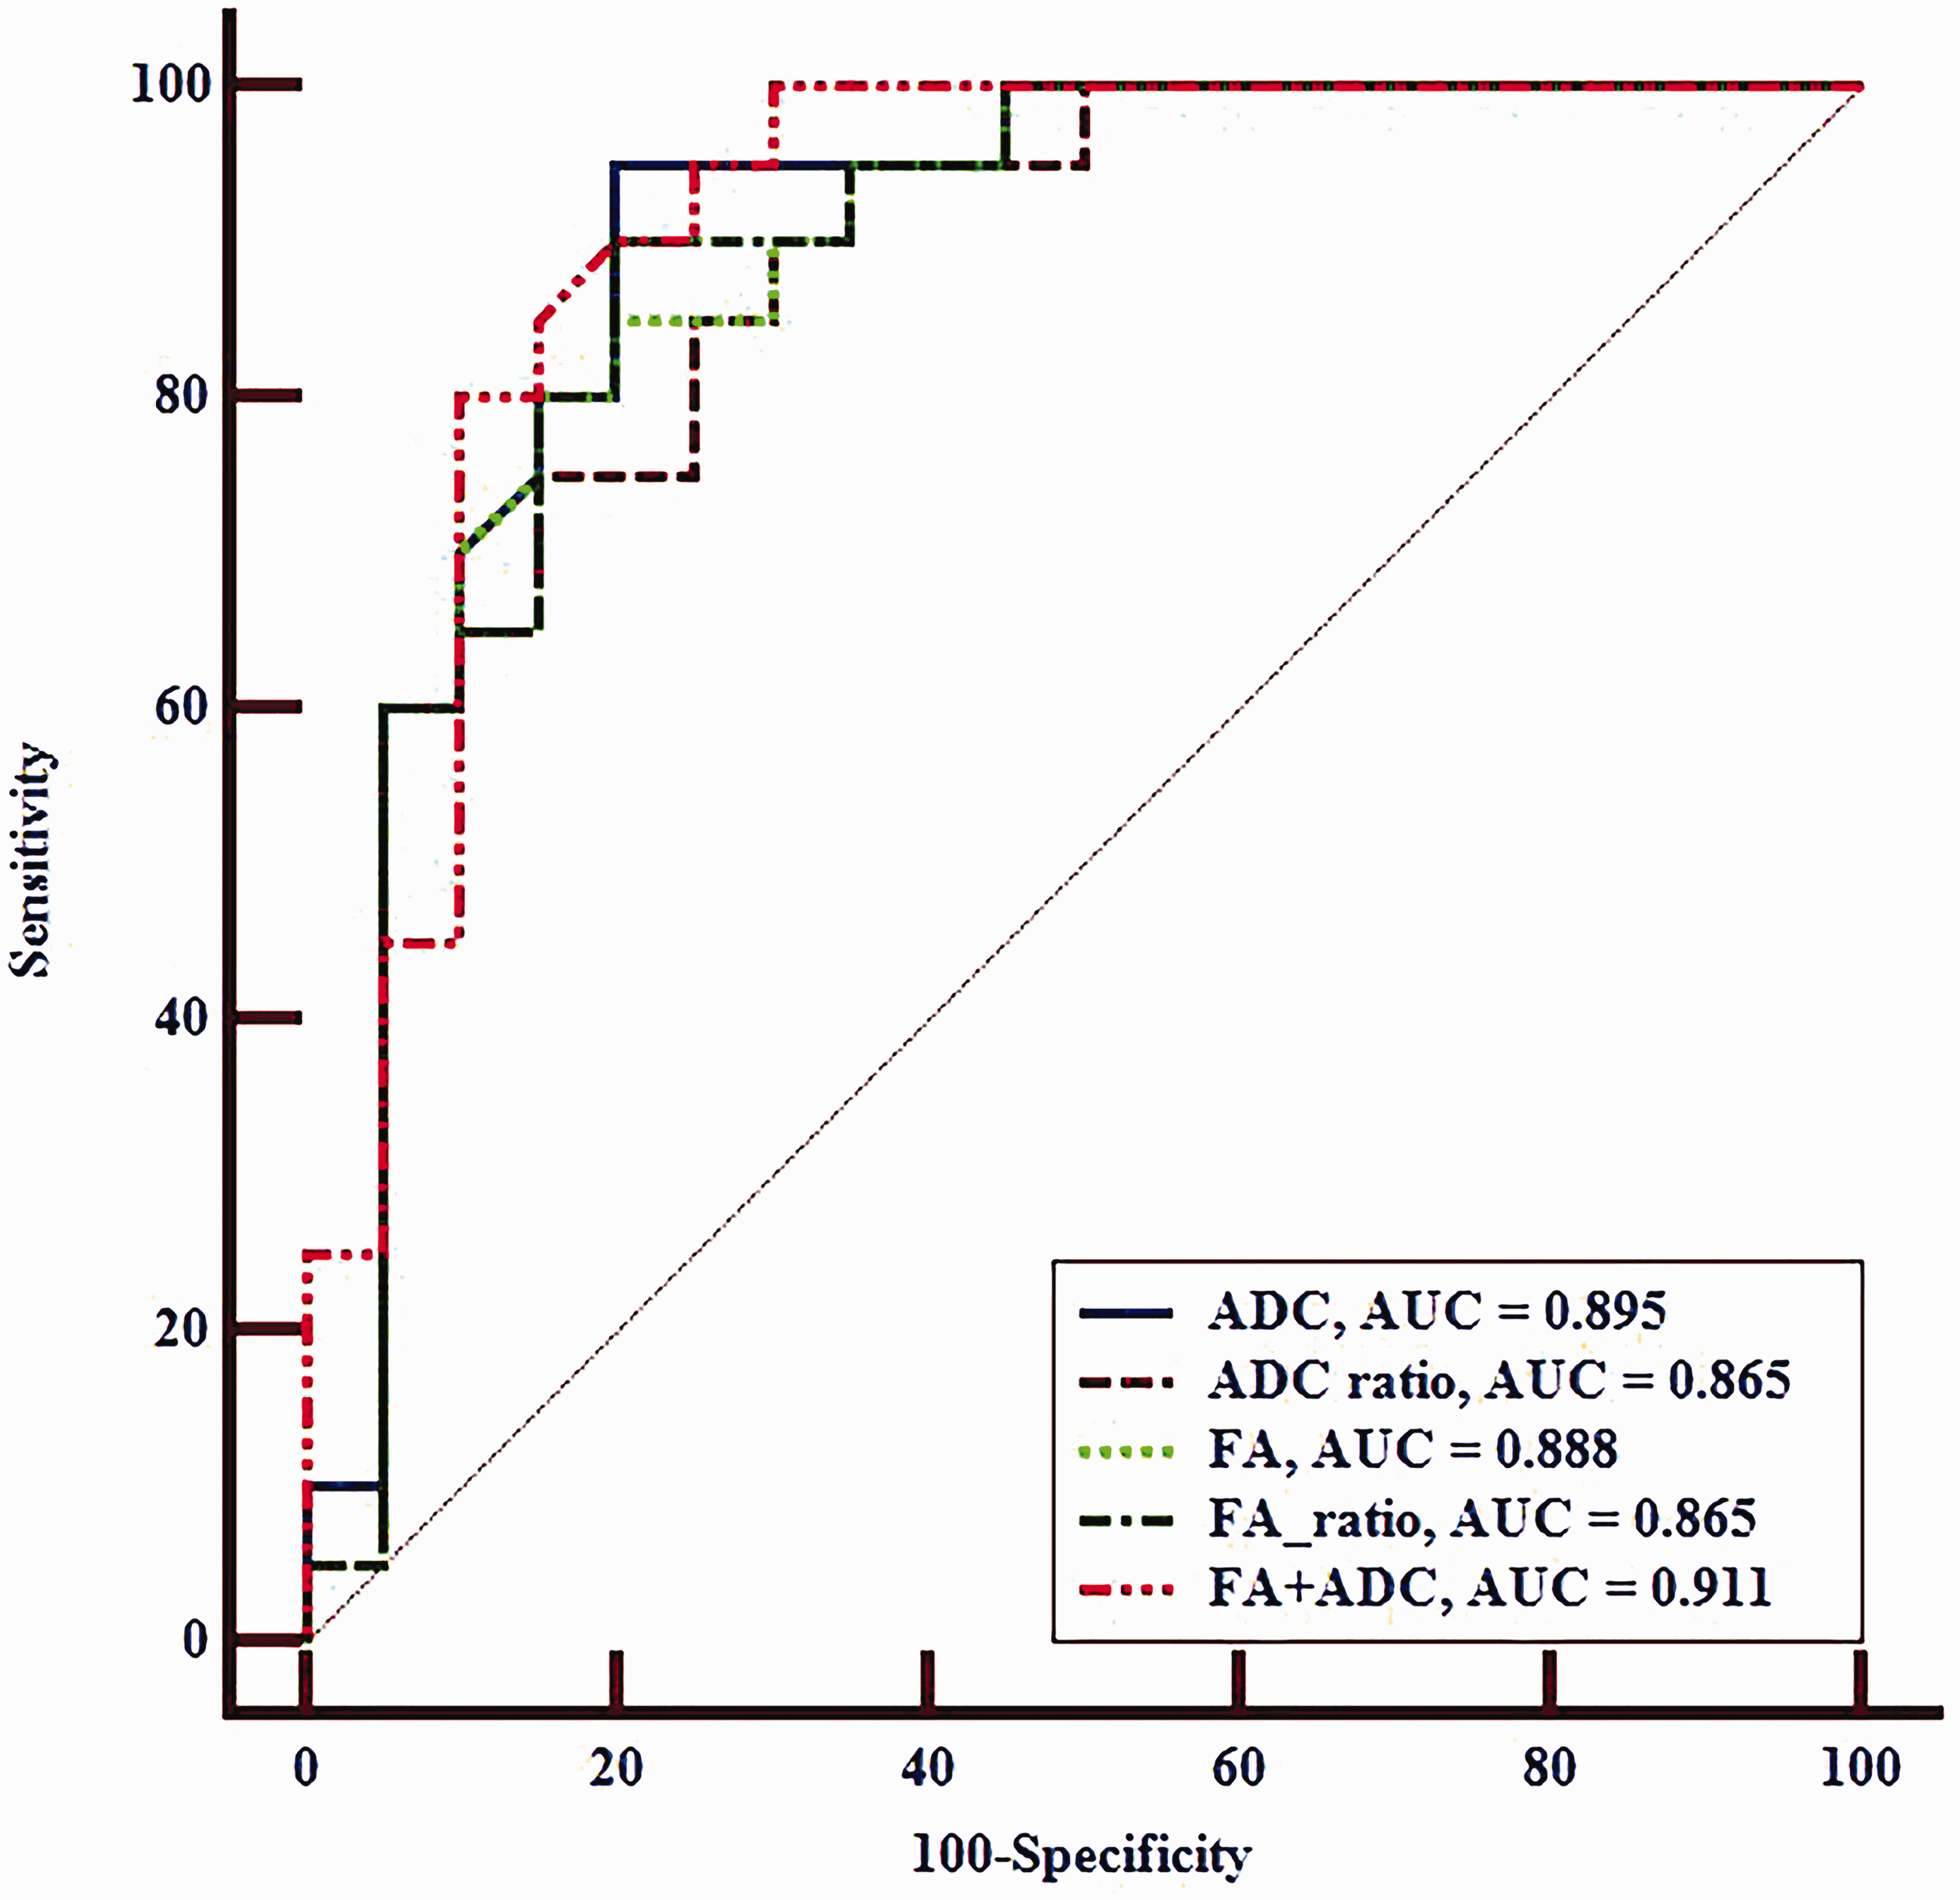
ROC curves of ADC unfiltered value (AUC = 0.895) and ADC ratio at SSF = 5 (AUC = 0.868), FA value (AUC = 0.888) and FA ratio at SFF = 6 (AUC = 0.868), and the combination of ADC and FA predictability for unfiltered (AUC = 0.911), using texture analysis parameter entropy from the peritumoral edema for differentiation of GBM from MET.
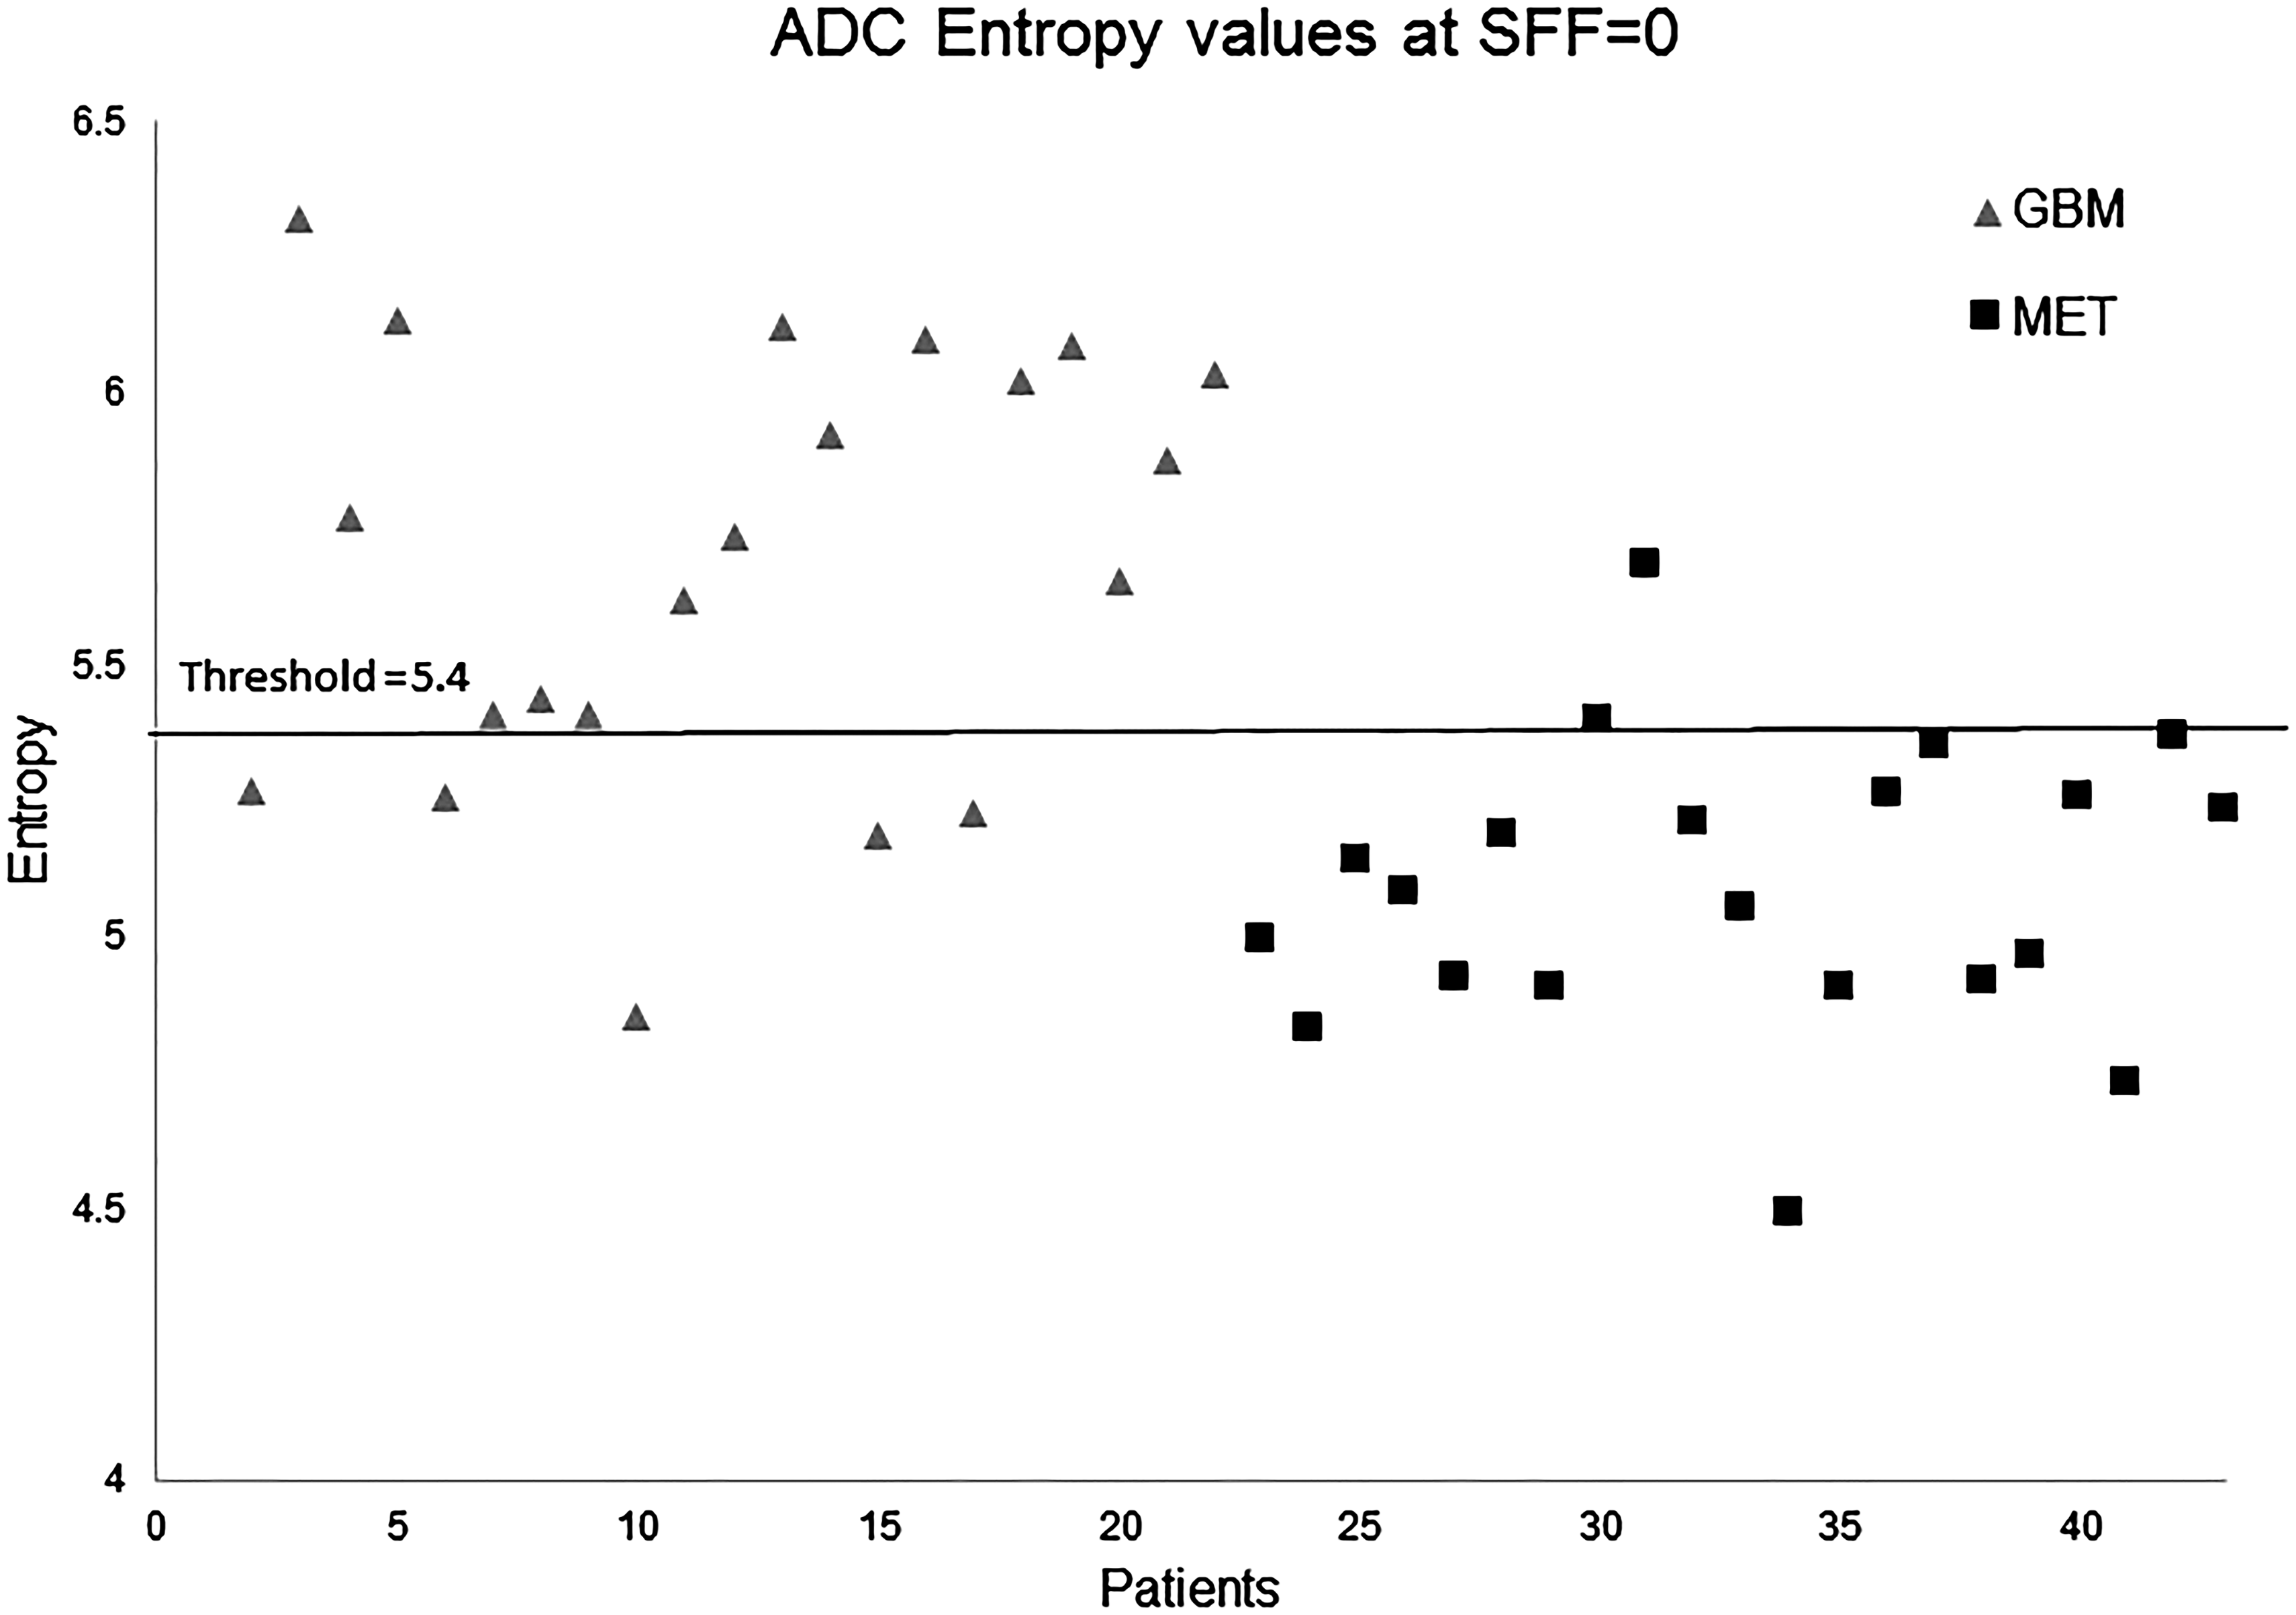
Scatterplot of each individual patient and their entropy value in the peritumoral edema with the calculated threshold value from the ROC analysis comparing GBM and MET with unfiltered entropy on ADC.
ROC analysis measuring sensitivity, specificity, NPV, PPV, and AUC using texture analysis parameter standard deviation on DTI metrics in the peritumoral edema in differentiation of GBM from MET.
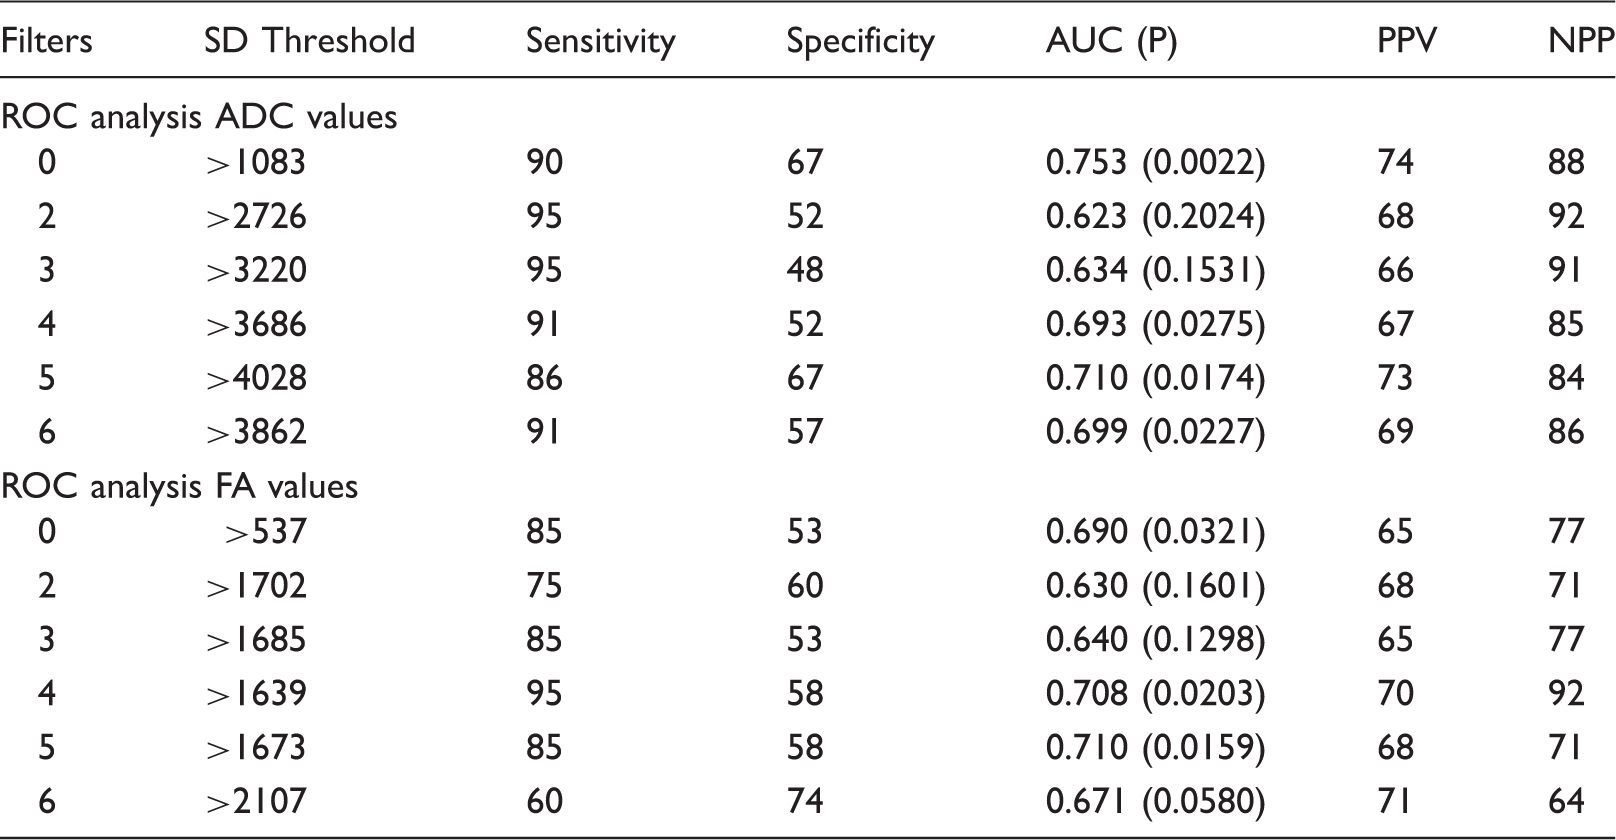
ADC, apparent diffusion coefficient; AUC, area under the curve; DTI, diffusion tensor imaging; GBM, glioblastoma; MET, metastasis; NPV, negative predictive value; PPV, positive predictive value; SD, standard deviation.
Normalizing the data showed a statistical significance in differentiating the two tumors (Table 2 and Figs. 3 and 4). SSF = 5 (medium scale) for ADC ratios with a threshold ratio of > 0.99 best discriminated GBM from MET with a sensitivity and a specificity of 77% and 95%, respectively.
ROC analysis measuring sensitivity, specificity, NPV, PPV, and AUC combining texture analysis parameter entropy for DTI metrics in the peritumoral edema in differentiation of GBM from MET.
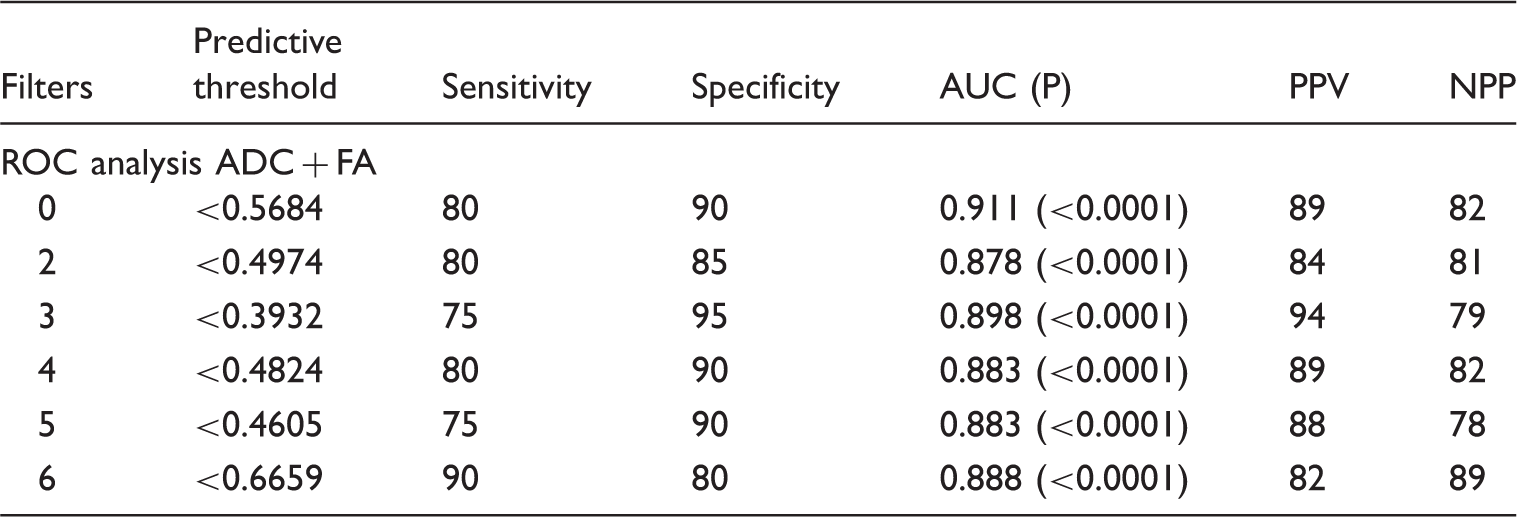
AUC, area under the curve; DTI, diffusion tensor imaging; GBM, glioblastoma; MET, metastasis; NPV, negative predictive value; PPV, positive predictive value.
Discussion
In our study we have demonstrated, by using MRTA, that heterogeneity in the peritumoral edema in GBM is increased compared to MET. The two tumors were differentiated with a sensitivity and specificity of 77% and 95% on ADC and 80% and 90% on FA values, respectively. The peritumoral edema around MET is assumed to be pure vasogenic, whereas for GBM the edema also contains invasive neoplastic cells (17). Calculating DTI values for both FA and ADC maps to distinguish GBM from MET has been attempted, with conflicting results. Some results show an increase in the value for GBM compared to MET, some decreased (18,19), and others with no difference (17,20) for both DTI metrics. Consequently, different conclusions have been made. A review by Sternberg et al. (21) reported the discrepancy in values could be explained by a notable limitation of an inconsistency in defining the peritumoral region. However, with the mentioned reviews and a recent meta-analysis by Jiang et al. (19), all concluded that DTI is a useful tool to differentiate between GBM and MET, where low ADC and high FA values in the peritumoral edema indicate GBM.
Morita et al. (12) reported that high grade gliomas have a high diffusivity of water molecules within the area of edema a likely reflection of destruction to the extracellular matrix (ECM) by neoplastic infiltration. This was supported by another study using changes in glutamate levels as a marker for the integrity of the ECM (22). Neoplastic infiltration by GBM gives a heterogeneous diffusivity and causes an irregular edema. We predicted this irregularity by calculating the entropy derived from ADC maps in the peritumoral edema to differentiate GBM from MET across the different filters, with a sensitivity and specificity of 77% and 95%, respectively, and a corresponding AUC of 0.89.
White et al. (11) reported that FA is mainly affected by tumor infiltration, where destruction of nerve fibers is represented as anisotropy. Experimental studies have shown that GBM cells produce tumor-specific ECM components leading to high anisotropy and consequently high FA values. These changes are seen both within the tumor and peritumoral region (23). This architectural change causes an irregularity within the texture of the peritumoral edema causing an increase in heterogeneity. We quantified this heterogeneity with entropy on FA and predicted GBM with a sensitivity of 80%, specificity of 90%, and a corresponding AUC of 0.88 using coarse filtration.
The sensitivity and specificity for entropy did not change when normalizing it with the sentrum semiovale increasing the robustness of the results.
The diagnostic performance of SD for some of the filters was significant, but with a lower specificity than entropy elicited. In a previous study on MRI, SD was found the best parameter to differentiate between the different grades of gliomas (24). SD measures heterogeneity with the degree of variation from the mean pixel and entropy measures the irregularity of the pixel intensities. This suggests that there must be a higher degree of irregularity between the pixel intensity compared to variation between the mean pixel values in the peritumoral edema. The other parameters could not recognize the anticipated infiltration of GBMs.
Other advanced imaging techniques have been used to evaluate tumor cell infiltration in the peritumoral region of GBMs such as perfusion (25) and spectroscopy (26). To the best of our knowledge, this is the first study using only texture analysis to evaluate the heterogeneity in the peritumoral edema to differentiate GBM from MET on DTI.
Both GBM and MET have a degree of neovascularization, necrosis, increased mitosis, and cellularity within the solid component of the tumor. All these aspects add to the specter of heterogeneity. We could not detect a significant difference in the heterogeneity within these two tumors using texture analysis on DTI. Using DTI to evaluate the intratumoral components can be challenging as it is very sensitive to susceptibility artefacts such as hemorrhage. Even though tumors with visible hemorrhage were excluded, this study verifies other studies conclusions of the difficulty to use DTI to distinguish the tumor component of GBM from MET (17). One study did show a difference in the ADC values between the two tumors, but not for FA (18). Other advanced MRI techniques such as spectroscopy and a combination of DTI and MRI perfusion also managed to differentiate the two tumors based on the tumor itself (27).
We emphasize that the main focus of our current study has been the peritumoral region, a less studied region than the contrast-enhancing tumor in both GBM and MET. An easy-to-use texture analysis technique was used in order to demonstrate tumor infiltration and tumor-free edema. There are several methods to extract texture features from medical images and also several ways of quantifying the texture (28). In this study, a commercially available software was used which employs a histogram filtration technique with LoG filters and quantifies the textures with first order statistical parameter and we found that entropy was best at quantifying the heterogeneity in these two tumors compared to the other parameters. Both unfiltered and filtered values were significant and with very little degree of variation. As the best parameter was for coarse filtration and this adds no time to the analysis, using the filtrated value is beneficial. The texture analysis software is a well validated technique (29). Other quantifications methods such as gray level co-occurrence matrix can also be used (28). These are directionally dependent, tend to be more time-consuming, are often in-house software, and are computationally expensive (30). One study found that voxel-based texture and shape features extracted from the neoplastic area on contrast-enhanced T1 and perfusion MRI combined could distinguish metastasis from glial tumors (31). In our study, similar sensitivity and specificity were demonstrated, but contrary to Zacharaki et al. (31), the peritumoral edema was significant and the neoplastic tumor showed no statistical significance. Similarly, Mouthuy et al. (32) obtained perfusion-weighted MRI and visual texture analysis from 50 patients to discriminate GBM from MET with a sensitivity of 92% and a specificity of 71%. Applying 3D texture analysis of volumetric MR images and using a pattern recognition system, a study achieved 77.14%, 89.19%, and 93.33% accuracy in discriminating metastatic, malignant, and benign tumors, respectively (33). Furthermore, in a recent study of 48 patients (30 GBM and 18 MET) using a 3D morphological analysis applied on the tumor surface defined by DTI segmentation technique reported 95.8% accuracy in the differentiation between GBM and MET (34).
It is important to start using the additional information from already obtained images, rather than just adding on sequences, to increase the understanding of radiological images and provide potential pathophysiological information such as tumor infiltration in this instance.
The limitation of being a retrospective study was reduced by only including patients who had examinations with the same acquisition protocol on the same 3-T MRI scanner. A noted limitation is only analyzing a single slice and a volumetric analysis would probably be a better representation of the peritumoral edema. A study in colorectal cancer using CT texture analysis by Ng et al. (35) did show that a volumetric analysis was more representative; however, both single slice and volumetric analysis were significant prognostic markers and there was very little difference in the overall statistical analysis. The ROI was manually drawn which can be subject to bias, to minimize this limitation the ROI was drawn in consensus between two neuroradiologists. Histological verification of tumor infiltration where the ROI was placed in the peritumoral edema was not obtained. A prospective study with histopathological validation is necessary for a more accurate interpretation of the textures in the peritumoral edema using DTI.
In conclusion, the architectural change to the peritumoral ECM caused by the infiltrative nature of GBM can be measured with texture analysis on DTI sequences, increasing our radiological understanding of pathophysiology without adding time in the scanner for the patient, distinguishing them from MET. This can potentially be an adjunct to achieve a more accurate radiological diagnosis and establish a preoperative personalized management plan.
Footnotes
Declaration of Conflicting Interests
The author(s) declared the following potential conflicts of interest with respect to the research, authorship, and/or publication of this article: Karoline Skogen and Balaji Ganeshan are shareholders in the software company, TexRAD, used for the analysis in this paper.
Funding
The author(s) received no financial support for the research, authorship, and/or publication of this article.