
Abstract
Background
Sex-related differences of vertebral bone marrow fat in relation to varying bone densities have not yet been evaluated although some studies have reported an inverse association of bone marrow fat and bone mineral density (BMD).
Purpose
To evaluate the relationship between bone marrow fat and BMD and to demonstrate the sex-related differences of the vertebral bone marrow fat in normal adults with varying bone densities.
Material and Methods
A total of 123 normal adult volunteers were enrolled in this study. 1H-MRS of the lumbar spine was performed. The fat fraction (FF) values of vertebral bone marrow were measured. Volumetric BMD measurement was performed by quantitative computed tomography (QCT). All participants were divided into three groups according to BMD (normal, osteopenia, osteoporosis). The differences in the FF and body mass index (BMI) values of the three groups were compared, and partial correlation analysis was used to evaluate the correlation between FF values and BMD/BMI.
Results
The FF values increased with decreasing BMD in both male and female participants. There were significant sex differences for the FF values in the normal bone density group (P < 0.001). The FF values of the normal bone density group in male participants were significantly higher than those of the female participants (P < 0.001). The FF values were significantly negative correlated with BMD for all participants (r = −0.820, P < 0.001).
Conclusion
The FF values of vertebral bone marrow correlated inversely with BMD. Sex-related differences of FF values was related to BMD.
Keywords
Introduction
Osteoporosis is characterized by low bone mass and microarchitectural deterioration of bone tissue, leading to increased bone fragility and a consequent increase in fracture risk. Currently, bone mineral density (BMD) remains the primary predictor of bone strength (1). However, bone strength is multifactorial and may depend not only on bone density but also on bone marrow quality (2). Osteoporosis, for example, has been shown to be associated with increased fat content in the bone marrow. Bone marrow fat may function as an indirect marker of changes in bone and may also play a direct role in bone health (3). As a result, bone marrow fat quantification has recently gained increasing attention as a potential biomarker for bone quantity and quality. Bone marrow fat content can be assessed non-invasively using hydrogen proton magnetic resonance spectroscopy (1H-MRS), which is able to identify fat molecules and water molecules based in the form of a lipid-to-water ratio on chemical-shift imaging theory. Some studies have also reported an inverse association of bone marrow fat and BMD (4–12). However, most of these studies have used dual-energy X-ray absorptiometry (DXA) for measurement of BMD. Data are not available on the associations of marrow fat with the separate compartments of trabecular and cortical bone, measured with quantitative computed tomography (QCT). Furthermore, most of the previous MRS studies on quantifying bone marrow adiposity were performed at 1.5 T. 3-T MRI provides advantages for MRS including enhanced spectral resolution and higher signal-to-noise ratio (SNR) (13). Moreover, the difference related to sex of the vertebral bone marrow content with varying bone densities has not yet been evaluated, which previous studies primarily focused on female (4,6,10–12) and male individuals (5). In addition, the influence of body mass index (BMI) has not been identified in this context.
Thus, the goals of this study were threefold: (i) to determine vertebral bone marrow fat content in adults with varying bone densities as documented with QCT using MRS at 3T; (ii) to evaluate the relationship between bone marrow fat content and BMD/BMI; and (iii) to demonstrate the sex-related differences of the vertebral bone marrow fat content with varying bone densities.
Material and Methods
Participants
Our ethics committee approved this prospective study and all participants provided written informed consent. By questionnaire and imaging evidence from our MR and QCT exam, individuals were excluded if they had: (i) clinical or imaging evidence of metabolic bone disease or metastases or lumbar compression fracture; (ii) a history of lumbar spinal surgery or chemotherapy and/or irradiation; or (iii) a contraindication to MR examination. The study group was composed of 123 normal adult volunteers (age range = 20–90 years; mean age = 56.35 ± 13.62 years; median age = 57 years). There were 50 men (age range = 20–82 years; mean age = 57.92 ± 17.39 years; median age = 56 years) and 73 women (age range = 21–90 years; mean age = 54.79 ± 15.83 years; median age = 58 years), with no significant age differences related to sex (P = 0.9).
QCT measurement of BMD
All participants underwent a spiral CT scan of the spine at the levels of L2–L4 (16 slices High Speed, GE Healthcare, Milwaukee, WI, USA). Scan parameters were 120 kVp, 100 mAs, 3-mm slice thickness, and 40-cm field of view (FOV). Participants were positioned supine on the CT table with Mindways CT calibration phantom placed under the individuals to cover levels L2–L4. Images were transferred to the QCT PRO PC (Mindways Software Inc., Austin, TX, USA). A region of interest within the trabecular bone of each of three vertebral bodies was placed semi-automatically for the BMD measurement, to avoid cortical bone and the posterior veins. The average trabecular BMD of L2–L4 was calculated. The error of this technique is < 1.5% (14). Average BMD is expressed in mg/cm3 of calcium hydroxyapatite for the BMD of spinal trabecular bone, 80 mg/cm3 ≤ BMD ≤ 120 mg/cm3 for osteopenia, and BMD < 80 mg/cm3 for osteoporosis. These were suggested by the International Society for Clinical Densitometry (ISCD) in 2007 (15) and by the American College of Radiology in 2008 (16). All participants were divided into three groups (normal, osteopenia, osteoporosis).
MR technique
All MR examinations were performed using a spinal phased array coil on a 3.0-T superconducting MR System (Verio, Siemens Healthineers, Forchheim, Germany). The maximum gradient amplitude and maximum slew rate were 45 mT/m and 200 mT/m/s, respectively.
Routine MR imaging (MRI) of the lumbar spine was performed using sagittal T1-weighted (T1W) (TR/TE = 624/11 ms) and T2-weighted (T2W) (TR/TE = 3500/88 ms) sequences and transversal T2W (TR/TE = 3800/105 ms) sequences. The following imaging parameters were used: slice thickness = 4 mm; intersection gap = 0.4; FOV = 300 × 100 mm; matrix = 384 × 288; and number of excitations (NEX) = 2. All MR images were used to identify pre-existing abnormalities of the lumbar vertebrae.
After local shimming and gradient adjustments were performed, single voxel 1H-MRS was acquired in the second to the fourth lumbar vertebral body (L2–L4) using the point resolved spectroscopy (PRESS) sequence. The parameters were: TR/TE = 3000/30 ms, 32 averages without water suppression, flip angle = 90°, vector size = 1024, bandwidth = 2500 Hz, voxel size = 15 × 15 × 15 mm. The PRESS box was positioned in the middle of the vertebral body and was kept the same for each vertebral level and for all individuals. Voxel positioning and measurement for all studied participants were performed by the same investigator (second author, HF). Six outer volume saturation bands (one on each side of the PRESS box) were used to eliminate potential contamination of outside signals.
Quantitative image analysis
The spectral data were transferred to a workstation immediately after the scan for offline analysis. The software applied is part of the 1H-MRS package for the Siemens Vision System (Syngo Spectroscopy, Siemens Healthineers). The 1H-MR spectra have dominantly a water peak and a lipid peak. The two major peaks (water and lipid) are separated by 4.65 ppm and 1.3 ppm. Marrow fat content was defined as the relative area under the peaks of the signals as a percentage of total signals (water and fat) and calculated according to the following equation: the fat fraction (FF) = [Ifat /(Ifat + Iwat)] × 100%, where Ifat and Iwat are the area under the fat and water peaks, respectively. The average FF value was calculated using the second to forth lumbar vertebral body levels for each participant. For spectral quantification, the peak area variable (integral) is preferred over the peak amplitude variable, because the area is independent of the field inhomogeneity and less sensitive to noise (Fig. 1).
1H-MRS spectrum of L3 vertebral body: two major peaks of water (left, 4.65 ppm) and lipid (right, 1.3 ppm). (a) A 33-year-old man with normal BMD (BMD = 173.40 mg/cm3, FF value = 29.52%); (b) A 54-year-old man with osteopenia (BMD = 99.65 mg/cm3, FF value = 43.46%); (c) a 65-year-old man with osteoporosis (BMD = 62.06 mg/cm3, FF value = 59.23%).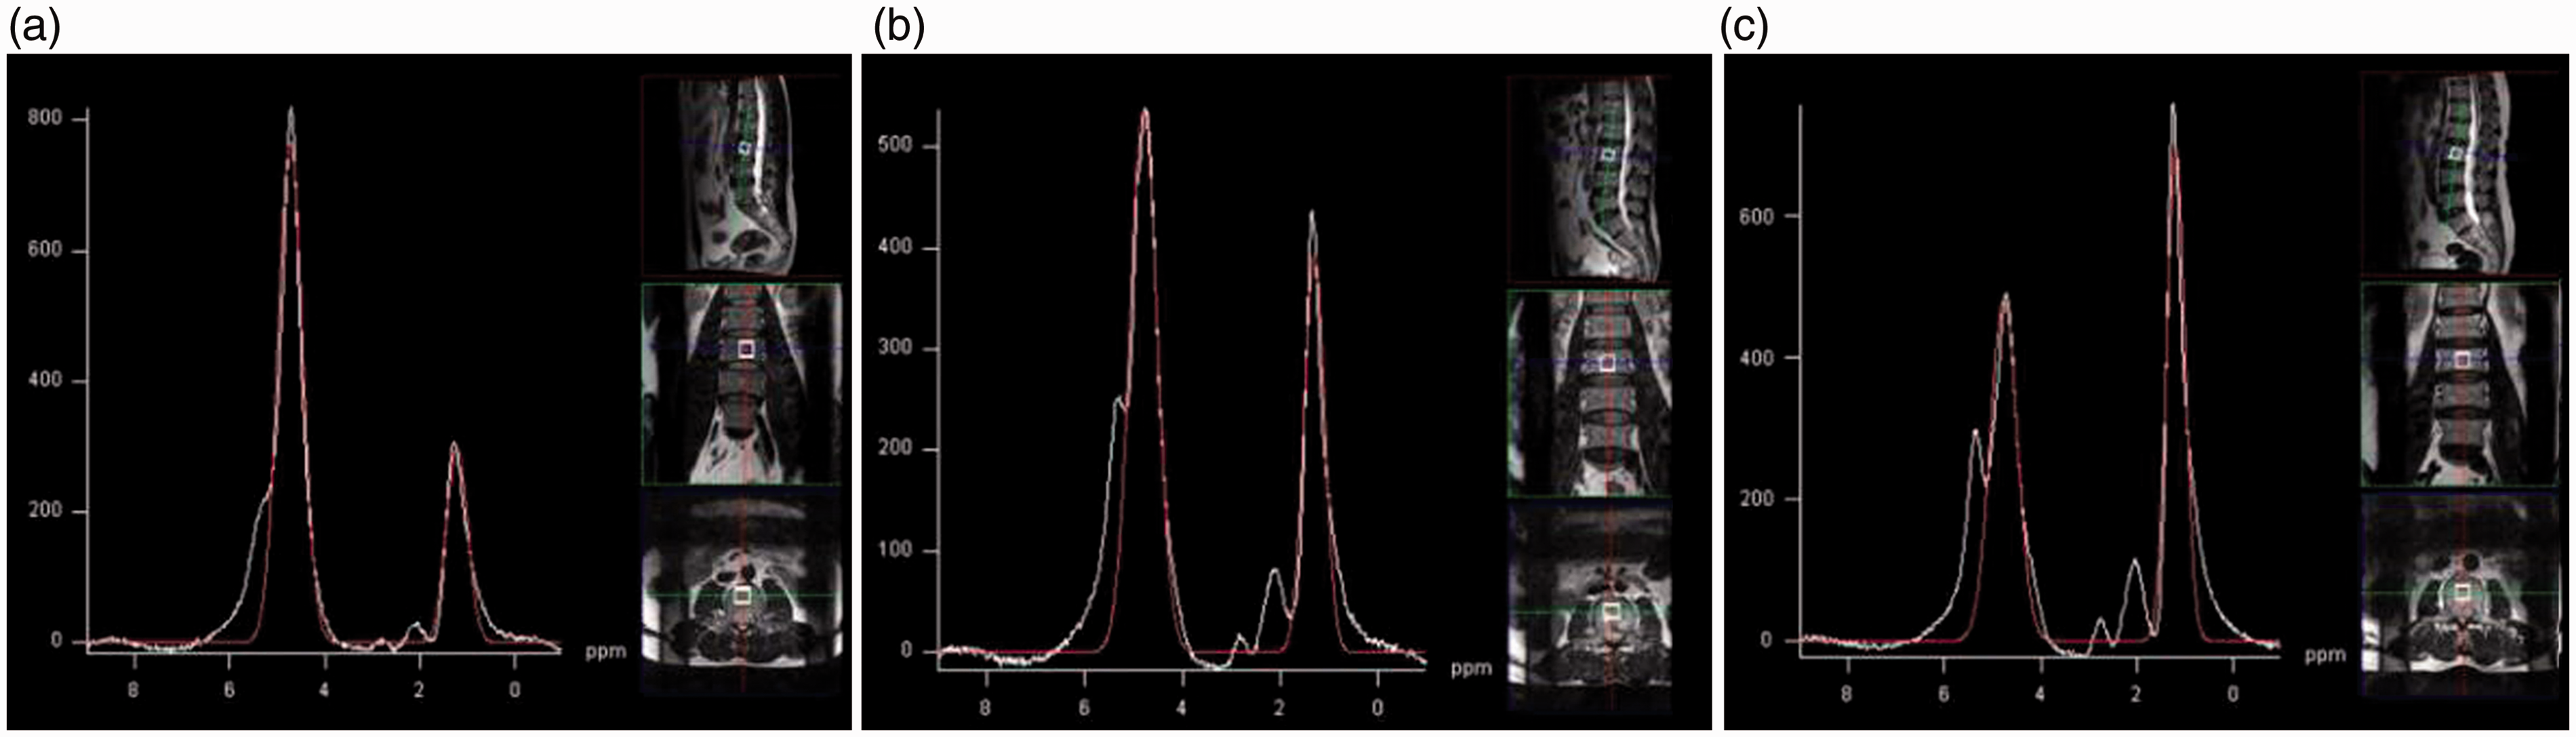
Statistical analysis
The mean FF and BMI values of each group of BMD were calculated (mean ± standard deviation [SD]). One-way analysis of variance (ANOVA) was performed to compare the difference of FF and BMI values among the different BMD groups (normal, osteopenia, and osteoporosis) for each sex. The Bonferroni method was used to make pairwise comparisons between groups. An unpaired t-test was performed to compare the difference of FF and BMI values between the sexes in the same BMD group. A partial correlation analysis was performed to analyze the correlation between FF values and BMD/BMI, and a P value < 0.05 was considered statistically significant. All statistical analyses were performed with SPSS software (version 17.0; SPSS Inc., Chicago, IL, USA).
Results
Comparison of Age, BMI and FF values of different BMD groups in all male participants.
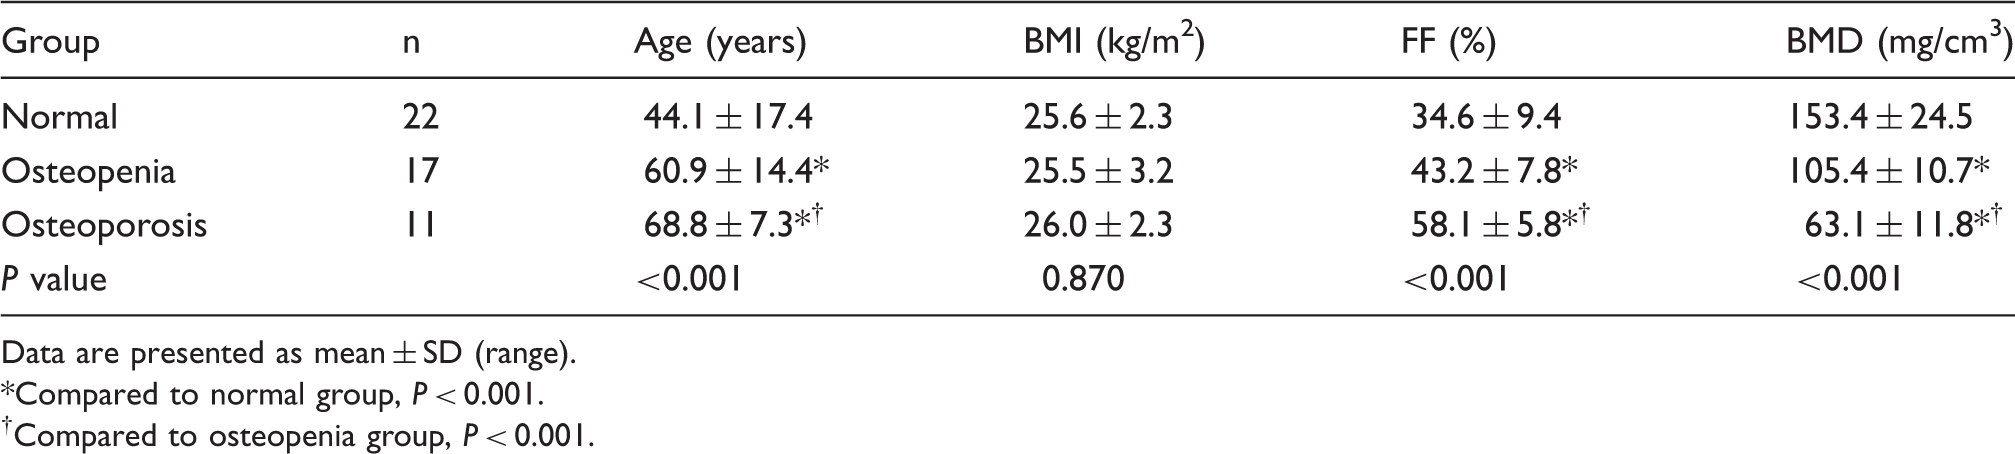
Data are presented as mean ± SD (range).
Compared to normal group, P < 0.001.
†Compared to osteopenia group, P < 0.001.
Comparison of age, BMI, and FF values of different BMD groups in all female participants.
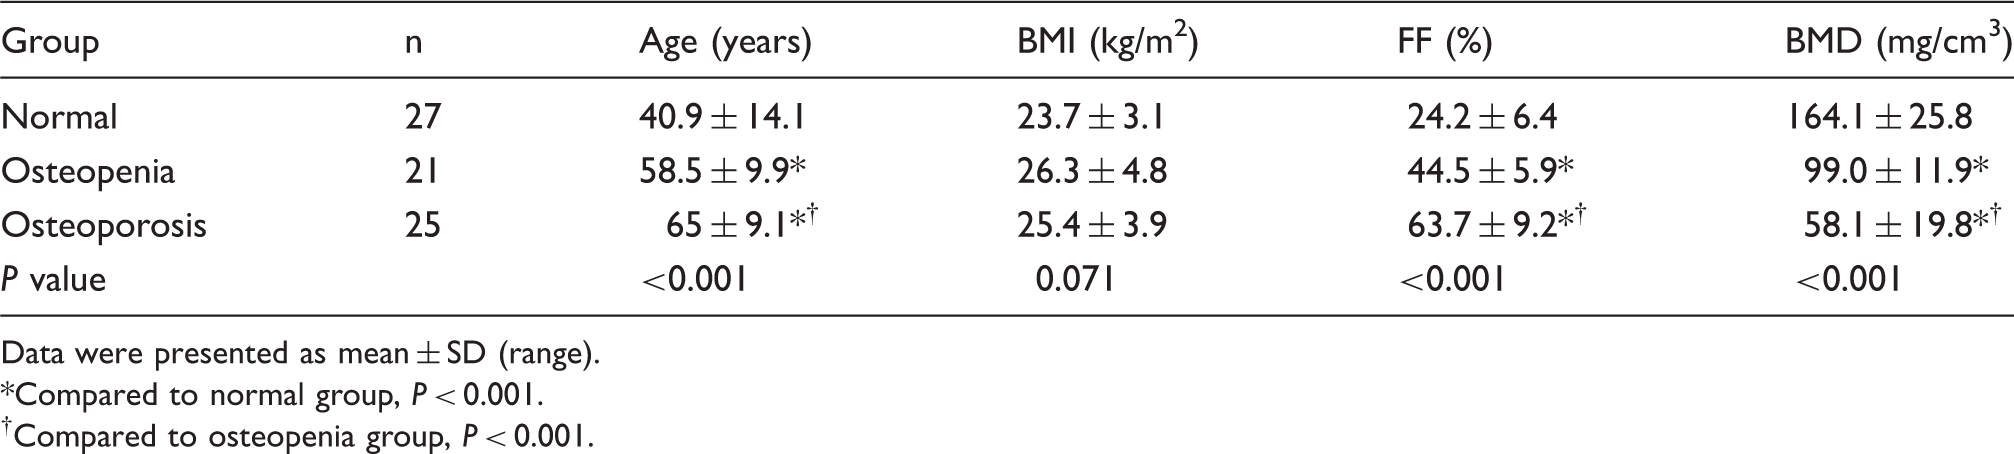
Data were presented as mean ± SD (range).
Compared to normal group, P < 0.001.
†Compared to osteopenia group, P < 0.001.
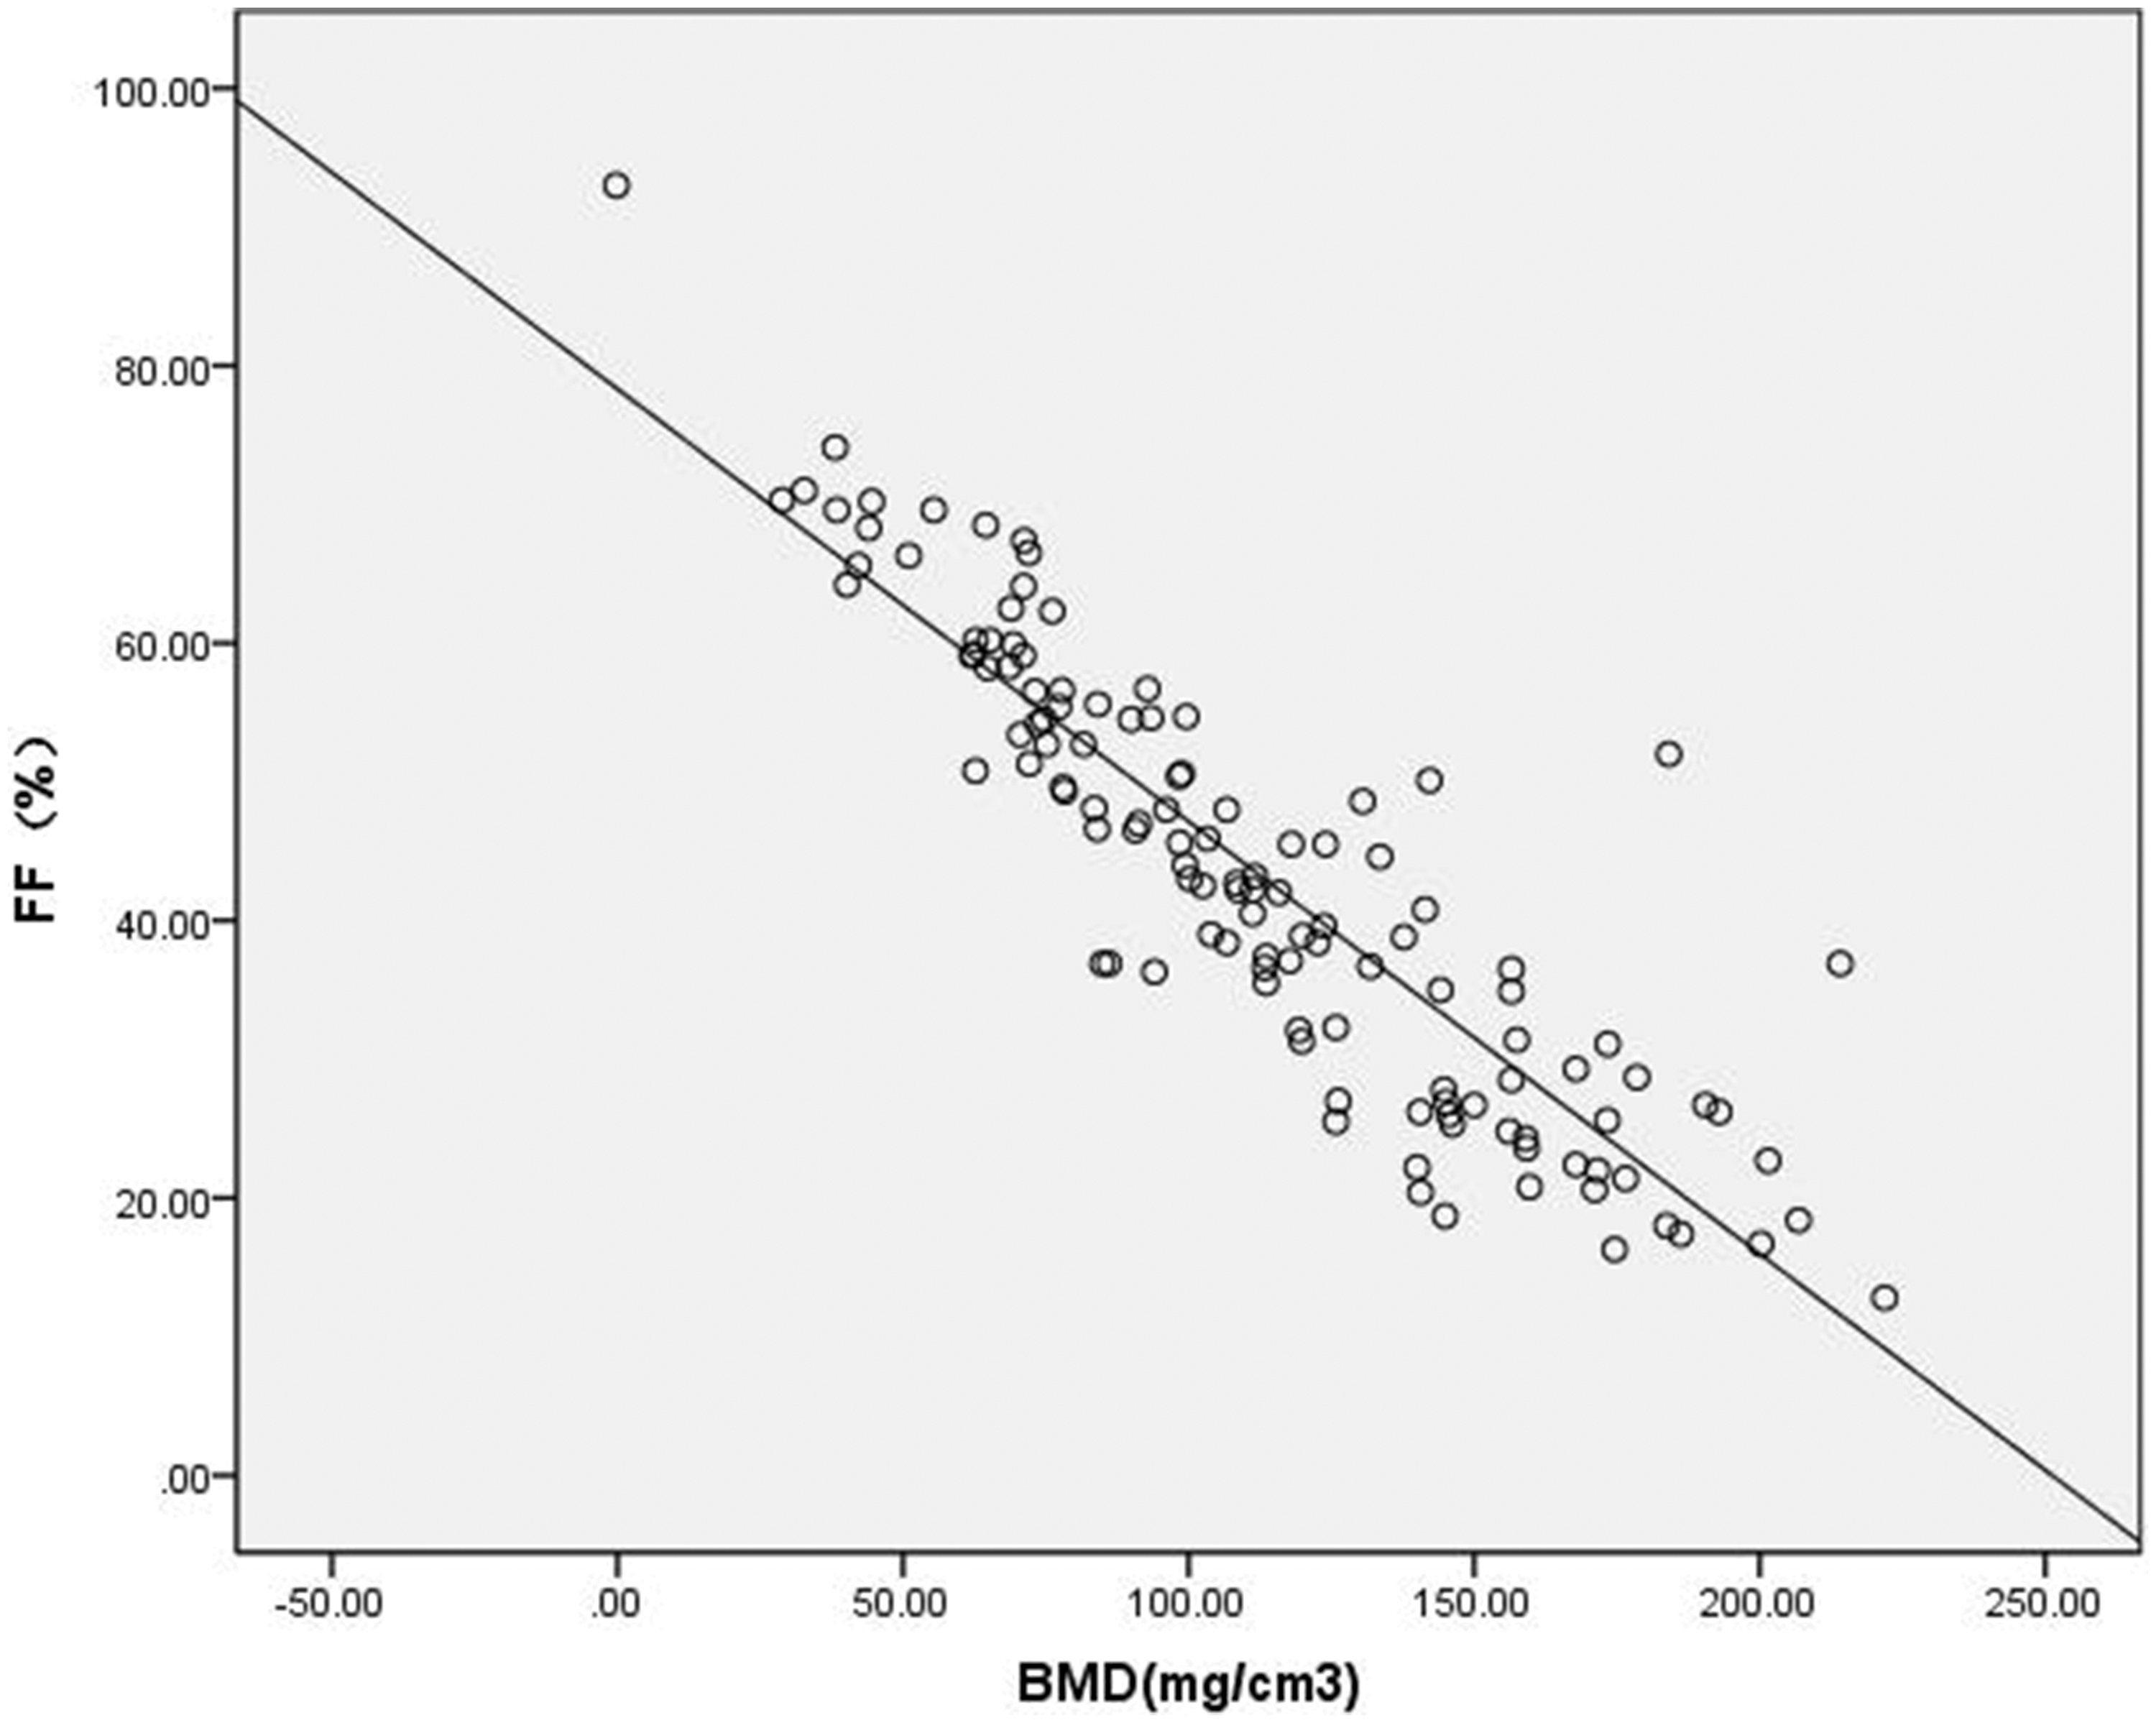
The FF values increased with decreasing BMD in both male and female participants. The FF values of the three bone density groups were significantly different (the normal bone density group was lower than those of the osteopenic and osteoporotic groups, and the osteopenic groups was lower than those of the osteoporotic groups for men and women, F = 30.33 and 161.24, respectively; P < 0.001) (Fig. 2), whereas there were no significant differences in the BMI values among the three bone density groups in men and women (P = 0.15). The FF values of male participants were significantly higher than those of the female participants in the normal bone density group (t = 10.62, P < 0.001), although the FF values between male and female participants were not significantly different in the osteopenic and osteoporotic groups (P = 0.24 and 0.12, respectively). In addition, the FF values were significantly negatively correlated with BMD for all participants (r = –0.82, P < 0.001) (Fig. 3). There is “slight evidence” of an association between the FF values and BMI for all participants (r = −0.175, P = 0.054) because it is so close to 0.05.
Graph showing the distribution of FF values of L2–L4 with varying BMD groups in different sex groups. There were significant differences in the FF values among the three bone density groups in men and women. Scatter diagram showing the negative correlation between FF values of bone marrow in the lumbar vertebrae and BMD for all participants (r = –0.820, P < 0.001).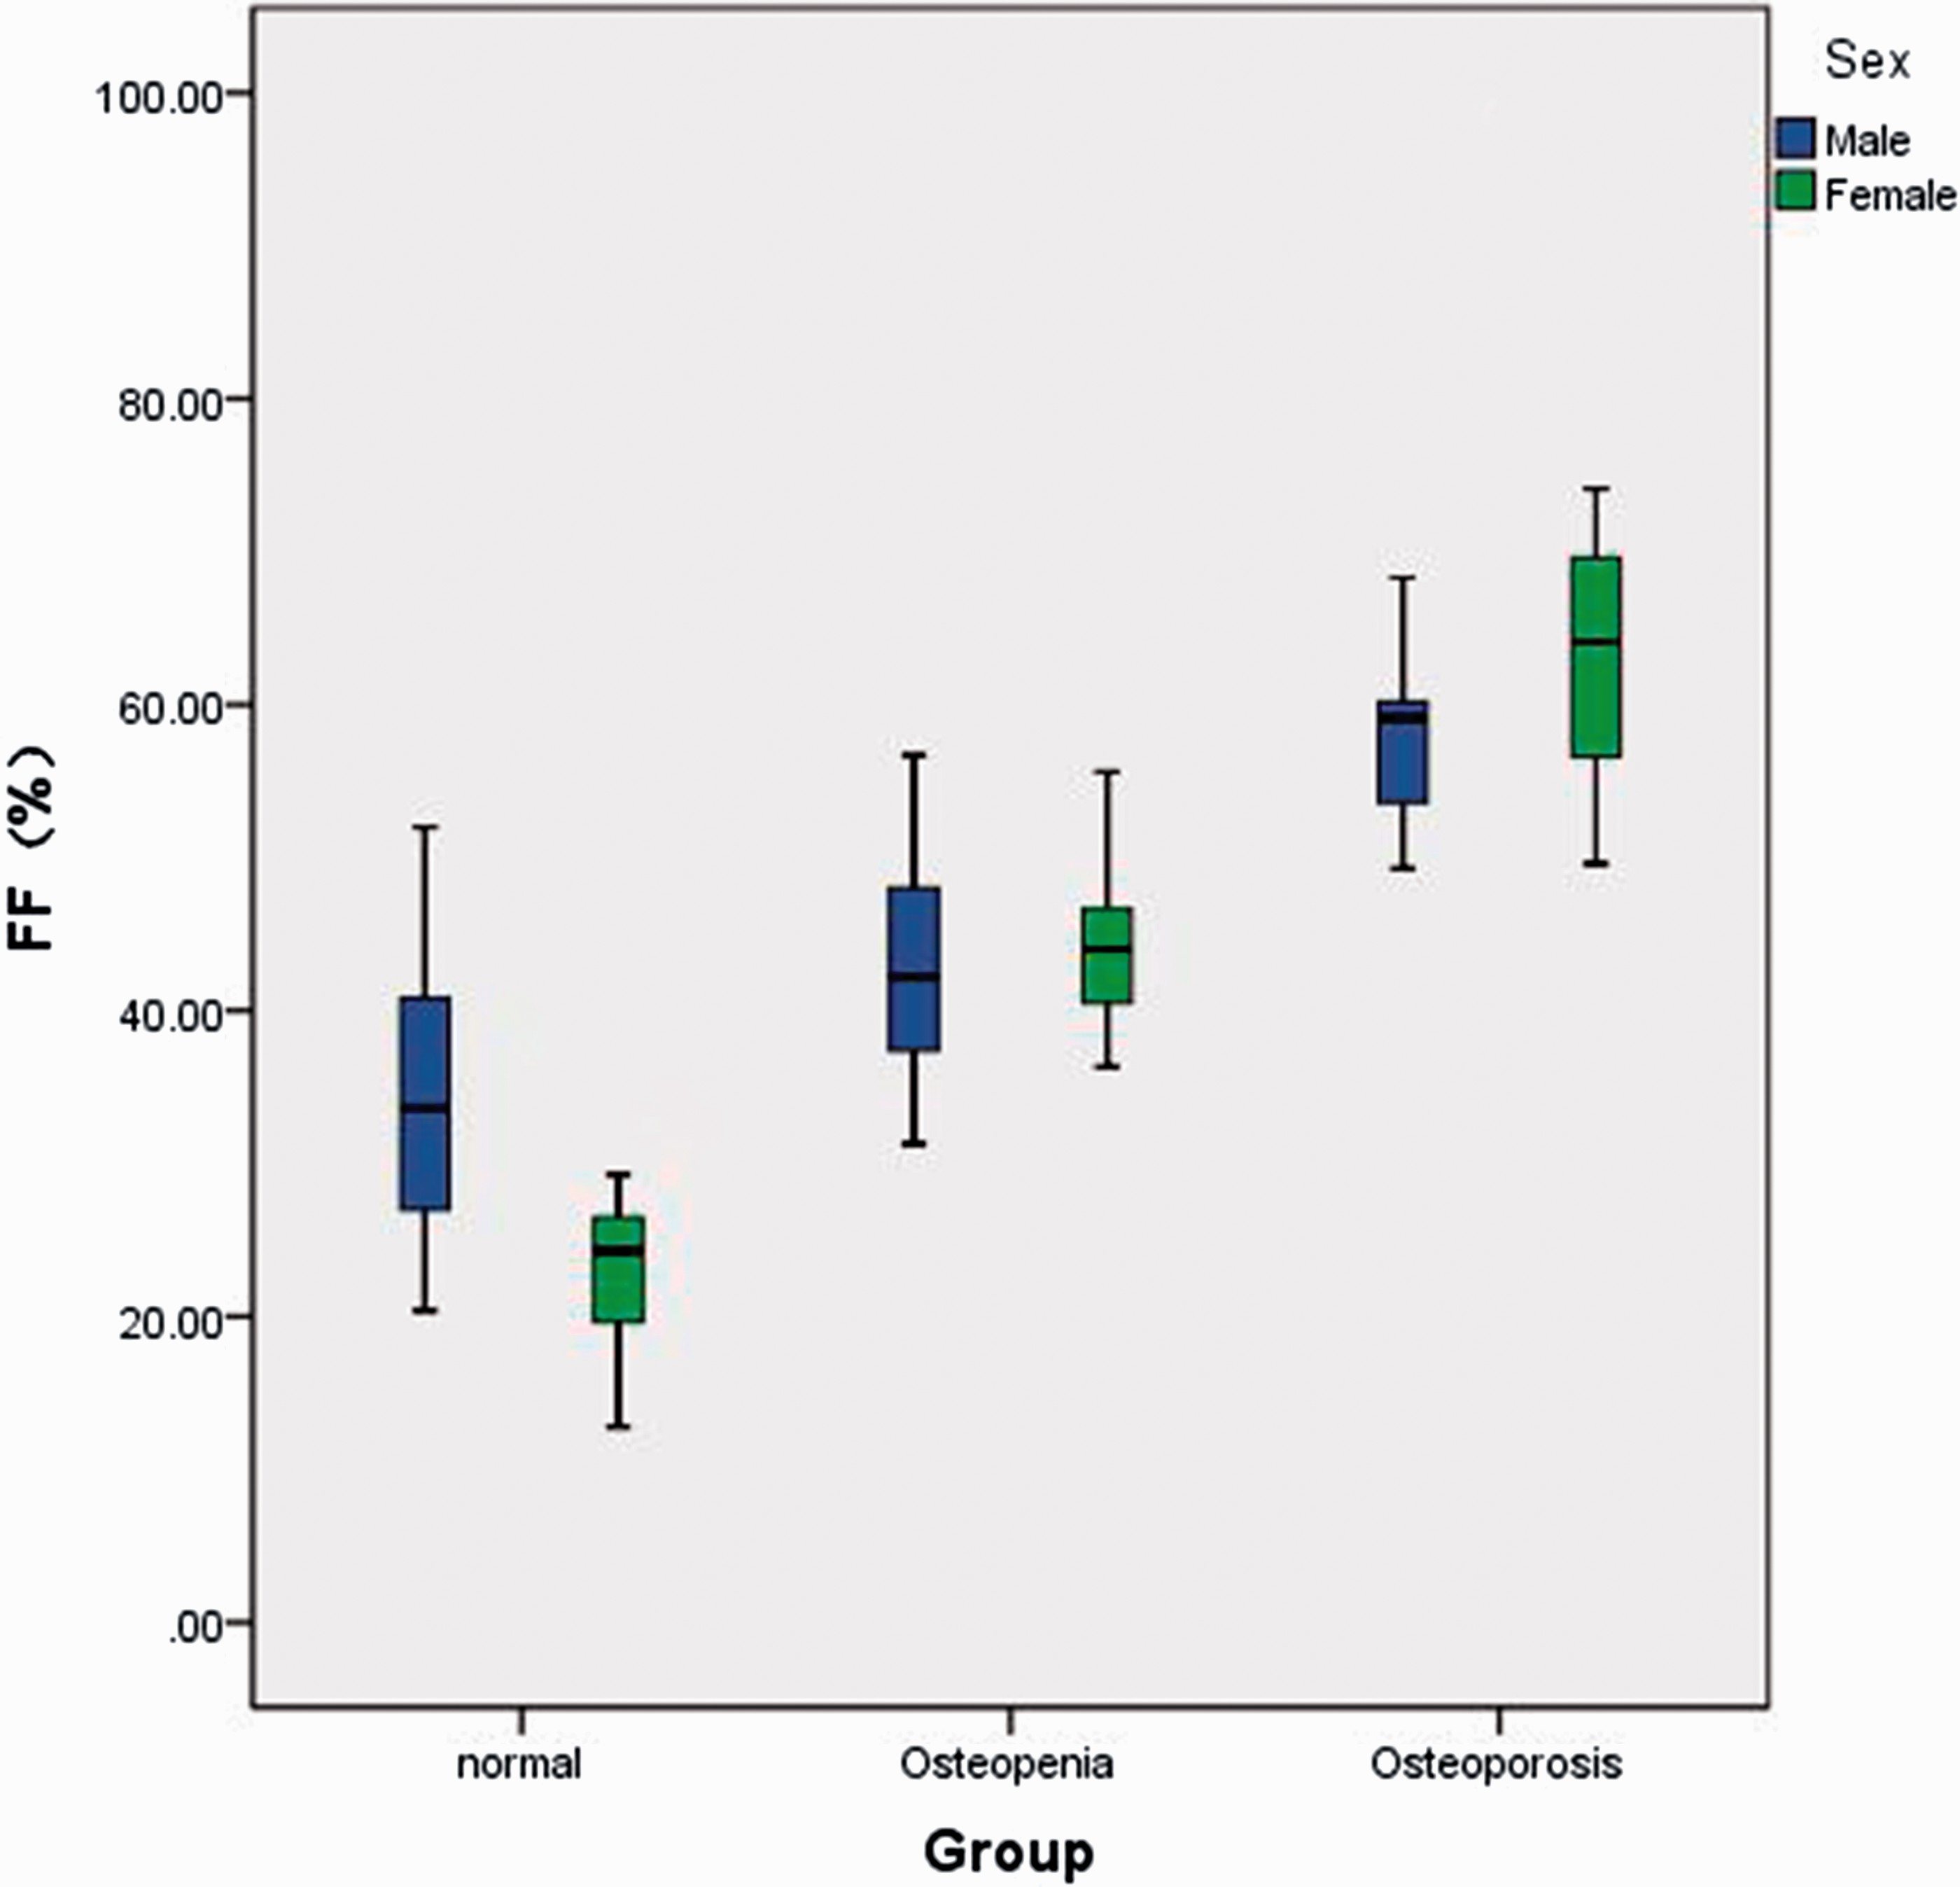
Discussion
We evaluated fat contents in vertebral bone marrow in this study in vivo 1H-MRS at a high field of 3-T quantitatively and non-invasively. The major advantages of acquiring spectral data at high field strength are increased SNR and wider spectral dispersion in frequency. Higher SNR allows either higher spatial resolution, i.e. smaller spectral acquisition box in the case of single voxel 1H-MRS, or shorter acquisition time. A small spectral box helps to improve shimming (i.e. the homogeneity of local external field strength) and consequently reduces the line width of the spectral peaks. The shorter acquisition time helps to minimize motion artifacts and allows time for data acquisition from multiple vertebral bodies rather than only one level. Certainly, high field strength may decrease the contrast between tissues with different time constants, especially T1W imaging, but it increased chemical shift effect and increased resolution of MRS in our study sequentially.
Our study measured the BMD of vertebral body with QCT rather than DXA. QCT has a greater diagnostic sensitivity than DXA, which was discussed in our previous paper (17).
The FF values in our study were lower than those of previous studies in normal BMD groups and osteopenic groups except the FF values in the osteoporotic groups were similar to these studies (5,12,18,19). The ages of our participants were lower than these studies in the normal BMD groups and osteopenic groups and were similar to these studies only in the osteoporotic groups; the subjects of these studies were older adults and postmenopausal women. Studies have shown a gradual physiological increase in bone marrow FF with advancing years. The average FF values of our study were obtained from the second to fourth lumbar vertebral body to reduce the variability measured in one vertebral level. The fat content tends to increase from L1 to L4 (7). The average BMD values were also measured from the same level.
The present study showed that the marrow fat content in vertebra tended to increase with decreasing BMD. Individuals with osteoporosis or osteopenia had a significantly increased marrow fat content compared with individuals with normal bone density. A statistically significant inverse correlation existed between FF values and BMD. A study using bone biopsy to assess marrow fat has also reported a relationship with osteoporosis, where histomorphometry has shown a negative association between bone marrow fat and bone formation rates (20). Changes in the differentiation programs that give rise to osteoblasts and adipocytes from mesenchymal stem cells in the marrow can favor adipogenesis over osteoblastogenesis, leading to increased marrow fat with reduced bone formation. In accordance with our investigation, the negative correlation between bone marrow fat content and bone density has been shown in multiple studies (4–12). However, the major limitation of these studies was the lack of evaluation of sex differences. Participants in these studies were only women (4, 6,10–12) and men (5). Our study used partial correlation analysis to exclude the influence of age on the results of increased bone marrow fat.
Our study indicated that the FF value of male participants was significantly higher than that of female participants in the normal bone density group. Some previous MRS studies have found that men have more vertebral bone marrow fat than women, and it was believed that increased fat marrow content in healthy men may be a physiologic phenomenon (9,13,21,22). Our finding is in agreement with these studies, although these earlier reports involved individuals with a wide age range whose bone density was unknown.
Our results indicate that there are sex differences for vertebral bone marrow fat and related to BMD. This sex difference only occurred in the normal bone density group. There were no significant sex differences in the osteopenic or osteoporotic groups. These sex differences may be due to the effects of sex hormone levels on bone marrow fat and bone. Higher estrogen levels have a negative influence on levels of marrow fat and a positive influence on bone density (23). Estrogen as well as testosterone levels are higher in older men compared with postmenopausal women (24). In fact, osteoporosis and osteopenia are most commonly seen in women aged > 50 years (mostly postmenopausal women). The FF values were markedly increased in osteoporosis and osteopenia in women. However, the increased extent of FF values in men were smaller than in women; therefore, the difference between the sexes disappeared in the osteoporotic and osteopenic groups. It is possible that the higher estrogen levels in older men compared with postmenopausal women may attenuate the relationship between bone marrow fat and BMD. Two studies found that before the age of 55 years, bone marrow fat is higher in men, but during the ages of 55–65 years, women experience a steeper increase in bone marrow fat while men have a gradual increase in bone marrow fat with aging (22,25). As a result, bone marrow fat is higher in women at older ages compared with men. Chen et al. (26) also found that women aged < 50 years have increased marrow perfusion compared with perfusion in men of similar ages, while women aged > 50 years have a more marked decrease in marrow perfusion compared with that in men of similar ages, which demonstrated the sex difference of the condition in bone marrow related to age. Our findings are in agreement with these studies, although the bone densities of the participants were unknown in these reports. Our previous study also showed that the sex difference for the diffusivity in bone marrow occurred in the normal bone density group, which demonstrated the sex difference of the condition in bone marrow related to BMD (17). The lower bone marrow fat in the normal BMD group of women noted in our study may suggest a possible relationship between bone marrow fat and the female sex hormone and deserves further investigation. Thus far, it remains unknown whether sex differences influence vertebral bone marrow conditions.
BMI is an accepted standard for judgment of obesity, so it is an important issue for the relationship between bone marrow fat and BMI. Relatively few MRI studies have examined the association between bone marrow fat and BMI. Our results indicated that the FF values were not significantly correlated with BMI but were at the border of statistical significance. A study reported that there were no significant correlations between vertebral bone marrow fat and BMI, meanwhile, there was a positive correlation between bone marrow fat and visceral fat (27). We know that higher visceral fat means higher BMI. It is not clear if marrow adipocytes play a role in the overall fat metabolism. The correlations between bone marrow fat and BMI is complex and remains an area of active investigation.
Our study had several limitations. First, in this study, the case distribution in the groups was slightly uneven, particularly for osteoporotic men. Second, we did not exclude all individuals with conditions which can affect the bone marrow condition, such as anemia. Third, we only focused saturated lipids rather than unsaturated lipids (smaller peaks) measured to bone marrow fat content, because resolution of the smaller peaks is difficult, even at 3 T.
In conclusion, our study demonstrated sex-related differences in the vertebral bone marrow fat content with varying bone densities. In particular, the FF value was inversely correlated with BMD and a sex-related difference was observed in the normal BMD group. MRS techniques might have some value in estimating bone marrow changes associated with osteopenia and osteoporosis.
Footnotes
Declaration of Conflicting Interests
The author(s) declared no potential conflicts of interest with respect to the research, authorship, and/or publication of this article.
Funding
The author(s) received no financial support for the research, authorship, and/or publication of this article.