
Abstract
Background
There is a high prevalence of musculoskeletal disorders in the Norwegian population. A significant number of these patients are referred to diagnostic imaging. Geographical variations in the use of imaging for musculoskeletal disorders may display over- or underuse, and knowledge about these variations is required.
Purpose
To investigate geographical variations in diagnostic imaging of the musculoskeletal system and analyze variations in the use of these examinations of all musculoskeletal diagnostic imaging, the specific modalities, and specific examinations.
Material and Methods
Population rates from Statistics Norway and outpatient radiological procedures of the musculoskeletal system registered at the Norwegian Health Economics Administration (HELFO) the first half of 2016 were accessed. The HELFO data were age-adjusted; high/low ratios were calculated as rates in number of examinations per 1000 inhabitants. A high/low ratio of 1 = equal use, 1.5–1.9 = moderate variation (approximately 50% difference), and > 2 (twice as much) = high variation.
Results
Geographical variations were demonstrated at all levels, with an overall high/low ratio of 1.3. For specific modalities the highest variation was for ultrasound (3.2) and CT (2.2). For individual examinations, the highest high/low ratios were observed for MRI of the shoulder (2.4) and radiography of the lower back (1.9) and shoulder (1.8).
Conclusion
We demonstrate a moderate to high geographical variation in the use of diagnostic imaging of the musculoskeletal system. This variation can indicate over- or underuse, which may violate basic principles of equity, priority, setting and appropriate care, and needs further attention.
Keywords
Introduction
Significant geographical variations in the use of health services in Norway have been demonstrated. The Health Atlas (helseatlas.no) has, among others, demonstrated variations in diagnosis and treatment in pediatric outpatient surgery (1). Geographical variations in the use of diagnostic imaging have been identified in Norway and internationally, in general (2–8), as well as of the musculoskeletal system, in particular (9–11).
Variations in the use of health services are not problematic if the variation is due to differences in morbidity or preferences in the population (for preference-sensitive services). However, variations are problematic if they are the result of over- or underuse because they violate the ethical principles of the health services, such as the principle of equity, priority setting (resource allocation and opportunity cost), and appropriate care.
Musculoskeletal disorders have a high prevalence; approximately 75% of all Norwegian adults will experience some kind of pain of the musculoskeletal system at any point in time. Most of these cases are mild ailments that do not require treatment (12). On the other hand, 19% of all medical consultations in Norway are estimated to involve ailments from the musculoskeletal system (13).
A significant number of these patients are examined by diagnostic imaging, and geographical variations are demonstrated in the use of diagnostic imaging for this patient group (5, 9, 10). Most recently, the Office of the Auditor General of Norway published a report about the use of outpatient diagnostic imaging, which also identified geographical variations, as well as high utilization of examinations with unclear benefit, such as magnetic resonance imaging (MRI) of the shoulder (14).
This report does not include conventional radiography (CR) and ultrasound (US), and thereby not all radiological examinations of the musculoskeletal system. The recent focus on the appropriateness of radiological procedures internationally (e.g. the Choosing Wisely Campaign) (15) and by European radiation protection authorities (16) as well as the focus on geographical variations seen in healthcare practice, all underscore the importance of investigating geographical variations in this significant part of diagnostic imaging.
The aim of this study was to investigate geographical variations in diagnostic imaging of the musculoskeletal system and analyze county-based variations in the use of these examinations as a whole (all outpatient examinations performed) for the specific modalities and examinations.
Material and Methods
The data used in this study are the total number of radiological examinations registered at the Norwegian Health Economics Administration (HELFO). The examinations are registered as Norwegian Classification of Radiological Procedures (NCRP) codes. HELFO registers the data of outpatient examinations performed at public hospitals and private institutions. Any inpatient examinations and examinations covered by insurance or paid in full by the patient are not included in these data. The NCRP codes included were those applied for examinations of the musculoskeletal system, i.e. examinations of the upper and lower extremities, shoulder, clavicle, pelvis, hip joint, and spine. All modalities are included, i.e. CR, MRI, computed tomography (CT), and US.
The data were provided by HELFO, on our request, in the form of Excel spreadsheets containing raw data about examinations performed in the first half of 2016. The data contained information about the treatment institution, the patient’s county of residence, and type of examination. The NCRP codes contained further information about modality (such as CR or MRI) and location (which body part was examined, such as lower back), resulting in the examination code with code explanation. The examination code was the most detailed level and indicated the specific examination performed (e.g. MRI of the knee) (14). In addition, information regarding age was included, in the form of ten-year age groups spanning from 0–9 years up to 100+ years. All counties in Norway were included in the data.
A total of 810,493 radiological examinations were performed in the selected time period. The least frequent examination was performed 26 times and the six least frequent specific examinations were performed < 1000 times, meaning that all natural variation (natural fluctuations that cannot be avoided) will make a significant impact on the high/low ratio calculation. Natural variations in smaller samples can make it seem that the variation is greater than it is in reality, since small variations will seem greater in smaller samples.
In order to avoid this, high/low ratio calculations were only performed on the examinations performed 20,000 times or more, which constituted the 10 most frequently used examinations. It was difficult to estimate how much of the variation was due to natural variation. However, if the examination was more common, the values were more precise due to the larger amount of data (17).
A direct age adjustment was performed, using the 2016 Norwegian population as the standard population. The population data were obtained from Statistics Norway and the same ten-year age groups as in the data from HELFO were used. All counties were included.
Direct age adjustments were performed in three steps. The first step was to calculate age-specific consumption rates. In this case, it was calculation of the number of examinations per 1000 inhabitants for the different age groups. In the second step, this age-specific rate was used to calculate an estimated number of examinations performed per 1000 inhabitants for the age group, if they were hypothetically the standard population. For example, there were 626,576 children in Norway aged 0–9 years in the first half of 2016, and the age-specific rate of the utilization of X-ray of the knee for one county was 2.5. Therefore, the estimated number of examinations was: 2.5/1000 × 626,576 = 1554.3. These calculations were made for all age groups, giving a total estimated number for the population of interest. The last step was to calculate the age-adjusted rates, expressed as the number of examinations performed per 1000 inhabitants.
The total estimated number for the population of interest was then applied to the standard population. For example, the total estimated number of examinations for knee X-ray in Norway was 69,465.6; there were 5,258,317 inhabitants in the first half of 2016, giving this equation as 69,465.6/5,258,317 × 1000 = 13.2 (age-adjusted rate) (18). These calculations were based on the patients’ registered county of residence rather than the treatment institution. This means that even if a patient residing in Oslo underwent an examination elsewhere in the country, the examination was registered and counted for in Oslo.
Variation in the utilization of the specific examinations between counties of residence were calculated as the ratio between the highest and lowest consuming county of residence, as the analysis performed by the Office of the Auditor General of Norway (14). A ratio of 1 indicated that the consumption was equal, a ratio of 1.5–1.9 was considered a moderate variation (the highest user had a 50% higher consumption than the lowest), and a ratio of ≥ 2 was considered a high variation (the highest user had twice the consumption of the lowest) (14).
All data analysis was performed in Microsoft Excel 2013 (19).
Results
The age-adjusted consumption rates for examinations of the musculoskeletal system ranged from 194.9 per 1000 inhabitants as the highest, to 145.0 per 1000 inhabitants as the lowest, giving a high/low ratio of 1.3. The high/low ratio between the next highest consumption rate (187.6) and the next lowest consumption rate (149.3) was 1.2, which was a low overall variation. The age-adjusted consumption rates for all the counties are summarized in Table 1.
Age adjusted number of examinations per 1000 inhabitants, according to modality and county in 2016, with the high/low ratio for all modalities and the total age adjusted number of examinations performed in the first half of 2016.
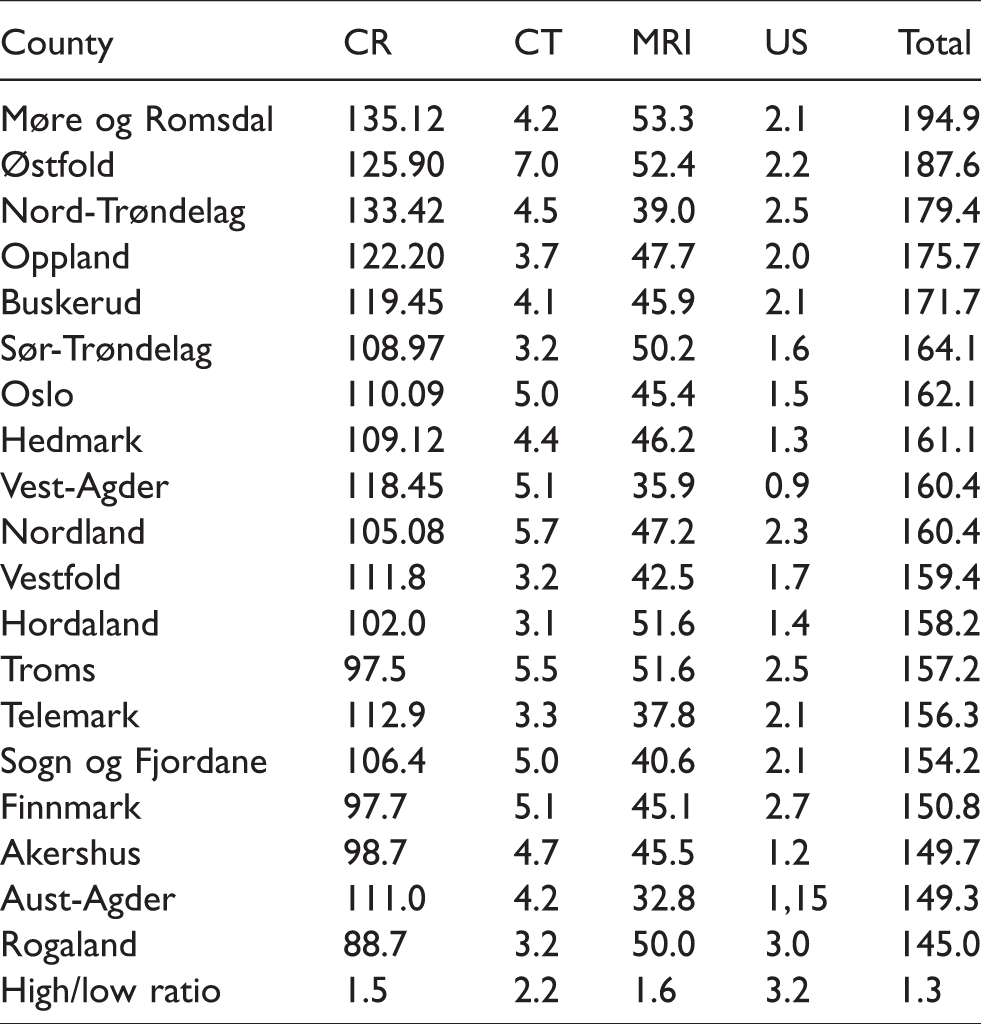
The most frequently used modality for the examination of the musculoskeletal system, both overall and for the 10 most frequently used examinations, was CR followed by MRI (Table 2). CT and US constituted only a small portion of the total number of examinations performed. There was also a moderate to high variation for the use of the different modalities. CR and MRI had a moderate variation with a high/low ratio of 1.5 and 1.6, respectively. The number of CR examinations ranged from 135.1 examinations per 1000 inhabitants to 88.7 examinations per 1000 inhabitants, whereas the MRI examinations ranged from 53.3 per 1000 inhabitants to 32.8 per 1000 inhabitants. Both CT and US had high variation, with a high/low ratio of 2.2 and 3.1, respectively. The number of CT examinations performed ranged from 7.0 per 1000 inhabitants to 3.1 per 1000 inhabitants, whereas the number of US examinations ranged from 3.0 per 1000 inhabitants to 0.9 per 1000 inhabitants.
Geographical variation for the 10 most frequently used examinations, showing the highest and lowest frequency (number of performed examinations per 1000 inhabitants) and the high/low ratio (the difference between the highest and lowest frequencies).
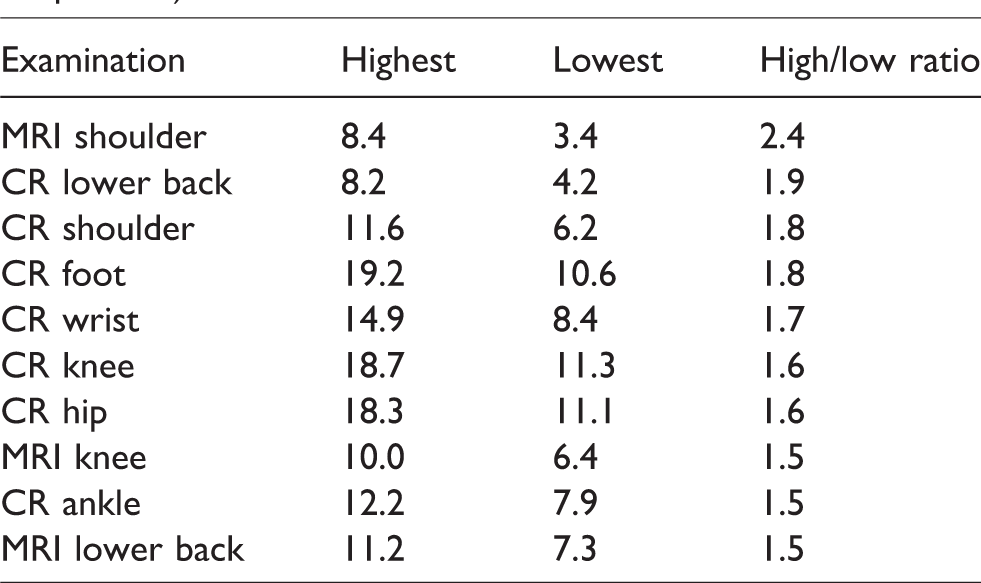
The 10 most frequently performed examinations were CR of the lower back, shoulder, foot, wrist, knee, hip, and ankle, and MRI of the shoulder, knee, and lower back (Table 2). MRI of the shoulder had a high variation (high/low ratio 2.4), CR of the lower back, shoulder, and foot had moderate to high variation (1.8–1.9), whereas the rest of the examinations had moderate variation (1.5–1.7). See Table 2 for the high/low ratio for the 10 most frequently used examinations.
Discussion
Using the high/low ratio, a moderate to high variation in all modalities was demonstrated. There was high variation in the use of US (3.20) and CT (2.28), as well as moderate variation in the use of MRI (1.62) and CR (1.52). Although the highest variation was observed for US and CT, this must be interpreted with caution, as the total use of these modalities was low, making the impact of natural variations in the use of healthcare services more significant. Moderate to high variation for all 10 of the most frequently used examinations, in which the highest variation was found in the use of MRI of the shoulder (2.45) and CR of the lower back (1.94). We also found that a few counties that stood out as high consumers of diagnostic imaging of the musculoskeletal system in total, with respect to the different modalities, and even for specific examinations. This same pattern was not observed for the counties that were regarded as low consumers based on the total consumption.
The findings for the MRI examinations were consistent with those by the Office of the Auditor General of Norway; however, their analysis did not investigate the use of CR and US (14). A Norwegian study from 2002 led to different results regarding the high-rate and low-rate counties; however, these numbers cannot be compared to the results from this study for several reasons (6). First, in 2002 the target was the total number of radiological procedures, whereas in this study only outpatient procedures are included. Second, the NCRP codes used in this study had a different focus, more suitable for reimbursement calculations, than the earlier coding system NORAKO used in 2002, more suitable for dose calculations. Third, the 2002 study (mainly) used data from the institutions, rather than the patient’s registered county of residence.
When compared to international studies that also used the high/low ratio as a measurement, the CR, CT, and MRI high/low ratios in our study has a somewhat higher variation, at 1.52, 2.28, and 1.62, respectively, compared with those observed in the USA (1.31, 1.51, and 1.78, respectively) (9). This could be because of different practice patterns in the two countries, differences in the structure of the healthcare services, differences in availability and costs of the services, and differences in guidelines provided.
In our study, MRI of the shoulder had the highest variations, which is an examination for which the appropriateness has been questioned. The estimates of overutilization of shoulder MRIs is in the range of 45–90% (20–22). The high variation seen in shoulder MRI in our study may be a sign of overutilization to some degree. This variation could also be explained by a lack of awareness of the Norwegian musculoskeletal guidelines or that this was unclear on shoulder conditions and therefore not adhered to. If this leads to differences in practice patterns based on the referrers preferred modality, it can violate the principle of equity with a skewed distribution of the available resources.
Even though MRI does not expose the patient to ionizing radiation, there are some risks and consequences associated with the overutilization of shoulder MRI, such as false-positive test results and unnecessary surgical treatment (22). MRI is also an expensive modality and a significant burden on radiology departments (21), requiring more resources than other modalities. This makes the overutilization not only a risk for the patient, but also a strain on the health services. Additionally, it represents an opportunity cost, as other patients in more need may have delayed or deprived access.
Seven of the 10 most frequently used examinations were CR, which are examinations that are associated with high availability, low cost, and few risks. Our study demonstrated moderate to high variation in all of these examinations. Variations in these services could be explained by variations in practice patterns, which indicate a lack of adherence to the guidelines. Because of the low costs and few clinical risks, there may also be less focus on appropriateness of CR examinations compared to modalities such as CT and MRI.
However, there are some risks involved for CR of the lower back and this is the examination with the second highest variation in our study. X-rays of the lower back is the CR examination with the highest radiation dose. In Norway, the representative radiation dose is 1.3 mSv for CR of the lower back (23). In addition to this, as much as 50% of all lower back CR may be inappropriate, leading to unnecessary exposure to radiation, but also an unnecessary cost, according to a Finnish study (24).
Variations in the use of diagnostic imaging of patients with lower back pain can be explained by factors such as the belief of some patients and clinicians that imaging is essential in the management of lower back pain (25), and availability of the imaging services (26). In the same patient group, economic factors have been found to be a factor that could explain a great part of the variation in the use of early MRI. (10).
We cannot ignore the fact that other factors can explain the variations found in our study, such as differences in morbidity associated with age (despite our age adjustment) and socioeconomic factors, even if the socioeconomic differences in the high-rate and low-rate counties can be said to be minimal, as well as differences based on gender. Natural variations will also be found; however, these can be expected to be minimal. A multitude of factors may affect the variation in use of diagnostic imaging and studies of these variations do not say anything about the correct level of use. Nonetheless, they indicate whether there is a likely over- or underuse of a specific examination.
Another limitation of this study is a small sample used in the statistical analysis, making the impact of natural variation somewhat higher than in a larger sample. Furthermore, the data were collected in a very short time span, which only provides a snapshot of the situation, rather than trends over time, which could have been of interest to evaluate the geographical variation. The study is also based solely on the number of examinations, without information regarding justification of the examinations; for example, some of these examinations could have cardiovascular indications rather than musculoskeletal indications, some could be a part of cancer diagnosis or controls, among other things. Lastly, examinations done in an inpatient setting and examinations paid in full by patients or by insurance are not included, which can lead to the results being biased.
In conclusion, we demonstrated a moderate to high variation in the use of diagnostic imaging of the musculoskeletal system. The variation then ranges from a 50% difference in examination frequency between the highest and lowest consumer, up to a 100% difference. This indicated that there might have been an overuse in some counties and underuse in others, which in turn can violate basic ethical principles for the health services. There are many and various reasons for these differences, making geographical variation an interesting and challenging phenomenon that needs further attention. It also brings attention to the efforts to reduce this geographical variation in radiological services, for example through facilitating guideline adherence.
Footnotes
Acknowledgments
Declaration of Conflicting Interests
The author(s) declared no potential conflicts of interest with respect to the research, authorship, and/or publication of this article.
Funding
The author(s) received no financial support for the research, authorship, and/or publication of this article.