
Abstract
Background
The combined prognostic value of texture analysis on computed tomography (CT) and conventional magnetic resonance imaging (MRI) in oral and oropharyngeal squamous cell carcinoma (OOSCC) has rarely been reported.
Purpose
To evaluate the ability of texture-based heterogeneity indices extracted from CT and conventional MRI to predict the overall survival (OS) of OOSCC patients.
Material and Methods
Eighty-eight patients with OOSCC underwent contrast-enhanced CT, and T2-weighted (T2W) and contrast-enhanced T1-weighted (T1W) imaging. For each imaging protocol, four histogram (HISTO) and six gray-level co-occurrence matrix (GLCM) parameters were extracted. Intraclass correlation coefficients (ICCs) were used to evaluate variation in inter-observer delineation. The association of clinicopathologic factors and texture parameters with OS was analyzed using log-rank testing and Cox regression. The Harrell Concordance Index (C-index) was used to evaluate the prognostic performance of the predictors and Cox model.
Results
Higher inter-observer delineation agreement of texture analysis on contrast-enhanced T1W imaging was observed relative to that on CT and T2W imaging. T stage (P = 0.026, hazard ratio [HR] = 2.35), GLCM_Entropy on CT (P = 0.003, HR = 3.15), and HISTO_Energy (P = 0.036, HR = 0.27) and HISTO_Skewness (P = 0.026, HR = 0.41) on contrast-enhanced T1W imaging were independent predictors for the OS of OOSCC patients. The multivariate Cox model performed strongly in predicting OS, with a significantly higher C-index than the independent predictors separately (C-index: 0.751 vs. 0.600–0.627, P < 0.005 for all).
Conclusion
Texture analysis using CT and conventional MRI could provide a valuable method for survival stratification of OOSCC patients.
Keywords
Introduction
Oral and oropharyngeal squamous cell carcinoma (OOSCC) is one of the most common malignant tumors worldwide (1,2). Nearly two-thirds of patients present with locally advanced disease at the diagnosis and only 30–50% of these patients live for three years after the initiation of standard therapy (3,4). The intra-tumor heterogeneity of OOSCC has been proposed to be one of the major underlying factors of tumor progression and resistance to radiochemotherapy (5,6). It is therefore necessary to explore the relationship between intra-tumor heterogeneity and survival in OOSCC.
Percutaneous biopsy and postoperative pathology are commonly used for intra-tumor characterization. However, these procedures are invasive and fail to provide comprehensive information for the entire tumor. It has been accepted that intra-tumor heterogeneity occurs at the molecular level but is reflected macroscopically by the texture patterns within medical images (7).
“Image texture” refers to the complex pattern within an image. Texture analysis allows mathematic evaluation of the subtle spatial arrangement of an image’s pixels. Over the past few years, texture analysis has increasingly been investigated as a method to predict treatment outcome and survival in patients with colorectal cancer, pulmonary adenocarcinoma, esophageal cancer, or glioblastoma (7–10). Studies have shown that the texture features of computed tomography (CT) images are predictive of the overall survival (OS) and treatment outcome of patients with OOSCC (2,11). Compared with CT, magnetic resonance imaging (MRI) provides enhanced contrast of soft tissue. However, the prognostic value of texture analysis on conventional MRI in OOSCC has been reported rarely (12,13).
We wished to evaluate the ability of the indices of texture-based heterogeneity extracted from CT and conventional MRI to predict the OS of patients with OOSCC.
Material and Methods
Patients
The protocol for this retrospective study was approved by the ethics committee of our hospital and the requirement for obtaining informed consent from patients was waived.
A comprehensive search of our institutional database for medical records from July 2011 to April 2015 was undertaken to identify patients with OOSCC. Patients were included based on the following criteria: (i) OOSCC confirmed by postoperative pathology (tumor–node–metastasis (TNM) stage: I–IV); (ii) short axis of mass ≥5 mm; and (iii) contrast-enhanced CT and conventional MRI undertaken before treatment. The exclusion criteria were: (i) prior history of head and neck cancer or receipt of treatment before imaging; and (ii) poor image quality that made tumor segmentation difficult and texture analysis inaccurate (e.g. motion or metal artifacts).
The clinicopathologic characteristics of patients were recorded: demographic information (age, sex); risk factors (tumor volume, tobacco use, location of primary mass); pathologic TNM stage; histology grade; and treatment. The TNM stage was determined using the 7th American Joint Committee on Cancer TNM Staging System Manual (14). In the present study, OS was defined as the time from preoperative examination until the date of death from any cause, or the date of the final follow-up.
Image acquisition
Patients underwent CT using 64 detector-row machines (Brilliance 64; Philips Medical Systems, Cleveland, OH, USA). The parameters of contrast-enhanced CT were: 120 or 140 kV; 240 or 398 mA; slice thickness = 0.6 or 1 mm; matrix = 512 × 512; field of view (FOV) = 240 × 240 mm; 60s delay after intravenous injection of contrast (60–100 mL; ioversol and iohexol).
Patients underwent MRI using a head and neck array coil with a 1.5-T scanner (Signa Excite; GE Medical Systems, Milwaukee, WI, USA). The parameters of MRI acquisition were: axial fat-suppressed T2-weighted (T2W) imaging sequence (repetition time [TR]/echo time [TE] = 4520/87 ms; matrix = 512 × 512; FOV = 240 × 240 mm; thickness = 4 mm; gap = 3 mm); and axial fat-suppressed contrast-enhanced T1W imaging sequence (TR/TE = 700/9 ms; matrix = 512 × 512; FOV = 240 × 240 mm; thickness = 3 mm; gap = 4 mm; delay of 8–10 min after intravenous injection of contrast (0.1 mmol/kg body weight; Magnevist, Schering, Berlin, Germany).
Image analysis
For each primary cancer, a volume of interest (VOI) was drawn on all slices of a visible tumor using ITK-SNAP software (www.itksnap.org). The necrosis components were included in the VOI. For each case, the tumor was outlined by two independent radiologists (with three and seven years of experience in CT- and MRI-based interpretation of head and neck diseases, respectively) blinded to the final survival results. The mean value of the two measurement results was adopted for survival analysis.
All texture features were calculated using LIFEx software (www.lifexsoft.org) (15). Four histogram (HISTO) features (kurtosis, skewness, energy, and entropy) and six gray-level co-occurrence matrix (GLCM) features (contrast, correlation, dissimilarity, energy, entropy, and homogeneity) were extracted from each imaging protocol. Before computation of texture features, voxel intensities were discretized to 128 gray levels. In addition, voxel values were rescaled automatically between mean ± 3SD, where the mean and SD are the mean value and standard deviation of the voxels within the VOI. The texture features were interpreted in detail and are shown in the Supplementary File.
Statistical analysis
R statistical and computing software (www.r-project.org) was used to undertake statistical analysis.
The inter-observer delineation agreements for texture analysis on CT and MRI were assessed using intraclass correlation coefficients (ICCs) based on the level of agreement: 0–0.40 = poor; 0.40–0.59 = fair; 0.60–0.74 = good; and 0.75–1.00 = excellent (16). ICC ≥0.75 was selected as an accepted reliability. Only the texture features considered to be “stable” were used for survival analysis.
The Kaplan–Meier method and log-rank testing were used for univariate analysis. The analyzed variables were clinicopathologic factors and texture parameters. Continuous variables, such as age, tumor volume, and texture parameters, were dichotomized before log-rank testing based on the optimal threshold values obtained using the “surv_cutpoint” function of the “survminer” R package. The function could determine the cut-off point by using the maximally selected rank statistics from the “maxstat” R package, which is an outcome-oriented method providing a value that corresponds to the most significant relation with survival. For log-rank testing, P < 0.05 was considered significant. Due to the small sample size, significant textural parameters yielding <20 patients per group for comparison were not reported or censored.
Multivariate Cox regression analysis (stepwise) was used to identify the independent predictors of OS. The Harrell Concordance Index (C-index) was used to evaluate the prognostic performance of the predictors and Cox model.
Results
The study population consisted of 88 patients (61 men, 27 women; mean age = 58 ± 10.6 years). Median follow-up was 1055 days. During follow-up, 28 patients (32%) died and the probability of 36-month OS was 65%. The clinicopathologic characteristics of patients are summarized in Table 1.
Patient characteristics.
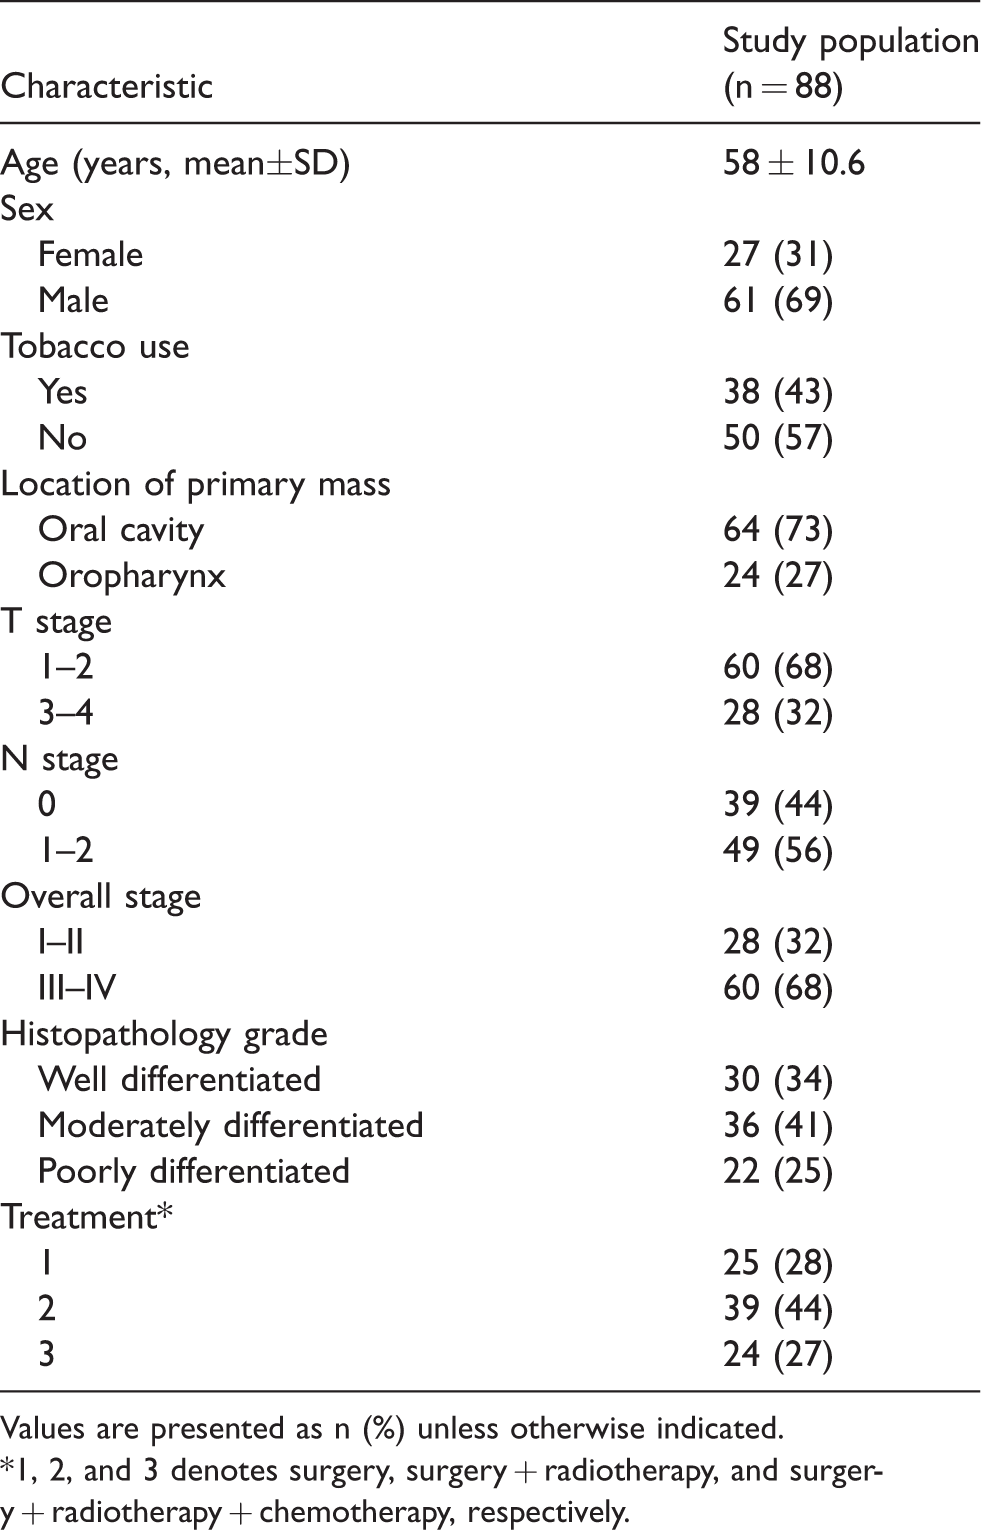
Values are presented as n (%) unless otherwise indicated.
*1, 2, and 3 denotes surgery, surgery + radiotherapy, and surgery + radiotherapy + chemotherapy, respectively.
Higher delineation agreement of texture analysis based on contrast-enhanced T1W imaging (ICCs = 0.72–0.94) between observers was shown relative to that based on CT (0.31–0.85) and T2W imaging (0.44–0.93). Five features from CT, five features from T2W imaging, and nine features from contrast-enhanced T1W imaging considered to be stable were used for survival analysis. The ICCs for these three imaging sequences are shown in Table 2.
Inter-observer ICCs for texture analysis for different imaging protocols.
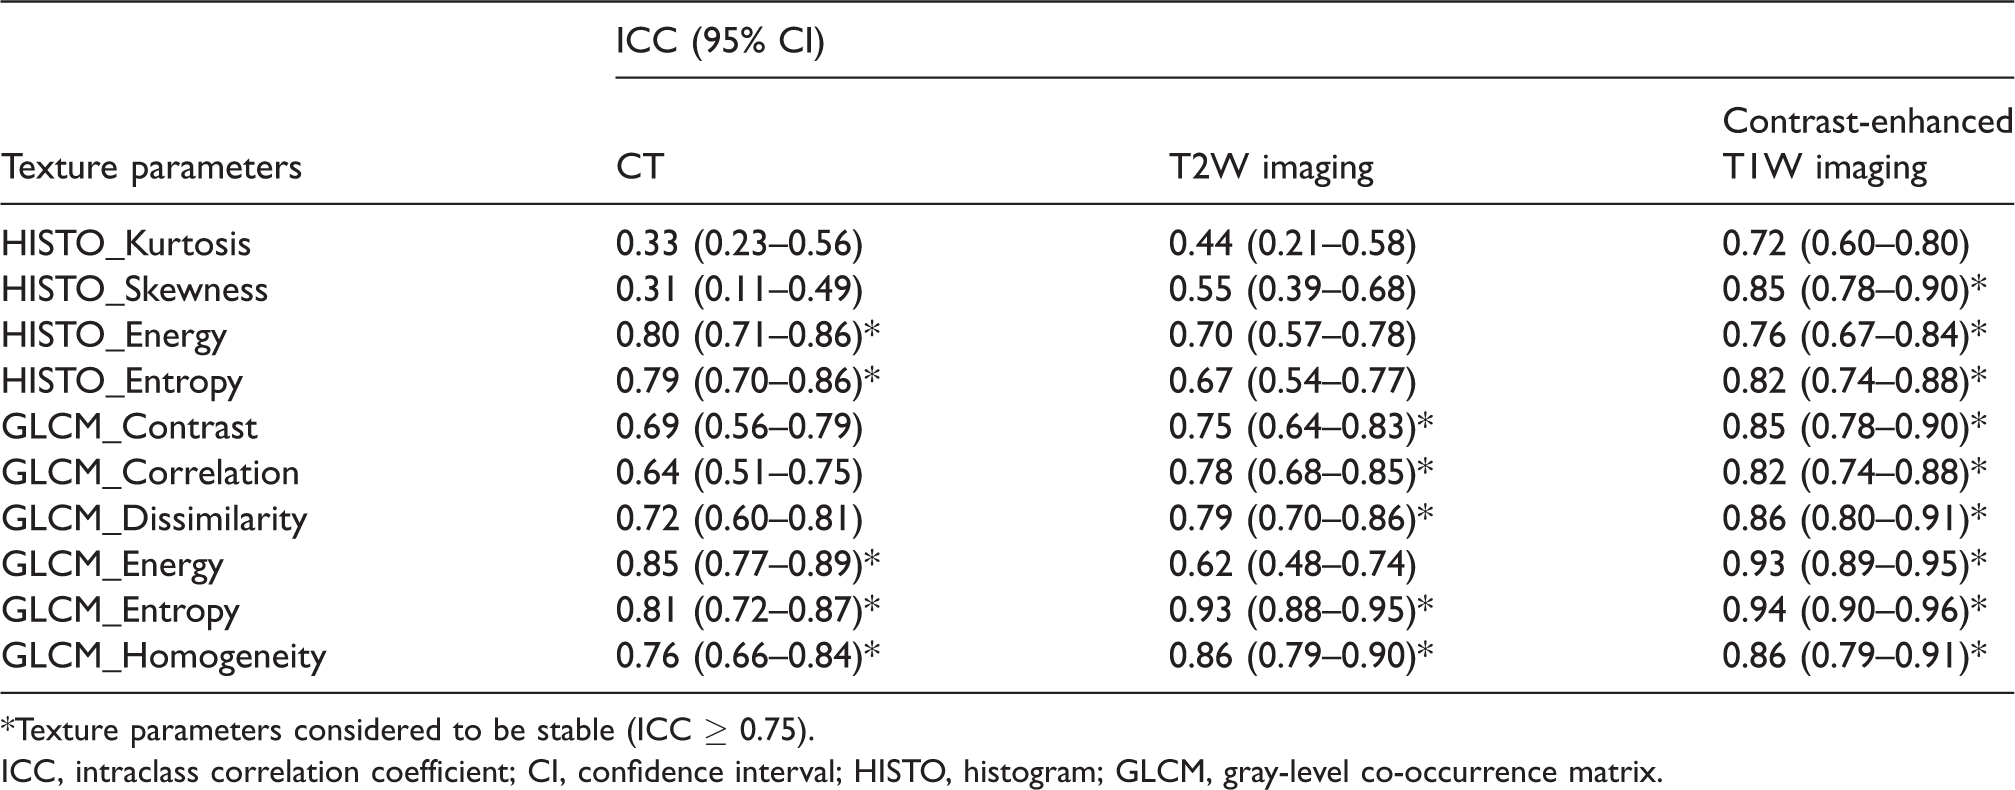
*Texture parameters considered to be stable (ICC ≥ 0.75).
ICC, intraclass correlation coefficient; CI, confidence interval; HISTO, histogram; GLCM, gray-level co-occurrence matrix.
With regard to clinicopathologic factors, tumor volume, T stage, N stage, and TNM stage were associated significantly with the OS of patients with OOSCC (P < 0.05 for all); significance was not found in age, sex, tobacco use, location of primary mass, histology grade, or treatment (P > 0.05 for all). With respect to texture features, higher GLCM_Entropy on CT and HISTO_Entropy, GLCM_Entropy and GLCM_Homogeneity on contrast-enhanced T1W imaging were associated significantly with lower OS (P < 0.05 for all). Lower GLCM_Energy on CT and HISTO_Energy, HISTO_Skewness and GLCM_Contrast on contrast-enhanced T1W imaging were associated significantly with lower OS (P < 0.05 for all). Significant differences in OS were not found according to the texture features from T2W imaging.
Multivariate Cox analysis showed that T stage (P = 0.026, hazard ratio [HR] = 2.35), GLCM_Entropy on CT (P = 0.003, HR = 3.15), HISTO_Energy (P = 0.036, HR = 0.27), and HISTO_Skewness on contrast-enhanced T1W imaging (P = 0.026, HR = 0.41) were independent predictors of OS. The C-index did not demonstrate significant differences between the independent predictors (C-index = 0.600–0.627, P > 0.05 for all) and was slightly higher in GLCM_Entropy on CT. The multivariate Cox model (C-index = 0.751) showed significantly better prognostic performance than those shown by the independent factors separately (P < 0.005 for all). The significant variables predicting OS in univariate and multivariate analysis are given in Table 3. The prognostic performance of the predictors and Cox model are shown in Table 4. The survival-curve results of the independent predictors are summarized in Fig. 1. Representative cases for the comparison of texture parameters between two patients with different OS are shown in Fig. 2.
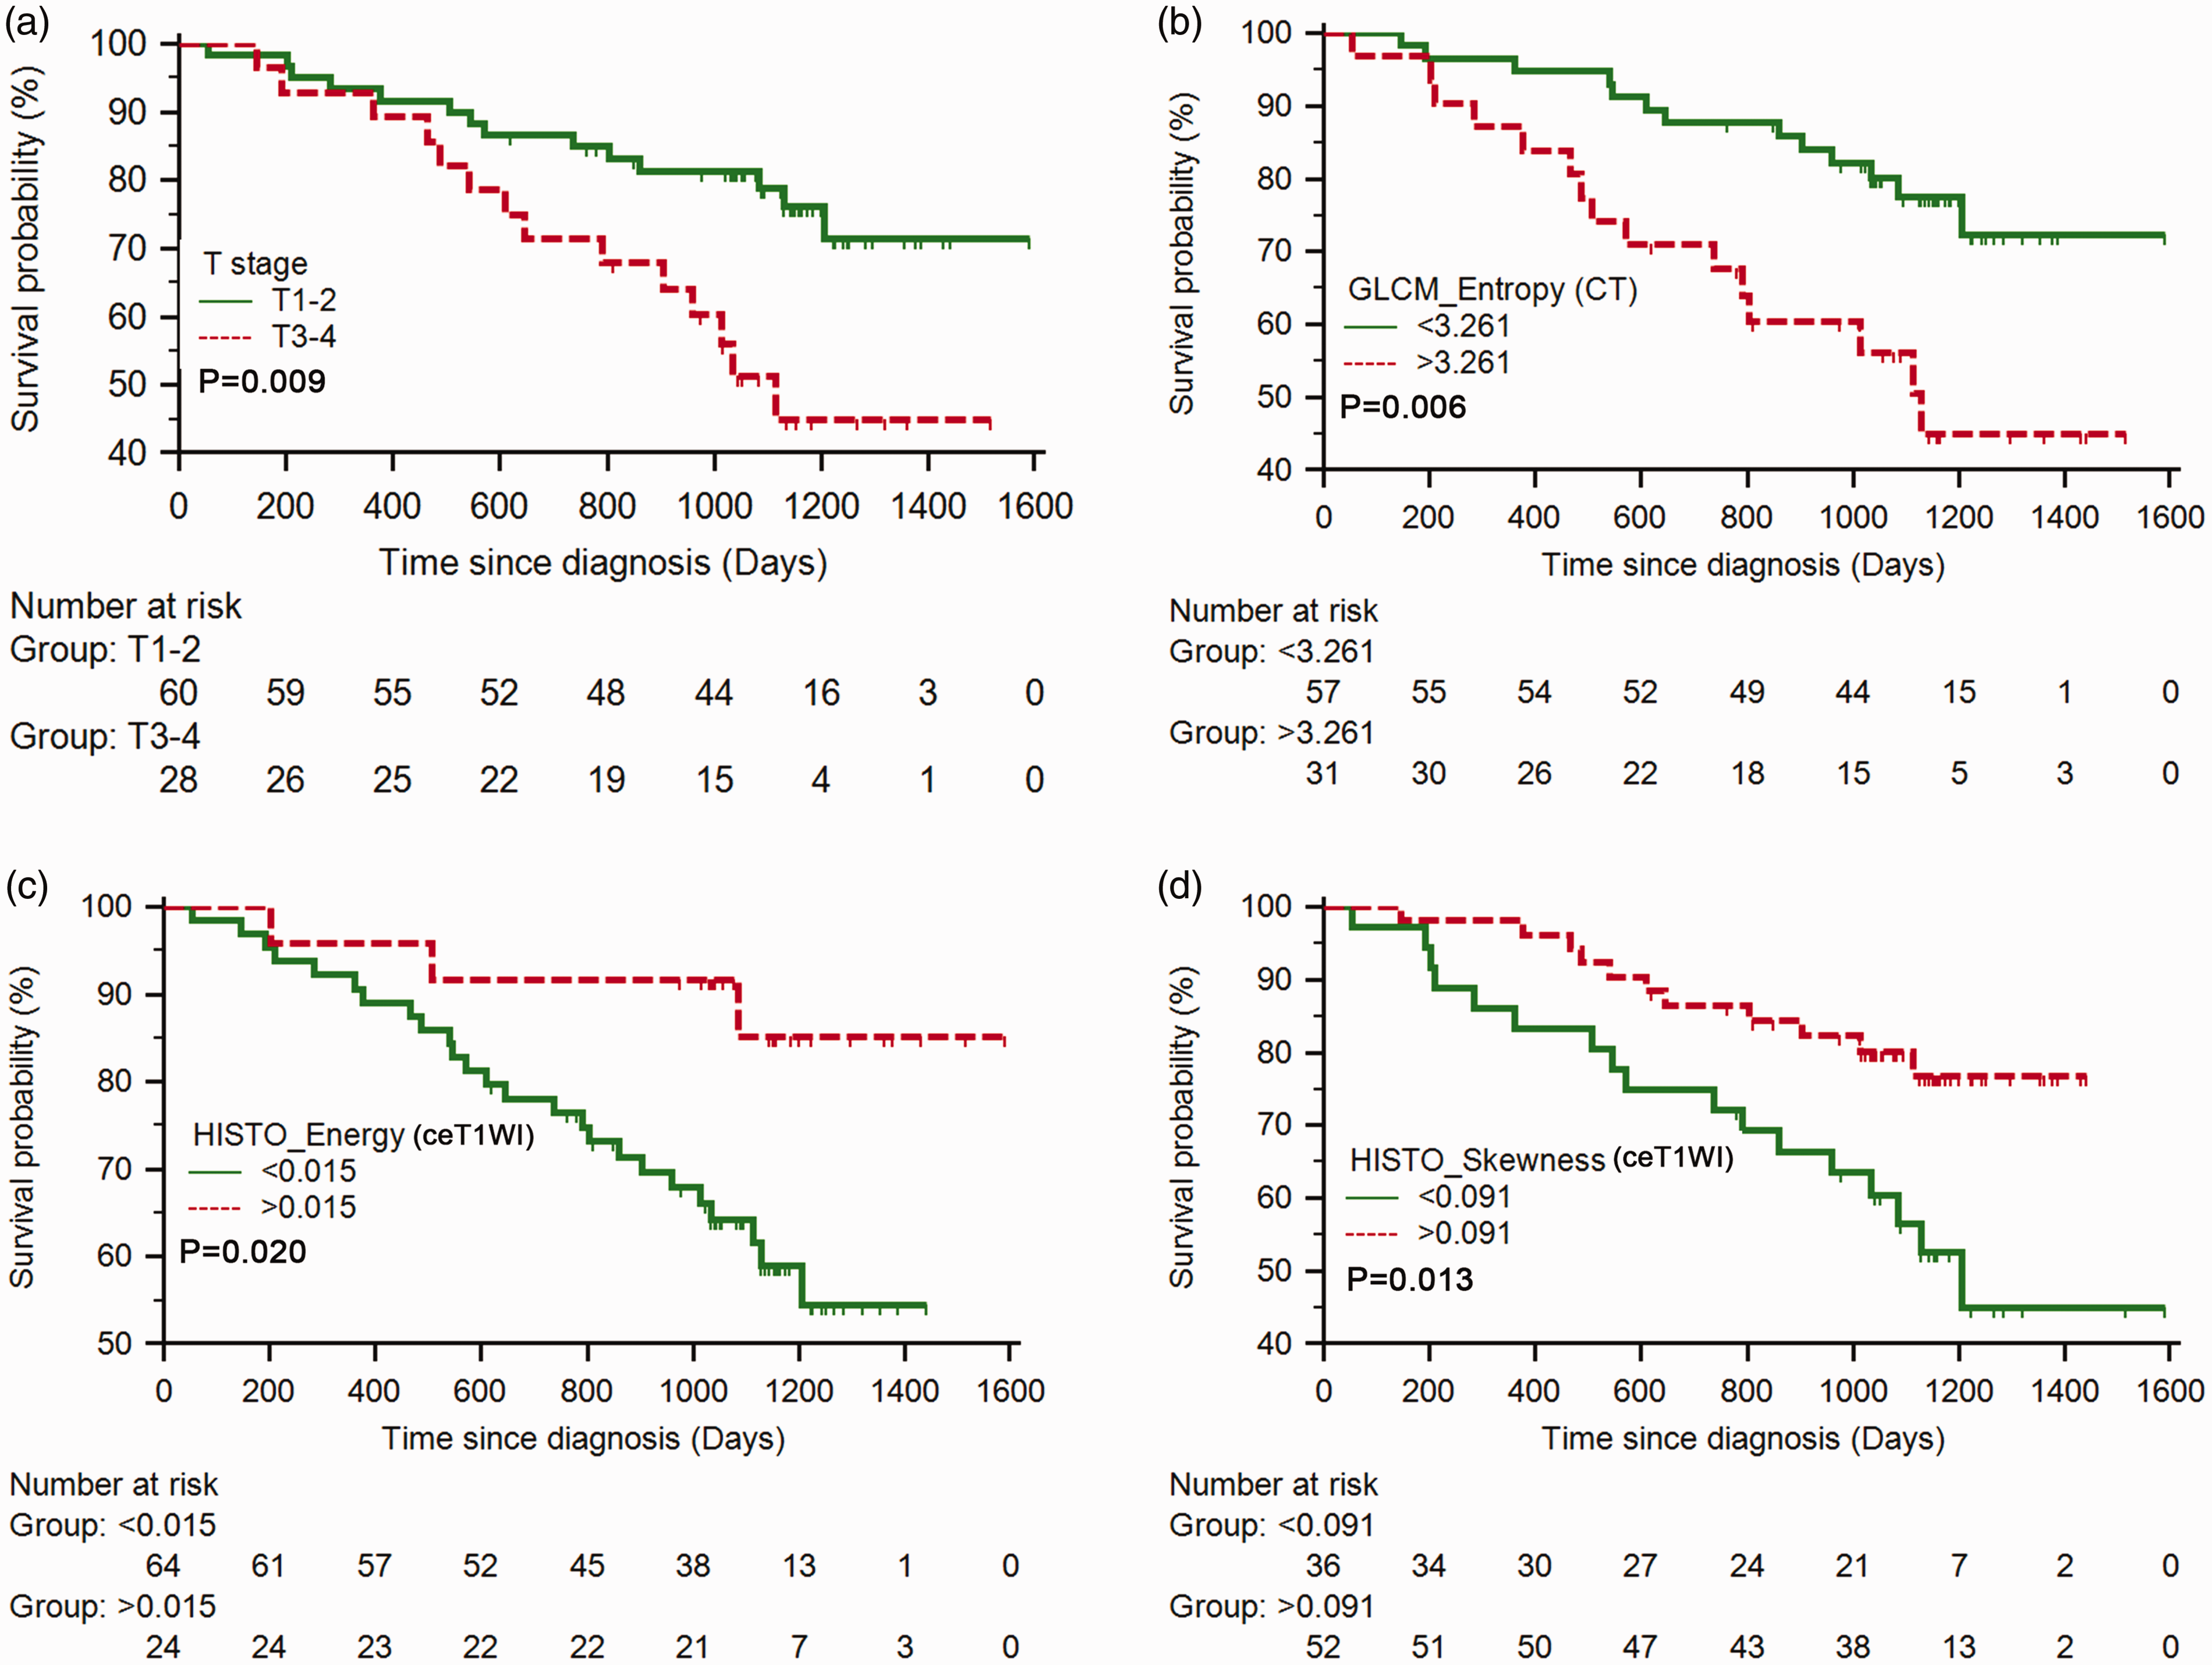
Kaplan–Meier curves of T stage (a), GLCM_Entropy on CT (b), HISTO_Energy (c) and HISTO_Skewness (d) on contrast-enhanced T1W imaging. These variables were independent prognostic factors for the overall survival of patients with OOSCC.
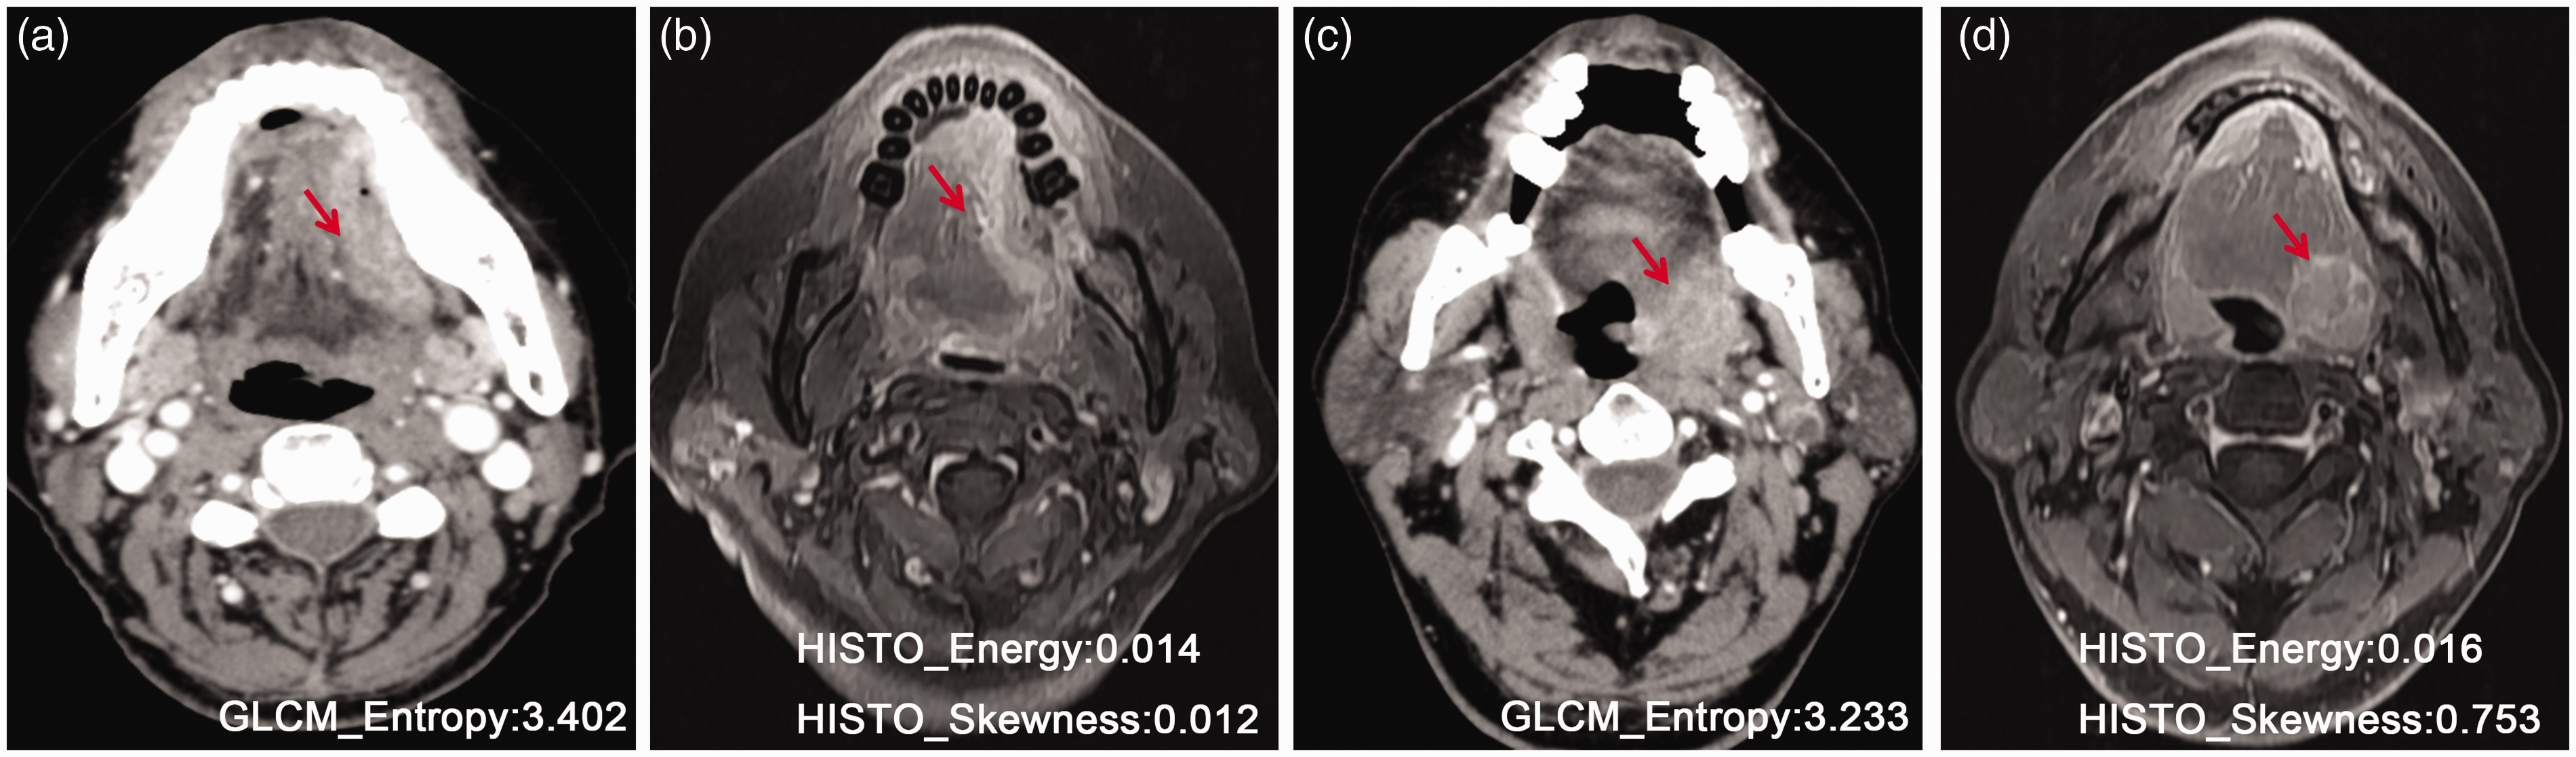
Representative cases for a comparison of texture parameters between two patients with different overall survival. (a, b) Patient with short survival (24 months). (c, d) Patient with relatively long survival (>36 months).
Significant variables predicting overall survival.
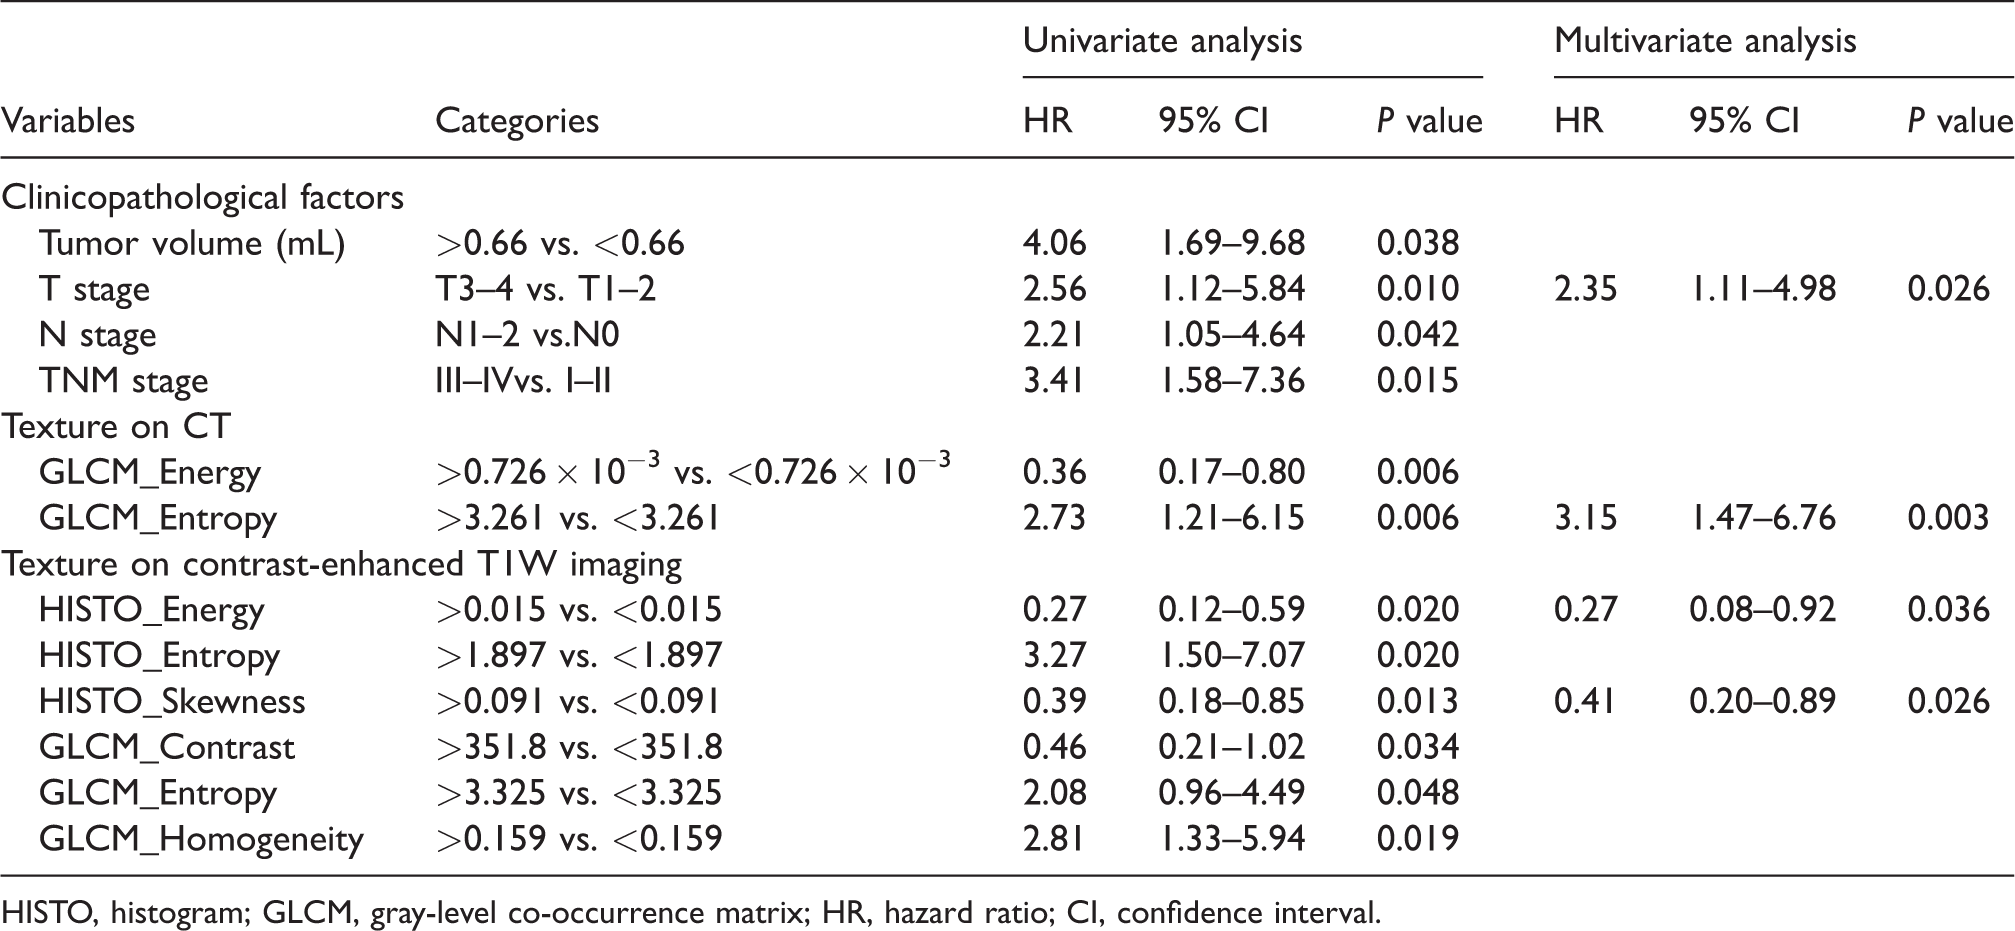
HISTO, histogram; GLCM, gray-level co-occurrence matrix; HR, hazard ratio; CI, confidence interval.
Prognostic performance of the predictors and model.
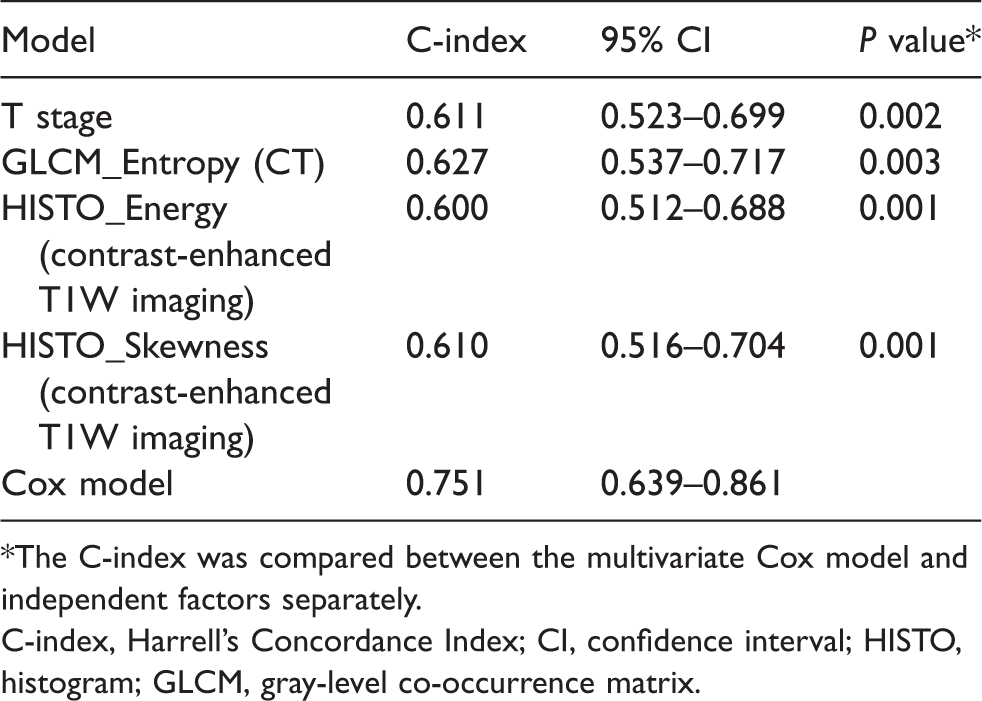
*The C-index was compared between the multivariate Cox model and independent factors separately.
C-index, Harrell’s Concordance Index; CI, confidence interval; HISTO, histogram; GLCM, gray-level co-occurrence matrix.
Discussion
For patients with OOSCC, intra-tumor heterogeneity is a major attribute contributing to a poor and variable prognosis (5,17). Considering the variation observed in intra-tumor heterogeneity using different imaging protocols, we characterized this heterogeneity by extracting the texture features from CT and conventional MRI. We found texture analysis on contrast-enhanced T1W imaging to have better inter-observer agreement than that on CT and T2W imaging. Univariate and multivariate survival analysis showed that T stage, GLCM_Entropy on CT, and HISTO_Energy and HISTO_Skewness on contrast-enhanced T1W imaging were independent predictors of OS. The multivariate Cox model incorporating the independent predictors showed good performance for predicting OS.
In recent years, measurement of spatial heterogeneity by texture analysis has increasingly been used to predict treatment outcome or survival in oncology patients (11,18–23). In the head and neck, Zhang et al. (2) found entropy and skewness on CT images to be associated with the OS of patients with locally advanced OOSCC, who had been treated by induction chemotherapy with TPF (cisplatin, 5-fluorouracil, and docetaxel). In addition, Kuno et al. (11) recently demonstrated that texture features can be used to predict local failure in patients with OOSCC treated with chemoradiotherapy. As an alternative imaging method used routinely to diagnose and monitor OOSCC, MRI provides both better soft-tissue contrast and more comprehensive information with multiple sequences. Therefore, we chose to evaluate the prognostic value of intra-tumor heterogeneity-associated texture features from CT and conventional MR images. This strategy has rarely been reported.
In this context, a histogram shows the accumulation of pixels of the same intensity within the whole image and the correlated features represent the statistical properties without taking account of the relative spatial position of pixels (24). The GLCM describes the correlation between two pixels with certain distances and directions, which is a typical method for the description of second-order textures (25). Therefore, the features of a histogram and GLCM can characterize the global and local heterogeneity of OOSCC on different scales (7). Only the features reflecting intra-tumor heterogeneity were used because we wished to investigate the impact of the different heterogeneous characterizations on the prognosis, although useful image information may have been missed as a result.
Texture features from T2W imaging and contrast-enhanced (CT and T1W) images reflect the heterogeneity of tumor water content and blood supply, respectively (12,19). However, texture features from T2W imaging were not found to be significantly associated with OS. Taken together, the heterogeneity of the blood supply may have more impact on the prognosis. In addition, high GLCM_Entropy and HISTO_Entropy, and low GLCM_Energy representing significant pixel gray-level heterogeneity were identified to predict poor OS. There was no direct comparison between the mathematic importance of these features and underlying tumor histopathology. Nevertheless, the pixel gray-level heterogeneity on CT and contrast-enhanced T1W imaging could represent increased heterogeneity or hypoxic voids within the tumor. In multivariate Cox analysis, GLCM_Entropy on CT, HISTO_Energy, and HISTO_Skewness on contrast-enhanced T1W imaging were identified as independent predictors. These findings suggested that the local heterogeneity on CT and global heterogeneity on contrast-enhanced T1W imaging had key roles in OS prediction. Furthermore, the slightly higher C-index in GLCM_Entropy on CT also indicated that CT can provide complementary information about tumor heterogeneity to contrast-enhanced T1W imaging, although it has relatively inferior contrast of soft tissue. When T stage and texture parameters were incorporated, the Cox model showed good performance in predicting OS, with a C-index of 0.751. This finding suggested that texture analysis combining CT with contrast-enhanced T1W imaging could provide a readily available biomarker for survival stratification of patients with OOSCC.
Besides the prognostic value in OOSCC, we explored the delineation variability of texture analysis on CT and conventional MRI between observers. VOI delineation is an important step in the workflow of texture analysis and is a manual process. Recently, Pavic et al. (26) reported that the inter-observer variability of radiomics analysis was influenced strongly by the tumor type and that only 59% of the total parameters on CT had acceptable stability in head and neck squamous cell carcinoma. In the present study, texture analysis on contrast-enhanced T1W images had better delineation agreement between observers than that on CT. This observation is likely attributed to better soft-tissue contrast of the former to avoid variation in sample selection. In addition, entropy and skewness of the histogram on CT and T2W imaging had poor inter-observer agreement, a finding that correlates with a recent study of texture analysis using CT in hepatocellular carcinoma (27). These results may suggest that measurement of global heterogeneity on CT and T2W imaging was affected readily by sample bias.
The present study had four major limitations. First, our study was based on a relatively small sample and a subgroup analysis of tumor site was not allowed. Second, there is evidence that OOSCCs have biologic differences regarding the molecular alterations associated with the prognosis, such as infection with the human papilloma virus (28), which we did not take into account. Third, the possibility of type-I errors >0.05 could not be eliminated without adoption of multiple-testing correction. However, given the small sample size and exploratory purpose of our study, multiple-testing correction would not have been appropriate (29). Finally, although gray-level normalization was done before texture-parameter extraction, whether the predictive factor or model can be applied to different scanning systems and software platforms (especially the texture parameters for MRI) is not known.
In conclusion, texture analysis on contrast-enhanced T1W imaging had better delineation agreement than that on CT and T2W imaging between observers. Intra-tumor heterogeneity characterized by texture features on CT and conventional MRI was related to the OS of patients with OOSCC. As a non-invasive imaging biomarker, a combined predictive model using CT and contrast-enhanced T1W imaging texture analysis provided a valuable and practical method for survival stratification.
Supplemental Material
Supplemental material for Tumor heterogeneity in oral and oropharyngeal squamous cell carcinoma assessed by texture analysis of CT and conventional MRI: a potential marker of overall survival
Supplemental Material for Tumor heterogeneity in oral and oropharyngeal squamous cell carcinoma assessed by texture analysis of CT and conventional MRI: a potential marker of overall survival by Jiliang Ren, Ying Yuan, Yiqian Shi and Xiaofeng Tao in Acta Radiologica
Footnotes
Declaration of Conflicting Interests
The author(s) declared no potential conflicts of interest with respect to the research, authorship, and/or publication of this article.
Funding
The author(s) disclosed receipt of the following financial support for the research, authorship and/or publication of this article: This work was supported by funds from the National Scientific Foundation of China (91859202, 81771901).
References
Supplementary Material
Please find the following supplemental material available below.
For Open Access articles published under a Creative Commons License, all supplemental material carries the same license as the article it is associated with.
For non-Open Access articles published, all supplemental material carries a non-exclusive license, and permission requests for re-use of supplemental material or any part of supplemental material shall be sent directly to the copyright owner as specified in the copyright notice associated with the article.