
Abstract
Background
Positron emission tomography (PET)/magnetic resonance (MR) imaging may become increasingly important for assessing tumor therapy response. A prerequisite for quantitative PET/MR imaging is reliable and repeatable MR-based attenuation correction (AC).
Purpose
To investigate the frequency and test–retest reproducibility of artifacts in MR-AC maps in a lung cancer patient cohort and to study the impact of artifact corrections on PET-based tumor quantification.
Material and Methods
Twenty-five lung cancer patients underwent single-day, test–retest, 18F-fluorodeoxyglucose (FDG) PET/MR imaging. The acquired MR-AC maps were inspected for truncation, susceptibility, and tissue inversion artifacts. An anatomy-based bone template and a PET-based estimation of truncated arms were employed, while susceptibility artifacts were corrected manually. We report the frequencies of artifacts and the relative difference (RD) on standardized uptake value (SUV) based quantification in PET images reconstructed with the corrected AC maps.
Results
Truncation artifacts were found in all 50 acquisitions (100%), while susceptibility and tissue inversion artifacts were observed in six (12%) and 26 (52%) of the scans, respectively. The RD in lung tumor SUV was < 5% from bone and truncation corrections, while up to 20% RD was introduced after susceptibility artifact correction, with large inconsistencies between test–retest scans.
Conclusion
The absence of bone and truncation artifacts have limited effect on the PET quantification of lung lesions. In contrast, susceptibility artifacts caused significant and inconsistent underestimations of the lung tumor SUVs, between test–retest scans. This may have clinical implications for patients undergoing serial imaging for tumor therapy response assessment.
Introduction
Lung cancer is the most frequent cancer type and the leading cause of cancer-related death in the world (1). Positron emission tomography (PET)/computed tomography (CT) with 18F-fluorodeoxyglucose (FDG) is the standard of care today for lung cancer staging and is also increasingly used to aid in radiotherapy treatment planning and for tumor therapy response assessment (2–6).
The recent introduction of integrated PET/magnetic resonance (MR) systems has opened new possibilities for tumor characterization by adding excellent soft-tissue contrast, provided by MR imaging (MRI), to the functional information from PET. In this way, simultaneous, multiparametric images can be acquired, that facilitate precision medicine and personalized treatment of the disease (7,8). The use of non-ionizing MRI is another benefit for the use of PET/MR, rather than PET/CT, in the follow-up assessment of patients undergoing radiation or chemotherapy (9).
The reproducibility of the standardized uptake values (SUV) in PET/MR imaging is important for a reliable assessment of therapy response, and it is strongly linked to accurate MR-based attenuation correction (AC) during PET image reconstruction (7,10–13). In fully integrated PET/MR systems, standard AC maps are calculated from the segmentation of MR images into a number of tissue classes (e.g. air, lung, fat, and soft tissue), thereby assigning a specific attenuation coefficient to each tissue (7,14). A known limitation of many MR sequences used for generating AC maps is the low bone signal, which may cause an underestimation of quantitative measurements in the resulting PET images in close vicinity to osseous tissue (11). Furthermore, the reduced transaxial field of view (FOV) of the MR, in comparison with the PET FOV, has been reported to result in truncation artifacts of distal body parts (15). In addition, distortion of the magnetic field, caused by metallic implants, such as surgical sternal wires, may cause susceptibility artifacts in the AC maps (16,17). Lastly, soft-fat tissue inversions in the AC map may occur (16). These effects have been proven to affect both diagnostic quality and hinder accurate quantification of the tracer-distribution in brain, head/neck, and cardiac PET studies (16,17). Further, a recent study reported that MR-AC related artifacts occurred frequently and inconsistently in test–retest scans of lung cancer patients, leading to non-consistent SUV quantification in serial examinations (18).
The aim of the current study is to investigate the frequency and the test–retest reproducibility of artifacts observed in standard MR-based AC maps in a lung cancer patient cohort undergoing PET/MR imaging. Further, we intend to correct for artifacts in the AC maps and evaluate the impact of the corrections on the PET-based quantification in the test-retest setup.
Material and Methods
Ethical approval
This study was approved by the Norwegian Regional Committees for Medical and Health Research Ethics (REC reference 2017/915). All patients signed written informed consent.
Patient population, preparation, and imaging overview
Twenty-five lung cancer patients with a total of 26 lung lesions were included in this single-injection dual-time point PET/MR imaging study. Patients fasted 15 h ± 4 h before the injection of 281 MBq ± 41 MBq FDG. PET/MR assessment started 113 min ± 10 min post FDG injection (Fig. 1).
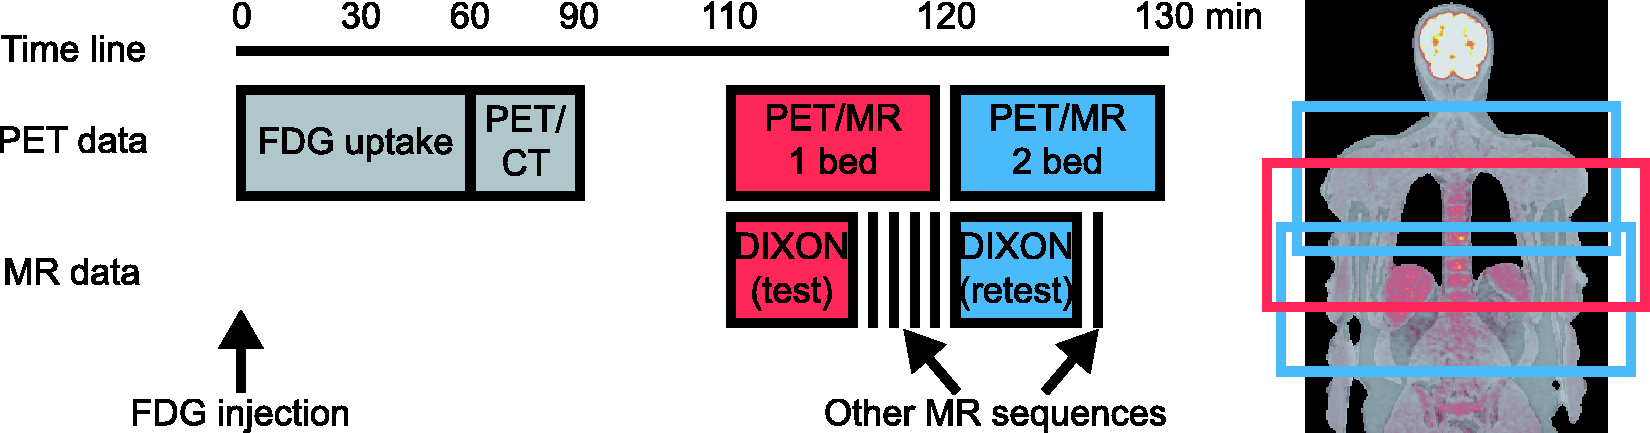
Time line of the single-injection dual-time point imaging study. Patients were injected with FDG, followed by 60 min rest, before undergoing PET/CT and PET/MR imaging. PET and MR DIXON data that were included in this study are indicated in red and blue, for the one-bed position scan centered over the mediastinum (test) and the two-bed position scan of the whole thorax (retest), respectively. The corresponding anatomical regions are indicated approximately on the coronal overview scan to the right. FDG: F-flurodeoxyglucose; PET: Positron emission tomography; CT: computer tomography; MR: magnetic resonance.
PET/MR image acquisition
The PET/MR acquisitions were performed in a Siemens Biograph mMR (software version VB20P) (Siemens Healthineers, Erlangen, Germany) using a free-breathing and arms-down scan protocol during the entire simultaneous image acquisition. All patients had the same anatomical region scanned twice, without repositioning and reinjection between the scans, thus, allowing for the assessment of the test–retest reproducibility of the images. First, a 10-min, one-bed position scan, centered over the mediastinum, was performed, immediately followed by another 10-min, two-bed position scan of the whole thorax (Fig. 1). A standard DIXON-based MR-AC map was acquired for each scan, resulting in a total of 50 MR-AC maps for the 25 patients.
Inspection of the attenuation correction maps
All 50 MR-AC maps were inspected for artifacts by two experienced imaging physicists. We report the frequency of the observed artifacts from this test-retest assessment, divided into three categories: truncation artifacts; susceptibility artifacts in the sternum; and tissue inversion (Fig. 2a–c). For the second category, we specify the number of acquisitions for which lung segmentation in the MR-AC map failed.
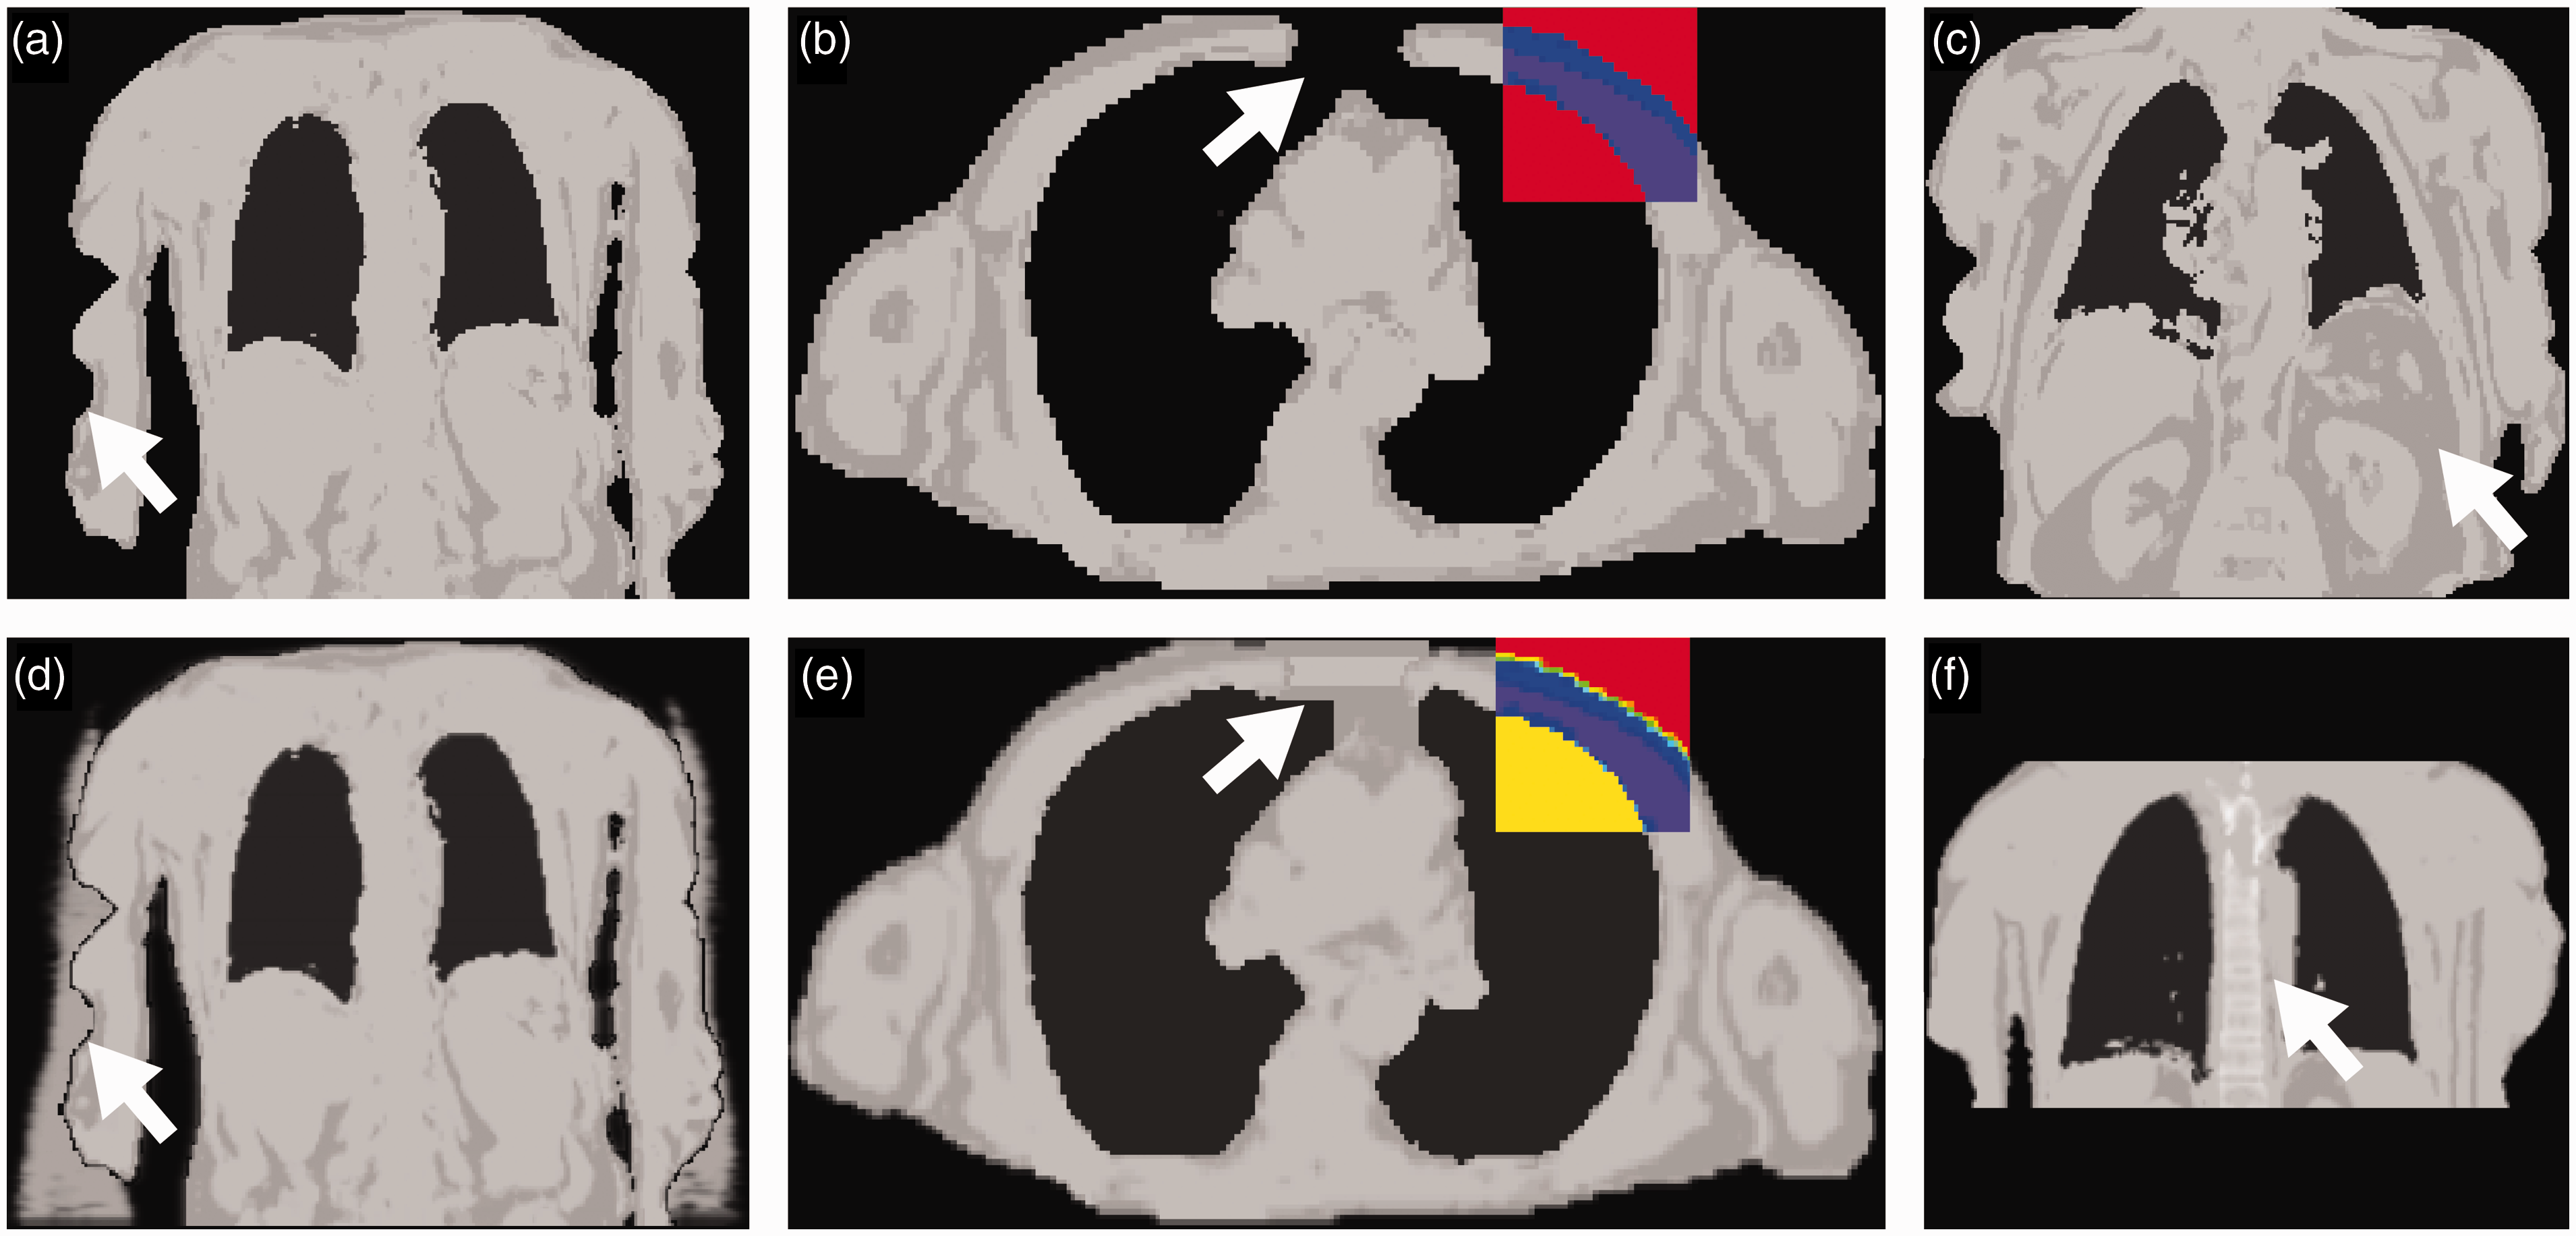
Examples of the three types of artifacts reported in this study and their corrections in the MR-AC maps: (a) Truncation artifact, where the arms of the patient are outside the MR FOV. (b) Susceptibility artifact caused by surgical sternal wires. Note the failed lung segmentation, where lung attenuation values have been incorrectly assigned to background (red color in the box insert). (c) Tissue inversion artifact with a soft-fat tissue swap. This artifact was not corrected in this study. (d) Correction of truncated arms using the MLAA algorithm (20). (e) Susceptibility artifact correction using an in-house developed algorithm (17). Note that the lungs have been “filled” with lung attenuation values (yellow color in the box insert). (f) Correction of missing bone by adding an anatomy-based bone template of the spine (19). MR-AC: magnetic resonance attenuation correction; MR FOV: magnetic resonance field of view.
Corrections of the attenuation correction maps
For each patient, up to four additional sets of test–retest AC maps were formed by correcting for the artifacts that were found in each original AC map (Fig. 2d–f): (i) missing bone was corrected by adding an anatomy-based bone template of the spine (19); (ii) truncation artifacts, if found, were corrected using the MLAA algorithm (20). Both these corrections were performed using vendor-provided software, thus, updating the AC maps in DICOM-format; (iii) susceptibility artifacts, causing misclassified voxels in the sternum and lungs, if found, were corrected using an in-house developed algorithm implemented in Matlab (Mathworks, MA, USA) (17). This correction was applied on the interfiles used for reconstructions in a vendor-provided reconstruction tool (JSRecon (e7-tools), Siemens Healthineers, Erlangen, Germany); (iv) a fully corrected AC map was formed by applying all the above-mentioned corrections. The different AC maps are denoted AC Original , AC Bone , AC Trunc , AC Susc , and AC All , respectively, throughout this paper. Thus, for each patient, a total of eight (no AC Susc ) or 10 (with AC Susc ) different AC maps were included for subsequent analyses.
PET image reconstruction
Static PET images were reconstructed for all patients by employing each of the generated AC map, to form PET Original , PET Bone , PET Trunc , PET Susc , and PET All (Fig. 3). This resulted in a total of 214 PET image series included for further evaluation. All reconstructions were performed using ordered-subset expectation-maximization (OSEM) algorithm with three iterations, 21 subsets, and 4 mm Gaussian smoothing. The matrix size of the reconstructed PET images was 344 × 344 ×127 and 344 × 344 × 224 for test (one-bed) and retest (two-bed) scans, respectively, with a voxel size of 2.1 × 2.1 × 2.0 mm.
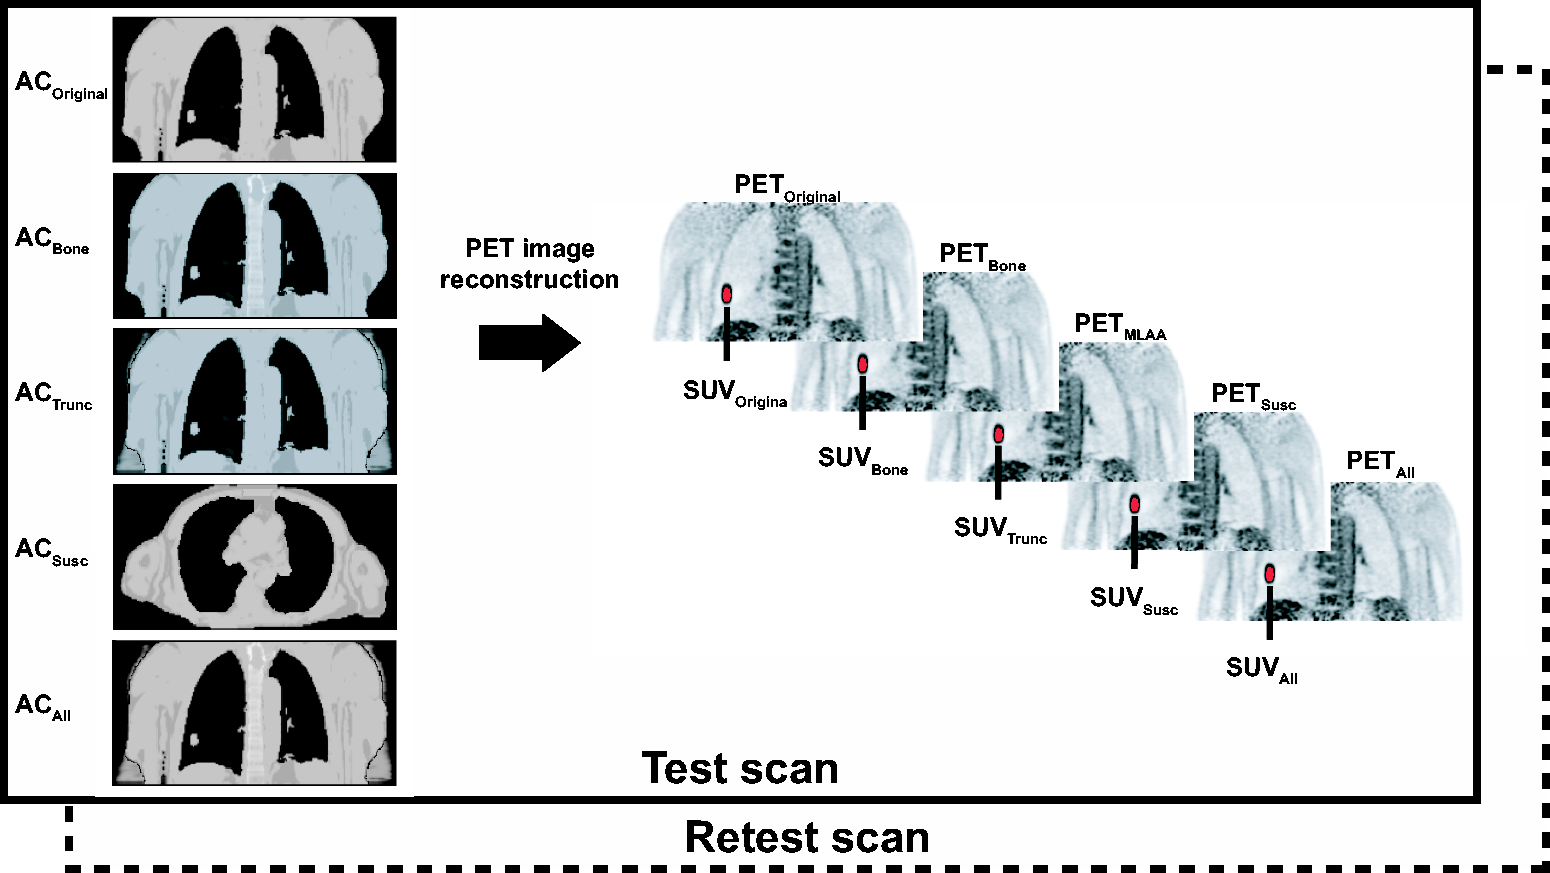
Schematic overview of MR-AC map correction, PET image reconstruction, and subsequent quantitative SUV extraction. For each patient, up to five different sets of test–retest PET images were reconstructed, using the original AC map (AC Original ), and each of the corrected AC maps (AC Bone , AC Trunc , AC Susc , and AC All ). From each PET image, the lung tumor SUV mean , SUV max , and SUV peak was extracted from the delineated tumor (41% of SUV max threshold). The analysis was performed for both test and retest scans. MR-AC: magnetic resonance attenuation correction; PET: Positron emission tomography; SUV: standardized uptake values; AC: attenuation correction.
PET image evaluation
FDG-avid lesions were delineated using a 41% SUV
max
threshold (21). For each lesion, the mean, maximum, and peak SUV values were measured (SUV
mean
, SUV
max
, and SUV
peak
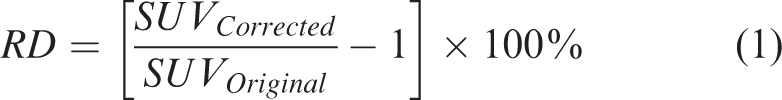
). Relative difference (RD) was calculated using Eq. 1:
The impact of the corrections on tumor size was evaluated by measuring the largest diameter and the volume of the delineated lesions in all reconstructed images.
Results
Frequency of artifacts
Truncation artifacts were reported in all 50 MR-AC maps (100%), whereas susceptibility artifacts, caused by sternal wires, and tissue inversion was observed in six (12%) and 26 (52%) of the MR-AC maps, respectively. All susceptibility artifacts were reproducible between test–retest scans. As a consequence of susceptibility artifacts in the sternum, lung tissue segmentation failed for two of the patients in the test scan (Table 1).
Frequency of artifacts observed among the test–retest AC maps in the dataset.
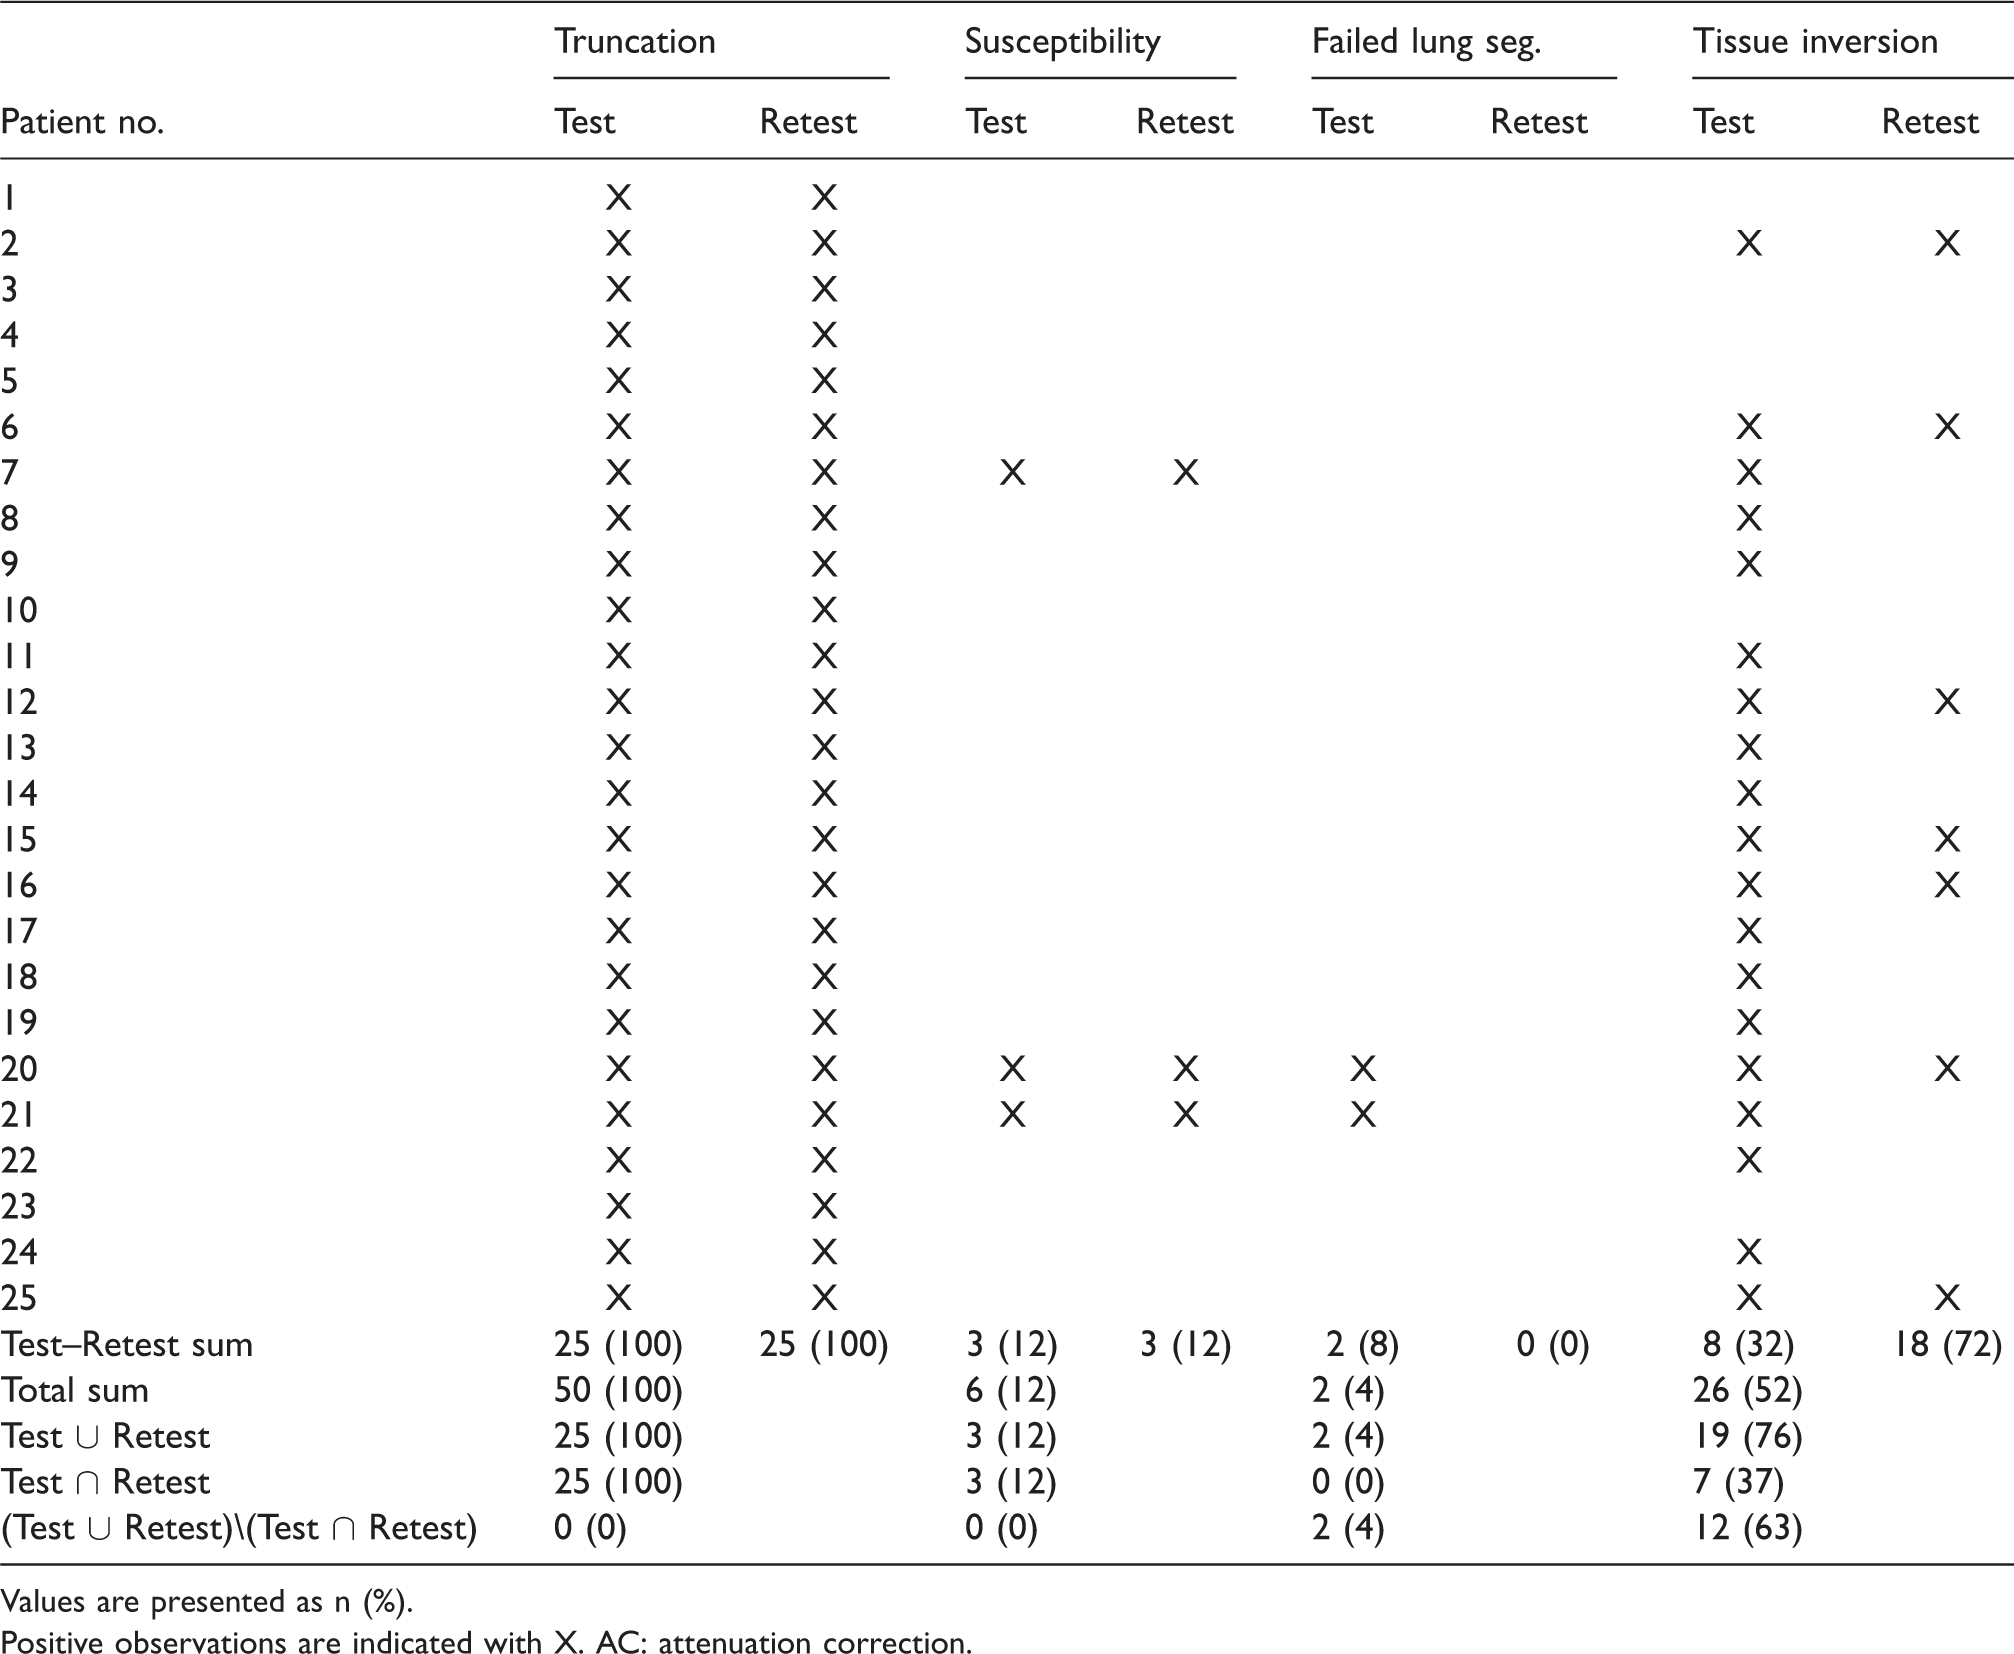
Values are presented as n (%).
Positive observations are indicated with X. AC: attenuation correction.
Tissue inversion artifacts were observed in a total of 19 (76%) patients, which was reproduced in the retest scan in seven (37%) of the patients. For 12 (63%) of the patients, tissue inversion artifacts were present in only one of either the test or retest scans (Table 1).
Correction of artifacts
The relative differences of the lung tumor SUVs after applying bone, truncation, and all corrections are shown in Fig. 4. Inclusion of the anatomy-based bone template caused an increased tumor SUV mean , SUV max , and SUV peak < 0.5% (P < 0.001) in both test and retest scans, while correction of truncation and all artifacts yielded a corresponding increase < 3% (P < 0.01) (Fig. 4).
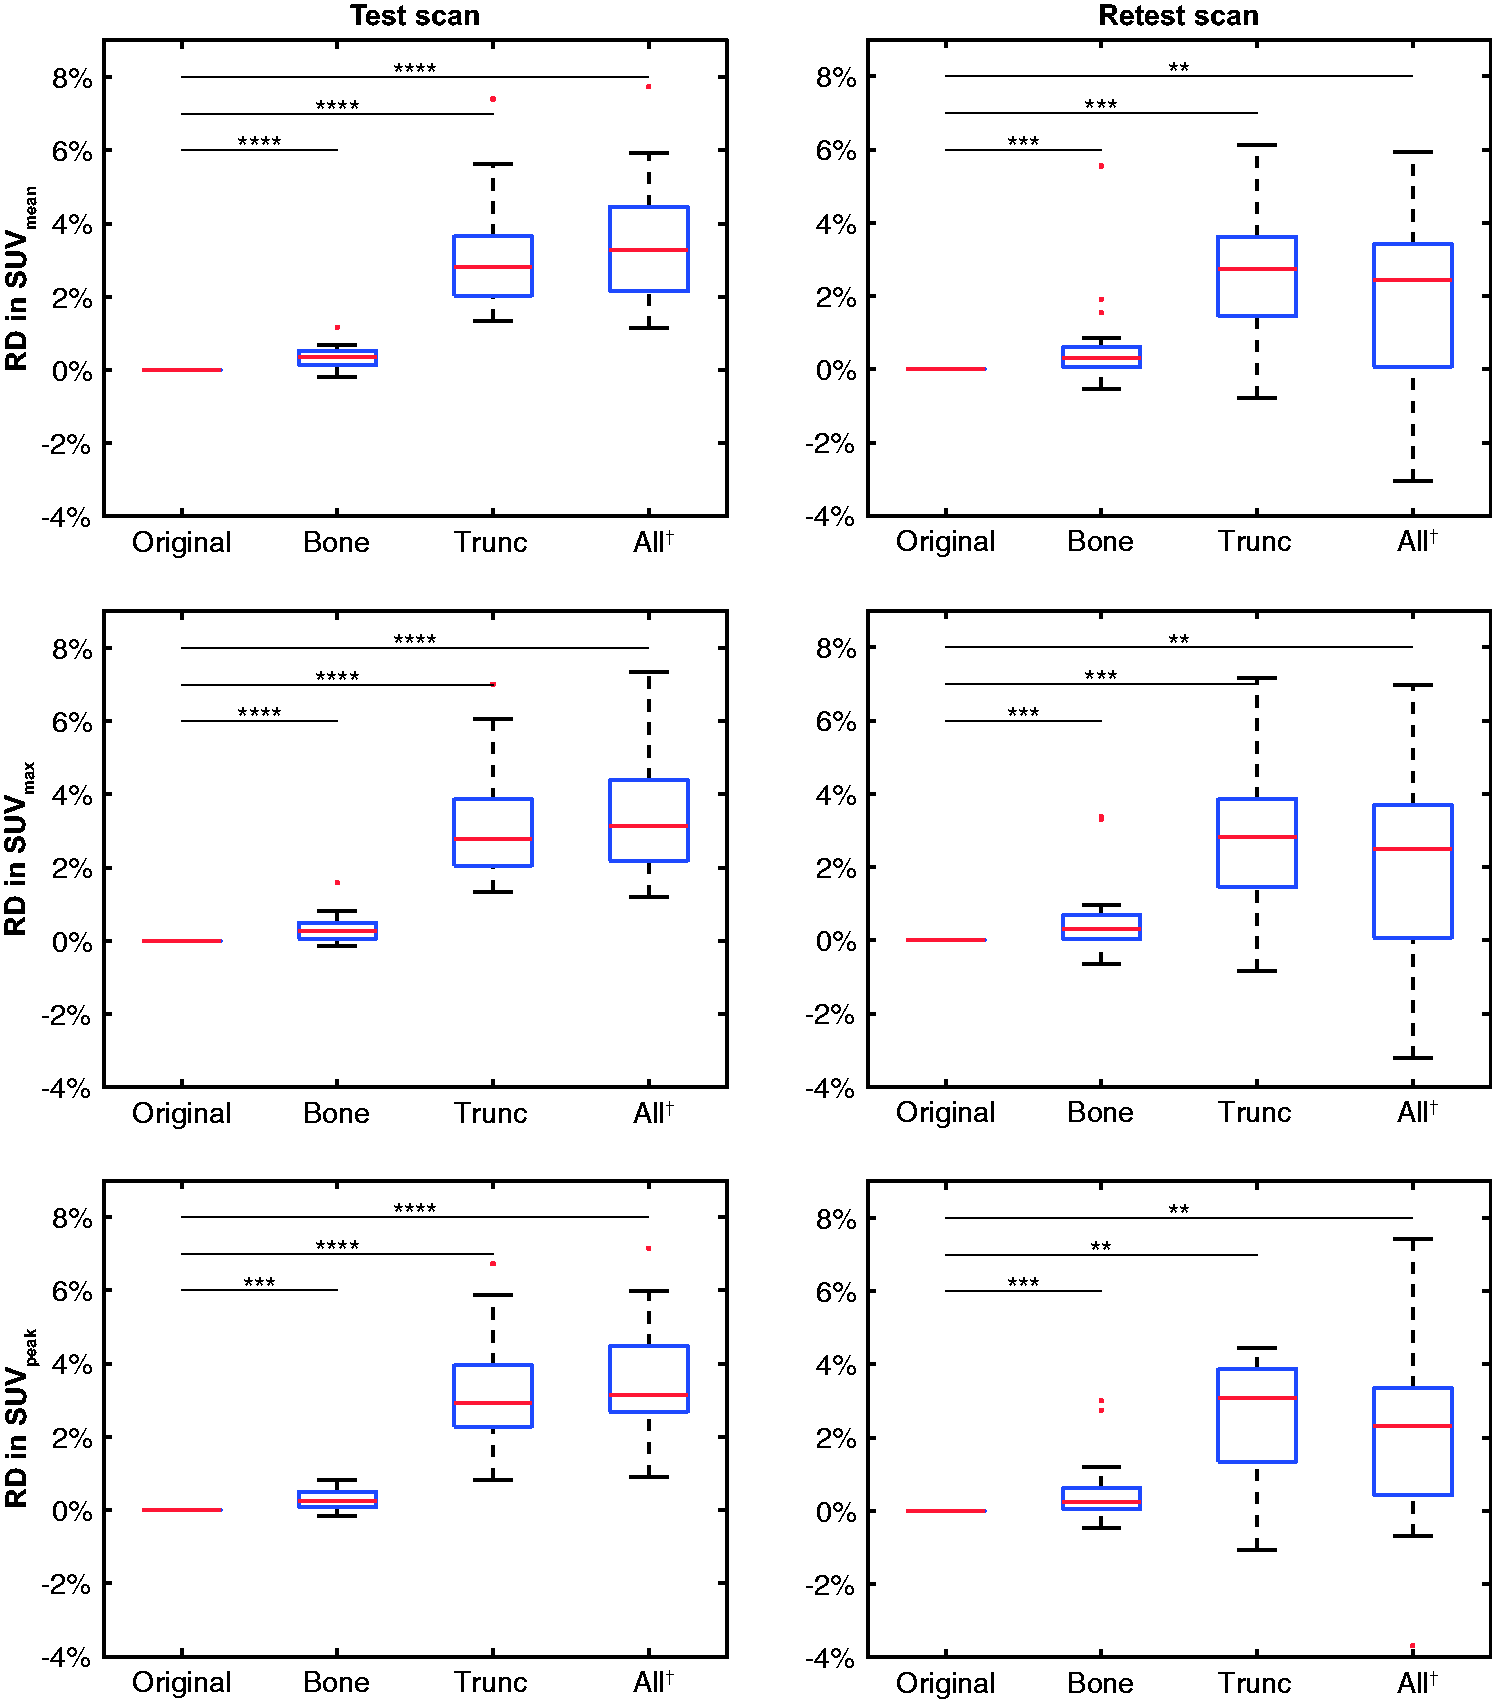
Box plots showing the relative difference in lung lesion SUV mean (top row), SUV max (middle row), and SUV peak (bottom row), obtained from the 41% SUV max threshold, after correcting for bone, truncation, and all effects, compared to the original, uncorrected case, for test (left) and retest (right) scans, respectively. Asterisks (*) indicate significance level. †Corrections for susceptibility artifacts of the three patients from Table 2 are not included in this column. SUV: standardized uptake values.
Table 2 shows the relative difference in the lung tumor SUV for the three patients with susceptibility artifacts in the AC maps after applying the different corrections. The susceptibility artifacts introduced an acquisition-varying effect on the tumor SUV values, with test–retest variations of up to 22% (Patient 21).
Relative difference in SUV before and after correction of susceptibility, and all artifacts, respectively, for the three patients with susceptibility artifacts in the AC maps.
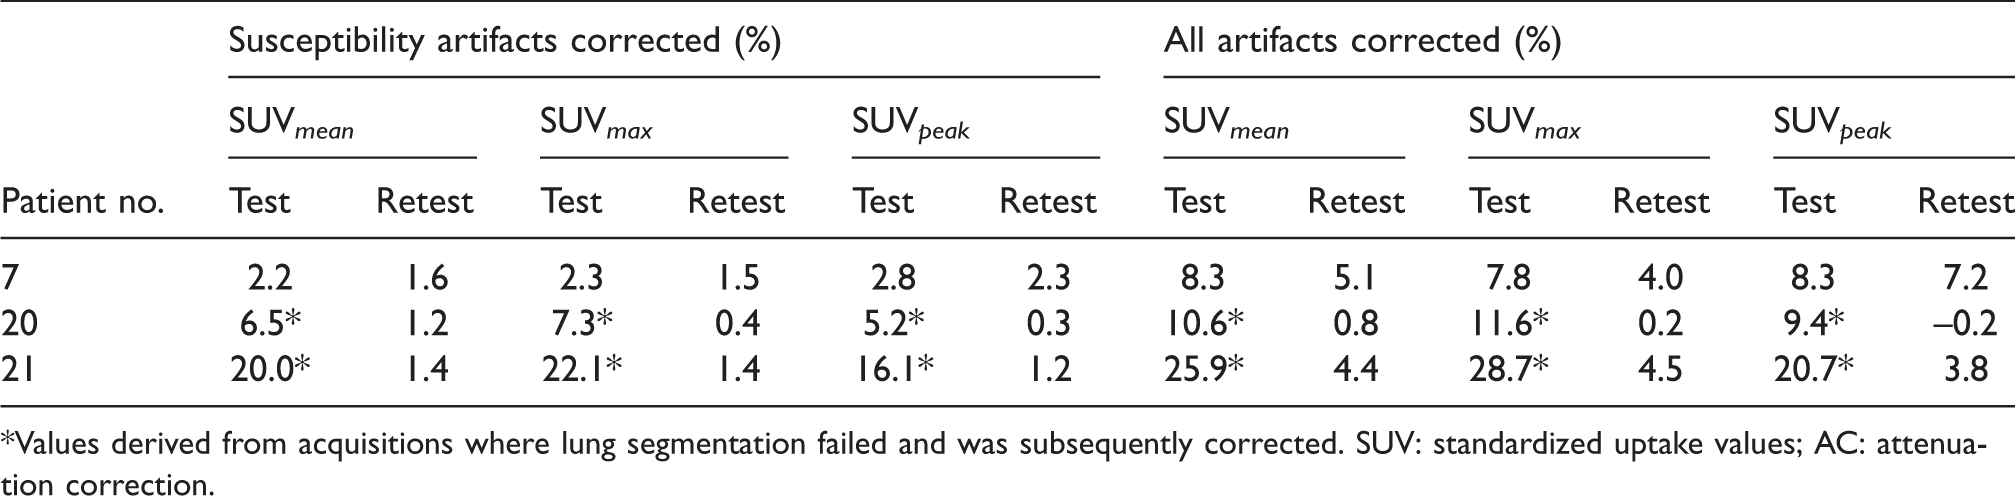
*Values derived from acquisitions where lung segmentation failed and was subsequently corrected. SUV: standardized uptake values; AC: attenuation correction.
To visualize the effect of the different AC map corrections on the reconstructed PET images, relative difference images of a representative patient is shown in Fig. 5 and Supplementary Figs. S1 and S2.
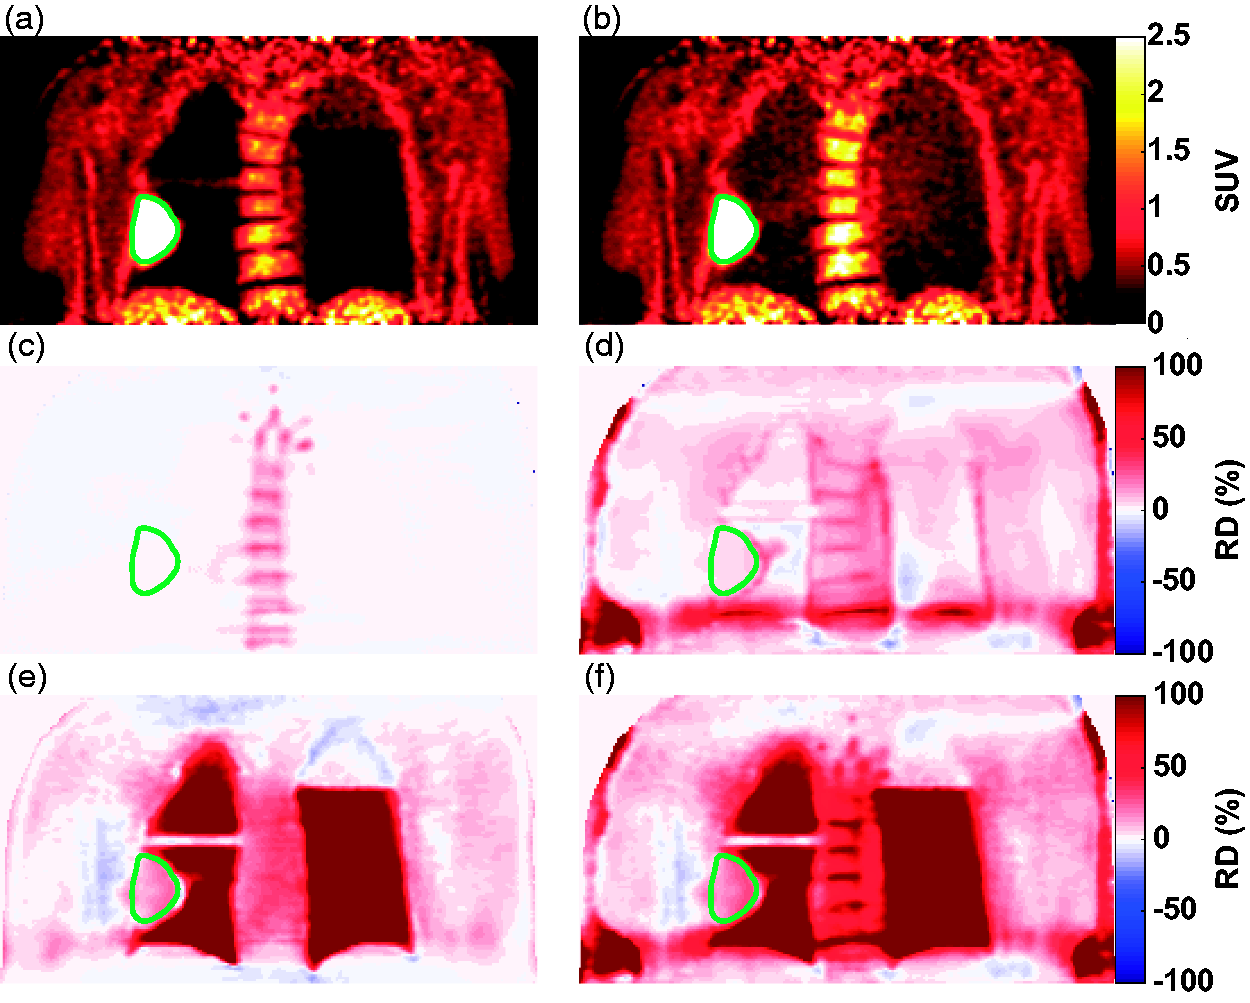
The effect of the different corrections in the AC maps on the reconstructed PET images for a representative coronal slice of patient 21. (a) The original PET image. (b) The fully corrected PET image. (c–f) RD images between original and corrected PET images, where bone correction (c), truncation correction (d), susceptibility correction (e), and all corrections (f), have been applied, respectively. A schematic circumference of the lung lesion for this patient has been indicated with a green line. Of note, the horizontal stripe in the central part of the right lung and the top part of the left lung was caused by transitions between correct and incorrect lung segmentation regions in the MR-AC map. AC: attenuation correction; PET: Positron emission tomography; RD: relative difference; MR-AC: magnetic resonance attenuation correction.
Fig. 6 shows the association between the SUV and lesion diameter, without and with corrections for artifacts in the AC maps. While the corrections affected the SUV values, they did not introduce alterations in the tumor diameters (Table 3). Similar results were obtained for the tumor volumes (Table 3 and Fig. 7).
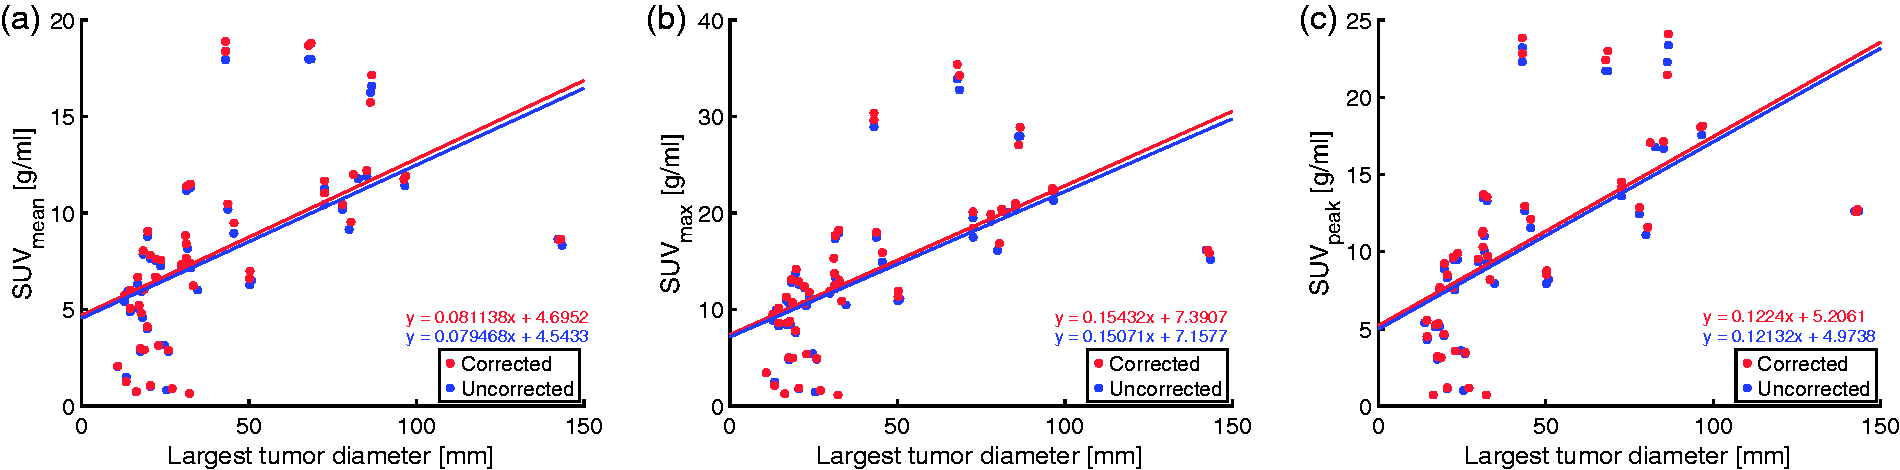
Lesion diameter without and with all corrections for artifacts in the AC maps. Susceptibility artifact corrections of the three patients from Table 2 are not included here. The corrections did not introduce any relevant alterations in the tumor diameters when using SUVmean (a), SUVmax (b), nor SUVpeak (c) assessments. Note that because SUVpeak is not defined for lesions with volume <1 cm3, 5 data points were excluded from (c). AC: attenuation correction; SUV: standardized uptake values.
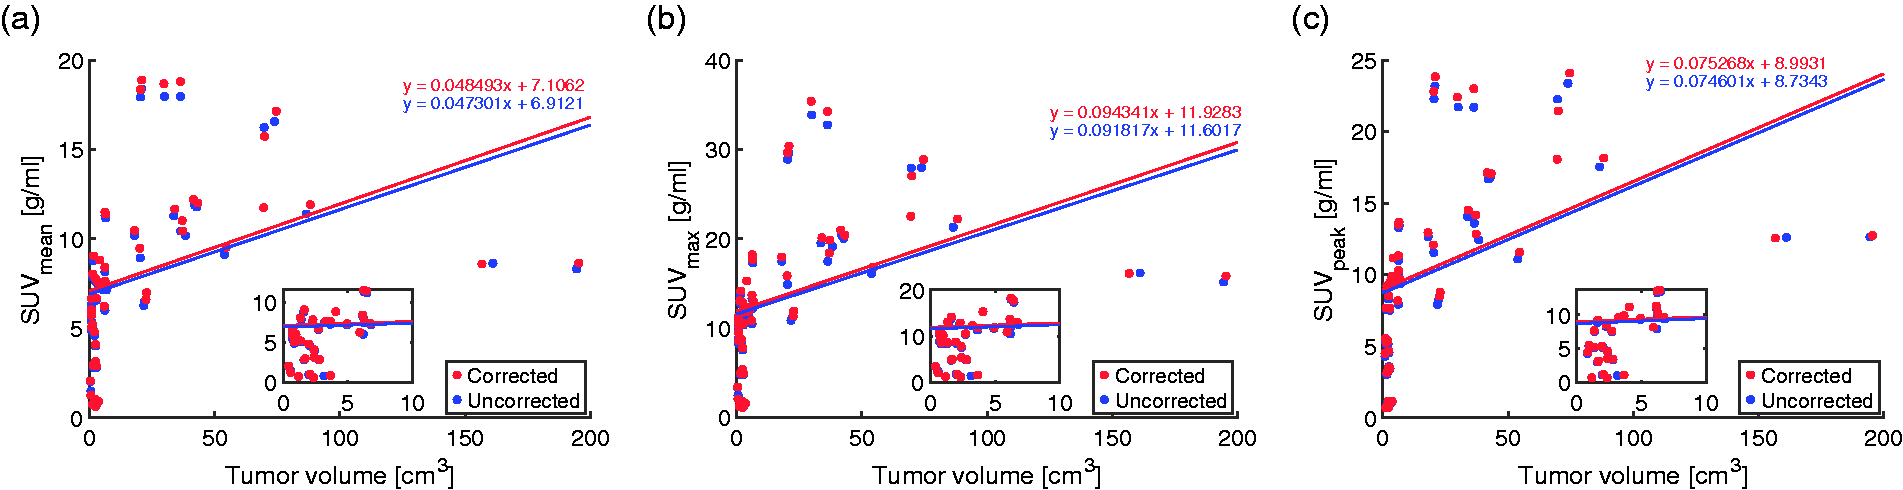
Tumor volume without and with all corrections for artifacts in the AC maps. Susceptibility artifact corrections of the three patients from Table 2 are not included here. Data points with volumes < 10 cm3 are shown in the insert. The corrections did not introduce any relevant alternations in the lesion volumes when using SUVmean (a), SUVmax (b), nor SUVpeak (c) assessments. Note that because SUVpeak is not defined for lesions with volume < 1 cm3, 5 data points were excluded from (c). AC: attenuation correction. SUV: standardized uptake values.
Tumor diameter and volume without and with corrections for artifacts in the AC mapsa. The corrections did not introduce any relevant alterations in the tumor diameters or volumes.
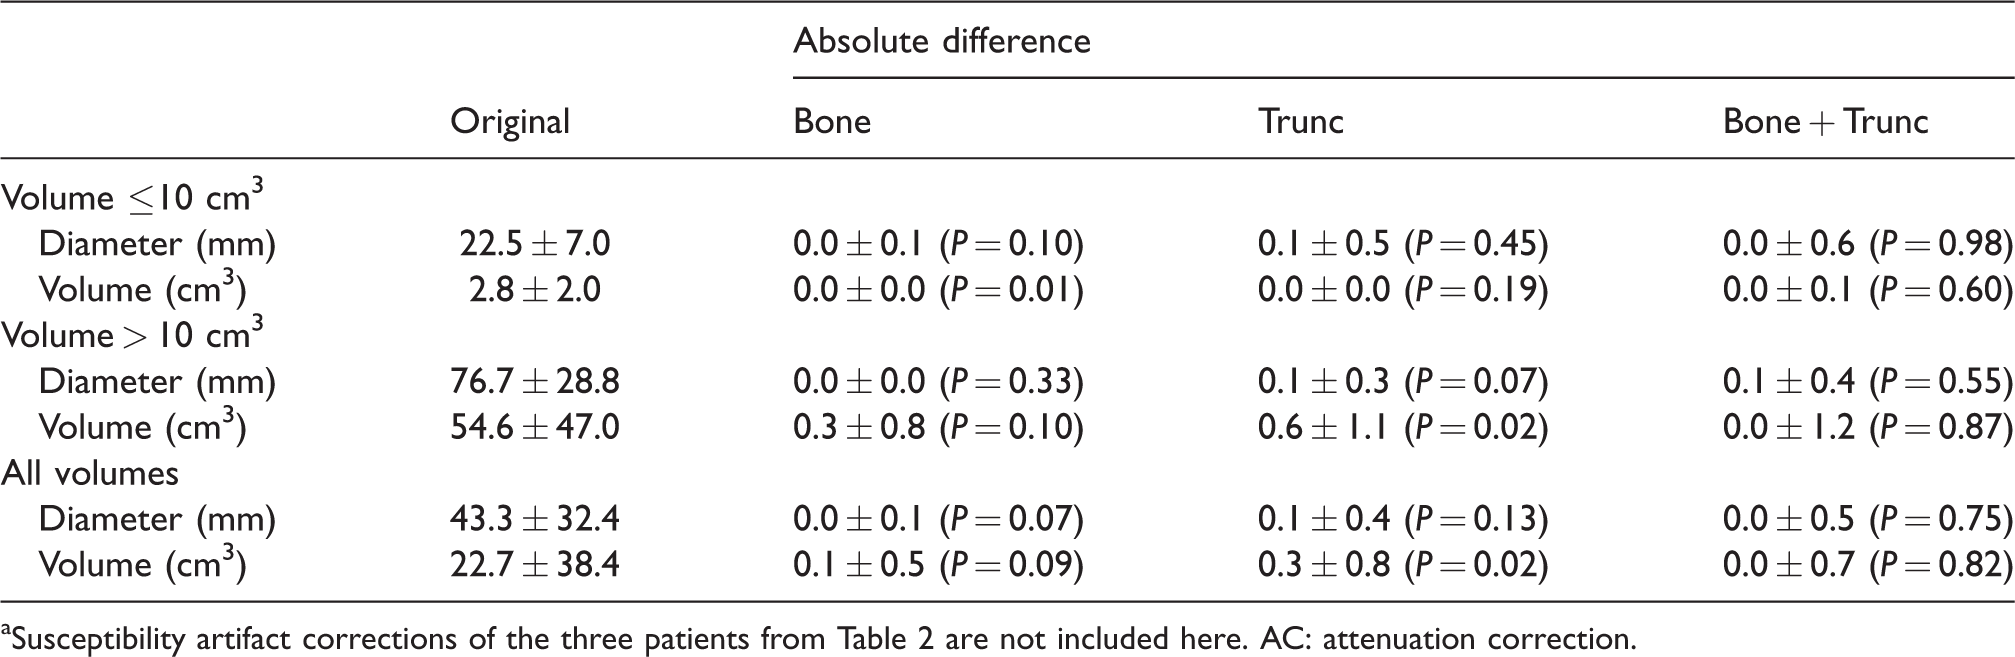
aSusceptibility artifact corrections of the three patients from Table 2 are not included here. AC: attenuation correction.
Discussion
We have studied how individual and combined corrections of the three most frequent artifacts (absence of bone, truncation of arms, and susceptibility artifacts) in standard DIXON-MR-AC maps affect lesion quantification in a PET/MR imaging cohort of lung cancer patients. Our main finding is that artifacts in the MR-AC maps introduce variability in the lung lesion SUVs of up to 22% in a test–retest set-up without patient repositioning. Absence of bone is caused by known limitations in the MR DIXON scan sequence and, therefore, is present in all scans (11). The impact of adding the anatomy-based bone template on the lung tumor SUVs was low (< 0.5%) (Fig. 4) and the effect is limited to the close vicinity of the spine (Fig. 5). This agrees with earlier studies that showed only local effect close to the bones and no clinically relevant effects for lung lesions, when omitting bone from the AC map (14,22,23).
Truncation artifacts were observed in all AC maps. These artifacts arise from fixed geometrical limitations in the MR FOV and, thus, are not expected to affect test–retest examinations. This is also in agreement with an earlier study (17). We found that truncation artifacts introduced up to 3% relative differences in the lung tumor SUV values (Fig. 4) and even larger effects inside the truncated regions (Fig. 5), which is in accordance with previous studies (24,25). This result indicates that accurate truncation correction of the AC maps is not necessarily critical for clinically relevant lung tumor quantification (6).
The frequency of susceptibility artifacts was reproducible between test–retest scans (Table 1). This agrees with a previous study focusing on artifacts in MR-AC maps for cardiac PET/MR applications (17). However, in the present study we report a reduced frequency of susceptibility artifacts (12%), compared to the previous study (25%). This is due to the fact that cardiac patients have a higher frequency of sternal wires following from cardiac surgeries, compared to lung cancer patients. For two of the acquisitions in our study (Patients 20 and 21, test scan), the susceptibility artifacts in the sternum caused misclassified voxels in parts of the lungs, due to failure of the lung segmentation algorithm. For these scans, the artifact correction, and subsequent filling of the lungs with correct attenuation values, had a large impact (>100%) on the resulting PET SUV values in the lungs (Fig. 5 and Supplementary Fig. S2) and on the corresponding lung tumor SUVs ((−5.2) – (−22.1%)) (Table 2). For acquisitions with susceptibility artifacts where the lung segmentation was successful, the impact of the corrections on the SUVs were lower ((−0.3) – (−2.8%)) (Table 2 and Supplementary Fig. S1). This demonstrates that the accuracy in the attenuation values of the tissue surrounding a lung lesion is important for accurate tumor quantification, as also reported in an earlier study (19). Furthermore, the importance of correct attenuation values in the sternum, for lesion quantification, was shown in another recent study (26).
The combined effect of the applied corrections for the absence of bone and truncation had only limited effect (RD < 3%) on the lung tumors (Fig. 4). However, correcting for susceptibility artifacts, introduced by sternal wires, caused a RD in the lesions of up 28.7% (Table 2), a clinically relevant measure (6), which may affect the treatment assessment of the patient, as the effects from these artifacts were not reproducible between test–retest scans.
We report tissue inversion artifacts in 26/50 (52%) acquisitions, with low reproducibility (37%) between test–retest scans (Table 1). Our incidence rate is higher than previously reported for other disease groups (16,17). Tissue inversion artifacts in the AC maps may introduce up to 35% quantification errors in the affected areas of the PET image (16). In the current study, tissue inversion was observed exclusively in the abdomen of the patient. This explains the higher frequency of tissue inversion in retest scans (two-bed), compared to test scans (one-bed). Because all lung lesions were far away from the affected areas, the impact on tumor quantification was anticipated to be low; therefore, no tissue inversion correction was employed in the current study.
In response assessment studies, both lesion size and SUV can be used as measures of therapy response, where one or both may decrease after successful therapy (6). In this study, it was found that the AC map corrections had no impact on the measured lesion diameter or volume (Table 3, Figs. 6 and 7), thus, lesion size-based assessment of therapy response is independent of AC map artifact corrections. Furthermore, the increase in SUV values due to the corrections were independent of tumor size (Figs. 6 and 7); however, because the SUV values were increased by the corrections (Table 2 and Figs. 4, 6, and 7 and Table 2), careful inspection and correction of the AC maps, before PET image reconstruction, is still critical in SUV-based response assessment studies.
Our study has several limitations. Bone artifacts were corrected using an anatomy-based bone template (19), which does not model the ribs. However, the effect of the ribs is expected to be non-significant, due to their breathing-induced shifting during acquisition and the fact that they are small and mainly consist of trabecular bone (27).
Further, susceptibility artifacts in the MR-AC maps were corrected with a simple, manual method in this study. More advanced and fully automatic correction methods have been proposed earlier (28,29). However, with the introduction of novel artifact reducing MR sequences (e.g. MAVRIC, VAT, WARP, etc.), susceptibility artifacts could be minimized already at acquisition, thus potentially eliminating the need for manual retrospective correction of the AC maps. Unfortunately, such sequences are currently time-consuming, which hampers the implementation into clinical routine (30–33).
While the PET/MR system evaluated in the current study used a DIXON-based sequence for AC, other systems, using non-DIXON-based sequences, may cause other types of errors. However, systems using, for example, T1-weighted fast gradient-echo sequences, are expected to be prone to similar types of artefacts as the DIXON-based methods.
Another limitation was that different FOVs were used between test and retest scans. However, this is assumed to have minimal effect on the resulting SUV mean and SUV peak , because of their robustness to noise, and because the same lung segmentation algorithm was applied in both one-bed and two-bed scans (14,34).
In addition, we did not investigate the effect of respiratory motion on the MR-AC maps, which is known to introduce large biases in thoracic PET imaging (35–37).
Lastly, there was a relatively small number of patients included in this study.
In conclusion, the majority of artifacts found in the MR-AC maps, in this clinical PET/MR lung cancer study, did not affect the quantitative accuracy of SUV or tumor size measurements. However, susceptibility artifacts may cause clinically relevant variations in lung tumor SUV measurements, which might affect the accuracy in serial studies of the same patient. Therefore, our findings warrant careful inspection of the MR-AC maps and subsequent correction of susceptibility artifacts, to ensure the highest possible diagnostic accuracy of the PET/MR examination.
Supplemental Material
Supplemental material for Quantitative PET/MR imaging of lung cancer in the presence of artifacts in the MR-based attenuation correction maps
Supplemental Material for Quantitative PET/MR imaging of lung cancer in the presence of artifacts in the MR-based attenuation correction maps by Samuel Kuttner, Martin Lyngby Lassen, Silje Kjærnes Øen, Rune Sundset, Thomas Beyer and Live Eikenes in Acta Radiologica
Footnotes
Declaration of conflicting interests
The author(s) declared no potential conflicts of interest with respect to the research, authorship, and/or publication of this article.
Funding
The author(s) disclosed receipt of the following financial support for the research, authorship, and/or publication of this article: This work was supported by the Northern Norway Regional Health Authority (Grant No. HNF1349-17) and the Central Norway Regional Health Authority (Grant No. 46056912).
References
Supplementary Material
Please find the following supplemental material available below.
For Open Access articles published under a Creative Commons License, all supplemental material carries the same license as the article it is associated with.
For non-Open Access articles published, all supplemental material carries a non-exclusive license, and permission requests for re-use of supplemental material or any part of supplemental material shall be sent directly to the copyright owner as specified in the copyright notice associated with the article.