
Abstract
Cancer metastasis to bone is a frequent observation in malignancy that may result in complications such as pathological fractures and spinal cord compression. Monitoring treatment effects is the main concern in oncology; however, the evaluation of treatment response in bone is particularly challenging as it lacks well-established criteria. In addition, bone metastases have traditionally been considered non-measurable manifestations of cancer. Magnetic resonance imaging (MRI) is one of the most specific and sensitive methods for imaging skeletal metastases. The aim of this article is to highlight the diagnostic performance of MRI in the treatment monitoring of bone metastases, to review the current literature, and to provide an overview of recommendations for the evaluation of treatment response in bone.
Keywords
Introduction
Bone marrow is a frequent location of neoplastic disease, either secondary metastasis or hematologic cancers. Early detection of bone metastases greatly affects patient management and contributes to the prevention of complications such as pathological fractures or metastatic spinal cord compression (MSCC) (1). Breast and prostate carcinomas traditionally have a high affinity to bone due to the molecular interactions between these cancer cells and host cells. Other cancers also metastasize to bone, but often with a lower incidence because these cell types do not possess the properties necessary for the invasion and residence in the bone microenvironment (2,3).
Magnetic resonance imaging (MRI) is rapidly evolving as the most promising imaging method for the non-invasive evaluation of bone marrow. MRI is one of the most specific and sensitive methods for imaging skeletal metastases (1,4–8) and is the primary imaging modality used for suspected MSCC (4,9–11). Being an imaging technique that allows a direct visualization of bone marrow components with high spatial resolution (1), MRI combines both morphological and functional imaging, thus providing detailed information on the bone marrow.
The evaluation of the tumor response to treatment is a key issue in clinical oncology. The evaluation of tumor response in bone is particularly challenging as well-established criteria are lacking, and bone metastases have traditionally been considered non-measurable manifestations of cancer (12,13). MRI has a central role in the treatment monitoring of bone marrow metastases because of its wide availability in most departments and the ability to evaluate early posttreatment changes in bony lesions, often before the morphological response occurs. In recent years, the Dixon technique and diffusion-weighted MRI (DW-MRI) have emerged in oncologic imaging. Fat and water distribution (Dixon imaging) together with evaluation of bone edema and cell density (DW-MRI) provides important information on bone marrow pathology and can be combined for response assessment (7). Therapy assessments using MRI allow precise evaluation of lesion size and number and metastatic growth pattern as well as treatment-induced signal changes in bony lesions. Moreover, functional information derived from DW-MRI is an important part of the oncological work-up, as this technique enables detection of changes in water diffusion and cellular density that occur after therapy (14). Thus, the aim of this paper is to discuss and highlight the diagnostic performance of MRI in the treatment assessment of bone metastases, to review the current literature, and to provide an overview of guidelines proposed for the response evaluation of bony disease.
Pathomechanism of bone marrow metastases
Several mechanisms of bone metastasis have been suggested: dissemination of cancer cells from the primary tumor; systemic embolization; adherence to bone marrow vascular endothelium; extravasation into the bone marrow environment; and interaction with osteoblasts and/or osteoclasts (2,15,16).
Traditionally, bone metastases are divided into two major categories: osteolytic and osteoblastic (2). Osteolytic metastases are thought to be caused by the production of factors that activate osteoclasts. Osteoblastic metastases are thought to be caused by the production of factors that stimulate osteoblast proliferation. At present, we know that osteolytic and osteoblastic metastases represent two extremes and there is substantial evidence that both resorption and formation are activated in most metastases (2). In fact, the majority of tumor-induced bone lesions usually contain both lytic and blastic components; however, some exceptions to this general concept exist (16).
Bone metastases tend to develop in the axial skeleton in a distribution that correlates with the location of red bone marrow (1,17). Within the skeleton, the vertebral column is the most commonly affected region (18). Historically, the hematogenous dissemination of cancer cells was believed to occur primarily through the valveless venous system in the spine, Batson’s plexus (19). However, more recent work in animals has supported arterial embolization as the most common and important route of metastasis (9,18).
MRI techniques for bone marrow metastases
Since its introduction in the early 1980s, MRI has evolved to become the gold standard for evaluating bone marrow and the soft tissues within and adjacent to the bone (20). The key advantage of MRI is that the bone marrow can be directly evaluated using a variety of sequences (21), allowing both morphological and functional imaging.
A combination of unenhanced T1-weighted (T1W) and short tau inversion recovery (STIR) sequences has traditionally shown high sensitivity for bone metastases assessment (1). It has previously been shown that three-dimensional (3D) T1W sequences can be a promising alternative to two-dimensional sequences, providing a better signal-to-noise ratio and contrast-to-noise ratio and shortening the imaging time by avoiding the repetition of imaging planes (22). More recently, new contrast mechanisms for bone marrow evaluation have been introduced; in particular, the Dixon technique has emerged in recent years. This technique has been successfully used for assessing metastatic disease in bone, both as axial skeleton MRI (AS-MRI) and whole-body MRI (WB-MRI) (Fig. 1). In 1984, Dixon published the first paper on an imaging technique for water and fat separation (23). This technique acquires two separate images with a modified spin echo pulse sequence: an in-phase image and an out-of-phase image. From these two images, a water-only image and a fat-only image can be generated (23,24). A recent study by Maeder et al. showed that Dixon T2-weighted (T2W) fat-only and water-only imaging provides, in one sequence, a diagnostic performance similar to that of the standard combination of morphological sequences for assessing bone metastases, thereby providing an opportunity to reduce imaging time by eliminating the need for T1W sequences (25). In addition to a shorter scan time, a water-only Dixon image provides an excellent fat-suppression image, often superior to those obtained by the other methods. T2W Dixon sequences can also be performed after intravenous contrast without losing its sensitivity for detecting bony lesions. Our institution has a longstanding experience with the Dixon method in oncological imaging and this technique has now successfully replaced standard morphological sequences for the evaluation of bone marrow in our department. Despite its great clinical utility, limited data exist on the assessment of treatment response in bone marrow metastases using T2W Dixon imaging. On the other hand, some recently published studies included the T1W Dixon technique in oncological WB-MRI protocols (8,26). Quantitative MRI parametric response mapping of bone marrow fat using Dixon imaging has also been recently proposed to assess therapy for hematological bone marrow malignancies (27).

Example of AS-MRI (a–h) and WB-MRI (i–n) using T2W Dixon sequences and DW-MRI. T2 Dixon fat-only (a, e, i, k) and water-only images (b, f, j, l) are typically used for bone marrow evaluation, providing similar contrast to T1W sequences and short tau inversion recovery (STIR) but in a shorter scan time. DW-MRI (b = 800 s/mm2) (c, g, m) and ADC maps (d, h, n) are also shown. AS-MRI: axial skeleton magnetic resonance imaging; WB-MRI: whole-body magnetic resonance imaging; T2W: T2-weighted; DW-MRI: diffusion-weighted magnetic resonance imaging; ADC: apparent diffusion coefficient.
DW-MRI is increasingly being used to monitor treatment response in bone metastases (28,29) and is now a mandatory component of oncological MRI protocols. This technique allows non-invasive characterization of biological tissues based on measurements of the random microscopic motion of water protons (Brownian motion) (1). The basis for the use of DW-MRI is that malignant tissues are usually more cellular than benign or normal tissues. Thus, this feature will result in a higher signal intensity (SI) for malignant tissue on high b-value images with a corresponding low SI on apparent diffusion coefficient (ADC) maps (1,29,30). Therapy assessment using DW-MRI is made by observing changes in the extent, symmetry, and SI on high b-value images and ADC maps and seeking correlations on morphological sequences (Fig. 2) (29,31–34). When bone marrow disease is treated successfully, tumor cell death usually results in increased water diffusivity manifested as an increased ADC (29). Note that in some cases, responding bony lesions can present with a decrease in ADC values together with a decreased SI on high b-value images. This pattern can usually be explained by treatment-induced sclerosis or calcifications in treated metastases (29) (Fig. 3).
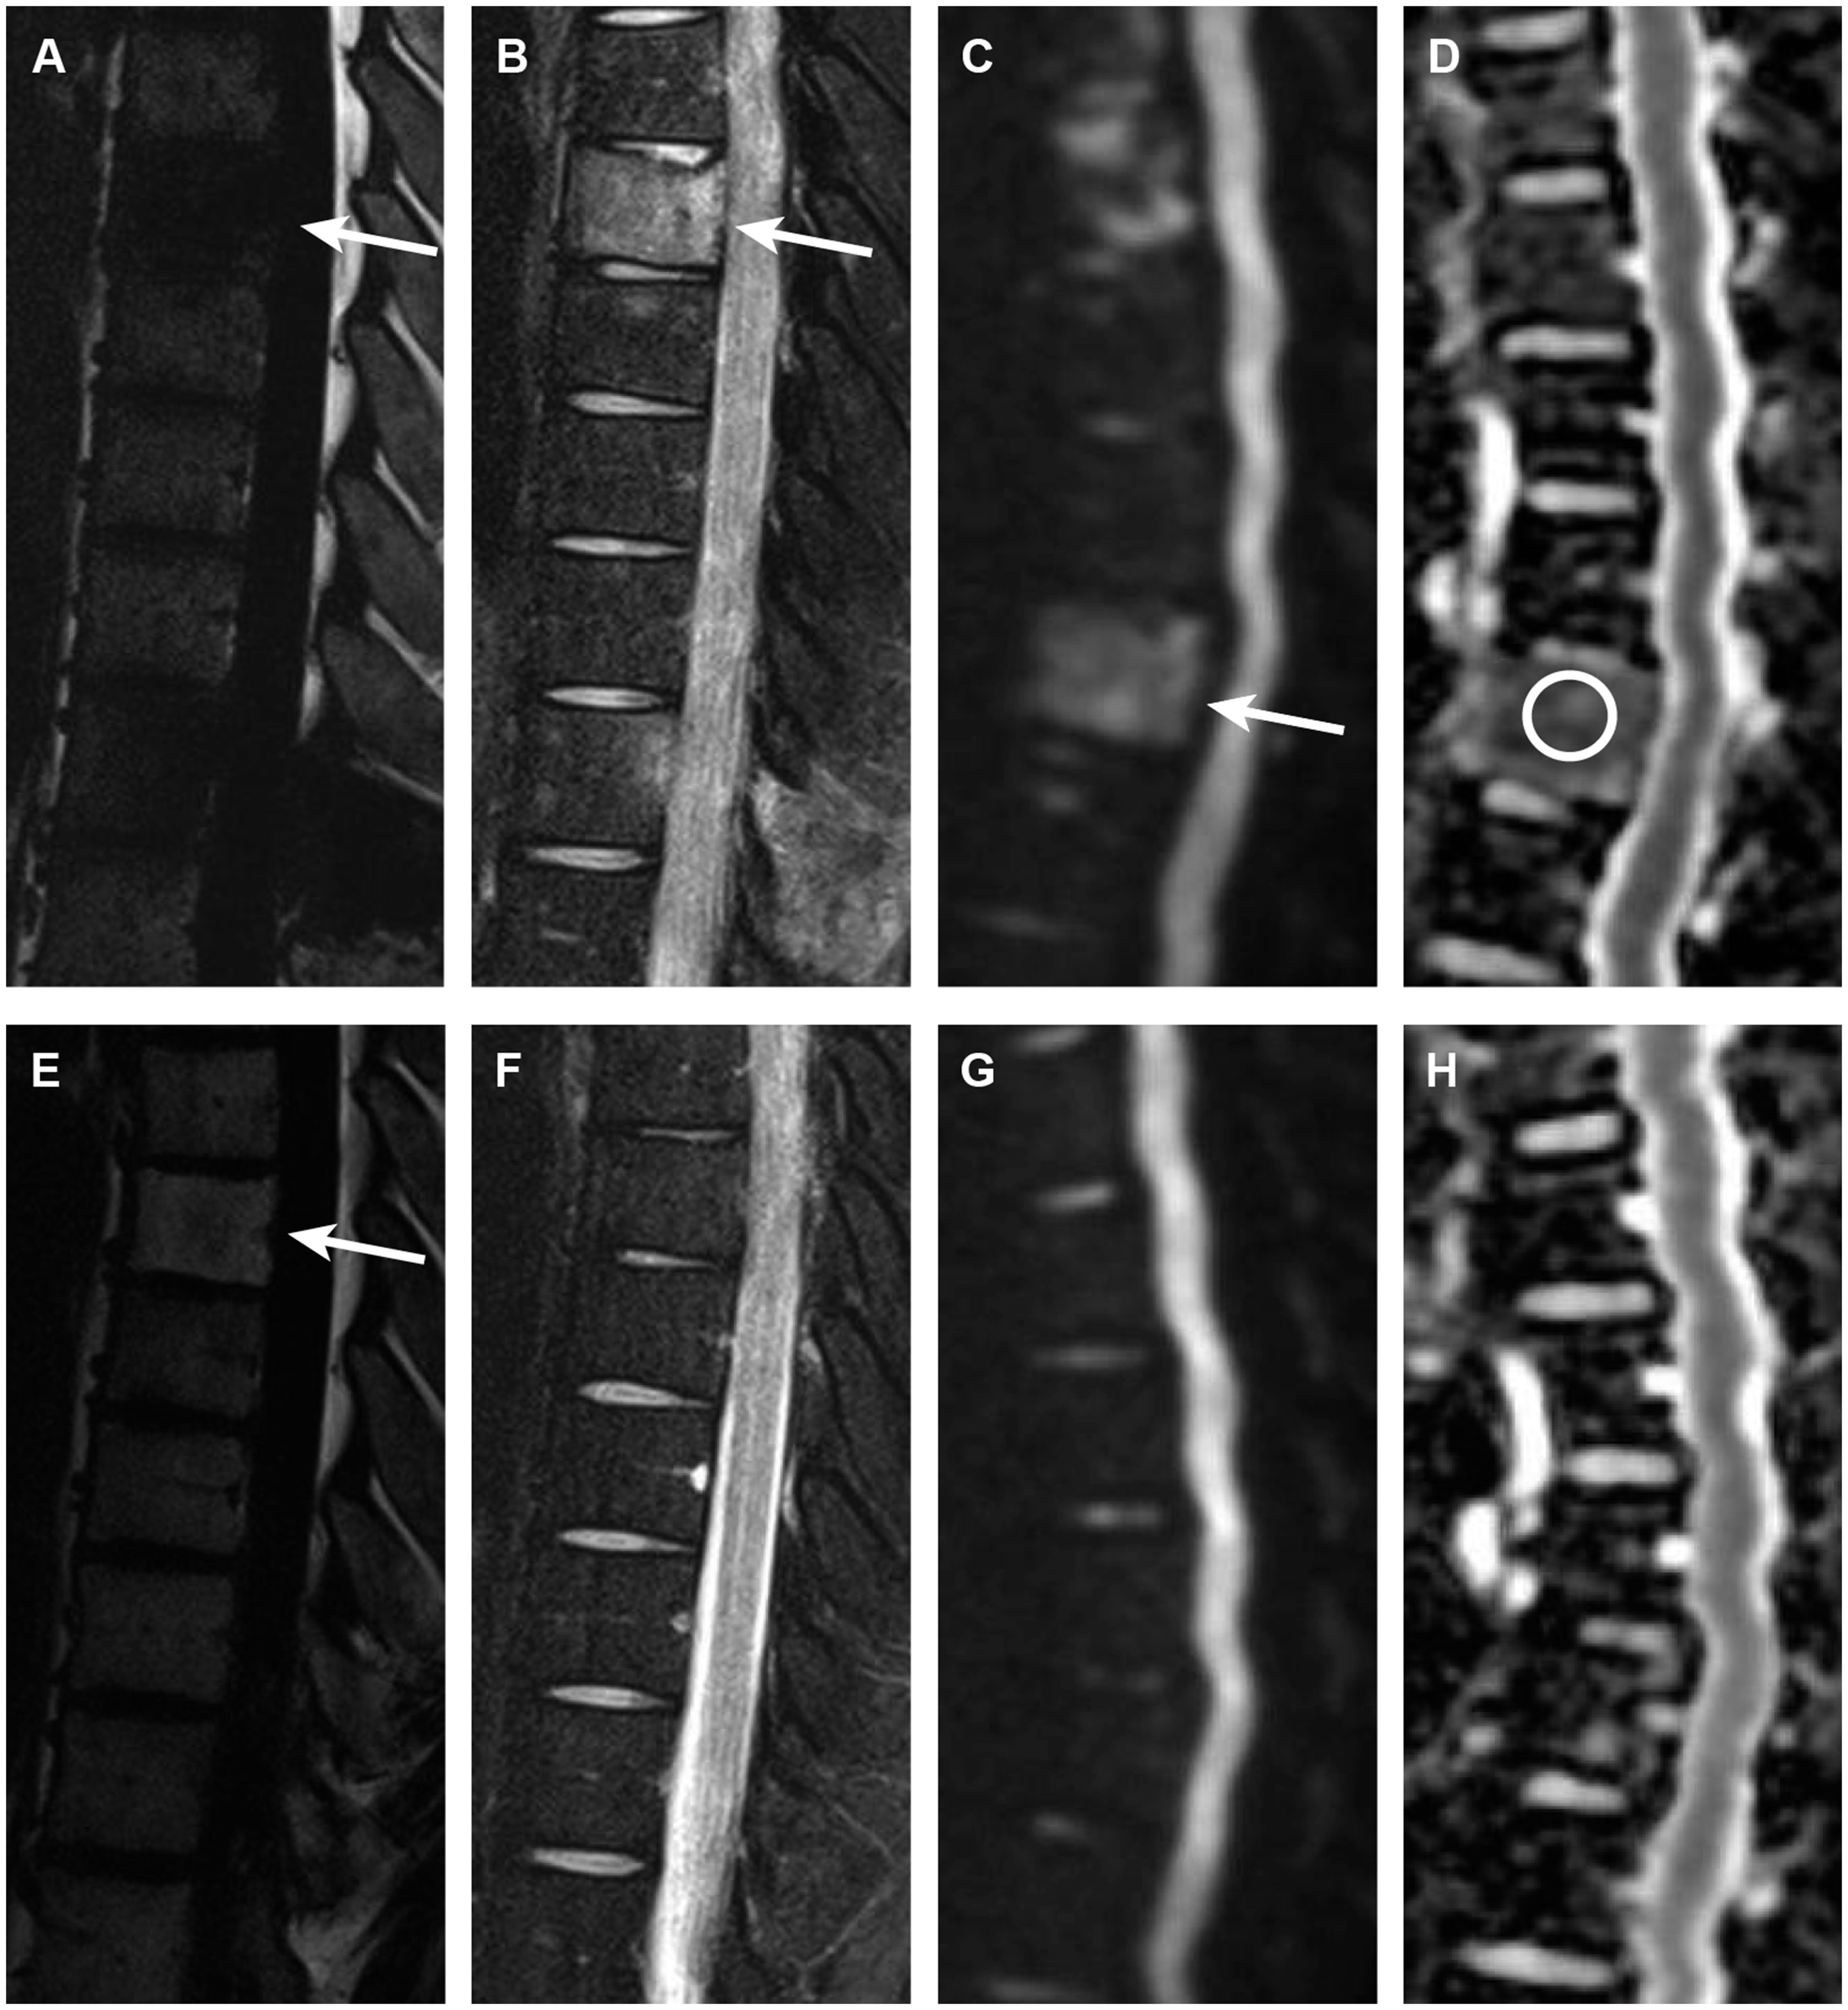
Sagittal T2W Dixon and DW-MRI performed in a patient with bone marrow involvement in Hodgkin’s lymphoma. Pretreatment fat-only (a) and water-only (b) T2 Dixon images show focal lesions spread in bone marrow, consistent with tumor manifestations (white arrows). Pretreatment DW-MRI (c, white arrow) (b = 800 s/mm2) shows high signal intensity in a tumor with a corresponding low ADC (d) (0.8 × 10⁻³ mm2/s). Post-treatment fat-only (e) and water-only (f) images shows nearby complete resolution of lesions. Note the slightly higher signal intensity in the previous tumor location on fat-only images (e, white arrow) consistent with treatment-induced fat infiltration of bone marrow. Follow-up DW-MRI (g) and an ADC map (h) both show normalization of the bone marrow signal. T2W: T2-weighted; DW-MRI: diffusion-weighted magnetic resonance imaging; ADC: apparent diffusion coefficient.
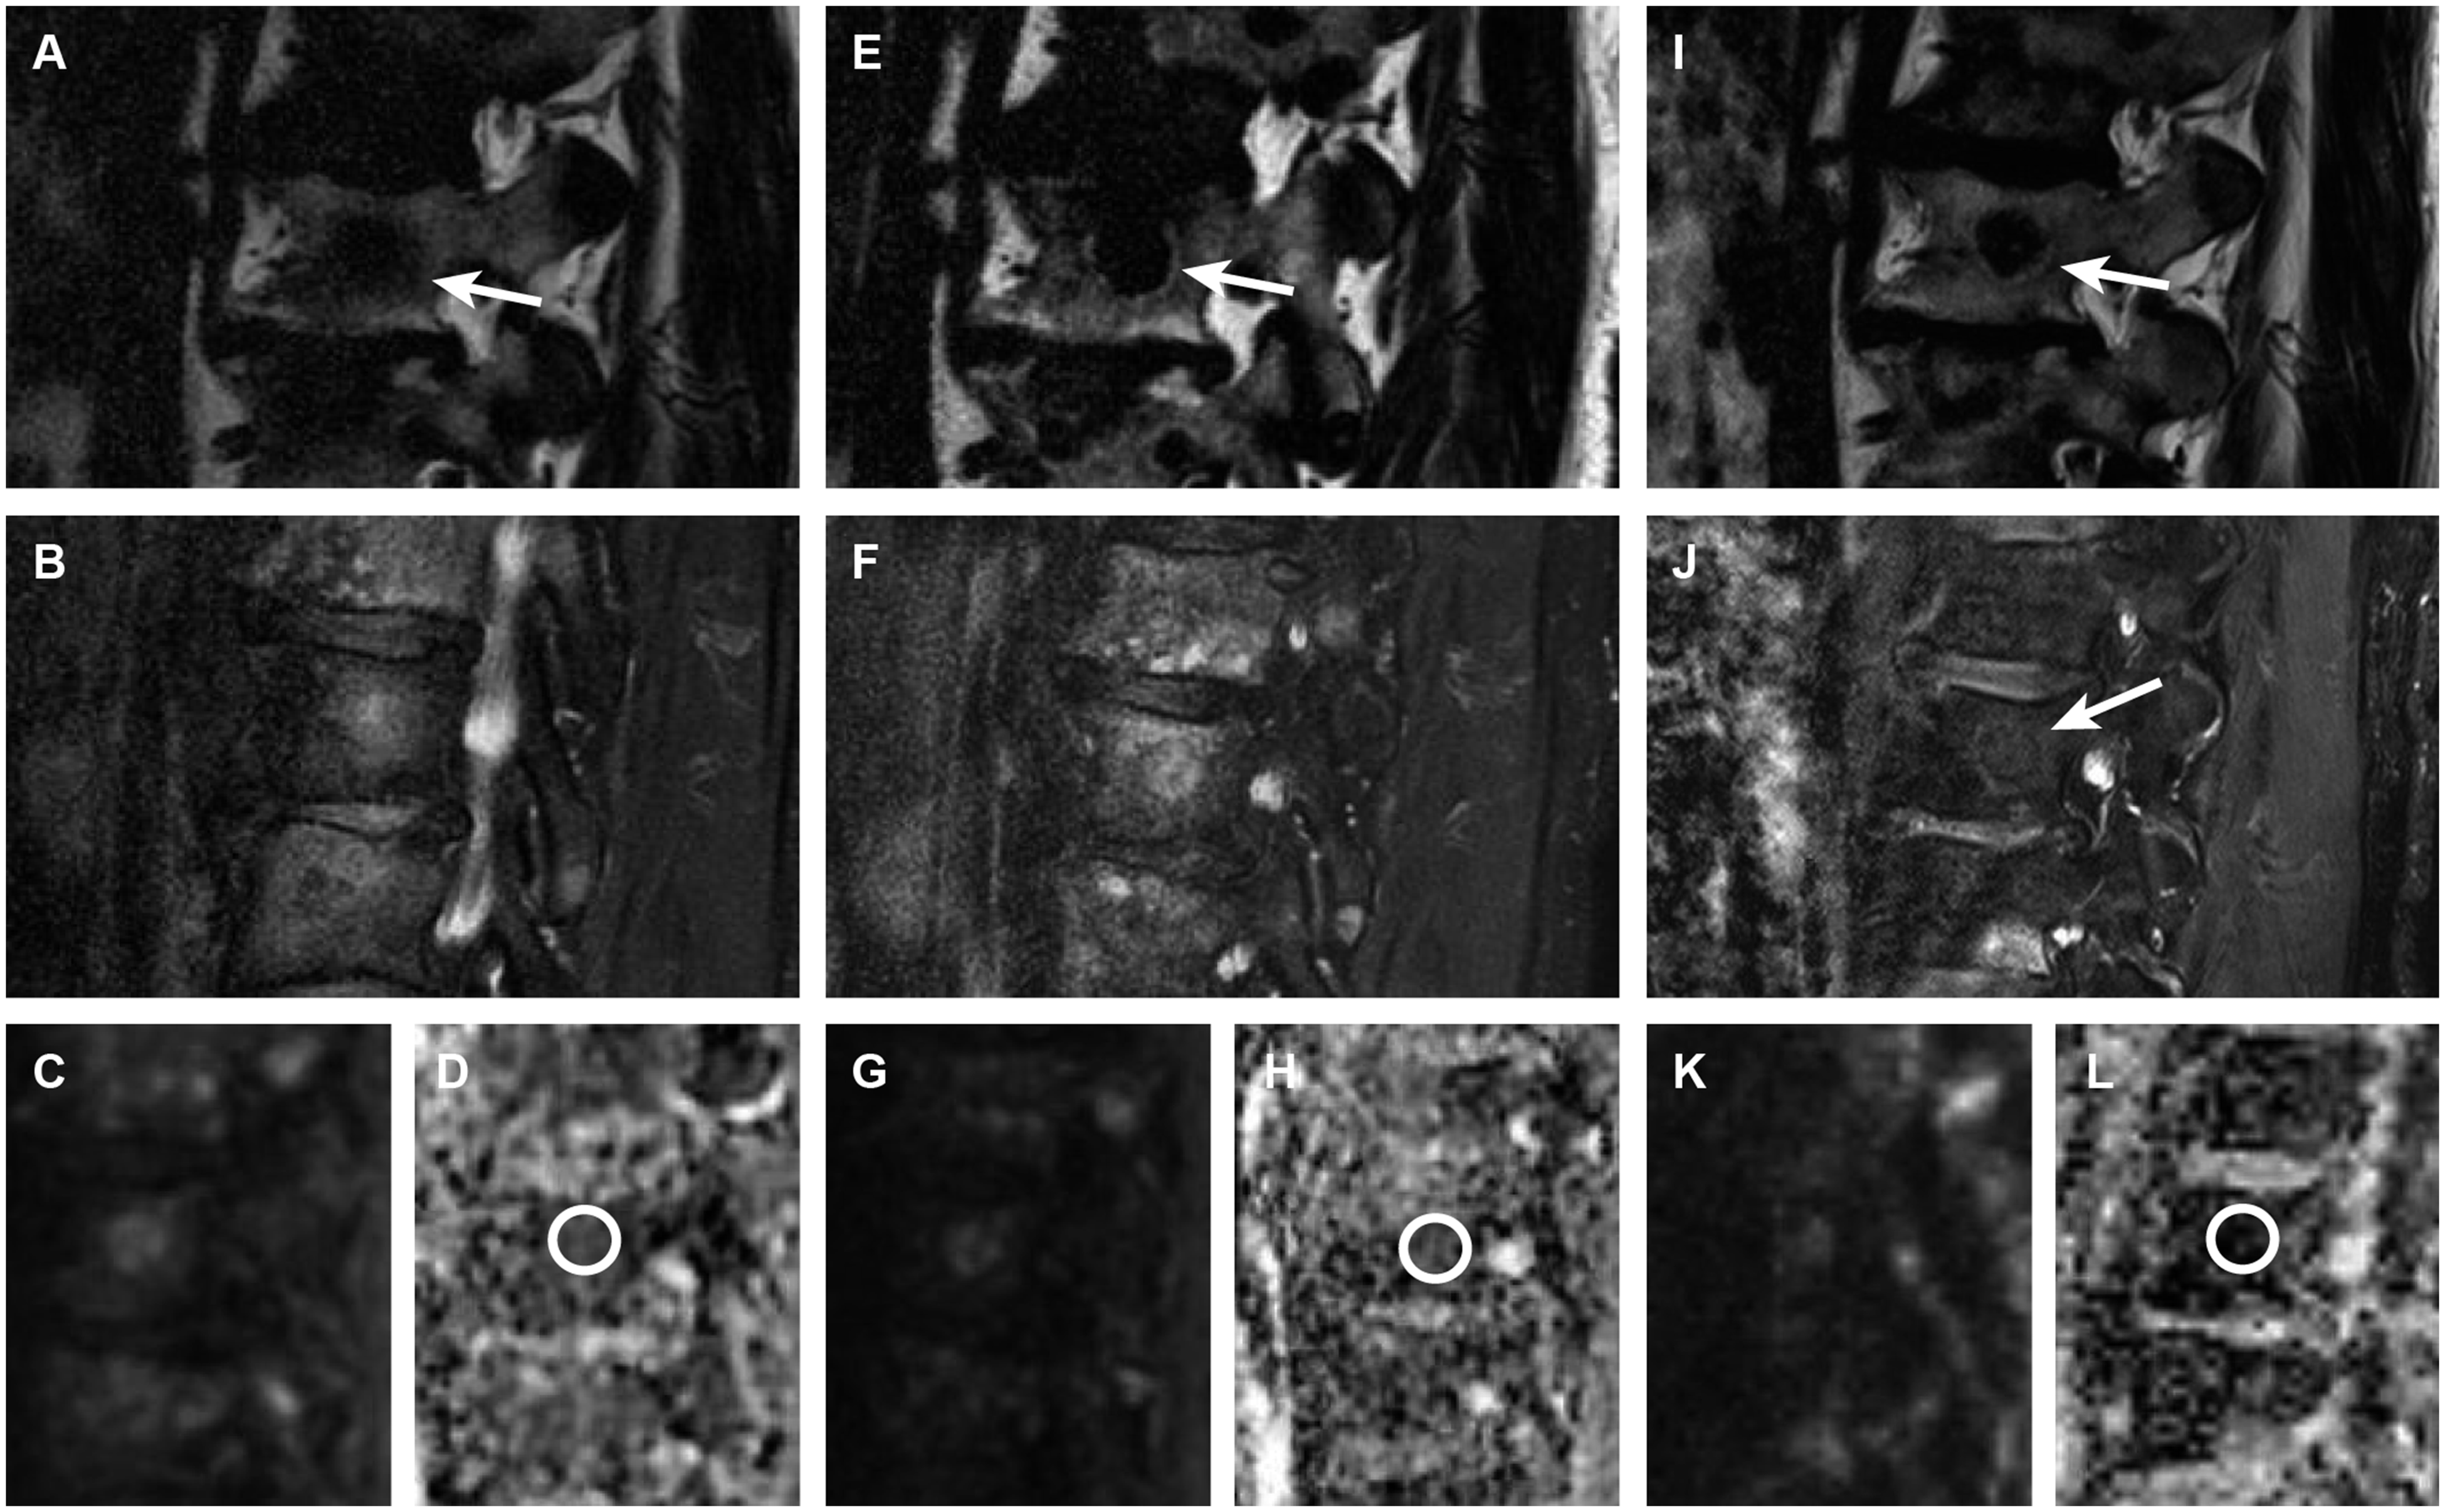
Treatment response on T2W Dixon images and DW-MRI in a patient with metastatic prostate cancer. Pretreatment fat-only (a) and water-only (b) T2 Dixon images and DW-MRI (c) show multiple focal lesions in bone marrow, consistent with disseminate metastatic disease. The low ADC (d) (0.8 × 10⁻³ mm2/s), consistent with an active tumor. Follow-up MRI performed three months after the start of combined androgen deprivation therapy and chemotherapy (e–h) shows a subtle fatty halo sign around numerous lesions on fat-only images (e, white arrow); the lesions are generally better demarcated (e, f), probably due to the resolution of perilesional edema. These findings are consistent with the treatment response, despite only small changes in the size of lesions. The ADC is slightly higher (h) (1.0 × 10⁻³ mm2/s), which is also consistent with treatment response. Follow-up images, 12 months after the start of treatment (i–l), shows slight shrinking of lesions that are now presenting with intra- and perilesional fat on fat-only images (i, white arrow) and a clearly lower water content on water-only images (j, white arrow). The latter is most likely due to treatment-induced fibrosis/sclerosis. The ADC is now very low (l) (0.42 × 10⁻³ mm2/s), which is also consistent with sclerosis or calcifications in the treated tumor. There were no clear corresponding signal changes on b800 DW-MRI (k); however, some artifacts complicated the evaluation. T2W: T2-weighted; DW-MRI: diffusion-weighted magnetic resonance imaging; ADC: apparent diffusion coefficient.
The intravoxel incoherent motion (IVIM) model with multi b-value DW-MRI can account for the pure diffusion characteristics (D), separate the pseudodiffusion (D*) effect caused by microcirculation or blood perfusion, and determine the perfusion fraction (f) corresponding to the fraction of signal arising from the vascular component (35). In fact, IVIM DW-MRI can simultaneously provide information about tumor perfusion and diffusion without using contrast medium (36). A previously published study by Gaeta et al. showed that IVIM DW-MRI can be effective in assessing the treatment response to radiotherapy (RT) in bone metastases from breast cancer (37).
Dynamic contrast-enhanced MRI (DCE-MRI) is another technique that can be used to assess the response to therapy. It provides functional information on the tumor vascularity and hemodynamics. This technique involves rapid intravenous injection of gadolinium and repeated acquisition of T1W sequences to track the accumulation of contrast medium in the tissue (38). In a two-compartment kinetic model based on the exchange of contrast between the vascular and interstitial spaces, the contrast agent is initially assumed to be distributed in the blood plasma volume (vp) with a time-dependent leakage (Ktrans) into the interstitial space (38,39). A study by Chu et al. showed that changes in blood perfusion, particularly the vascular parameter vp, reflected tumor responses to RT in bone marrow (38). The decrease in vp observed after RT most likely represents the diminished vascularity of successfully treated spinal metastases. The increase in vp observed in cases of treatment failure supports the observation that progressing bone metastases secrete angiogenesis-inducing factors (38). Another study found that changes in vp can be observed as early as 1 h after RT for spinal metastases (40). Despite promising results, the contrast-enhanced MRI techniques are not routinely used in the therapy assessment of bony metastases (Fig. 4).
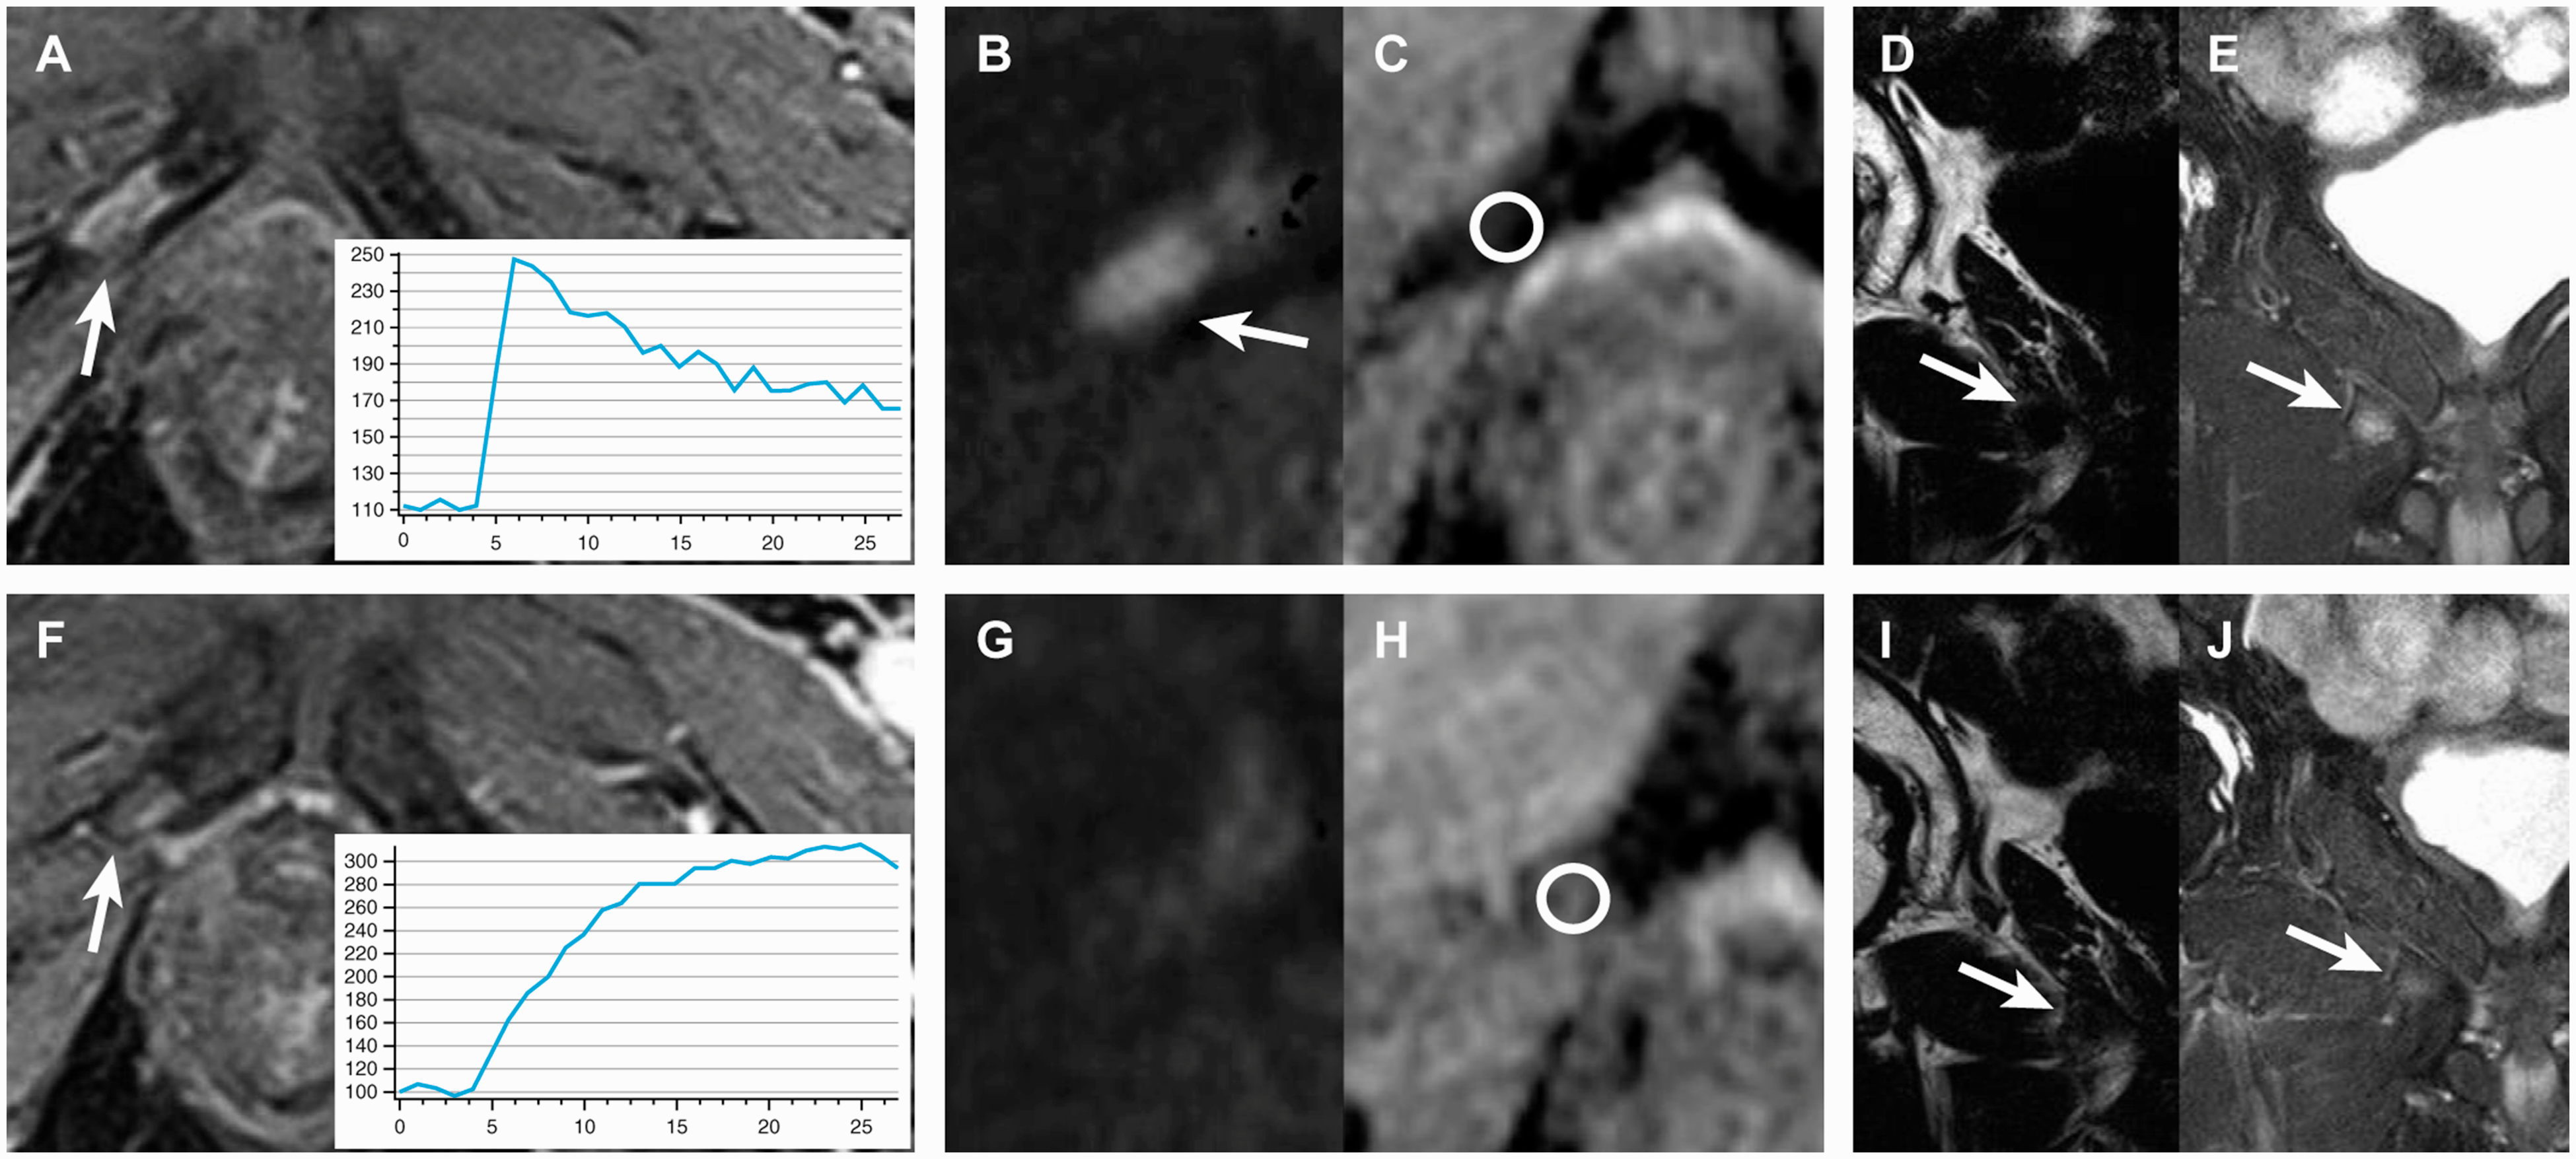
Monitoring of treatment response using DCE-MRI perfusion in a solitary bone metastasis from prostate cancer. Pretreatment MR images, including DCE-MRI source images (3D spoiled gradient echo sequence with two-point Dixon water-fat separation) and permeability curve (a), DW-MRI (b), ADC map (c), and fat-only (d) and water-only (e) T2 Dixon images are shown in the upper row. The metastasis in the right pubic bone (white arrows) shows a rapid initial permeability on DCE-MRI (a), which is typical for an active, untreated tumor. DW-MRI shows a high signal intensity (b, white arrow) along with a corresponding low ADC (c) (0.69 × 10⁻³ mm2/s). The tumor also has typical signal characteristics on T2 Dixon images (d, e, white arrows). The MR images in the lower row were performed six months after the start of combined androgen deprivation therapy and chemotherapy. The permeability curve demonstrates a slower rise in signal, suggesting a treated tumor (f). There is resolution of the high signal intensity on DW-MRI (g) and an increase in ADC values compared with pretreatment scans (h) (1.0 × 10⁻³ mm2/s), consistent with the treatment response. The metastasis has a slightly higher signal on fat-only images (i, white arrow) due to treatment-induced fat infiltration and a corresponding slightly lower signal on water-only T2 Dixon images (j, white arrow). DCE-MRI: dynamic contrast-enhanced magnetic resonance imaging; MR: magnetic resonance; DW-MRI: diffusion-weighted magnetic resonance imaging; ADC: apparent diffusion coefficient.
Recently, the study of the whole body using MRI has gained increasing attention, with a rapidly growing number of indications (8,41). For oncologic imaging, the comprehensive, reliable, and early diagnosis of disease provided by means of WB-MRI offers adequate tools to initiate treatment and monitor its effects (41). WB-MRI by definition is not limited to the skeleton; it allows evaluation of visceral metastases and pathological lymph nodes in addition to bony lesions. In prostate cancer, a combined approach of WB-MRI and prostate-specific MRI has been shown to be useful at very low levels of prostate-specific antigen (42–44). The potential disadvantage of WB-MRI is that the interpretation can be challenging given the huge amount of information provided, as several hundred images are routinely obtained (41). Thus, the sensitivity of WB-MRI for detecting lesions can be lower than that of organ-specific MRI (5).
MRI versus other imaging methods for assessing bone marrow metastases
There are many good reasons to call MRI a gold standard for assessing metastatic disease in bone. An unquestionable strength of this method is its high sensitivity and specificity for detecting new lesions, along with its easy accessibility and relatively low cost compared with many nuclear medicine techniques.
In the early 2000s, combined positron emission tomography (PET)/computed tomography (CT) and single-photon emission tomography (SPECT)/CT became a reality, fusing the molecular sensitivity of nuclear imaging with the anatomic specificity of CT, thereby further increasing diagnostic accuracy in cancer imaging (45). According to published data, Tc99m bone scintigraphy has a sensitivity of approximately 51–86% (5,46), whereas choline and sodium fluoride PET/CT has a sensitivity of 85% and 93%, respectively (8,46). Despite the documented low sensitivity of bone scintigraphy for detecting metastases, this method is still recommended for metastatic screening by several European guidelines, particularly in prostate and breast cancer (47).
According to published data, MRI has a 91% sensitivity for detecting new bone metastases (5,21), which is far higher than that of bone scintigraphy (Fig. 5), and at least comparable to choline and sodium fluoride PET/CT (Fig. 6). The diagnostic performance of MRI depends on the protocol; it has been shown that DW increases the sensitivity of MRI for detecting new metastases compared with morphological sequences alone (5). With a specificity of approximately 95% (5,21), MRI can conveniently recognize bone metastases compared with the 81% and 54% specificity for bone scintigraphy and sodium fluoride PET/CT, respectively (46). Using SPECT increases the specificity of bone scintigraphy; however, the specificity of SPECT is still lower than that of MRI (5). A clear technical disadvantage of PET, similar to scintigraphy, is its poor anatomical resolution, which often made determining the exact location of the lesion difficult (1). A high anatomical resolution of MRI is particularly important in imaging spinal metastases, where detailed information on intraspinal tumor growth and compression of the medulla spinalis is mandatory for both RT and surgical planning (Fig. 7).
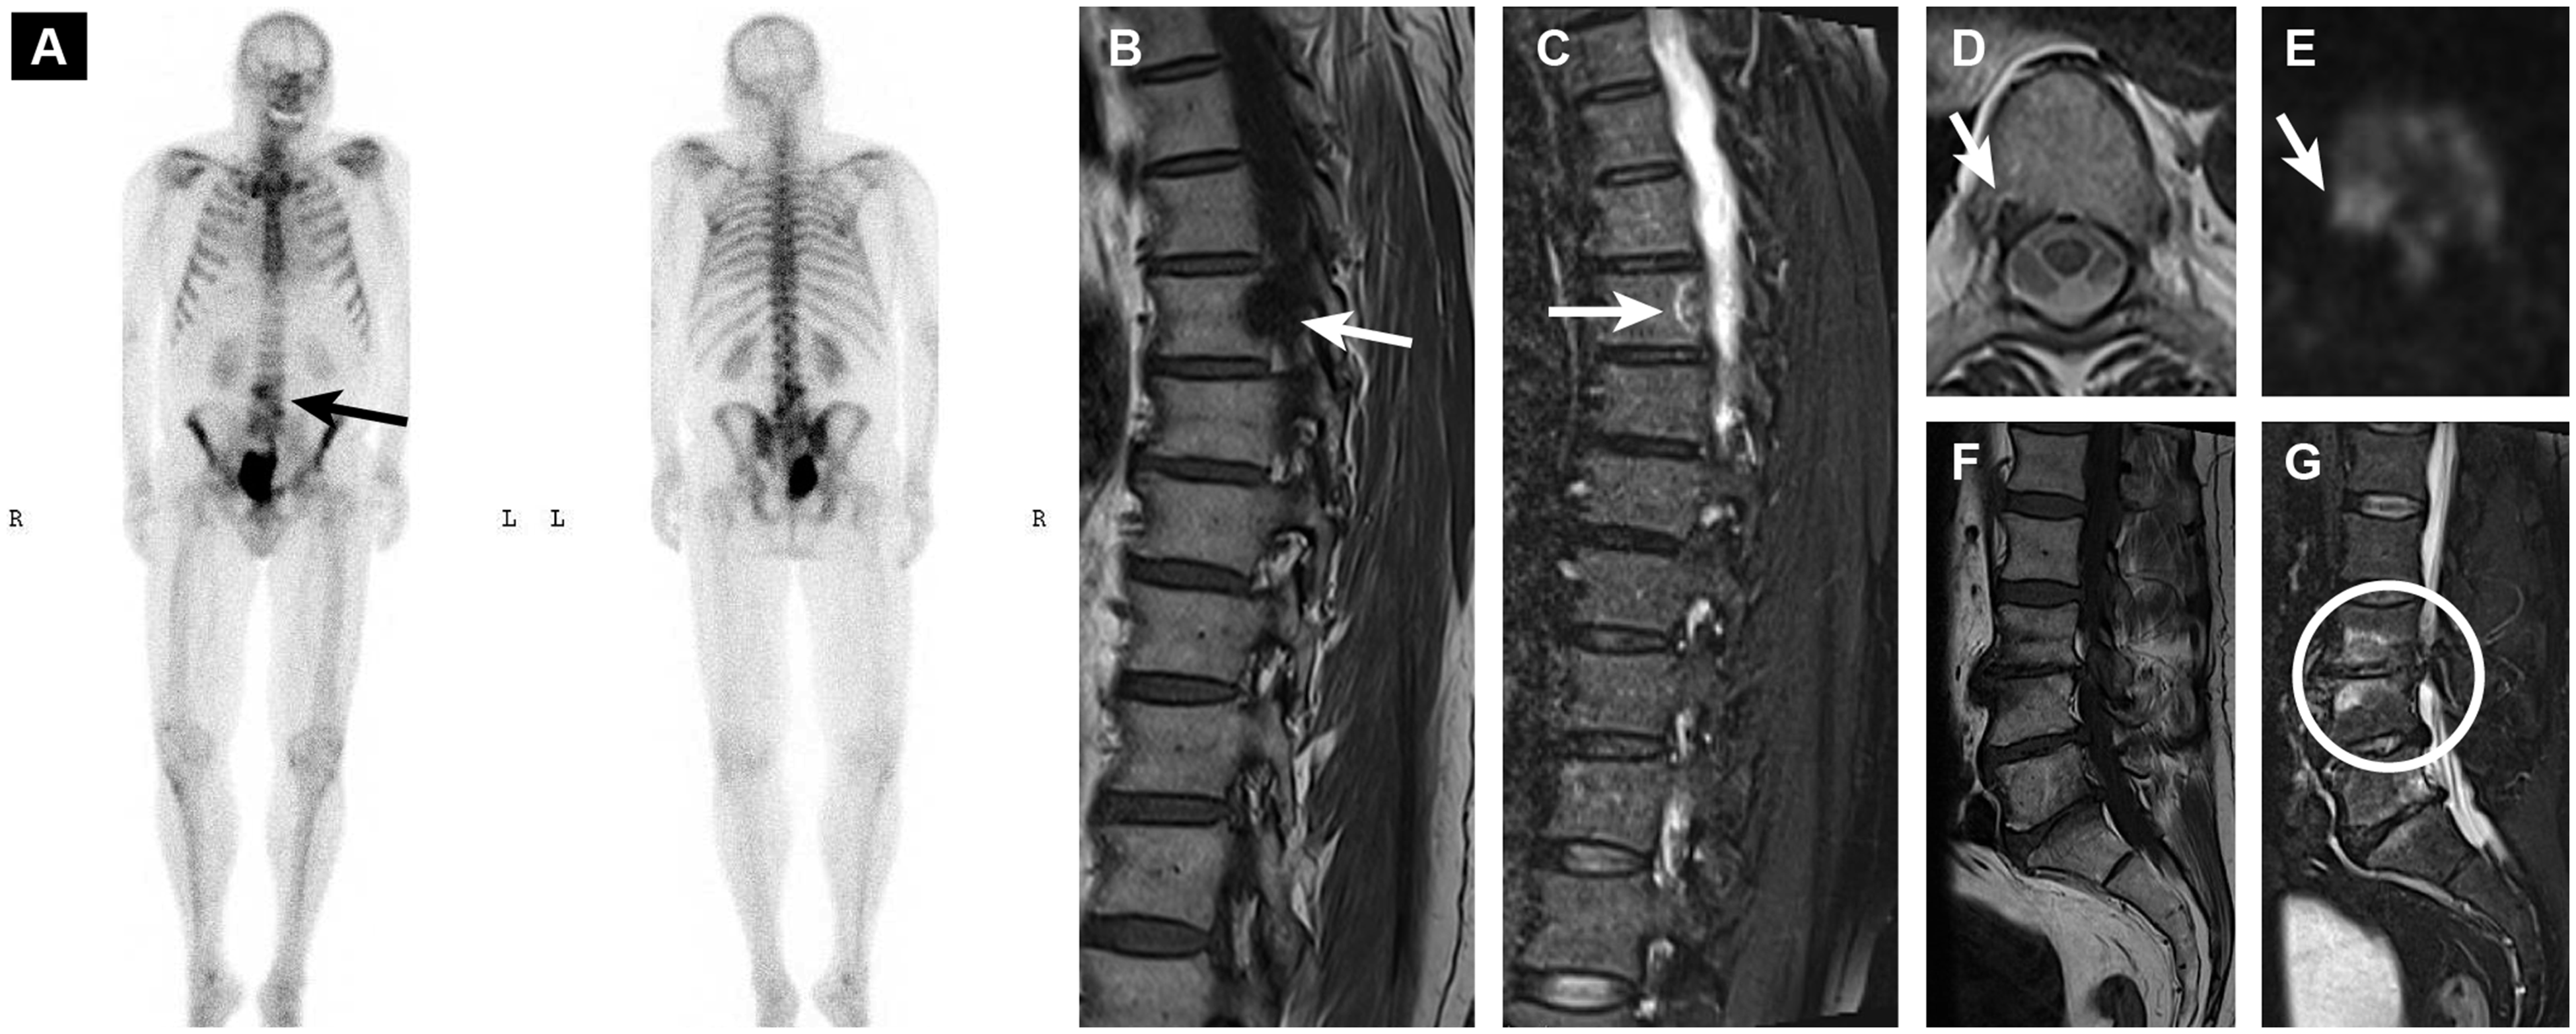
Absence of sensitivity of bone scintigraphy for detecting metastases. The bone scintigraphy is negative (a), except for some tracer uptake in the lumbar spine (black arrow) that can be caused by the degenerative spine disease. MRI (b–e, white arrows) clearly shows predominantly osteoblastic metastasis in the thoracic spine, undetectable on bone scintigraphy. Degenerative disc disease and endplate changes are also nicely shown on the MRI (f, g, white circle), confirming findings on the bone scintigraphy. MRI: magnetic resonance imaging.
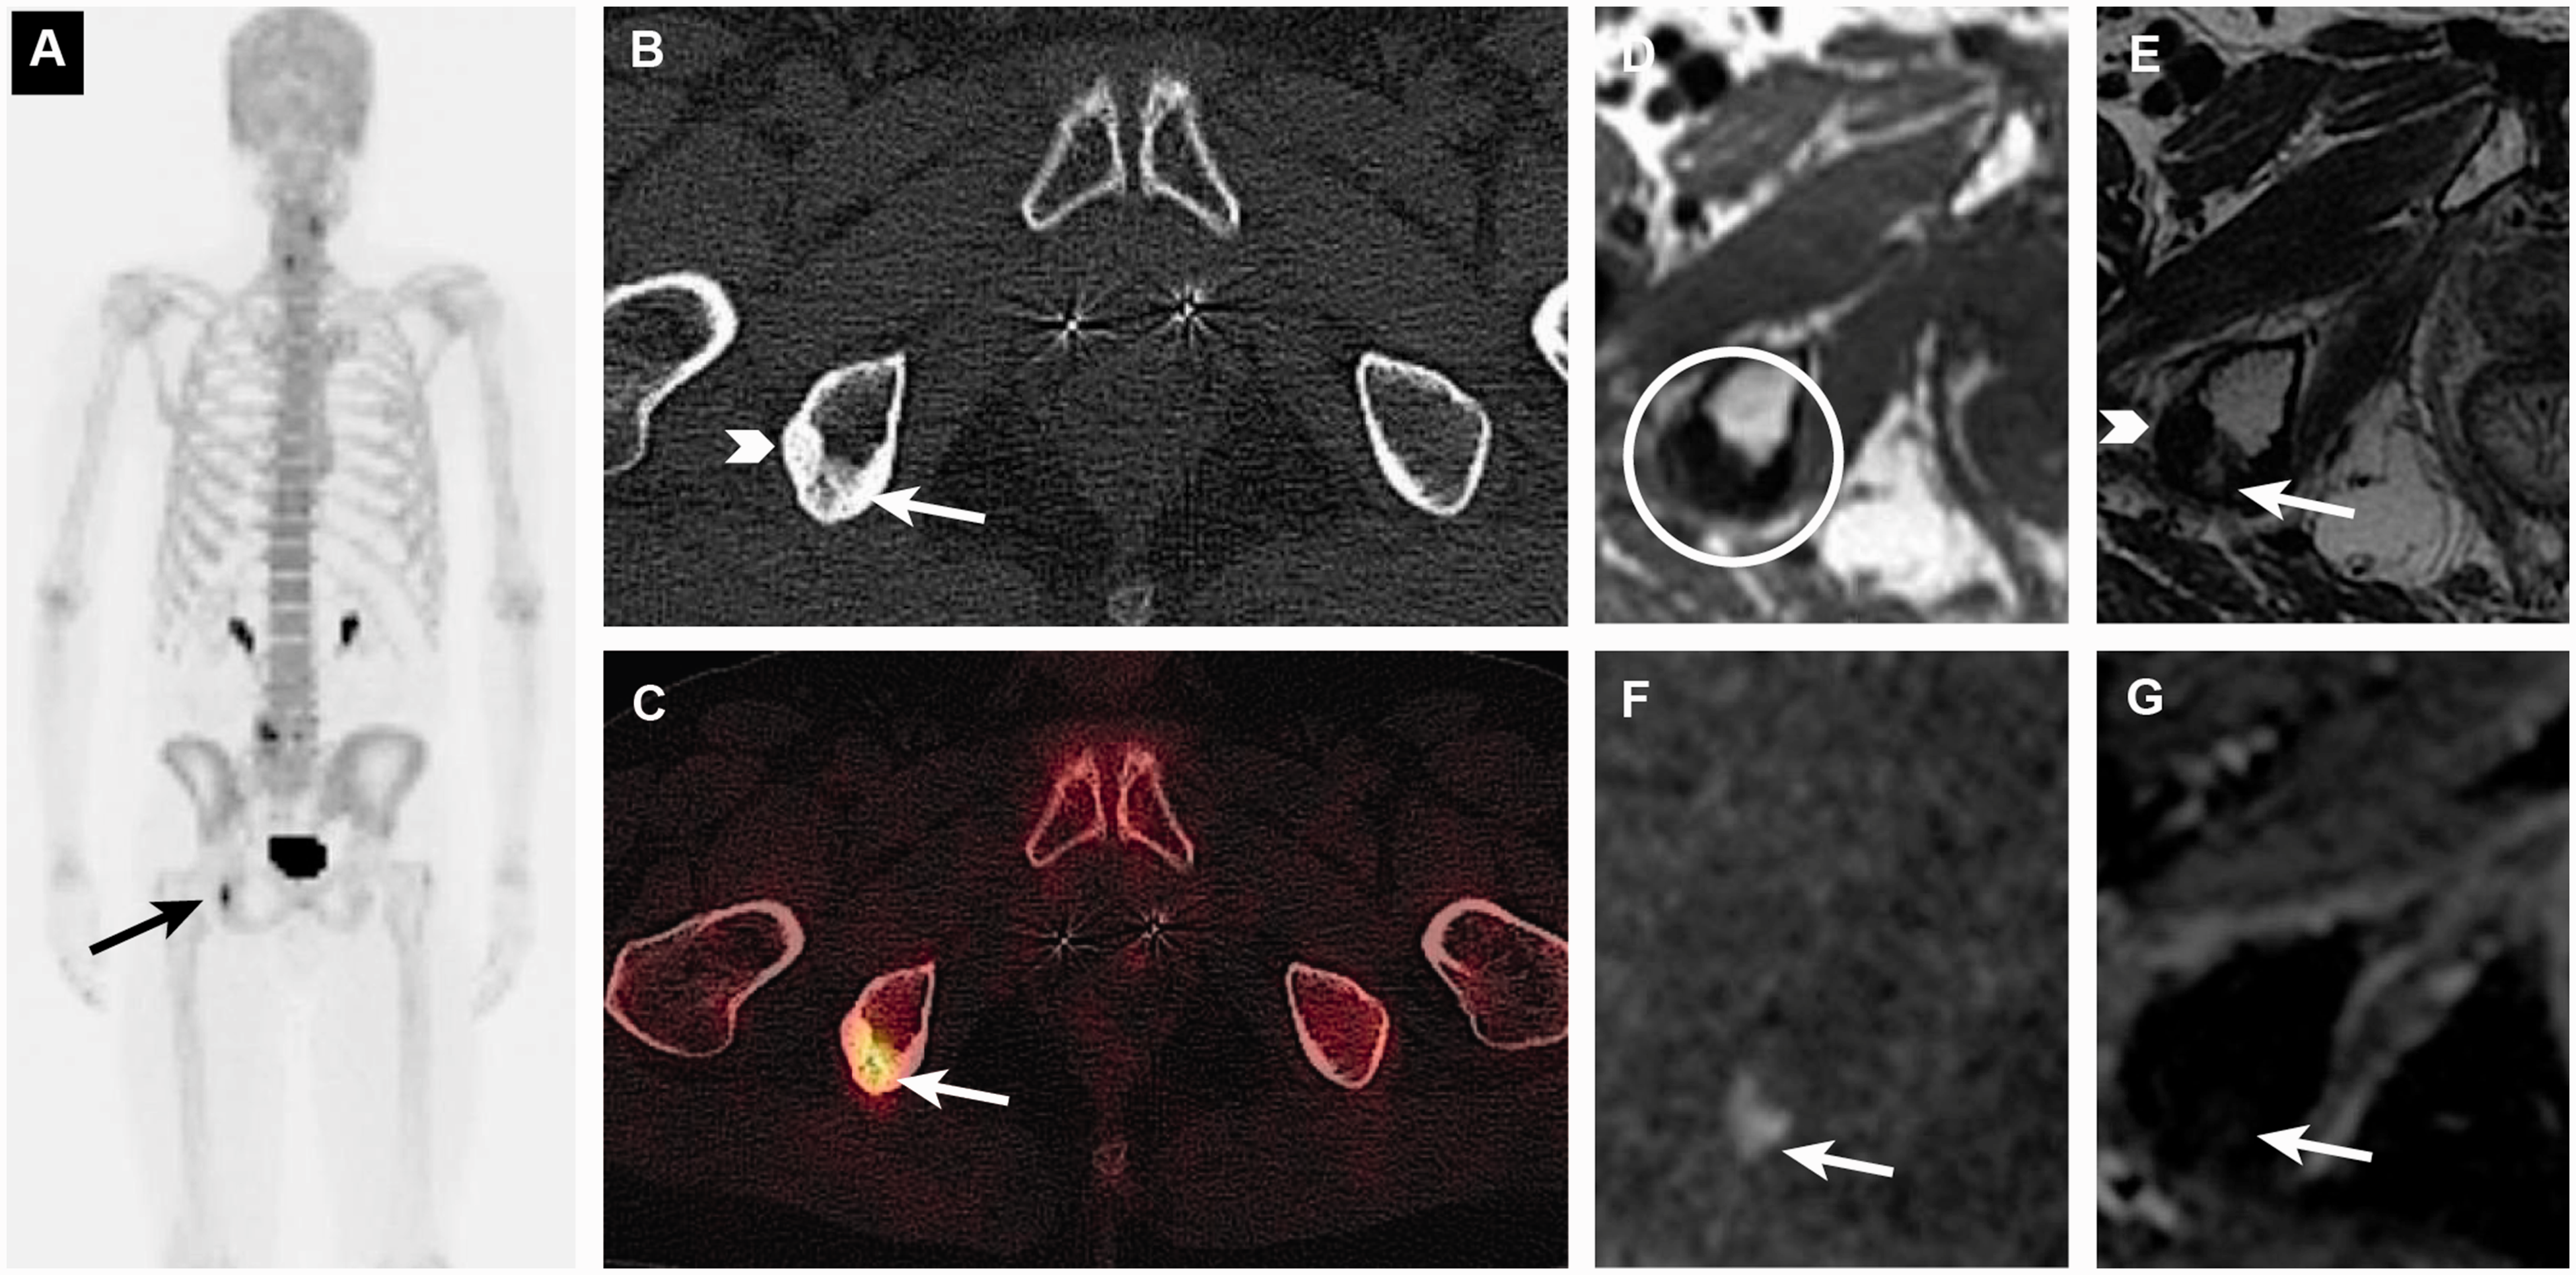
Detection of the recurrent tumor in a previously irradiated solitary metastasis from prostate cancer on sodium fluoride PET/CT (a–c) and MRI (d–g). The PET/CT scan shows two components in the treated metastasis in the right ischial bone: dense sclerosis laterally, consistent with treated, inactive tumor (b, white arrowhead), and more medially located diffuse sclerosis with tracer uptake, consistent with a recurrent tumor (a–c, arrows). The first component was stable, whereas the more medially located component with tracer uptake has appeared since previous scans (not shown). The recurrent tumor is difficult to separate from the irradiated metastasis on a T1W MRI sequence (d); however, DW-MRI clearly shows hyperintensity on high b-value images (f) and a corresponding low signal on the ADC map (g), which is consistent with an active tumor. CT: computed tomography; MRI: magnetic resonance imaging; PET: positron emission tomography; DW-MRI: diffusion-weighted magnetic resonance; ADC: apparent diffusion coefficient.
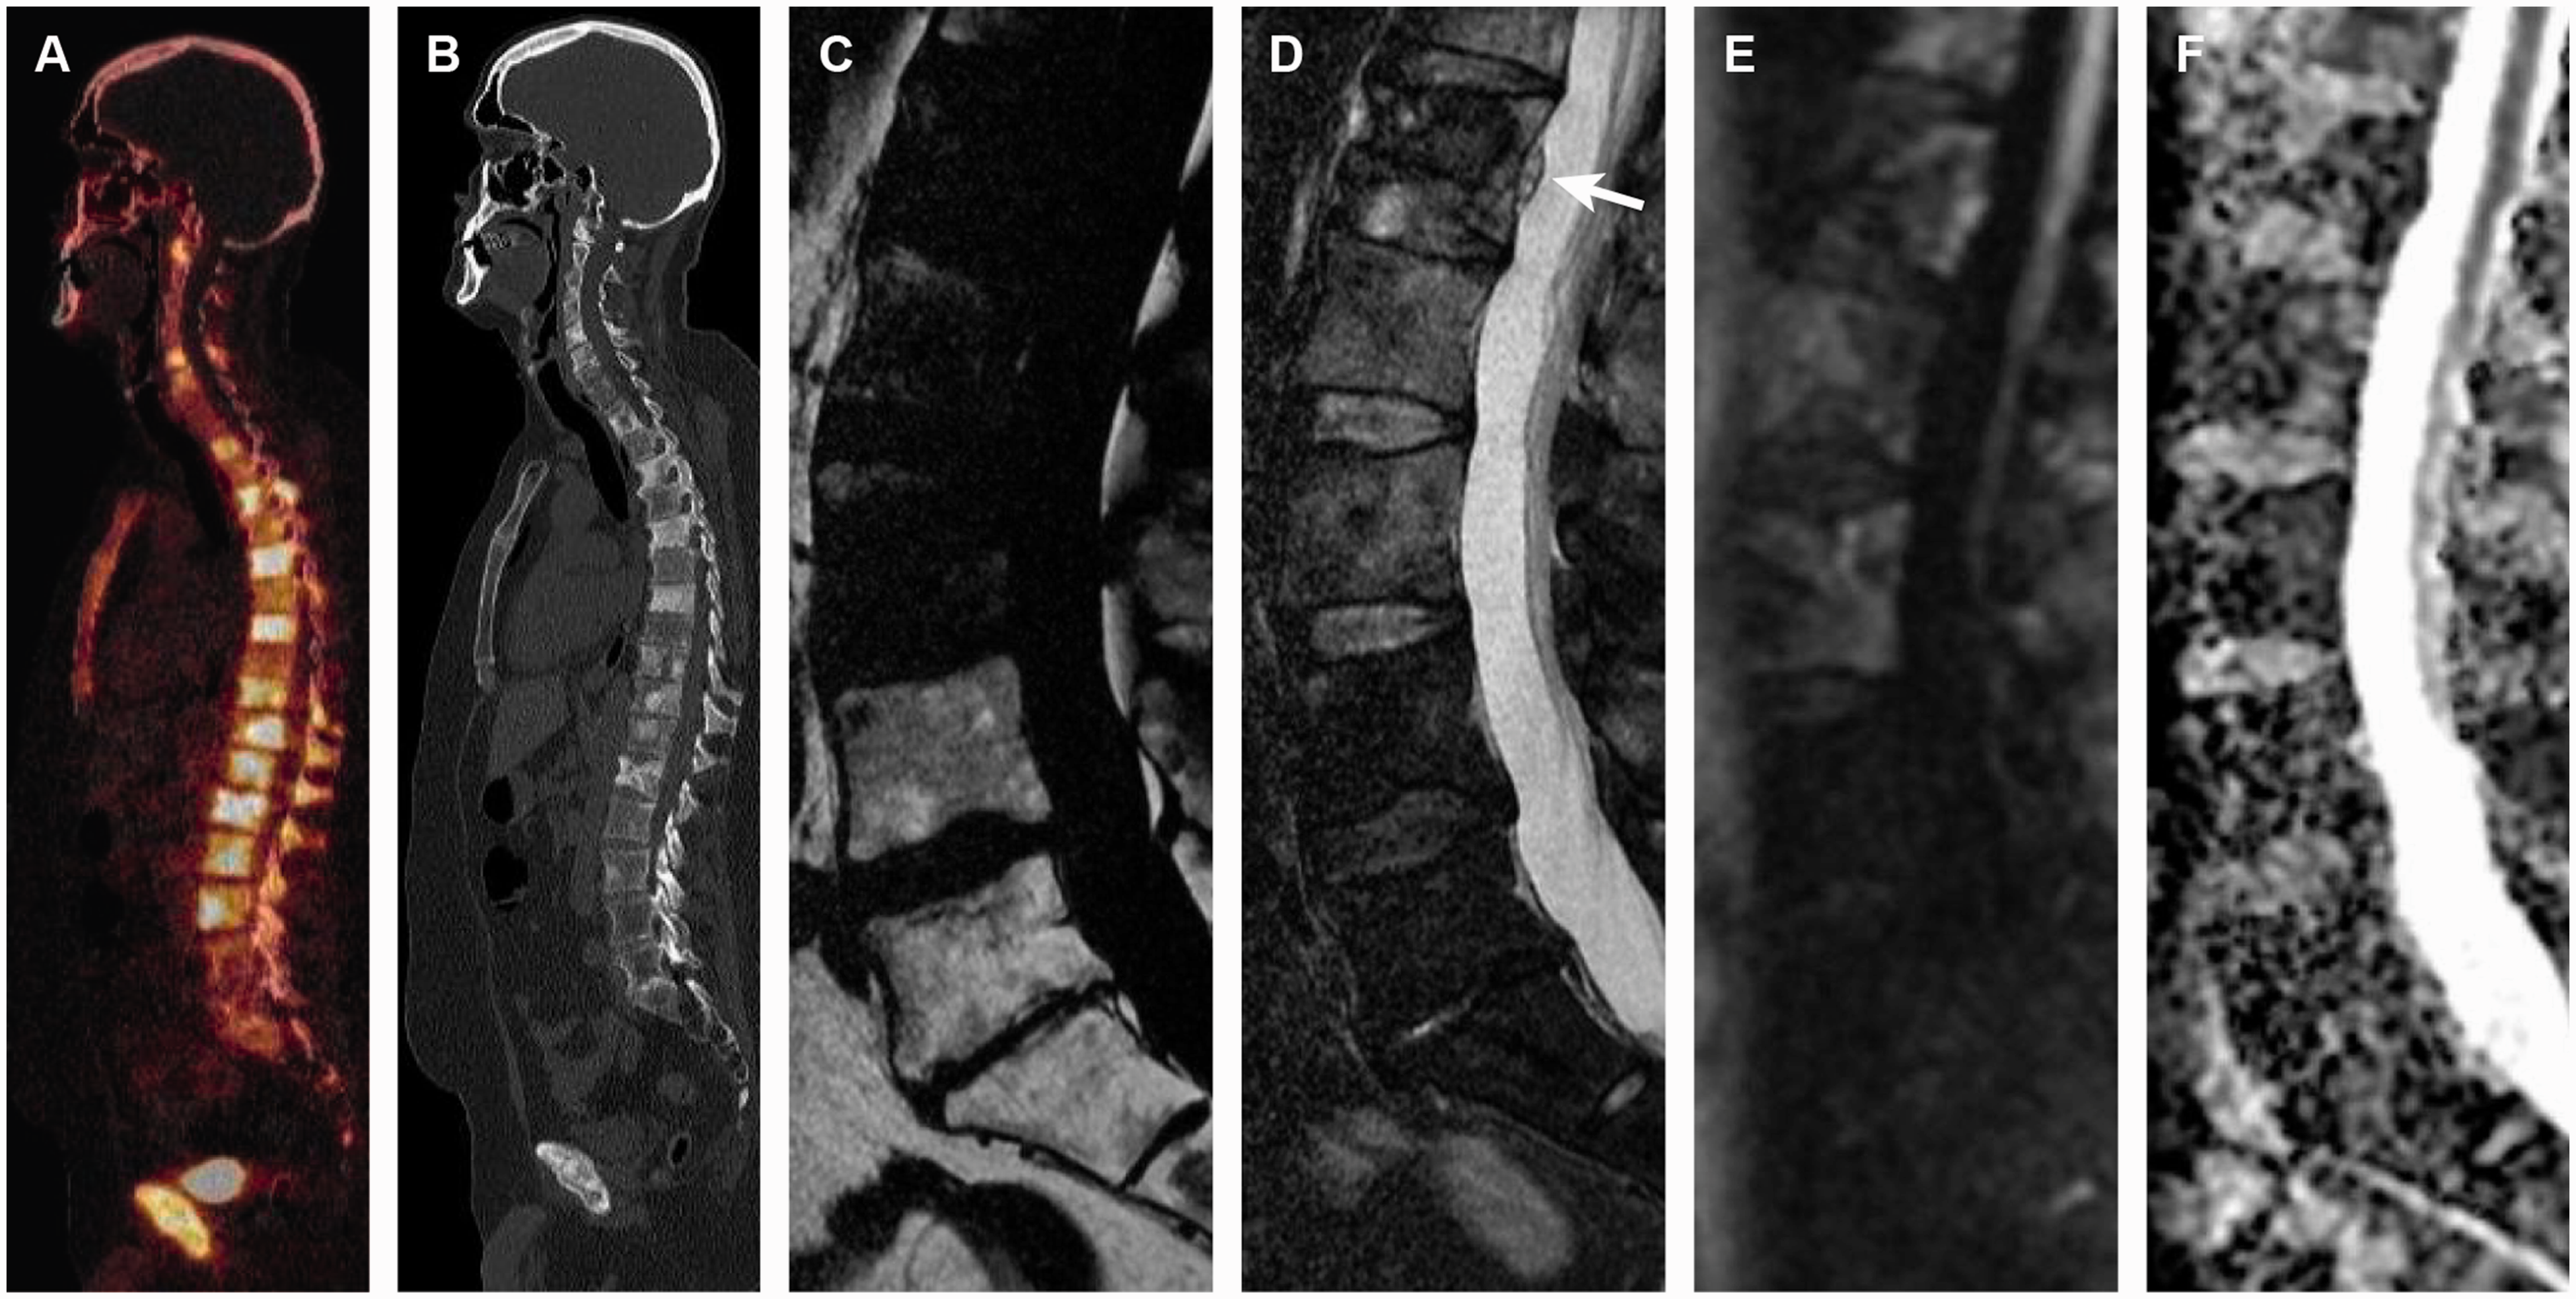
Comparison of anatomical resolution in PET/CT (a, b) and MRI (c–f) for detecting intraspinal tumor growth. Sodium fluoride PET/CT in a patient with prostate cancer shows disseminated tracer uptake in the spinal bone marrow (a), consistent with extensive metastatic disease. Metastases are predominantly osteoblastic as shown on the CT scan (b). T2W Dixon images (c, d) and DW-MRI (e, f) show disseminated tumor signal in the spinal bone marrow, similar to the PET/CT. A small, intraspinal tumor bulge is clearly shown on the water-only T2 Dixon images (d, white arrow); however, this finding is undetectable on PET/CT. Note the absence of metastatic infiltration in the lower lumbar spine and sacrum because of previous pelvic radiotherapy for prostate cancer. CT: computed tomography; MRI: magnetic resonance imaging; PET: positron emission tomography; T2W: T2-weighted; DW-MRI: diffusion-weighted magnetic resonance; ADC: apparent diffusion coefficient.
In the context of therapy monitoring, MRI provides a clearer categorization of bone metastasis response, unlike bone scintigraphy and sodium fluoride PET/CT scans that identify only disease progression (8). More accurate assessments of the response to therapy, including detecting primary and secondary resistance and, importantly, heterogeneity of response, could aid in the rationale development of targeted therapies (8). An important pitfall of nuclear medicine techniques using tracers of osseous matrix (bone scintigraphy, sodium fluoride PET/CT) is the flare phenomenon. This reaction was first described in the 1980s and is consistent with a misdiagnosis of treatment-induced sclerotic transformation of bone metastases as tumor progression (1,7). The advantage of nuclear medicine scans is whole-body coverage, although this benefit is now achievable using WB-MRI. In 2014, the European Organization for Research and Treatment of Cancer published a position paper proposing MRI as a “one size fits all” solution for monitoring therapy regardless of the tumor pattern in bone (i.e. osteoblastic/osteolytic/focal/diffuse) or metabolism (7). However, if only a minority of lesions is located in bone marrow, the most effective technique for visualizing involved organs should be prioritized (i.e. PET/CT or CT) (7).
In recent years, there has been a third major hybrid imaging modality in the form of combined PET and MRI (PET/MRI) (45). Little research has been done to evaluate the role of PET/MRI for bone marrow tumors, although the combination of complete physiologic information from PET with detailed multiparametric tumor assessment and reliable lesion localization from MRI is promising (45). This method, however, is still more expensive and has a lower clinical availability than MRI alone. For instance, PET/MRI can be used for screening and surveillance of lymphoproliferative disorders in bone, whereas information from DW-MRI can be used to monitor the treatment response of bone metastases (45,48,49).
Guidelines for assessing treatment response in bone marrow metastases
Imaging is an essential part of the clinical management of patients with bone metastases. There are no universally accepted methods for assessing tumor response for skeletal metastases (29); however, an overview of existing recommendations is presented in Table 1.
Overview of recommendations for treatment monitoring in bone metastases.
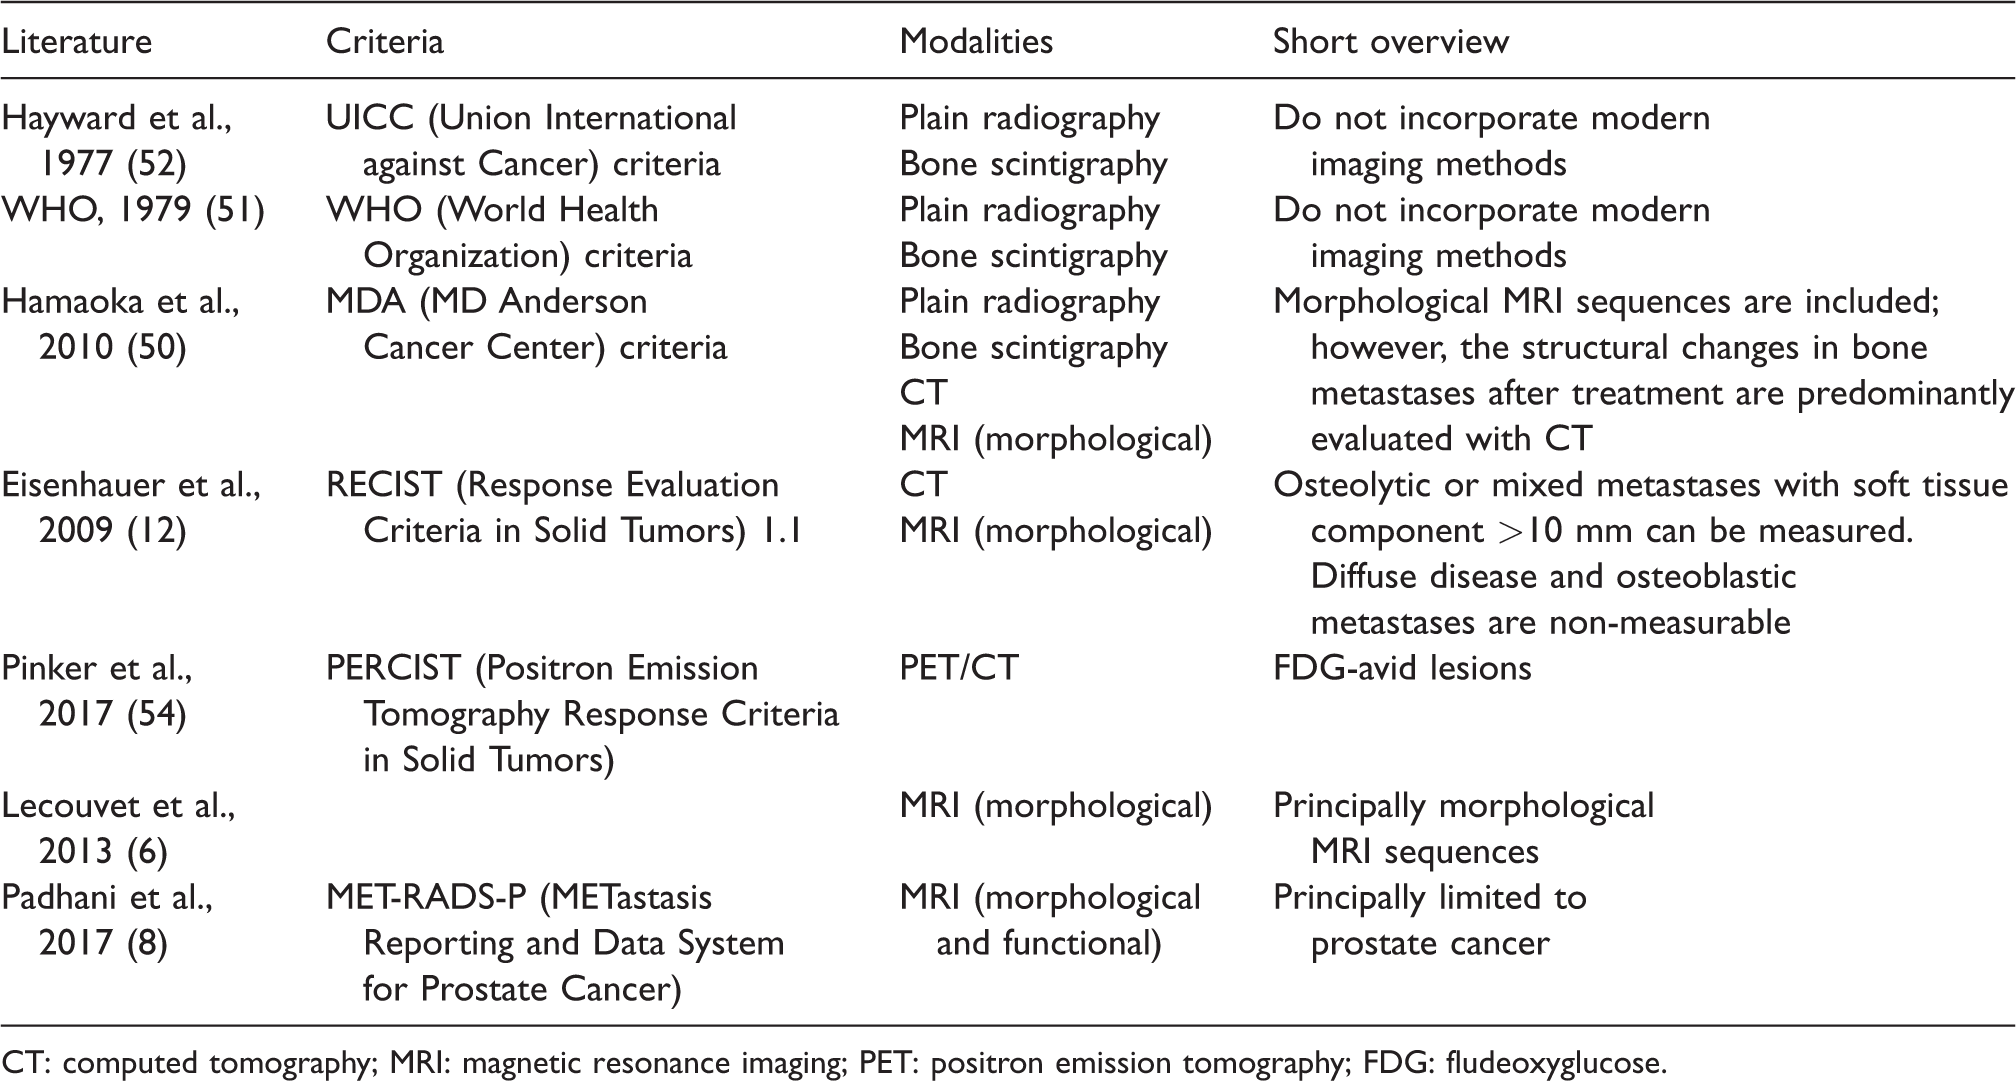
CT: computed tomography; MRI: magnetic resonance imaging; PET: positron emission tomography; FDG: fludeoxyglucose.
The two established sets of criteria for assessing bone metastases, one from the Union International against Cancer (UICC) and the other from the World Health Organization (WHO), are nearly 40 years old and based on the findings from plain radiography or skeletal scintigraphy (50–52). These criteria are inadequate as they do not incorporate modern methods in assessing the response of bone metastatic lesions to treatment (50). Proposed in 2010, the MD Anderson Cancer Center criteria (50,53) include morphological MRI sequences; however, the structural changes in bone metastases after treatment are predominantly evaluated with CT. The role of MRI is mainly confined to the evaluation of tumor signal extension; assessment of signal changes after treatment is not included in the response criteria.
The WHO criteria for assessing tumor response have been refined and simplified in the Response Evaluation Criteria in Solid Tumors (RECIST) (54,55). The RECIST 1.0 criteria were initially published in 2000 and updated in 2009 (RECIST 1.1) (12,54). Some modifications of RECIST were recently proposed, including immune-related response criteria (irRC) (56,57). It should be mentioned that cases of pseudoprogression secondary to immunotherapy have been reported, also in bone (58). These previously unknown patterns of response can additionally complicate therapy monitoring.
According to RECIST 1.1, osteolytic or mixed osteolytic/osteoblastic metastases with a soft tissue component of > 10 mm can be measured (12). However, diffuse disease and true osteoblastic bone metastases are still considered non-measurable (12,29,59). Researchers have transposed the RECIST guidelines to bone metastases and have shown that AS-MRI enables precise measurements and follow-up of skeletal lesions similar to soft-tissue metastases (60). Nevertheless, other studies support the qualitative assessment of response in bone metastases rather than size measurements, since signal changes in the treated tumor can often be observed earlier than decreases in lesion diameter (50,61,62). Unfortunately, it can be difficult to precisely identify residual active malignancy within the bone marrow based on changes in SI alone (63). When abnormalities persist after RT or chemotherapy, SI changes may reflect either residual active tumor or fibrosis (64); morphological MRI sequences often do not permit a reliable differential diagnosis. Recently, DW-MRI was shown to be useful in monitoring the response of bone metastases to therapy (28,29); this technique is now a mandatory part of oncological MRI protocols.
A suggestion for the MRI therapy response criteria was recently published by Lecouvet et al., principally for morphological MRI sequences (6,7). Disease progression was defined as an evolution from normal marrow to a focal or diffuse marrow infiltration pattern or an increase in lesion size and number (Fig. 8). Responsive metastatic disease was described as an evolution from diffuse or focal neoplastic involvement to a normal marrow appearance or a decrease in lesion size and number (6,65). Additional signs of lesion response included the appearance of a peripheral halo of fatty marrow (fatty halo sign) around the treated tumor, disappearance of a cellular halo (edema-like halo), and shrinkage of the extraosseous soft-tissue component in bone marrow metastases (6) (Figs. 9 and 10). These useful signs of metastatic response can be observed regardless of the measurable changes in the size of bony lesions.
Tumor progression in metastatic breast cancer. Multiple spinal metastases on the pretreatment T2W Dixon images (a, b) and DW-MRI (c, d) are shown in the upper row. Follow-up T2 Dixon images (e, f) show a clear increase in size and number of metastases. The lesions are hyperintense on b800 DW-MRI (g) with a corresponding low ADC (h) (0.8 × 10⁻³ mm2/s), compatible with an active tumor. T2W: T2-weighted; DW-MRI: diffusion-weighted magnetic resonance imaging; ADC: apparent diffusion coefficient.
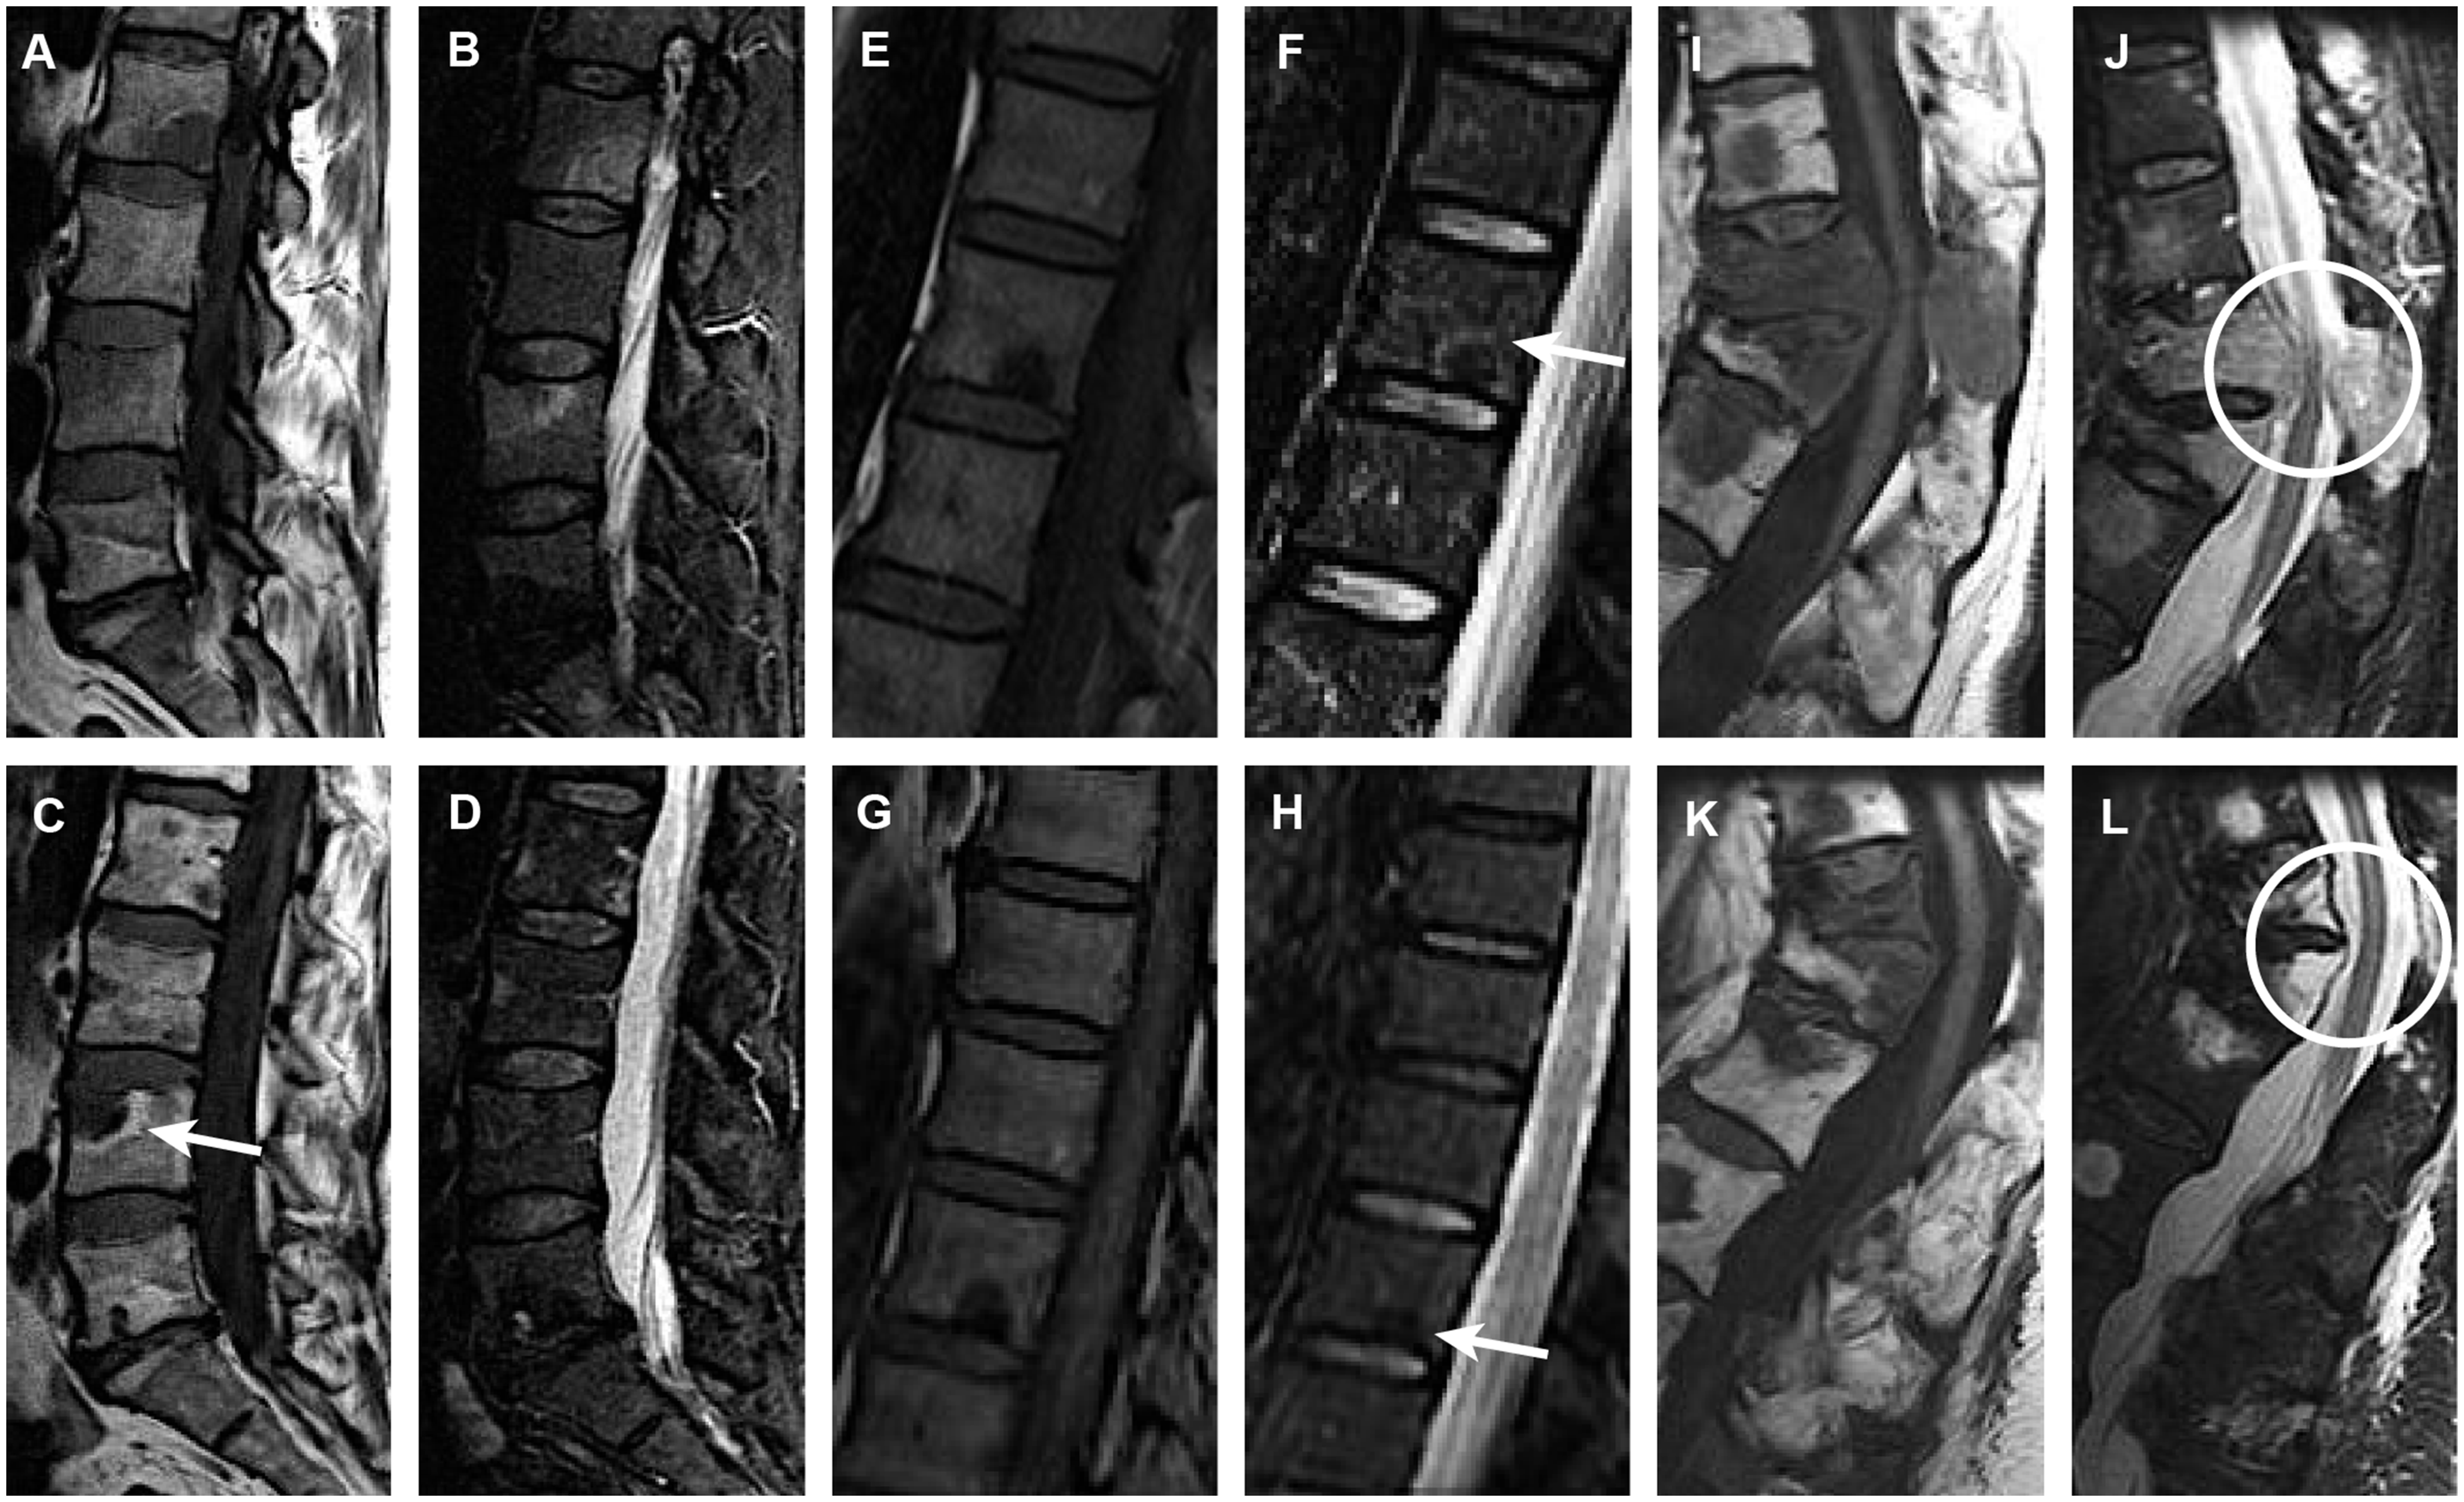
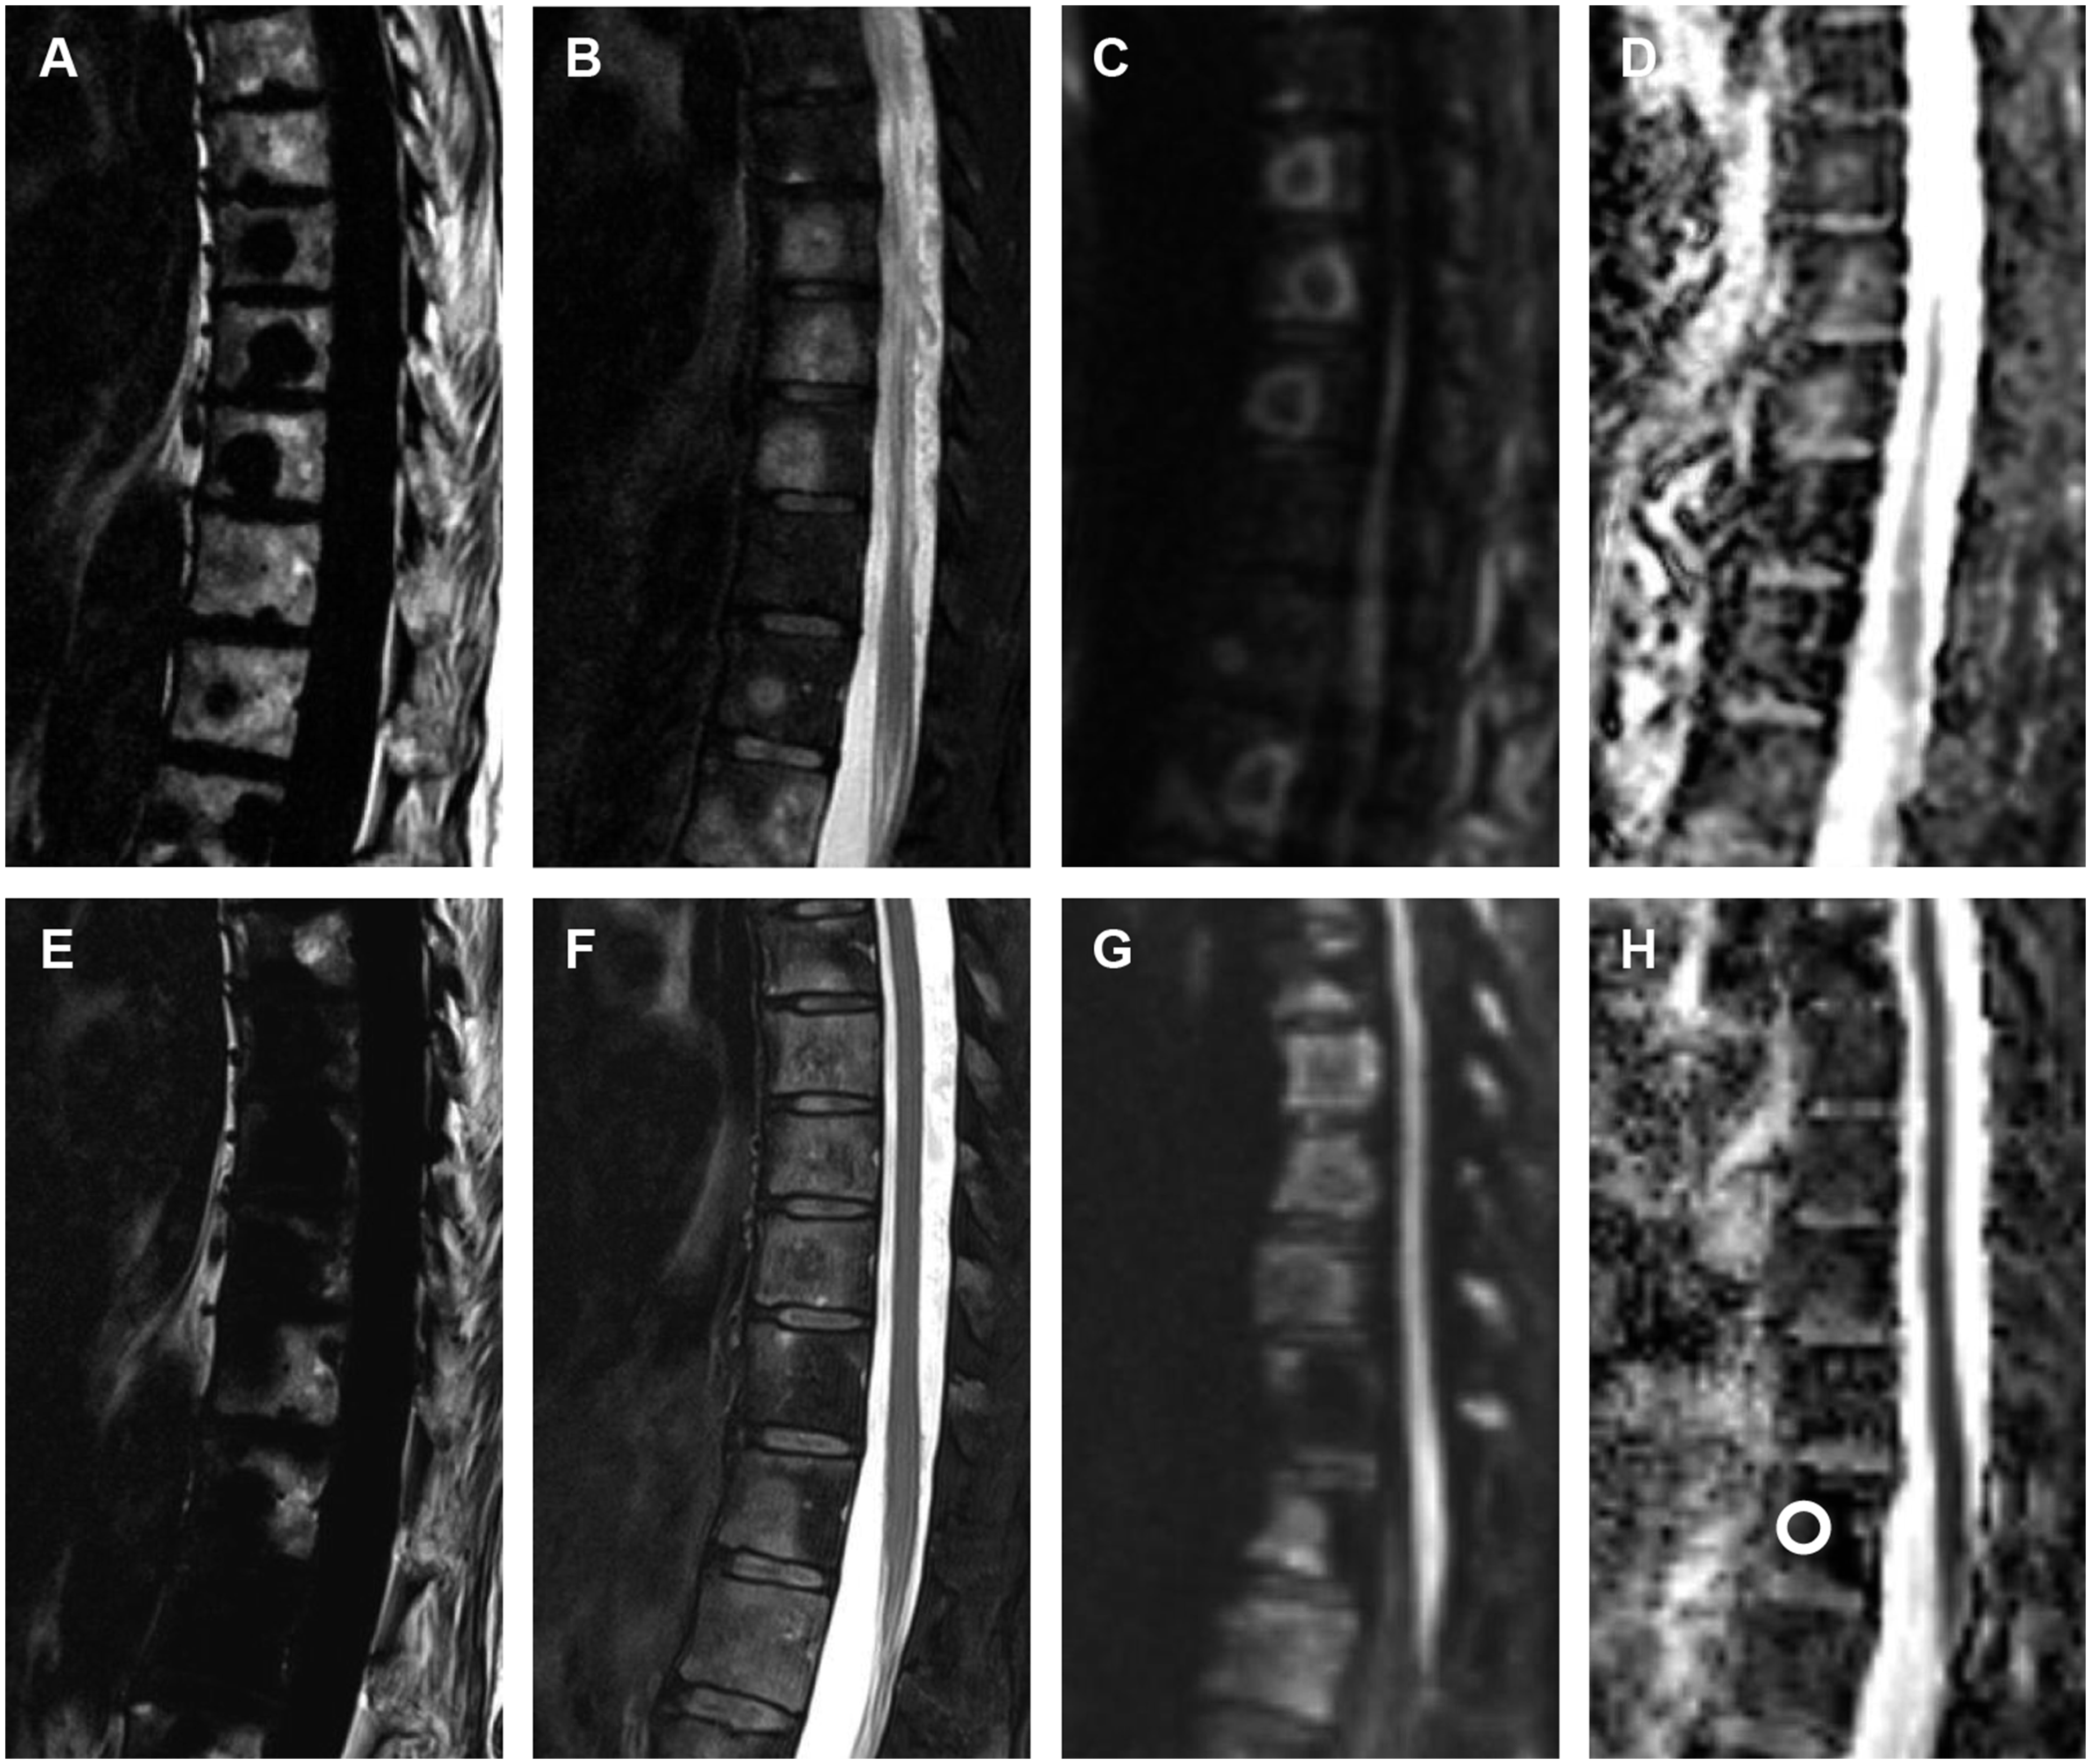
Signs of lesion response on morphological T1W and STIR sequences: fatty halo sign (a–d); cellular halo sign (e–h); and resolution of an extraosseous, soft-tissue component (i–l, white circle). Post-treatment MR images (c, d) show subtle perilesional fat (c, white arrow) appearing since pretreatment images (a, b), consistent with a tumor response. Pretreatment MR images (e, f) show a subtle cellular (edema-like) halo sign (f, white arrow), resolving after treatment (g, h, white arrow), which is also consistent with treatment response. Similar signal changes should be expected on Dixon images. Note only small variations in the lesion sizes (e–h). Images (i–l) are published with permission from Journal of Bone Oncology (61). STIR: short tau inversion recovery; MR: magnetic resonance.
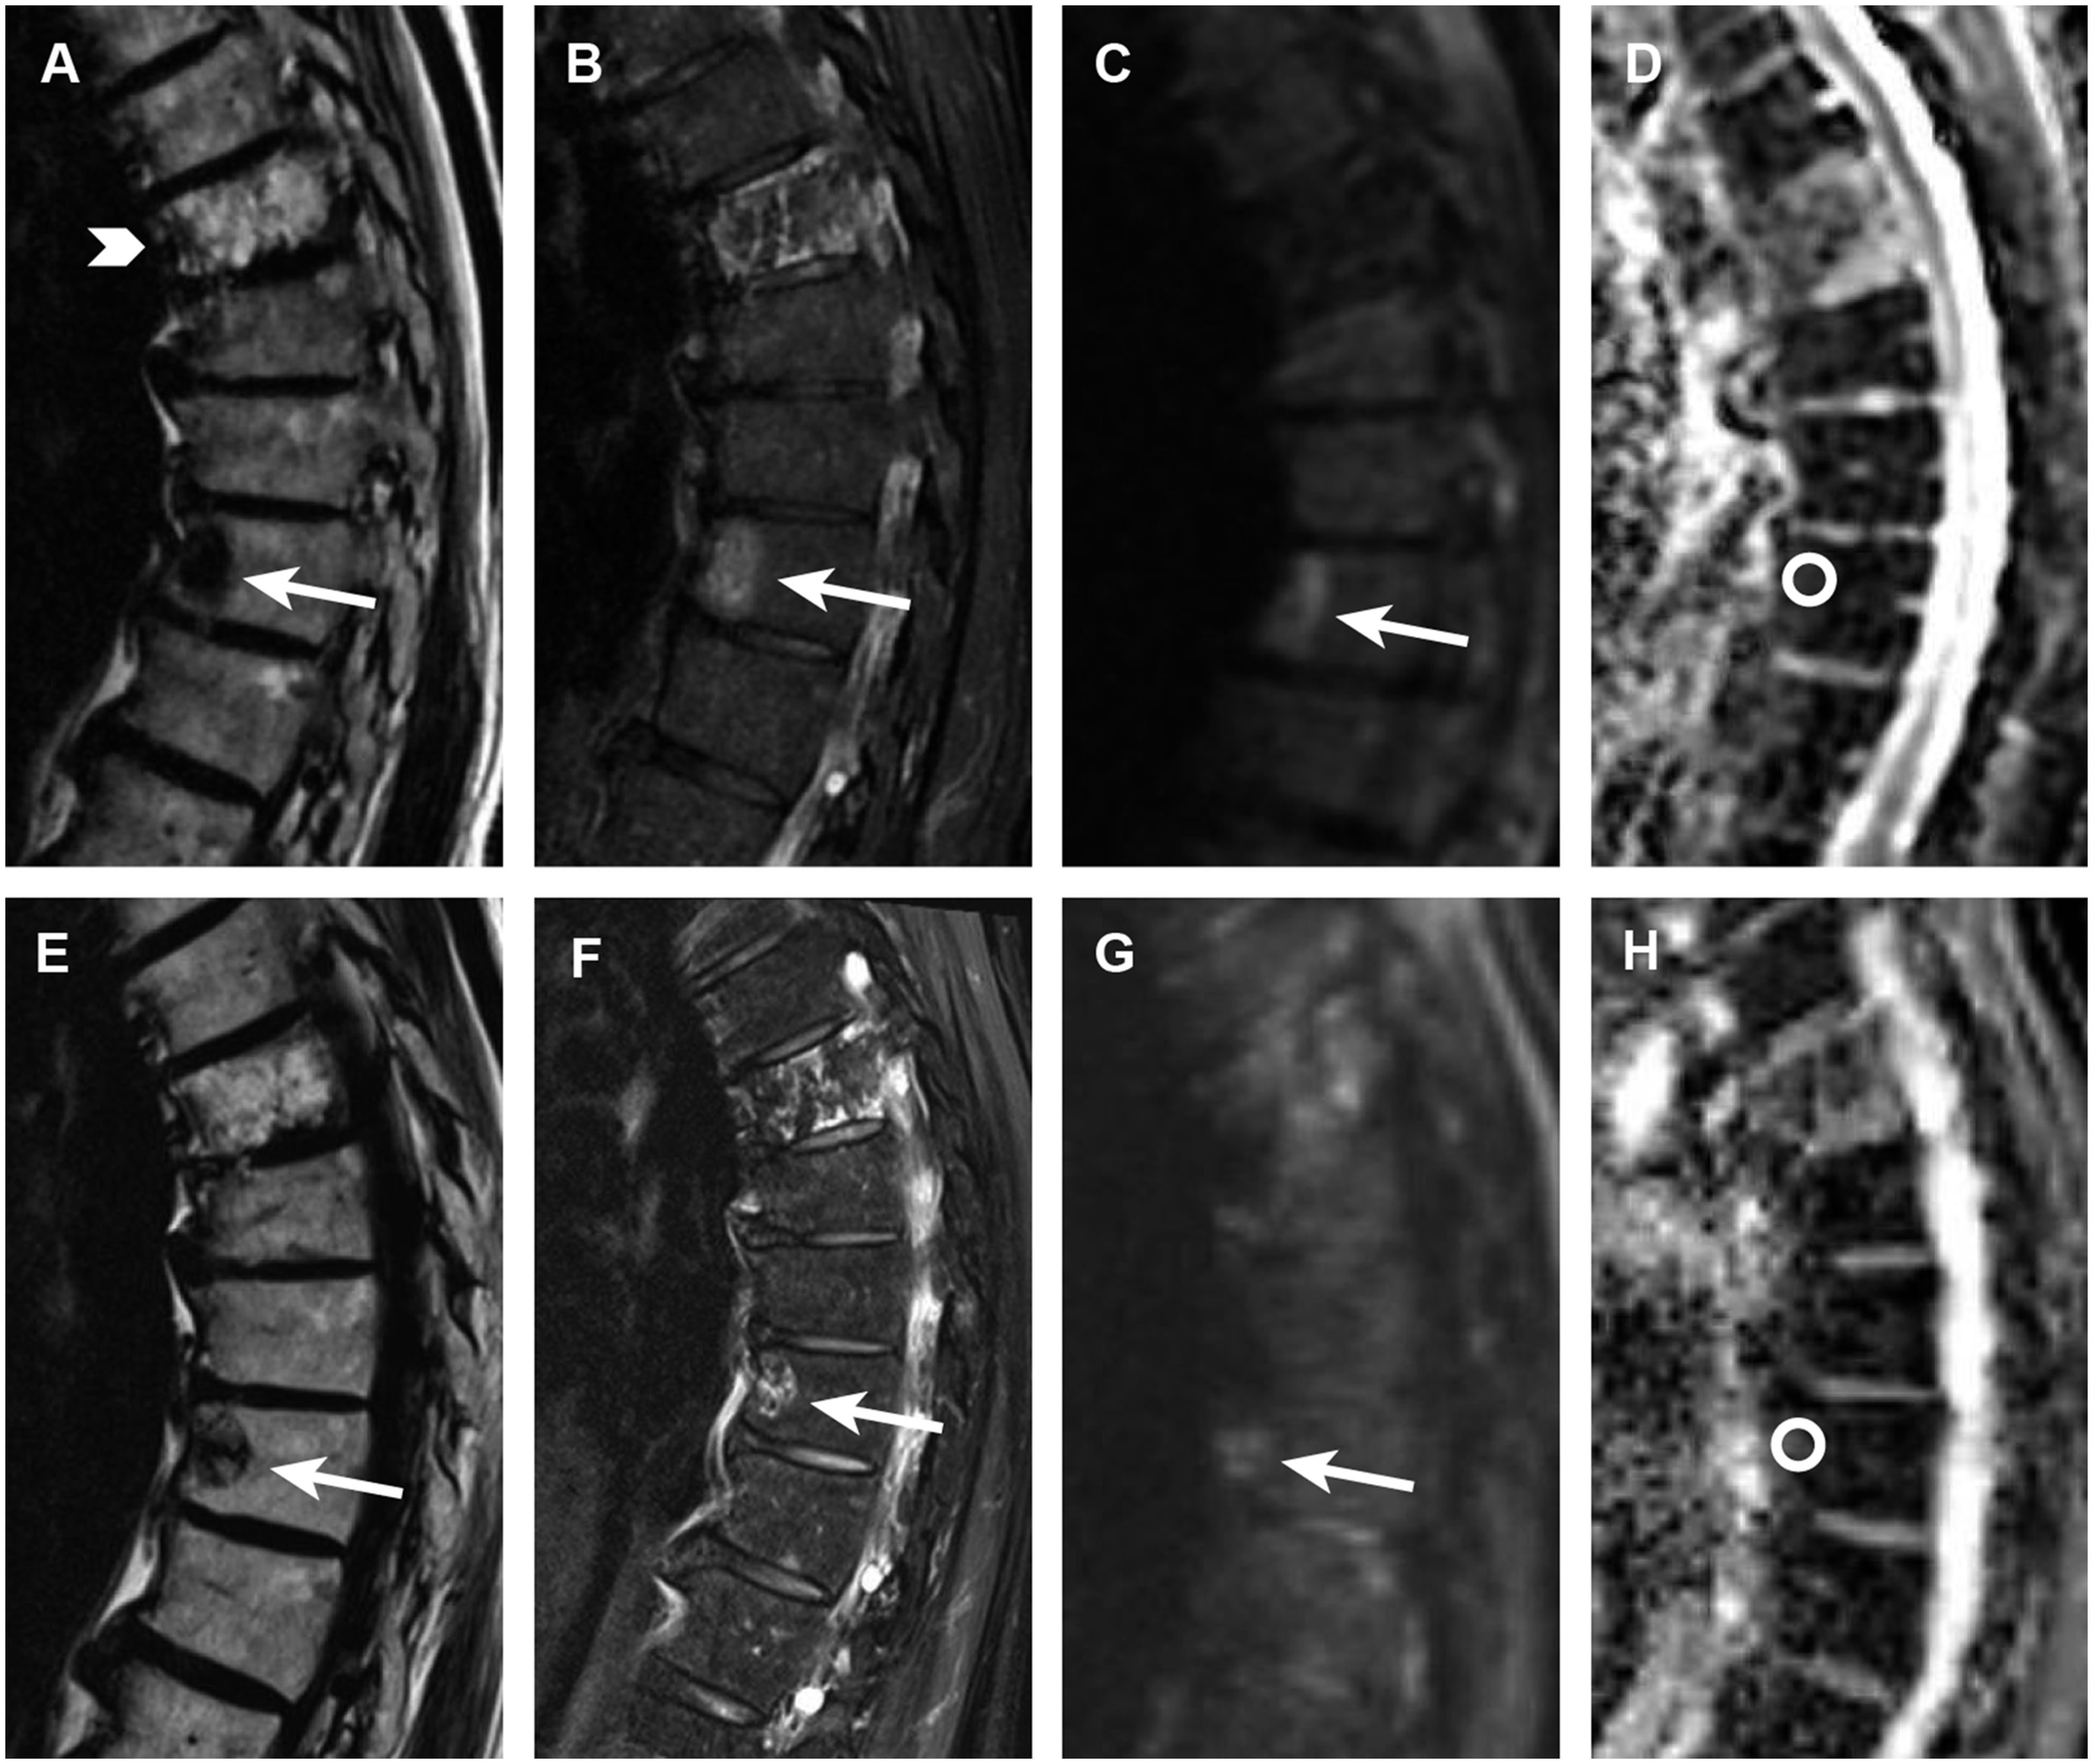
Tumor response in metastatic breast cancer. T2W Dixon images (a, b) demonstrate progression under endocrine therapy with a new, focal metastasis in the thoracic spine (white arrow). The lesion is hyperintense on b800 DW-MRI (c, white arrow) and has a low ADC (d) (0.62 × 10⁻³ mm2/s), consistent with a cell-dense, active tumor. Note the focally increased fat signal in bone marrow (a, white arrowhead), compatible with changes after a previously treated, inactive metastasis. The MR images after the treatment change are presented in the lower row (e–h). The fat-only images (e) show intra- and perilesional fat, consistent with the treatment response. The lesion now has a more heterogenous signal on the water-only images (f, white arrow), most likely because of the small areas with intralesional fat and necrosis. The ADC is higher than before the treatment (h) (1.2 × 10⁻³ mm2/s), confirming the response. T2W: T2-weighted; DW-MRI: diffusion-weighted magnetic resonance imaging; ADC: apparent diffusion coefficient; MR: magnetic resonance.
Recently Padhani et al. proposed the METastasis Reporting and Data System for Prostate Cancer (MET-RADS-P), which consists of imaging recommendations to promote standardization and diminish variations in the acquisition, interpretation, and reporting of WB-MRI in prostate cancer (8). The MET-RADS-P incorporates both morphological and functional sequences (DW-MRI) and allows response evaluation in various patterns of metastatic spreading (visceral, local) in addition to bone (Figs. 11 and 12). The proposed criteria are provisionally limited to prostate cancer; however, these will further be adapted for use in advanced metastatic breast cancer (MET-RADS-B) and multiple myeloma (MET-RADS-MM) (66).

Combined organ-specific MRI (a–f) and WB-MRI (g–k) for metastatic screening in locally recurrent prostate cancer. The organ-specific MRI shows an extensive recurrent tumor in a previously irradiated prostate (a–f). The tumor is difficult to identify on morphological, T2W sequences (a, b); however, DW-MRI shows an extensive, pathological signal (c, d, white arrows) in nearly the whole prostate, compatible with tumor recurrence. DCE-MRI perfusion source images (e, white arrow) and a time-dependent leakage (Ktrans) perfusion map (f, white arrow) confirm the findings, showing a rapid, initial increase in permeability in the tumor. WB-MRI did not show metastases (g–k). The WB-MRI sequences include the T2W Dixon images (fat-only images, g; water-only images, h), T1W Dixon images after intravenous contrast (water-only images, i), and whole-body DW-MRI (j, k). MRI: magnetic resonance imaging; WB-MRI: whole-body magnetic resonance imaging; T2W: T2-weighted; DW-MRI: diffusion-weighted magnetic resonance imaging; DCE-MRI: dynamic contrast-enhanced magnetic resonance imagery.

Combined organ-specific MRI (a–g) and WB-MRI (h–l) for tumor evaluation and metastatic screening in a newly diagnosed, high-grade prostate cancer (Gleason score 5 + 5). The organ-specific MRI (a–g) shows a large mass predominantly in the base of the prostate with extensive extraprostatic growth and massive vesicle invasion (a, b, white arrows). The lesion is hyperintense on DW-MRI (d, white arrows) with a corresponding low ADC (e, white arrows) (0.55 × 10⁻³ mm2/s), consistent with a high-grade, aggressive cancer. DCE-MRI perfusion source images (f, white arrows) and a time-dependent leakage (Ktrans) perfusion map (g, white arrows) show a rapid, initial contrast enhancement in the tumor. The patient had lymph node metastases (c, white arrow). No other metastases were detected on the WB-MRI (h–l). The WB-MRI sequences include T2W (fat-only images, h; water-only images, i) and T1W Dixon (water-only images, j) images after intravenous contrast and whole-body DW-MRI (k, l). Note the large polypoid mass in the sigmoid colon detected as an incidental finding (b, c, white arrowheads).
The overall response of bone disease is assessed using a scale of 1–6 as follows: 1 = highly likely to be responding; 2 = likely to be responding; 3 = stable; 4 = likely to be progressing; 5 = highly likely to be progressing; and 6 = discordant (8). The recommended ADC cutoff values between normal marrow and tumor, and description of tumor response and progression are set out in detail in the MET-RADS-P standard document (8,66). Generally, ADC values of normal bone marrow lie < 0.6–0.7 × 10⁻³ mm2/s and those of viable tumor lies usually in the range of 0.7–1.4 × 10⁻³ mm2/s (8). Tumors ADC values >1.4 × 10⁻³ mm2/s can be observed in treated, often necrotic metastasis (8). However, the proposed cutoff values are not absolute and can be influenced by a variety of technical issues (choice of b-values, interscanner variation, etc.) (8). In addition, pretreatment tumor characteristics can differ from the cutoff ADC values of viable tumor with low values observed in primary dense sclerotic metastasis and high values in primary necrotic metastasis. Consequently, recognizing or calculating the difference in ADC between primary (baseline) and treated tumor is probably superior for assessing treatment response than that of measuring specific values.
Unlike bony disease assessments, the overall response for the primary tumor and nodal and visceral disease should follow established guidelines (Prostate Cancer Working Group modifications of RECIST 1.1) (8,67). Thus, the following categories for soft-tissue tumor manifestations should be assigned: complete response; partial response; stable disease; progressive disease; and discordant (8,67).
Conclusion
MRI is an important modality for monitoring the treatment of bone marrow metastases. Recently, new contrast mechanisms for bone marrow evaluation have been introduced. Particularly, DW-MRI and Dixon imaging have emerged in recent years, allowing for more precise evaluation of the treatment response in bone marrow along with a shorter scan time. WB-MRI is another promising approach in oncological imaging that combines the specificity and sensitivity of MRI with multi-organ evaluation of treatment results in cancer. There is a need to establish criteria for monitoring of treatment response in bone. The most recent recommendations incorporate the modern morphological and functional MRI sequences; however, they still need to be corroborated in future studies to assess their impact on clinical decisions (68).
Footnotes
Declaration of conflicting interests
The author(s) declared no potential conflicts of interest with respect to the research, authorship, and/or publication of this article.
Funding
The author(s) received no financial support for the research, authorship, and/or publication of this article.