
Abstract
Background
Appropriate mammary positioning is an important factor in optimizing image quality in mammography (MMG).
Purpose
To study the correlation of quality criteria and breast density classification proposed by the American College of Radiology (ACR) and European Guidelines and its influence to achieve a proper positioning, therefore an adequate MMG.
Material and methods
A total of 128 routine MMG examinations were reviewed for the definition of breast composition parenchyma and assessment of several quality criteria proposed by the ACR and European Guidelines to achieve an adequate MMG. Adequate MMG was defined as a difference between the posterior nipple line (PNL), difference of the mediolateral oblique (MLO) and craniocaudal (CC) incidences > 1 cm. The quality criteria were analyzed as a function of correlation coefficient in order to evaluate the individual impact of each factor and analysis of variance (ANOVA) for all criteria. Receiver operating characteristic (ROC) curves were plotted to evaluate the performance of the criteria on each type of parenchyma.
Results
Negative correlation of fatty breasts and visibility of the mammary angle, a greater number of skin folds and PNL > 1 cm (r < 0). Dense MMG presented less visibility of the lateral tissue compared with other categories. Area under the curve of ROC analysis revealed values of 53.1% and 54.7% for the right and left breasts, respectively.
Conclusion
Several factors influenced in the MMG process, but we find that breast parenchyma has a substantial role in affecting these criteria and therefore a correct position for diagnosis, which could compromise MMG diagnostic performance.
Introduction
Image quality in mammography (MMG) depends on appropriate positioning and adequate compression of the breast, as well as suitable irradiation parameters used for image acquisition in the examination (1,2). Therefore, to achieve a high-quality diagnostic MMG, several factors need to be considered (3–7), not the least of which is the expertise of the technician in optimally positioning the breasts (8–11).
Positioning has previously been cited as the single most important factor in optimizing MMG quality (5–7). Factors such as bulky defects, parenchyma, mal-positioning, and misalignment of the structures are reported as risk factors for missing suspicious lesions (8–12). Studies like one published by Taplin et al. (13) reported that failures in positioning were associated with interval cancers.
In recent years, several quality indicators have been proposed by the American College of Radiology (ACR) and the European Guidelines on Quality Criteria for Diagnostic Radiographic Images describing factors reflecting the quality of MMG, most of which are subjective in nature (1,2,10,11).
Unfortunately, despite the several criteria proposed, the acquisition of quality MMG has always been a challenge for radiologists and technicians, mostly due to the lack of a proper definition of quality parameters and/or quantitative indicators that can reduce the variation among the professionals responsible for the acquisition of images (3,4).
To overcome these obstacles, one of the quantitative criteria proposed is the posterior nipple line (PNL), characterized by a line drawn perpendicular to the pectoralis muscle in the oblique-medial (MLO) incidence and in the half of the breast in the craniocaudal incidence (CC), both passing through the nipple.
The adequate PNL corresponds to a quantitative indicator of proper acquisition of MMG incidence assessment. A difference between the PNLs of each incidence > 1 cm indicates that the study is inadequate for analysis (6,9). Several studies indicated the positive correlation between PNL and adequate analysis conditions, even by general radiologists (13–21).
Despite the success and adequate reproducibility of PNL, there are few studies that correlate the quality criteria proposed by the European Guidelines on Quality Criteria for Diagnostic Radiographic Images with an acceptable PNL (2). This scenario generated a critical lack of research on breast imaging studies mainly because there are not yet studies that analyze the performance of these criteria with the MMG, culminating in an appropriate examination.
Another factor that appropriate research is unsatisfactory is the composition of the mammary parenchyma and its influence on adequate positioning. Although well-known to experts, to the best of our knowledge, there is no specific study that correlates breast density with BI-RADS (22) and its correlation with PNL and their impact in achieving a proper exam (12).
Therefore, the purpose of the present study was to analyze the achievement of acceptable MMG, characterized in a quantitative form by PNL < 1 cm, and to verify the quality indicators and types of breast parenchyma that influence the completion of an appropriate MMG study.
Material and Methods
This retrospective, observational study reviewed data from 128 paired MMG from women who underwent routine imaging, selected from a database between June and December 2016. The collected information was considered to be confidential, was used anonymously, and was accessible only to the authors of the research.
This study received institutional ethics committee approval (CAE 67133317.7.0000.0097). Given the retrospective nature of the study and the use of anonymized patient data, requirements for informed consent were waived. All digital images were analyzed without consulting medical charts or accessing patient identification.
MMG was performed using a direct full-field digital MMG system (Selenia Dimensions System 6000 Package, Lorad-Hologic, Bedford, MA, USA).
A total of 128 paired MMGs performed on women undergoing routine MMG were included and analyzed in the present study. The mean ± SD age of the patients was 51.27 ± 4.2 years (age range = 28–85 years).
Measurement of PNL
PNL in the MLO images were obtained by drawing a line perpendicular to the pectoral muscle and passing through the nipple and, for CC images, was obtained in the middle of the incidence also passing through the nipple. PNL measurement difference between the CC and the MLO views ≤ 1 cm corresponds to an adequate positioning (2,13–16). The method of assessment in each MMG view is illustrated in Fig. 1.
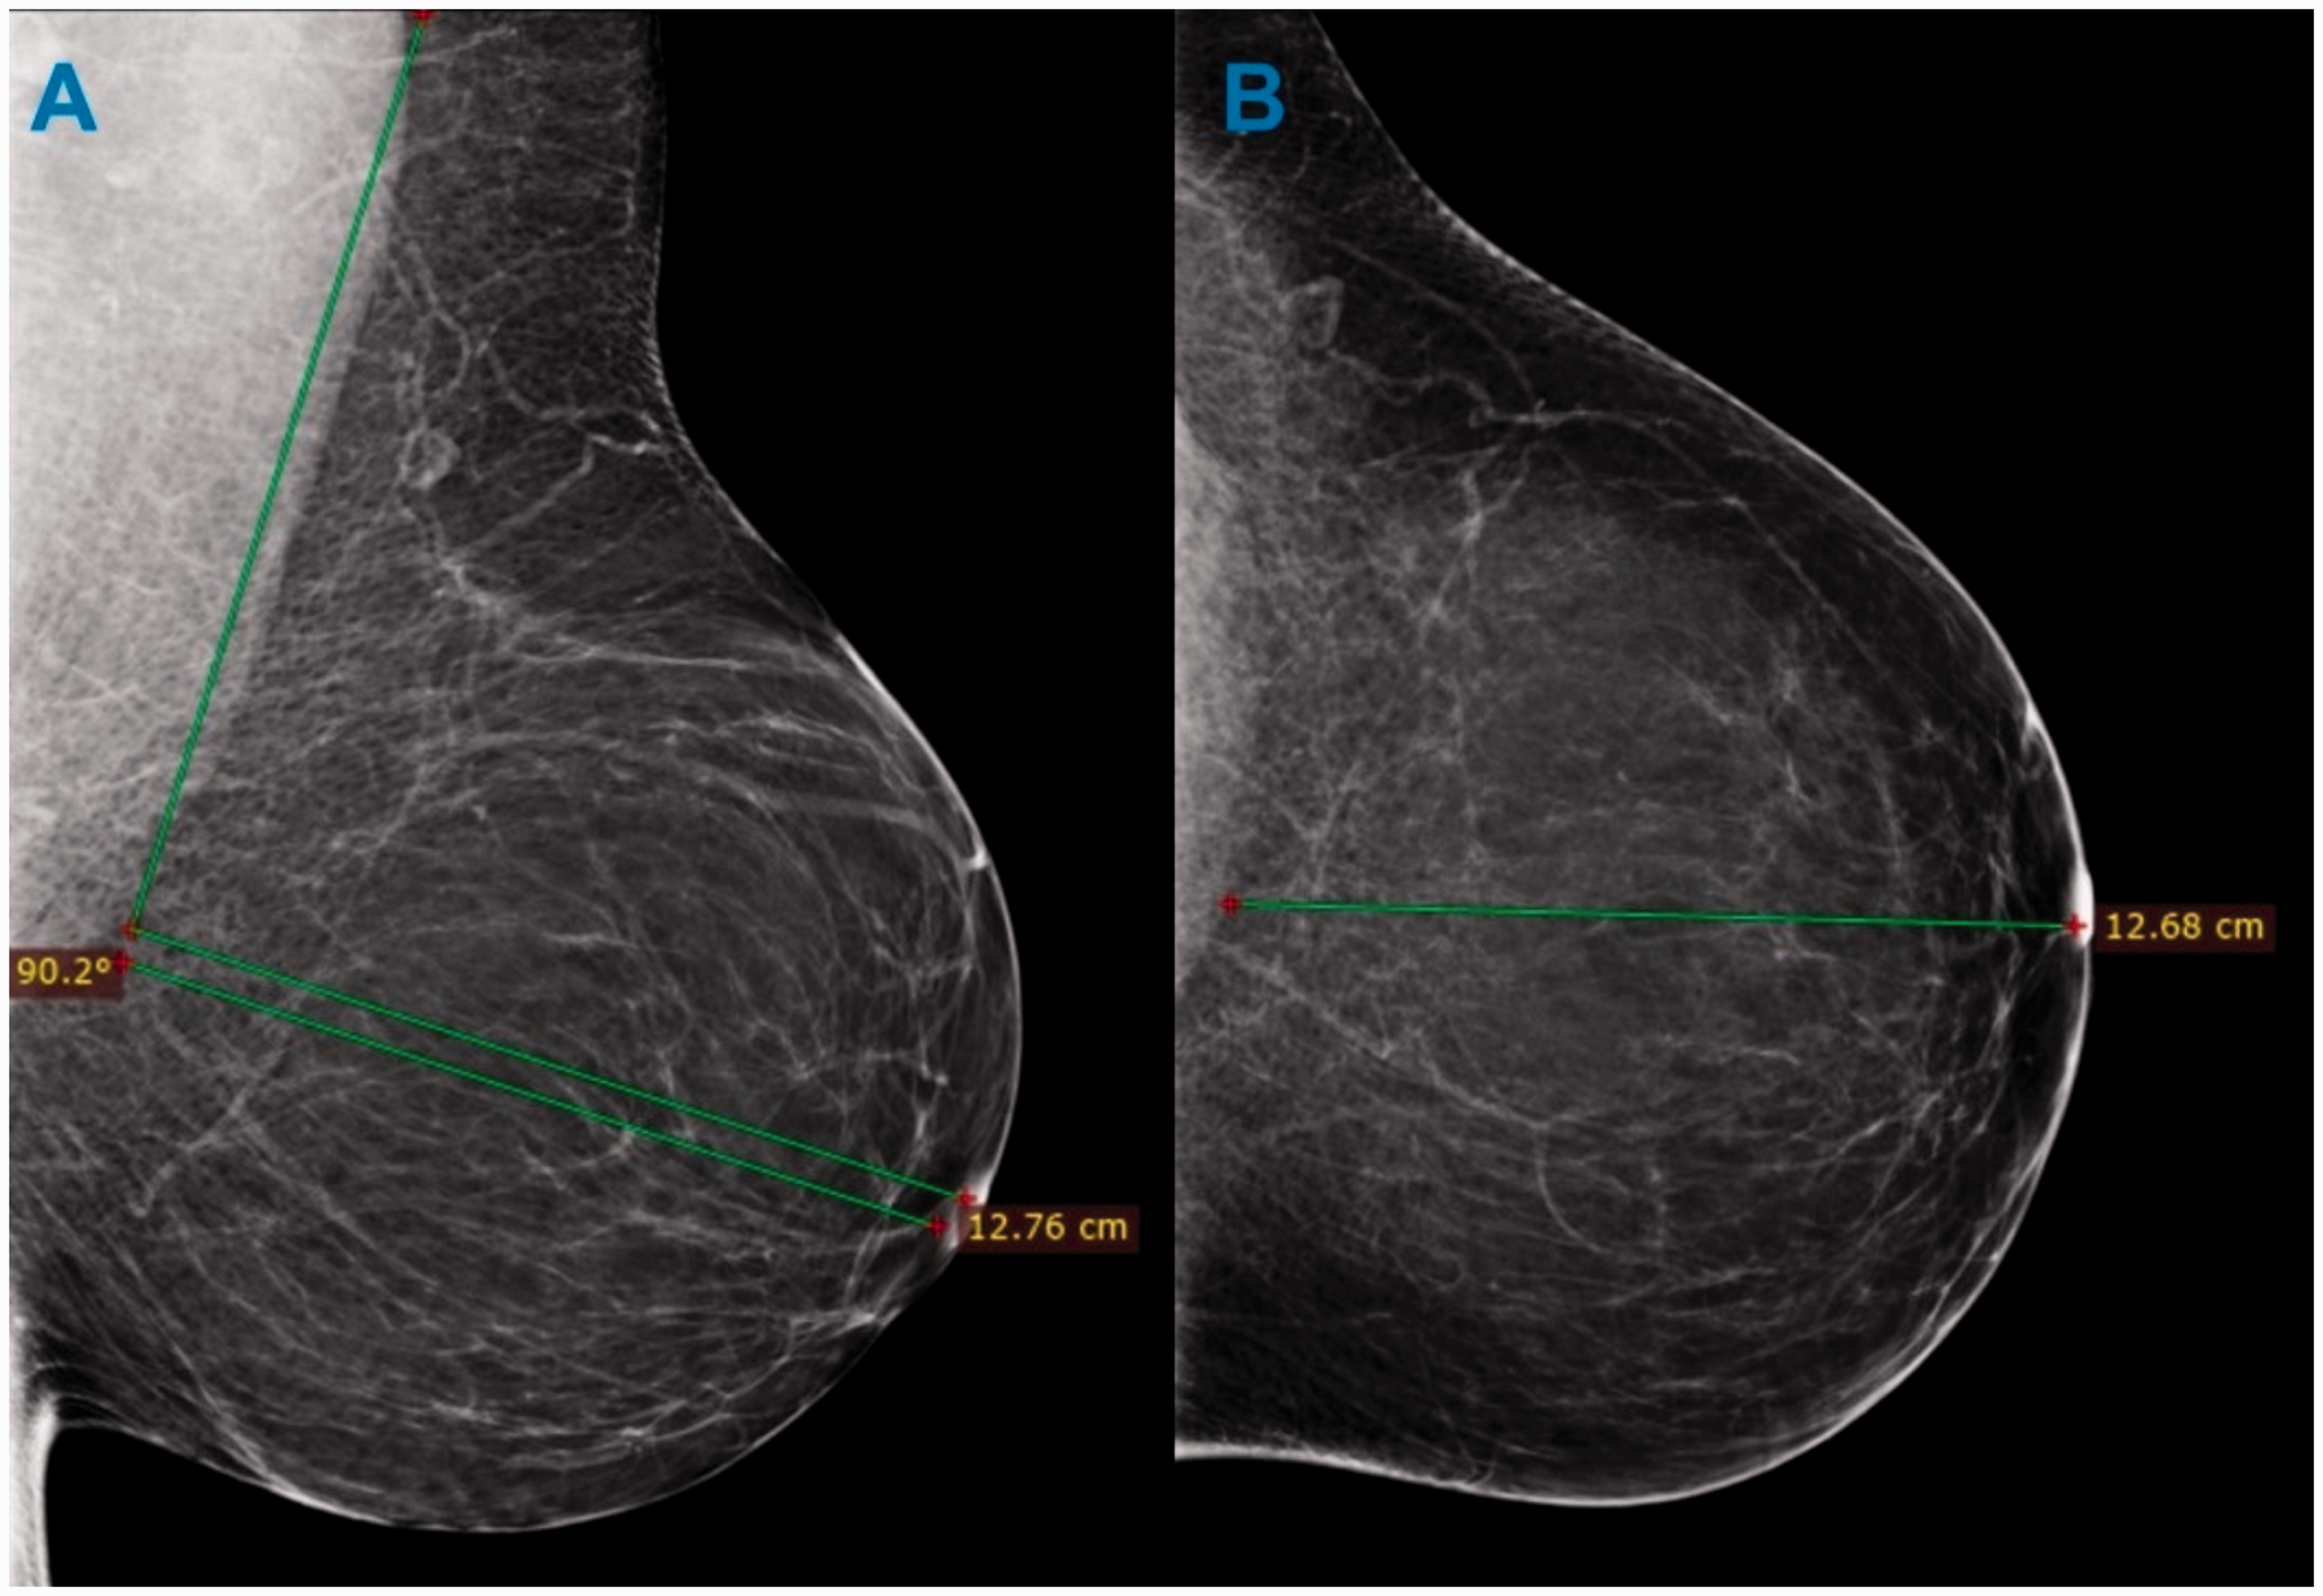
Method for obtaining posterior nipple line in a mammography with adipose density. A perpendicular line to the pectoralis muscle to the contour of the image in the mediolateral oblique (a) and craniocaudal (b) incidence.
Assessment of breast density
Breast density was classified by visual assessment on CC and MLO views of both breasts by two radiologists with extensive experience in breast radiology (approximately 15 years each), in a randomized distribution of cases, according to breast composition categories described in the 5th Edition of the Breast Imaging Reporting and Data System (BI-RADS), established by the ACR (22). Four groups (a, b, c, and d), each containing 32 MMGs, were categorized as follows: a = almost entirely fat; b = scattered fibro glandular tissue; c = heterogeneously dense; and d = extremely dense.
Quality indicators applied
MMGs were evaluated on the basis of quality criteria published in the European Guidelines on Quality Criteria for Diagnostic Radiographic Images and the ACR Quality Control Manual, which are summarized in Tables 1 and 2, respectively, for CC and MLO views. Both include positioning and exposure criteria for optimization of doses (1,2).
Quality criteria for craniocaudal projection.
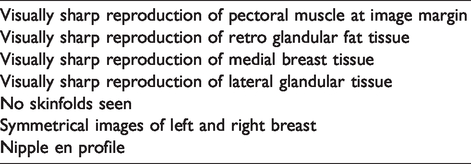
Quality criteria for mediolateral oblique projection.
To reduce the radiologist’s subjectivity, each standard was evaluated in absolute terms: criteria that were fulfilled (positive evaluation) were assigned a value of 1; and criteria that were not fulfilled were assigned a value of 0 by another researcher (GLO).
Statistical analysis
Comparisons of PNL values and their relationship for each mammary parenchyma and all the quality criteria were performed using analysis of variance (ANOVA) according to the nature of the variables (i.e. continuous for PNL and categorical for parenchyma) between the quality criteria and the achievement of a proper PNL for each breast.
To study in what extent each quality criteria influenced the PNL, and to analyze the power of each factor in aiding or possible obstructing the PNL difference, a series of correlation coefficients between the quality criteria and PNL was analyzed using the correlation coefficient r, with r > 0 considered to be positive and r < 0 to be negative correlations.
We also analyzed the performance of PNL in indicating whether an MMG examination is appropriate or not for analysis with a gold standard, which was the judgment of the radiologist in indicating whether the overall presentation of the MMG was ideal correct report. The receiver operating characteristic (ROC) made the correlation between PNL and the radiologist’s approval since some studies obtained inadequate PNLs, but the radiologists approved (false-negatives) and vice versa (false-positives). We also obtained the area under the curve (AUC) for each ROC curve plotted.
Values obtained from the statistical analysis were considered to be statistically significant at P < 0.05. Statistical analysis was performed using R version 3.5.1 (The R Foundation for Statistical Computing, Vienna, Austria) and the graphics were plotted on Excel 2018 (Microsoft Corporation, Redmond, WA, USA).
Results
Inaccurate incidence of PNL
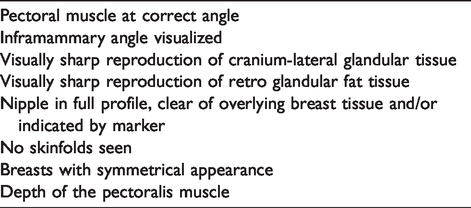
Differences in PNL > 1 cm were obtained in 8, 11, 3, and 7 MMGs for parenchyma types a, b, c, and d, respectively, for the right breast, and 7, 10, 4, and 5 MMGs for the densities a, b, c, and d, respectively, for the left breast. A histogram illustrating the incidence of PNL > 1 cm for the right and left breasts is shown in Fig. 2.
Histograms indicating the presence of posterior nipple line > 1 cm in the right (a) and left (b) breasts.
Mean PNL values were 0.6 cm (SD with 95% of confidence interval [CI] – SD 0.74), 0.7 cm (SD 0.6), 0.6 cm (SD 0.4), and 0.8 cm (SD 0.6) for the right breast, and 0.4 cm (SD 0.6), 0.7 cm (SD 0.6), 0.4 cm (SD 0.5), and 0.8 cm (SD 0.5) for the left breast for the density categories a, b, c, and d, respectively. Box plot charts illustrating the distribution of PNLs in the right and left breasts as a function of parenchyma are shown in Fig. 3.
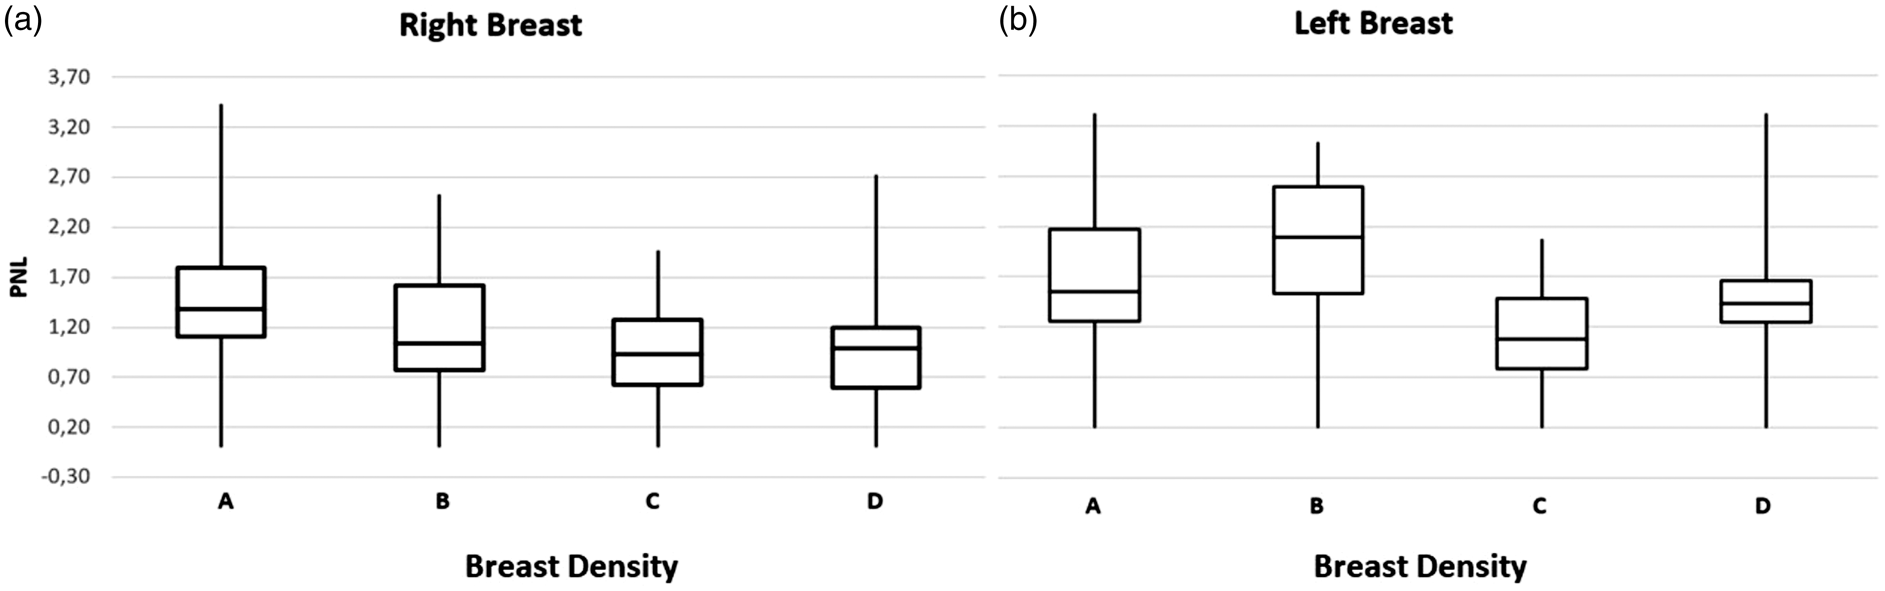
Box plots illustrating the distribution in posterior nipple line percentiles for right (a) and left (b) breasts.
Performance analysis of the mammary parenchyma in obtaining PNL
This value was obtained in correlation with parenchyma binary analysis because the continuous analysis was performed using ANOVA (f of 1,0 with P of 0.4, and f of 1,1 with P of 1.3 for the right and left breasts, respectively). The AUC of the ROC analysis revealed values of 53.1% and 54.7% for the right and left breasts, respectively. The discrepant shape of the ROC curve for the left breast compared with the right was possibly due to high level of variance of the PNL on this breast, even those dispersed equally among the groups of parenchyma. ROC curves for the right and left breasts are shown in Fig. 4 and in Suppl. Fig. 1, respectively.
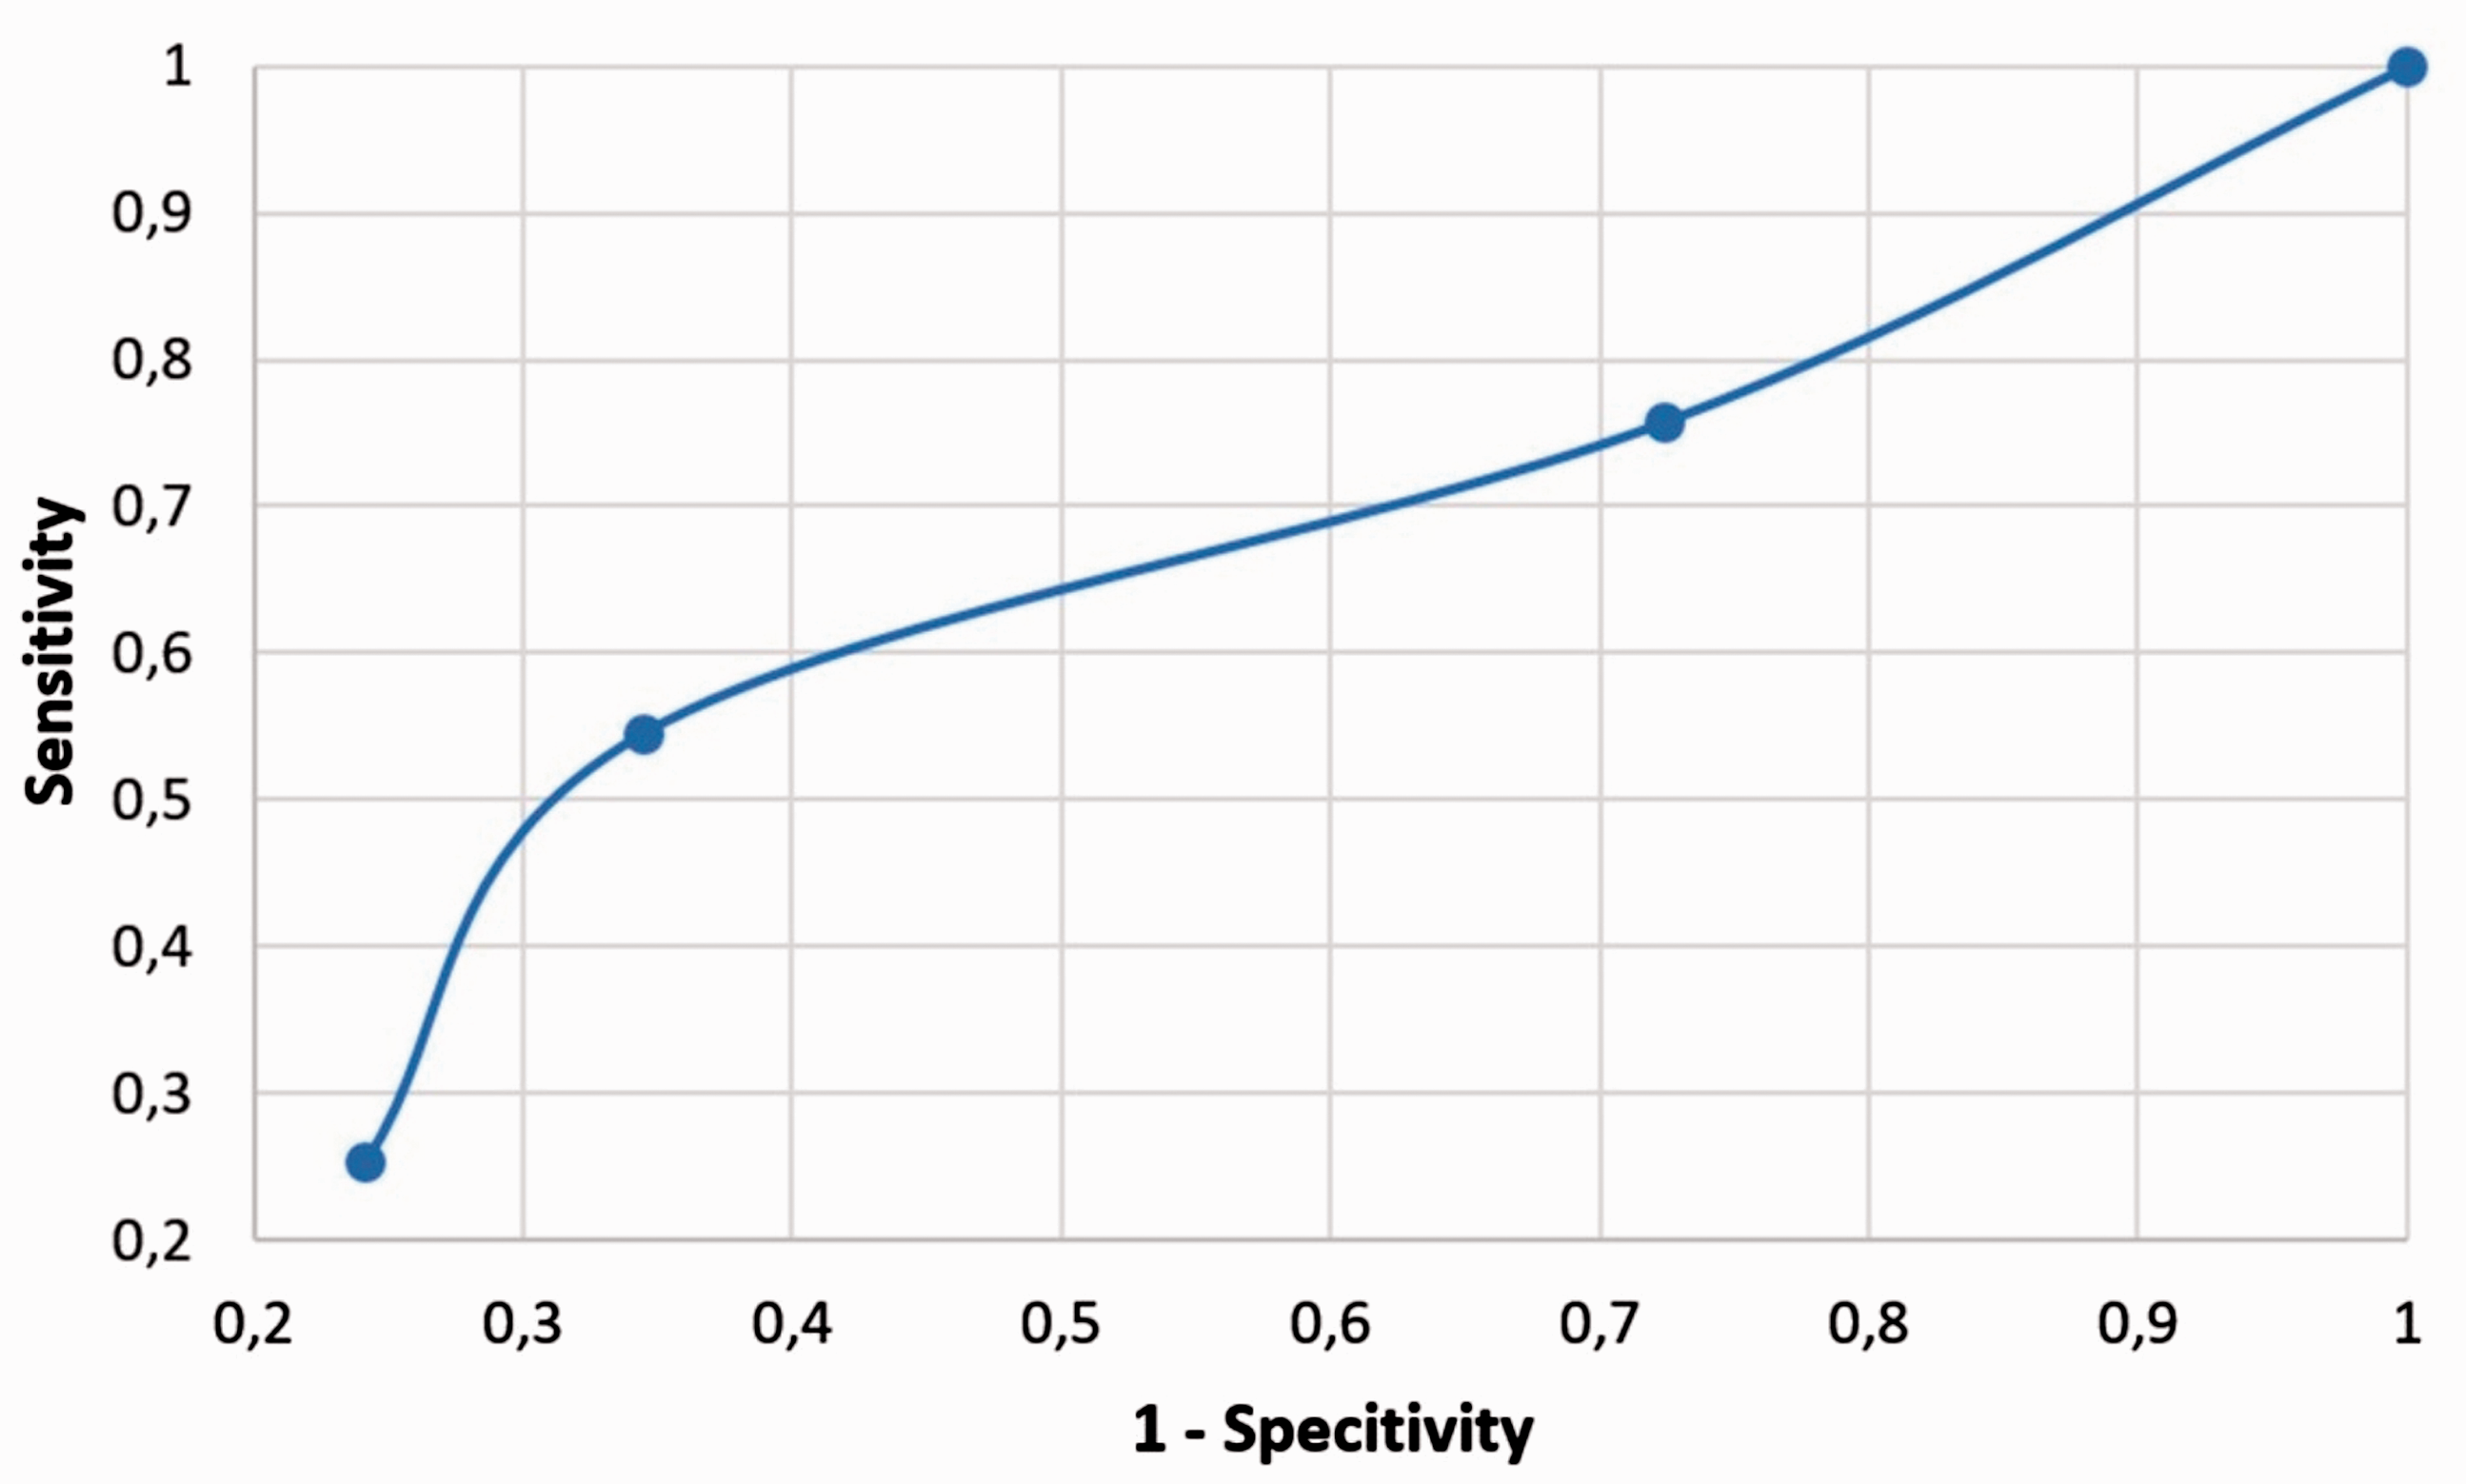
Receiver operating characteristic curve evaluating the performance of a mammography suitable for evaluation due to the presence of adequate posterior nipple line for the right breast.
Correlation between quality indicators
The visually sharp reproduction of pectoral muscle at the image margin in CC failed in all breast composition categories studied, with adequate visualization of pectoralis major muscle in fatty MMG (46.8% and 31.3% for right and left CC, respectively) and in dense fibro glandular tissue with a lower frequency (18.8% and 9.4% for right and left CC, respectively).
Inadequate pectoralis major muscle (absent muscle and/or muscle contours suggestive of contraction) on MLO view or incorrect angle was found in fatty MMGs (31.3% and 62.5% for right and left MLO, respectively) with better results in dense breasts on the right (78.1%).
The inadequate inframammary angle was visualized in a smaller number of right breasts in fatty and scattered fibroglandular tissue categories (43.8% and 40.6% for the right and left MLO, respectively).
The visually sharp reproduction of lateral breast tissue presented lower incidence in the dense breast group (31.3% and 46.9% for the right and left CC, respectively) and medial (50% and 37.5% for the right and left CC, respectively).
The breast density group that presented the highest number of examinations with skinfolds was adipose (i.e. category a), with eight MMGs on the right breast and 12 MMGs on the left. On CC view, the nipple was not in profiled in four MMGs in the right breast and 12 MMGs in the left.
A weak positive correlation (i.e. r > 0) with P < 0.05 was obtained in both breasts for the following criteria: absence of skin folds (r = 0.05); presence of proper contour (r = 0.02); and symmetry and vascular structures visible (r = 0.3). The correlation coefficients are reported in Suppl. Tables 1 and 2 for the right and left breasts, respectively. The remaining quality criteria did not demonstrate significant correlations (r = 0) according to the sampling.
Discussion
This study analyzed 128 paired digital MMGs performed on women who experience routine imaging to investigate the influence of positioning during MMG on the CC and MLO views, and image evaluation criteria on the basis of the IQ criteria published in the European Guidelines on Quality Criteria for Diagnostic Radiographic Images with their breast parenchyma and according to breast composition categories listed in the 5th Edition of the ACR Quality Control Manual (1,2).
According to Basset et al. (3), fatty breasts may present greater challenges for positioning when they are larger than dense breasts. On the other hand, compression and exposure pose a greater problem in dense breasts. Eklund (4) reported that difficulties in obtaining high-quality MMGs due to features uniquely inherent to the breast—such as shape, size, density, and low contrast—combined with patient factors—such as anxiety, tenderness, and fear of radiation—challenge the skills of the best-trained technologists. In 1993, Basset et al. (19) published a study in which the pectoralis was within 1 cm or below the PNL on the MLO projection only 81% of the time due to variations in body habitus and patient conditions.
Another interesting finding of our study was the discrepancy of the AUC of the ROC curves for each breast. We believed that a lack of a proper number of cases compromised the study, especially after the analysis of the shape of the ROC curve for the left breast (Suppl. Fig. 1), but was still statistically significant.
Fatty MMGs generated lower visibility in the mammary angle, a greater number of skin folds, and a posterior line of the papilla with a difference > 1 cm, and dense MMG presented less visibility of the lateral tissue compared with the other categories as illustrated by the ANOVA analysis performed. These were issues also encountered in other studies reported in the literature (6,7).
The most frequently reported factors in achieving a proper MMG were due to an inadequate amount of pectoralis major muscle on the MLO view, poor visualization of posterior tissue on the CC or MLO views, sagging breasts, or skin folds (5–7,10,14,19). However, with weak power of correlation, we found statistically significant values, which were due to the limited number of cases but still noteworthy of consideration.
The sample in this study did not yield significant results for obtaining PNL as a function of the mammary parenchyma as reported in the ANOVA analysis performed. However, correlations with quality indicators were significant, thus demonstrating the relationship between these factors and, consequently, the importance of evaluating these criteria in achieving MMG examination quality compared with other criteria.
The main limitation of this study was the size of the population, especially for the breast density analysis. However, we still obtained statistically significant values even with weak correlations, which could mean that if the number of cases were improved, we could maintain this correlation and only augment the value.
In conclusion, to achieve and maintain proper positioning during MMG, several factors reported in major quality of imaging guidelines should be applied. However, the breast parenchyma should also be a focus in the practical scenario. We purpose that training, continuing education, and positive communication, in accordance with quality criteria, are essential. Technologists should be trained in proper and individualized positioning based on this scenario and a continuous feedback from fellow radiologists should be made.
Supplemental Material
ACR884678 Supplemetal Material - Supplemental material for Image evaluation and breast density categories as a function of mammary positioning in full-field digital mammography
Supplemental material, ACR884678 Supplemetal Material for Image evaluation and breast density categories as a function of mammary positioning in full-field digital mammography by Irene Tomoko Nakano, Gabriel Lucca de Oliveira Salvador, Hugo Reuters Schelin, Valeriy Denyak, Helen Jamil Khoury and Silvio Tacara in Acta Radiologica
Footnotes
Declaration of conflicting interests
The author(s) declared no potential conflicts of interest with respect to the research, authorship, and/or publication of this article.
Funding
The author(s) disclosed receipt of the following financial support for the research, authorship, and/or publication of this article: This study was financed in part by the Coordenação de Aperfeiçoamento de Pessoal de Nível Superior - Brasil (CAPES) - Finance Code 001.
Supplemental material
Supplemental material for this article is available online.
References
Supplementary Material
Please find the following supplemental material available below.
For Open Access articles published under a Creative Commons License, all supplemental material carries the same license as the article it is associated with.
For non-Open Access articles published, all supplemental material carries a non-exclusive license, and permission requests for re-use of supplemental material or any part of supplemental material shall be sent directly to the copyright owner as specified in the copyright notice associated with the article.