
Abstract
Background
Pressure-volume analysis is the gold standard for quantifying pump function of the right ventricle (RV); however, volume measurements based on a conductive catheter may be imprecise. The reference method for volume assessment is cardiac magnetic resonance (CMR).
Purpose
To determine the levels of agreement between RV volume measurements obtained by cine CMR, phase-contrast CMR (PC CMR), and a conductance catheter in an animal model.
Material and Methods
CMR was performed in 20 sheep three months after pulmonary artery banding. Ejection fraction (EF), end-diastolic (EDV), end-systolic (ESV), and stroke volumes (SV) were obtained by cine CMR and conductance catheter.
Results
Statistically significant differences between cine CMR and conductance catheter derived volume measurements were found for EDV (P < 0.001), ESV (P < 0.05), and SV (P < 0.05). Bland–Altman analysis showed very poor agreement between the two methods: EDV, bias 36.27 mL, agreement of limits 1.96–70.57 mL; ESV, bias 15.33 mL, agreement of limits –6.89–37.55 mL; and SV, bias 20.69 mL, agreement of limits 8.01–49.10 mL. Good agreement was found for SV between cine CMR and PC CMR (bias –7.0 mL, agreement of limits –24.01–9.98 mL), while SV derived from PC CMR measurements showed poor agreement with conductance catheter (bias 27.76 mL, agreement of limits –3.84–59.26 mL).
Conclusion
Poor agreement between the conductance catheter and CMR RV volume measurements was found. PC CMR and cine CMR measurements of SV agreed well.
Introduction
Cardiac magnetic resonance (CMR) and three-dimensional (3D) echocardiography are considered the gold standard for assessing left ventricular (LV) and right ventricular (RV) volumes, wall motion, and ventricular architecture (1–5). Although both methods have the advantage of being non-invasive, they produce only load-dependent variables. The gold standard to assess the hemodynamic properties of a loaded LV is pressure-volume analysis by conductance catheterization, which can quantify systolic and diastolic function regardless of loading conditions (6). It is challenging, however, to accurately determine RV volumes by conductance catheter (7). A simple transfer of the geometric assumptions from the LV to the RV to calculate volumes would be misleading, because of the more complex shape of the RV (8). Another shortcoming is that conductance differences between blood and ventricular wall may be blurred, leading to false volume estimations. Nonetheless, conductance catheter examinations are widely used in experimental studies to assess RV contractility and volumes. Several studies have demonstrated that pressure-volume loop-analysis of RV provides a more detailed insight into RV function than conventional catheterization (9–12).
In experiments on sheep after pulmonary artery banding (PAB), we had observed that the RV volumes measured with CMR differed considerably from those measured with the conductance catheter. The aim of this analysis, therefore, is to evaluate whether these differences are statistically significant.
Material and Methods
This study was approved by the local Animal Care Committee. Animal care was in compliance with the Guide for the Care and Use of Laboratory Animals prepared by the Institute of Laboratory Animal Resources and published by the US National Institutes of Health.
To achieve comparable physiological and hemodynamic states at CMR and conductance catheter examinations, it was ensured that all animals were in a good state of health, had no signs of disease, and no feeding problems, and that breath and pulse frequencies were in the normal range before they were brought to the examinations.
Conductance catheter examinations
Conductance catheter-based pressure-volume examinations were performed in 20 four-month-old domestic sheep three months after PAB. A 12-electrode 5-F pressure-volume conductance catheter (Millar Instruments, Houston, TX, USA) was placed through the RV outflow tract with the tip in the RV apex and the two most proximal electrodes above the pulmonary valve. The conductance catheter was connected to a pressure-volume transducer system for pressure (Millar MPVS 300, EMKA Technologies, Paris, France) and volume analysis (Sigma 5 DF, CD Leycom, Zoetermeer, The Netherlands). The transducer systems were linked to the Millar PowerLab data-acquisition hardware (Type ITF 16, EMKA Technologies, Paris, France). Only electrodes that were located inside the RV chamber were activated. The volume measurements by conductance catheter are based on the significantly better electrical conductivity of the blood compared to the heart muscle. To compensate for conductivity contributions from the RV wall and tissue outside the RV, parallel volume was assessed by injecting 10 mL of 10% hypertonic saline into the right atrium, which increases the conductivity of the blood in the RV. From the difference between the values obtained with and without saline solution, the parallel volume was calculated. Moreover, a reference volume measurement becomes necessary since the geometric model of an ellipsoid, which is applied using a conductance catheter, is only a rough approximation of the anatomy of the RV. Reference RV volume values were gained by invasively measuring cardiac output three times using the thermodilution method. A bolus of iced saline (10 mL) was injected into the right atrium through a Swan-Ganz-catheter (Arrow International Inc, Reading, PA, USA) during breath-hold at end-expiration. A thermodilution curve (temperature versus time) was recorded. The quotient of the reference stroke volume divided by the stroke volume from conductance catheter gave the correction factor alpha. Thereafter, a 23-mm balloon catheter (Fogarty Occlusion Catheter, 8–22 F, Edward Lifesciences LLC, Irvine, CA, USA) was advanced through the right atrium into the inferior vena cava for standardized preload reduction maneuvers. A series of 10 pressure–volume loops during gradually increasing vena cava occlusions was obtained during breath hold. Apart from pressure parameters, end-diastolic and end-systolic volume (EDV, ESV), ejection fraction (EF), cardiac output (CO), and stroke volume (SV) were measured.
Cardiac magnetic resonance measurements
CMR examinations were performed five to eight days before the final invasive pressure–volume examinations. CMR of the anesthetized and mechanically ventilated animals was performed on a 1.5-T scanner (Avanto, Siemens Healtheneers, Erlangen, Germany) three months after PAB (Fig. 1). Measurements were taken at end-expiration with the ventilator turned off to minimize motion artifacts. Steady-state free precession (SSFP) cine images were obtained with retrospective ECG gating in the two- and four-chamber view for the RV, including 10–12 contiguous, short-axis, 6-mm-thick slices through the two ventricles from base to apex. Twenty-eight frames were acquired per average cardiac cycle (TR = 41.85 ms; TE = 1.20 ms; flip angle [FA] = 40°; bandwidth = 930 Hz/pixel; field of view [FOV] = 227 × 280 mm; matrix = 192 × 156 pixels).

Steady-state free precession cine CMR image in a sheep three months after PAB.RV, right ventricle; PA, main pulmonary artery; pulmonary artery banding site (arrows); LV, left ventricle; LA, left atrium.
A velocity-encoded, retrospectively ECG-gated phase-contrast gradient echo sequence was performed with a 6-mm-thick slice perpendicularly to the course of the main PA at the banding site. Velocity-encoding gradients were set to cover a dynamic range of –150–150 cm/s. If necessary, the flow measurements were repeated with a stepwise increase in the velocity-encoding until no aliasing artefacts were observed.
To minimize phase shift errors caused by eddy currents, the integrated eddy current compensation technique (ECE) was used. Furthermore, the main pulmonary artery was centered in the B0 field as far as possible. Twenty-eight frames were acquired per average cardiac cycle, yielding a time resolution of between 25.3 and 38.3 ms (TR = 47.15 ms; TE = 2 ms; FA = 30°; bandwidth = 555 Hz/pixel; FOV = 219 × 319 mm; matrix = 192 × 132 pixels).
Volume and flow data were analyzed with the Argus software (Leonardo, Siemens Healthineers, Erlangen, Germany). Short-axis slices of the RV from the tricuspid valve level to the apex of the heart were loaded into the volume evaluation tool. Endocardial contours were manually outlined on the end-diastolic and end-systolic frames excluding papillary muscles by one reader with16 years of experience in CMR (Fig. 2). ESV, EDV, SV, and EF were calculated for the RV using Simpson’s method.

Magnitude (a) and phase-contrast (b) images showing the side of measurement in the PAB area (outlined in yellow). Steady-state free precession cine CMR in the short axis in systole (c) and diastole (d) with the inner contour of the right ventricle outlined in yellow.
The PC CMR datasets were loaded into the flow evaluation tool to measure SV at the level of the main PA. The inner contours of the main PA were outlined in each cardiac phase on the phase images and, if necessary, adjusted on the magnitude images (Fig. 2).
Statistics
Data are expressed as mean ± SD. The two-tailed t-test was used to test for significant differences between PC CMR, cine CMR, and catheter-based RV volumes. A probability value of 0.05 was taken as statistically significant. Bland–Altman analysis was used to compare the different volume quantification methods (13). Bias was the mean of the difference between the two methods, and the limits of agreement were the mean ± 1.96 SD. Precision was quantified by use of the 95% confidence intervals (CI) of the bias and the limits of agreements. Bias, level of agreements and precision were also expressed as percentages (Table 1). Linear regression analysis was used to determine the correlation between CMR and conductance catheter measurements. Agreement was assessed by calculation of the intraclass correlation coefficient (ICC).
Bland–Altman analysis for volumetric parameters obtained by cine CMR, PC CMR, and conductance catheter (%).
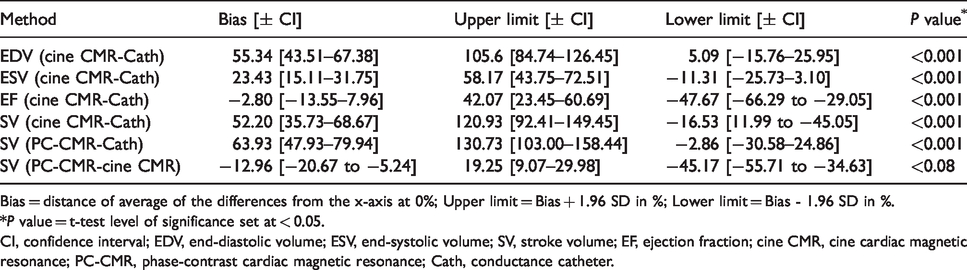
Bias = distance of average of the differences from the x-axis at 0%; Upper limit = Bias + 1.96 SD in %; Lower limit = Bias - 1.96 SD in %.
*P value = t-test level of significance set at < 0.05.
CI, confidence interval; EDV, end-diastolic volume; ESV, end-systolic volume; SV, stroke volume; EF, ejection fraction; cine CMR, cine cardiac magnetic resonance; PC-CMR, phase-contrast cardiac magnetic resonance; Cath, conductance catheter.
Results
Characteristics of the animals
The study group consisted of 11 female and 9 male sheep weighing 39 ± 1.34 kg. The age of the animals was 25.28 ± 0.75 weeks. Systemic systolic blood pressure was 77.20 ± 9.60 mmHg and the heart rate 95.4 ± 6.39 beats per minute at the time of CMR examination. Systemic systolic blood pressure was 79.65 ± 8.05 mmHg and the heart rate 93.4 ± 5.7 beats per minute during conductance catheter measurements, not significantly different from that at CMR examination (P = 0.38 and P = 0.297, respectively). The diameter of the pulmonary artery at the banding site was 11 ± 1.7 mm; the diameter 1 cm proximal to the banding area was 21 ± 1.9 mm (P < 0.001).
Conductive catheter versus cine CMR analysis
RV EDV measured by cine CMR was 84.84 ± 13.10 mL, measured by conductance catheter 48.17 ± 12.42 mL (Fig. 3). The difference was statistically significant (P < 0.001). Evaluating the level of agreement between the two methods, the Bland–Altman analysis revealed a bias of 36.27 mL, with a precision of 28.05–44.49 mL, an upper limit of agreement of 70.57 mL (precision = 56.33–84.80 mL), and a lower limit of agreement of 1.96 mL (precision = –12.27–16.19 mL) (Table 2).
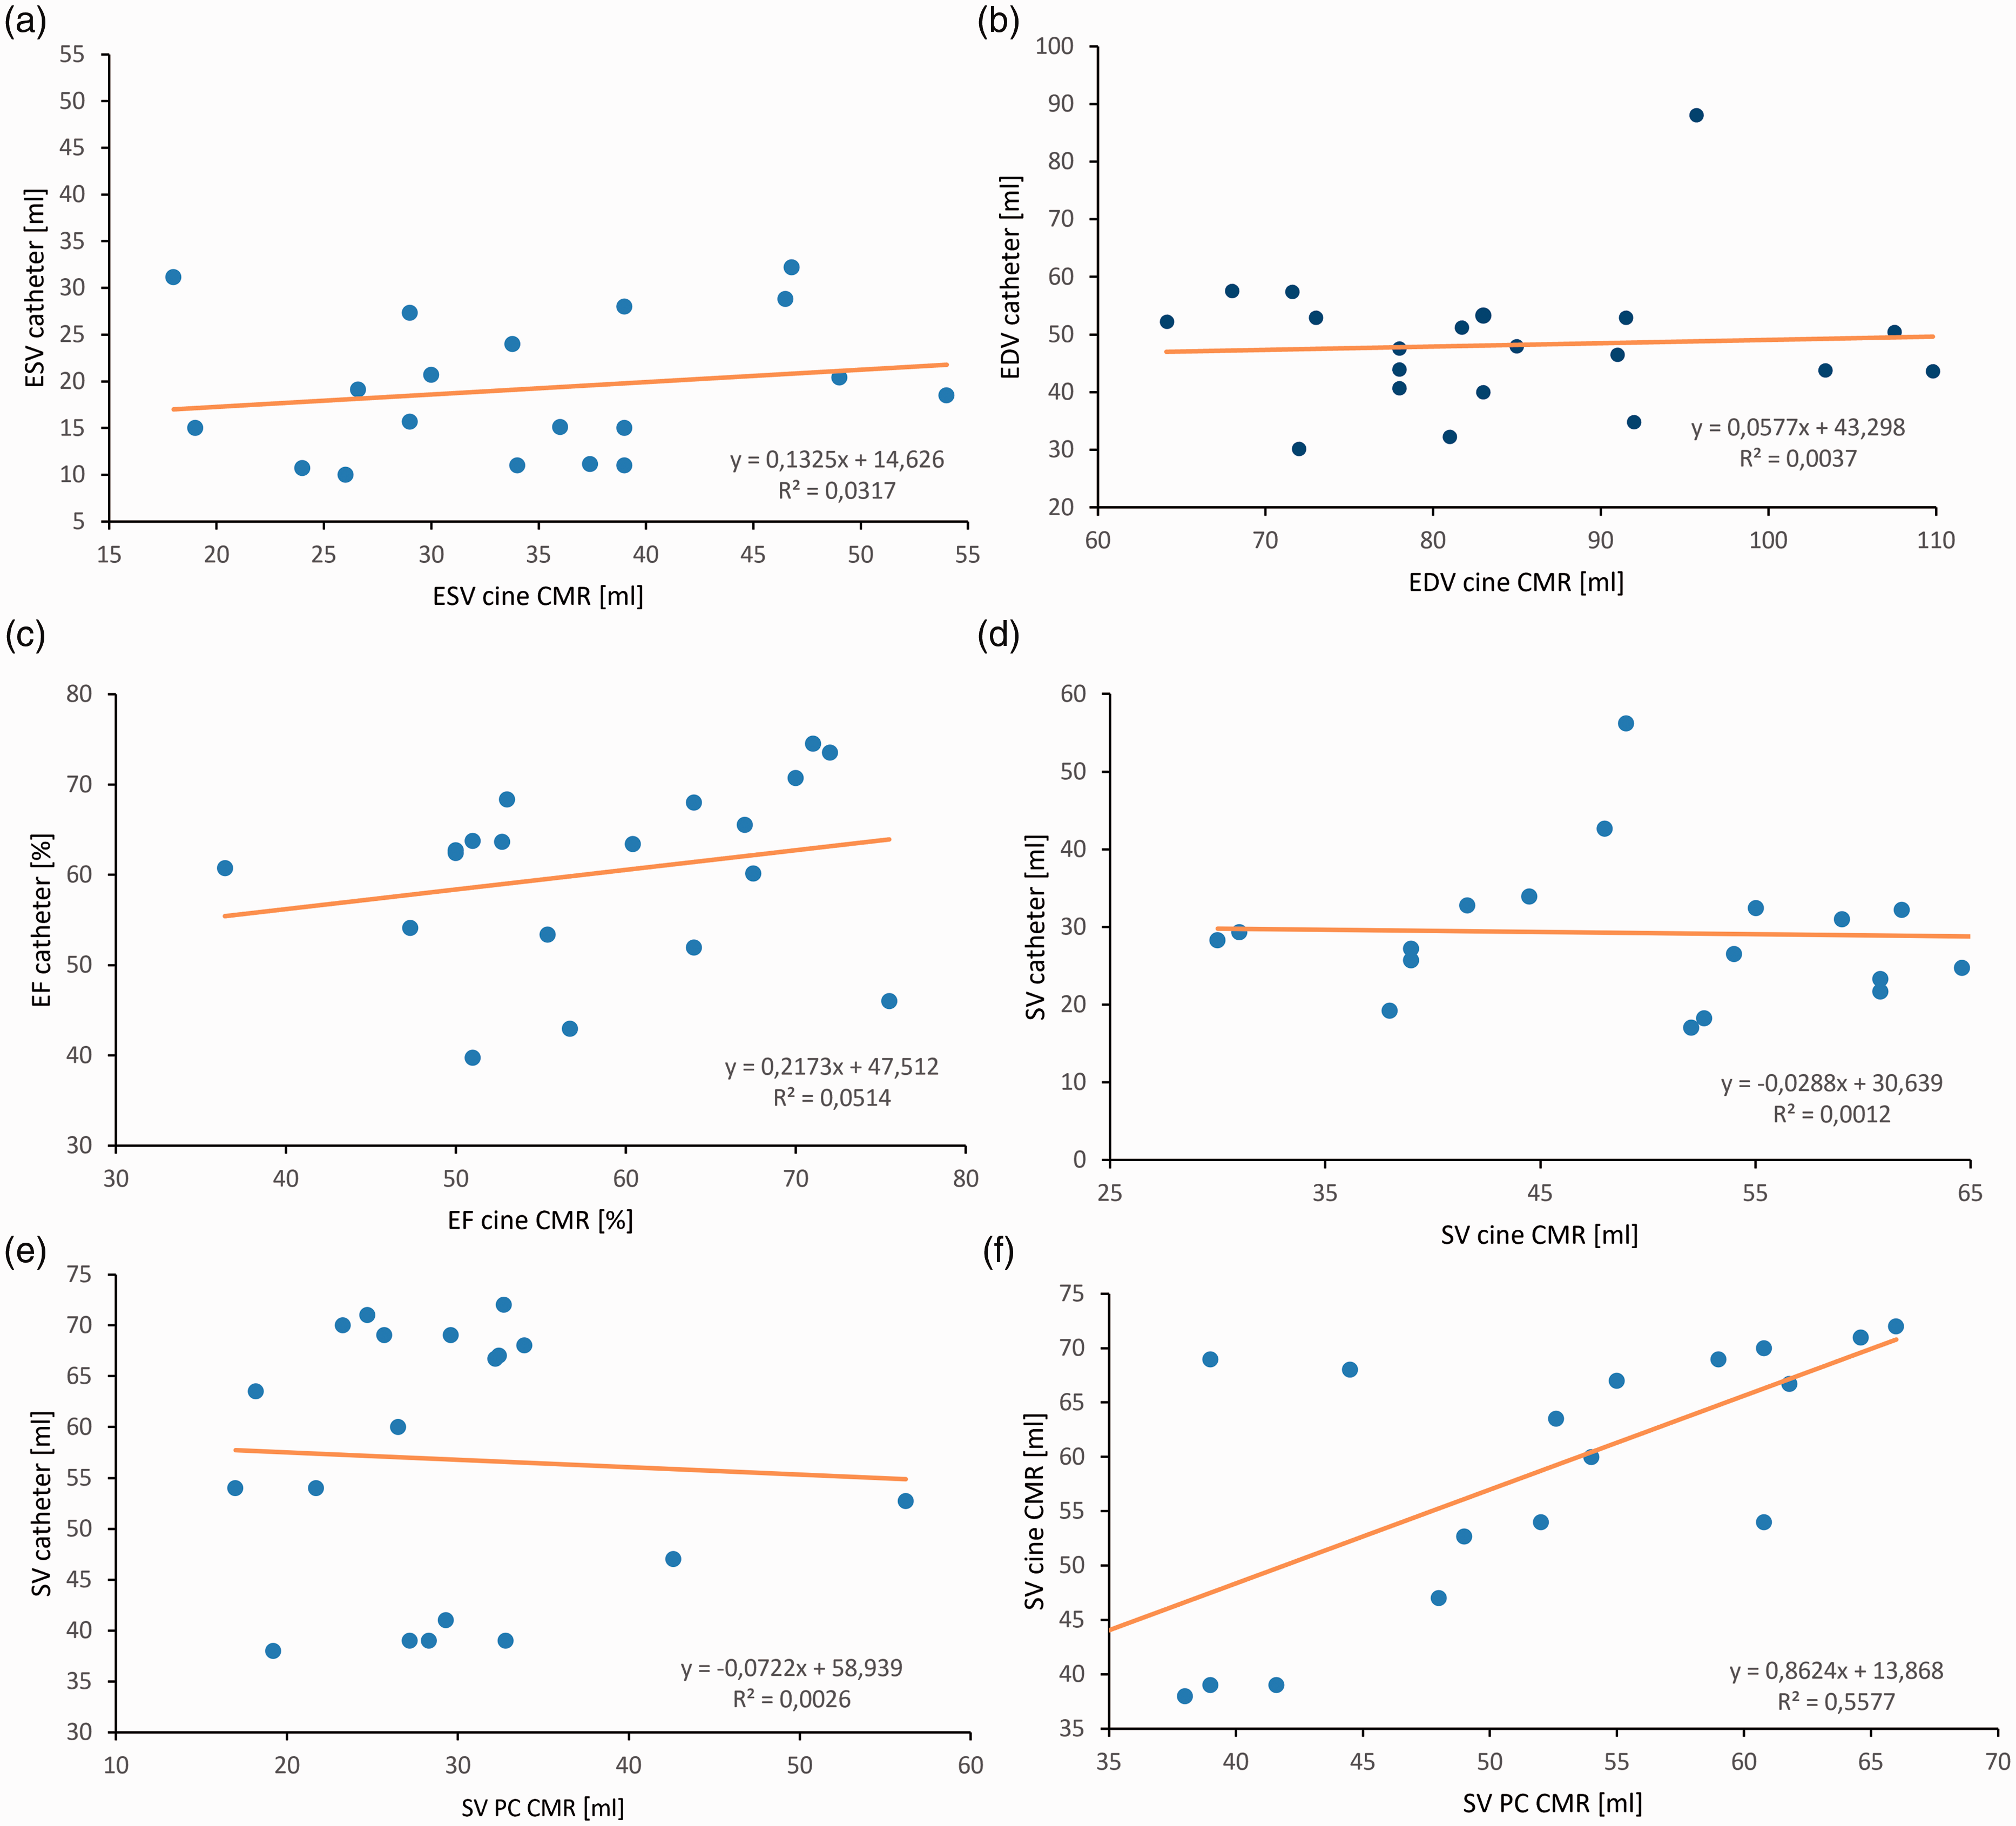
Linear regression of cine CMR vs. conductance catheter-derived ESV (a), EDV (b), and EF (c) in 20 sheep. Linear regression of cine CMR, PC CMR vs. conductance catheter-derived SV and cine CMR vs. PC CMR (d, f, g). Plotted line represents line of regression; corresponding equation in the right lower corner. EDV, end-diastolic volume; ESV, end-systolic volume; EF, ejection fraction; SV, stroke volume; catheter, conductance catheter; PC CMR, phase-contrast cardiac magnetic resonance.
Bland–Altman analysis for volumetric parameters obtained by cine CMR, PC-CMR, and conductance catheter expressed in absolute values.
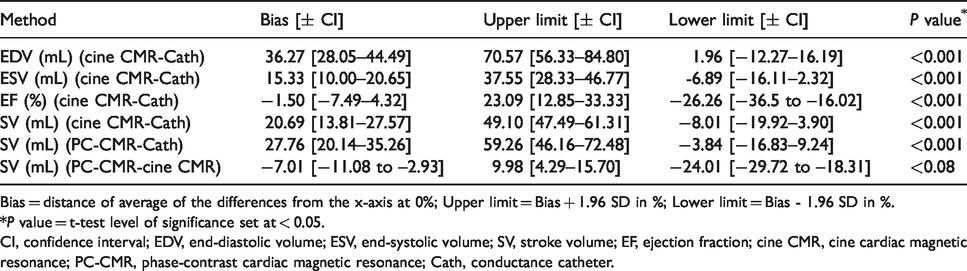
Bias = distance of average of the differences from the x-axis at 0%; Upper limit = Bias + 1.96 SD in %; Lower limit = Bias - 1.96 SD in %.
*P value = t-test level of significance set at < 0.05.
CI, confidence interval; EDV, end-diastolic volume; ESV, end-systolic volume; SV, stroke volume; EF, ejection fraction; cine CMR, cine cardiac magnetic resonance; PC-CMR, phase-contrast cardiac magnetic resonance; Cath, conductance catheter.
RV ESV measured by cine CMR was 34.53 ± 9.99 mL, measured by conductance catheter 19.20 ± 7.43 mL (P < 0.001). The bias was 15.33 mL (precision = 10.0–20.65 mL), the upper limit of agreement was 37.55 mL (precision = 28.33–46.77 mL), and the lower limit of agreement was –6.89 mL (precision = −16.11–2.32 mL).
RV EF measured by cine CMR was 58.68 ± 10.33%, measured by conductance catheter 60.26 ± 9.91%. The difference was not significant (P > 0.41). The bias was −1.5% (precision = −7.49–4.32%), the upper limit of agreement was 23.09% (precision = 12.85–33.33%), and the lower limit of agreement was −26.26% (precision = −36.5 to −16.02%).
The ICC was 0.068 for EDV, 0.012 for ESV, and 0.233 for EF.
Analysis of stroke volumes
RV SV measured by cine CMR was 49.82 ± 11.12 mL and measured by conductance catheter 29.13 ± 9.07 mL. The measurements differed significantly (P < 0.001). The levels of agreement were wide; the bias was 20.69 mL, with a precision of 13.81–27.57 mL; the upper limit of agreement was 49.10 mL (precision = 47.49–61.31 mL), and the lower limit of agreement was –8.01 mL (precision = −19.92–3.9 mL) (Fig. 4).
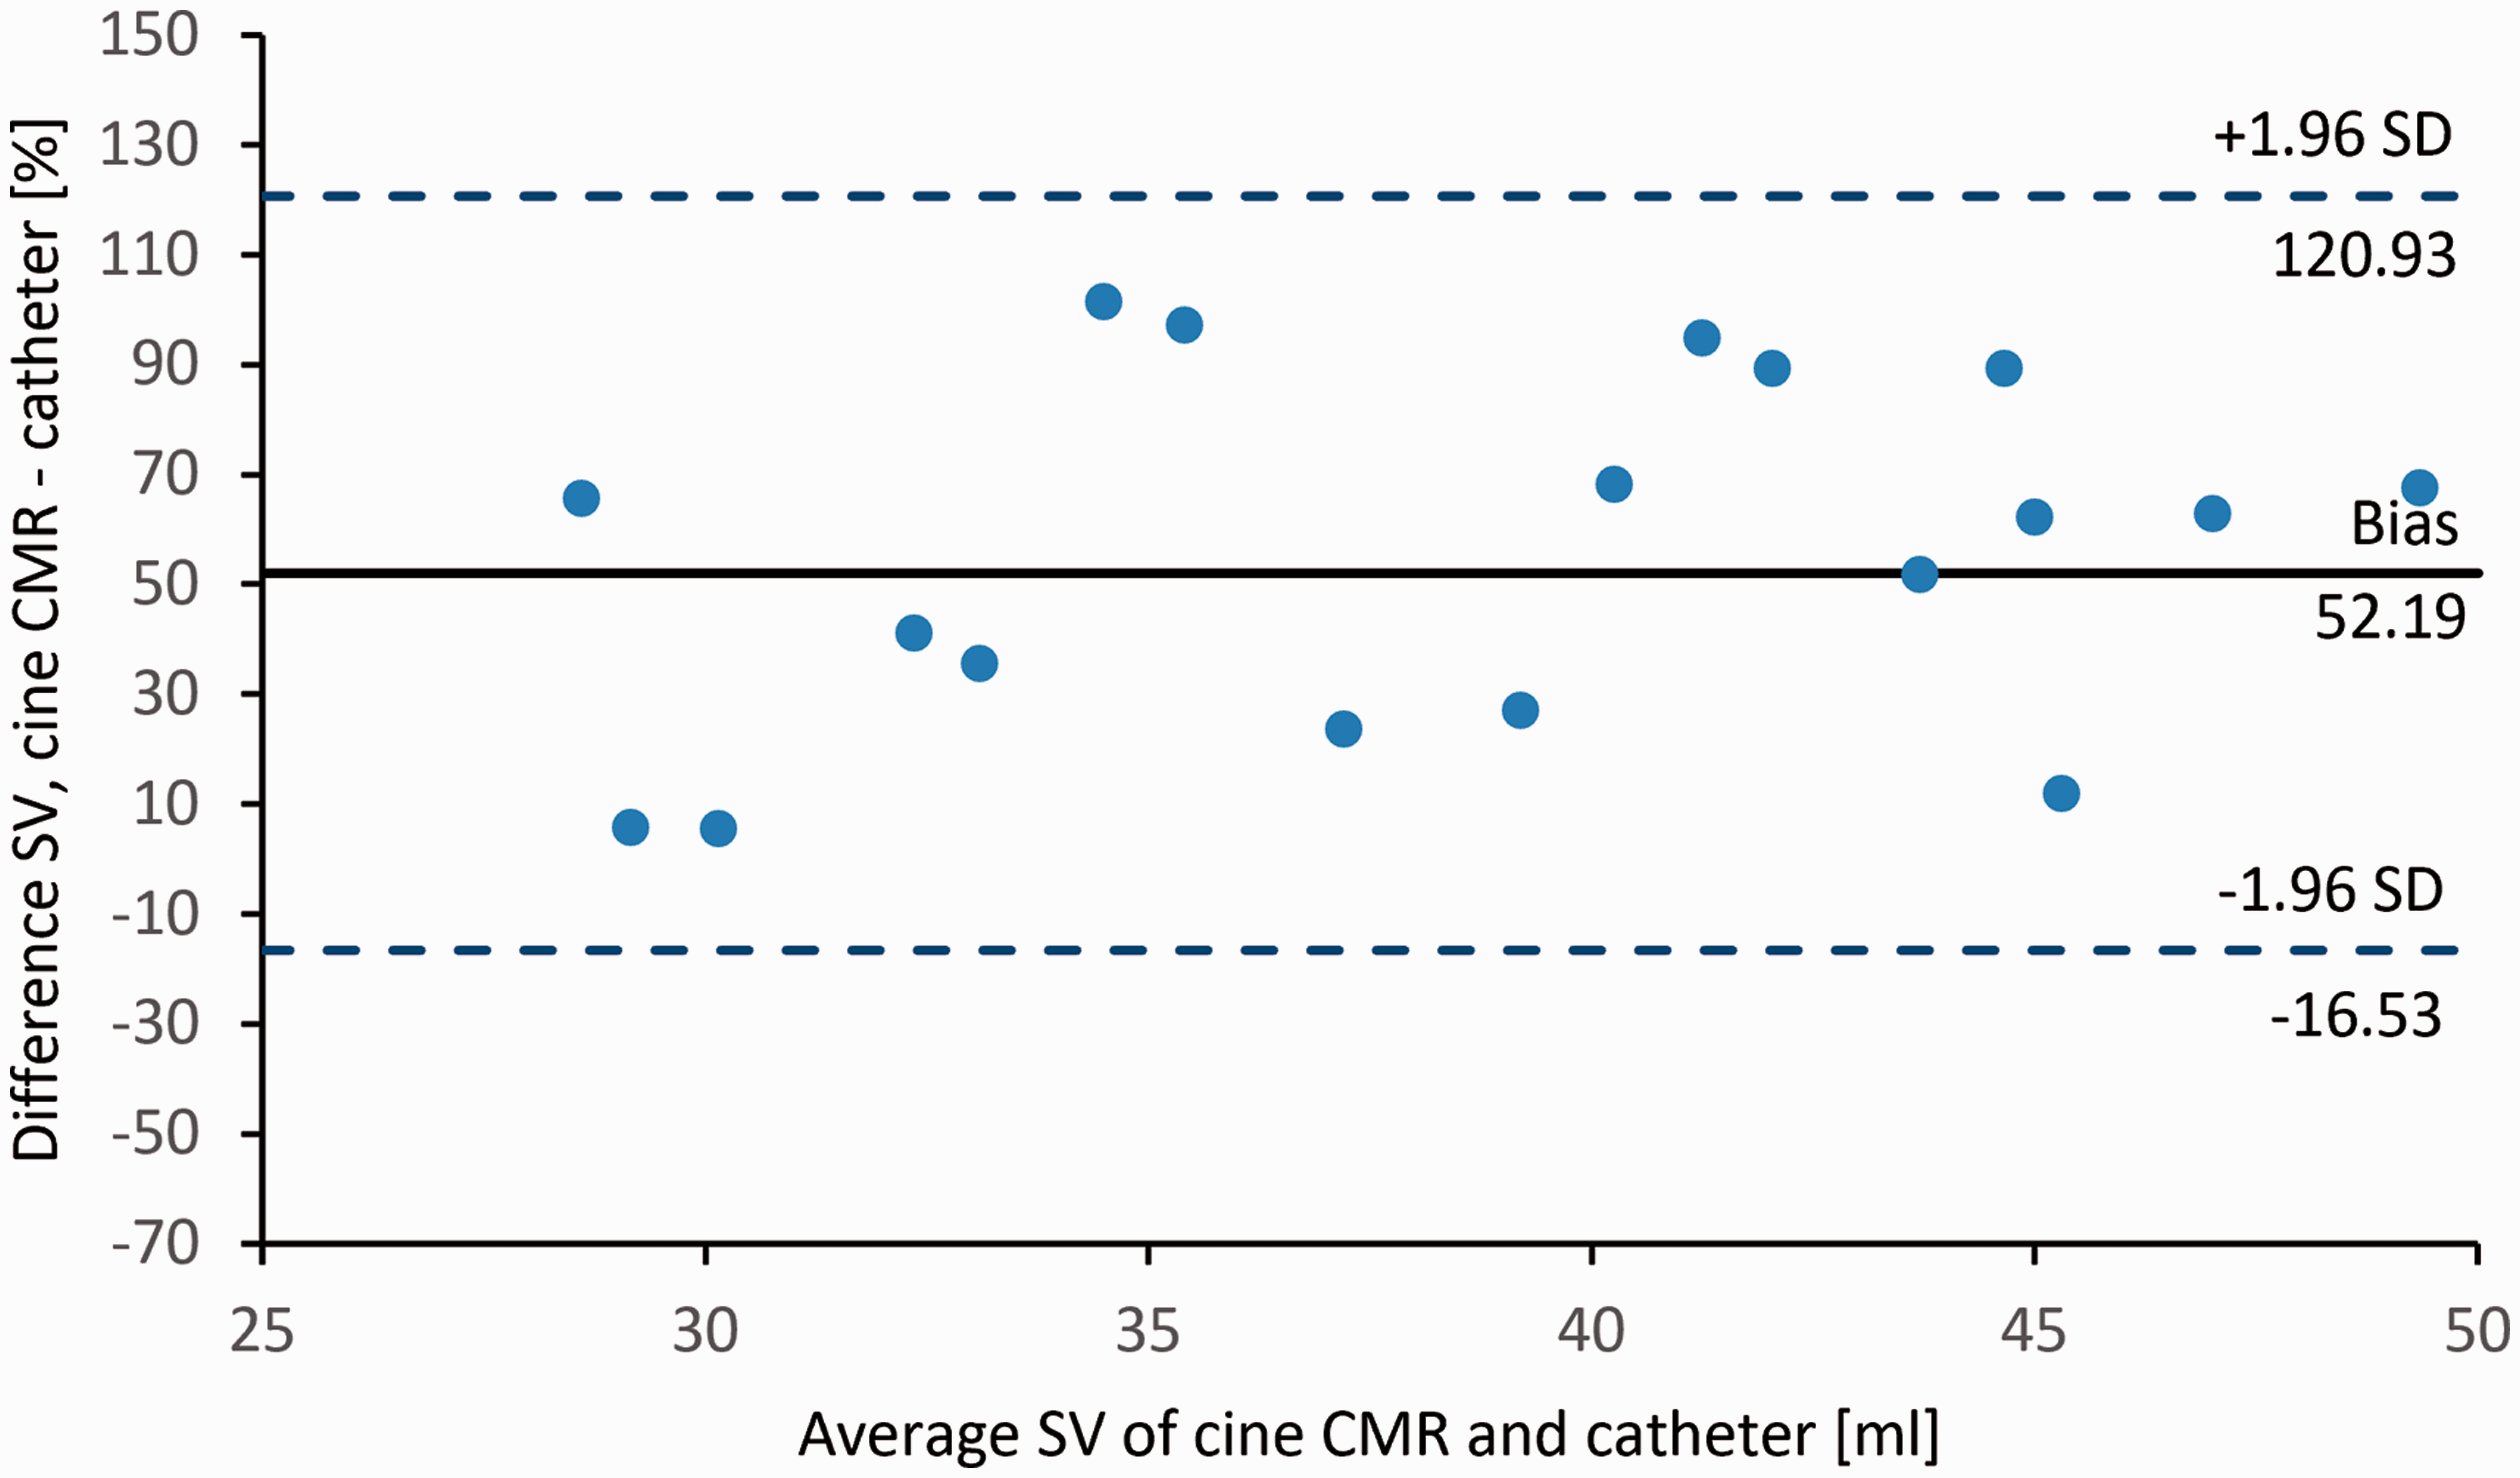
Bland–Altman plot of the difference in SV calculated by use of cine CMR and conductive catheter against mean SV measured by use of the two methods.
The measurements of SV differed significantly between PC CMR and conductive catheter (P < 0.001). The bias between RV SV measured by PC MR and conductance catheter was 27.76 mL, with a precision of 20.14–35.26 mL. The upper limit of agreement was 59.26 mL (precision = 46.16–72.48 mL) and the lower limit of agreement was –3.84 mL (precision = –16.83–9.24 mL) (Fig. 5).
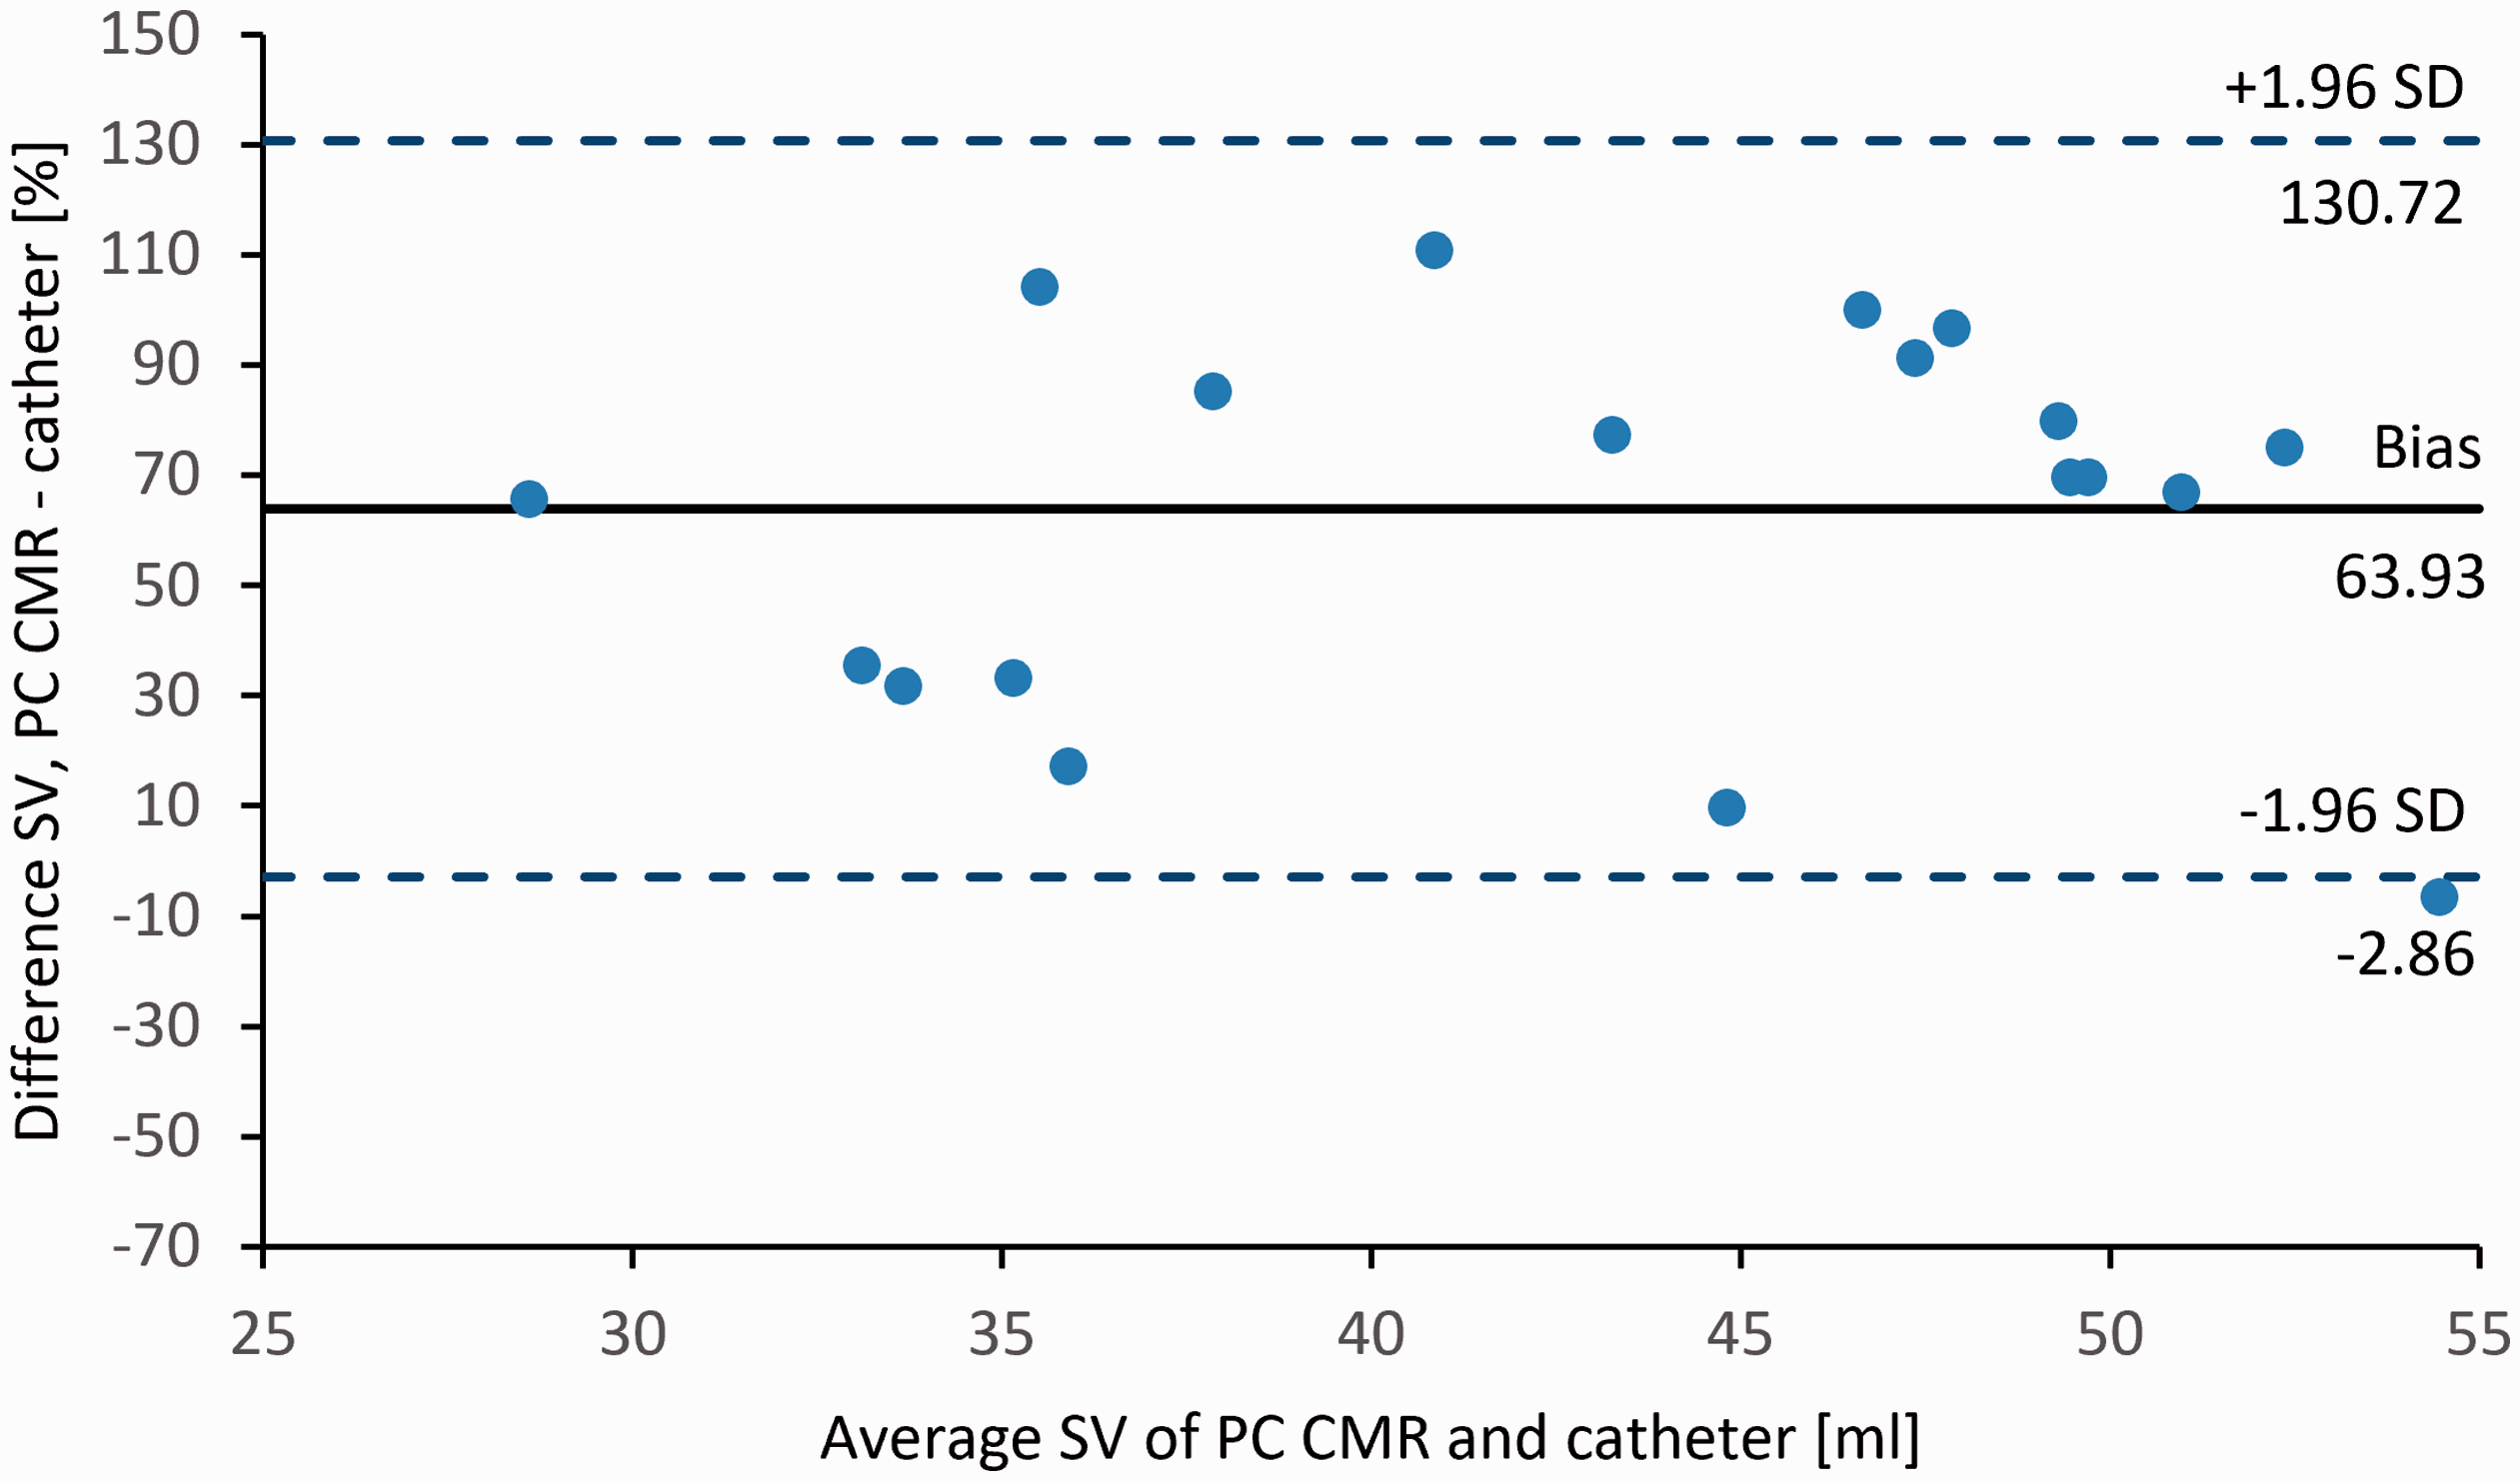
Bland–Altman plot of the difference in SV calculated by use of PC CMR conductive catheter against mean SV measured by use of the two methods.
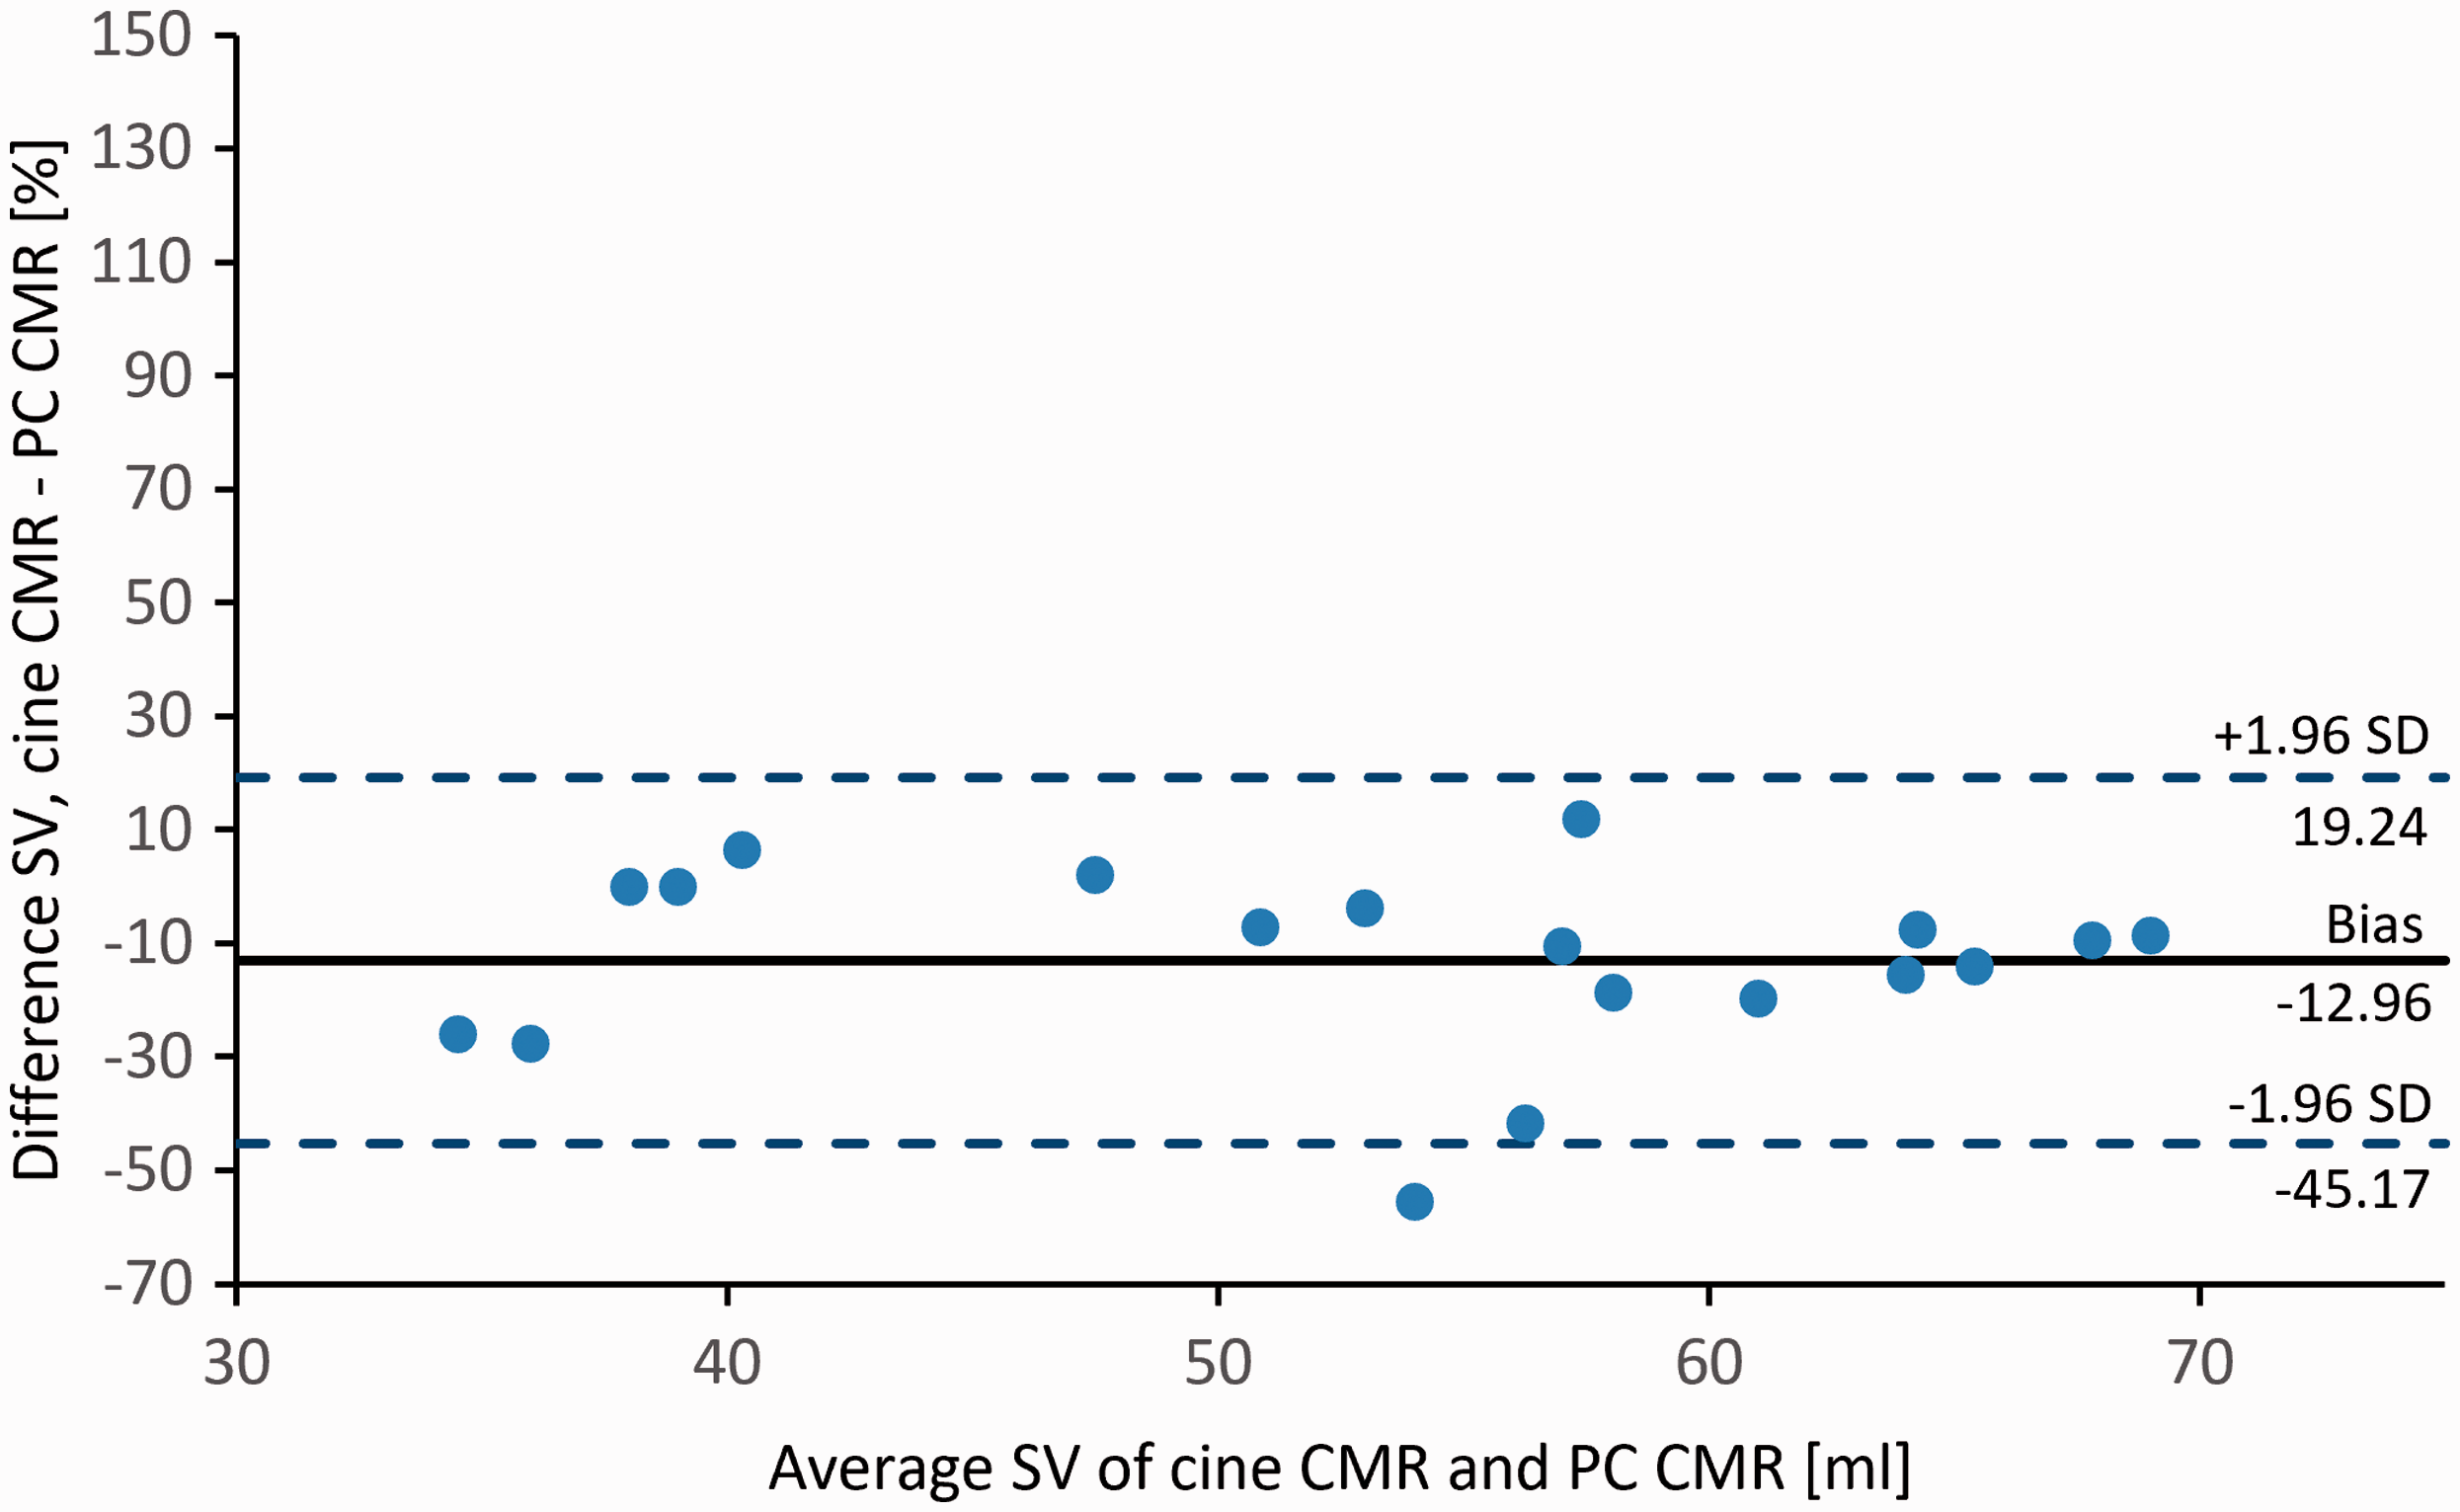
However, comparing the SV derived by cine CMR with those derived by PC CMR flow measurement in the PA at the banding site, a strong correlation (r = 0.79) was found for the two different approaches. The bias was −7.01 mL, with a precision of −11.08 to −2.93 mL; the upper limit of agreement was 9.98 mL (precision = 4.29–15.70 mL), and the lower limit of agreement was −24.01 mL (precision = –29.72 to −18.31 mL) (Fig. 6).
The ICC was 0.098 for SV calculated from conductance catheter, cine CMR, and PC CMR measurements, but 0.639 for SV yielded from cine CMR and PC CMR measurements.
Discussion
This study demonstrated that RV volumes derived from cine CMR measurements differed significantly from those obtained invasively by conductance catheter. There was poor agreement between the two methods regarding EDV, ESV, and SV measurements. On the other hand, cine CMR- and PC CMR-derived SV measurements agreed well. Higher values were observed for RV volumes with cine CMR than with the conductance catheter; thus, the conductance catheter method underestimates RV volumes compared to CMR. We assume that the discrepancies between the two methods may be inherent to the conductance catheter measurements since good agreement was found for PC CMR and cine CMR SV measurements, but not for PC CMR and conductance catheter-based SV results. This should be considered when comparing measurement results of these two methods in clinical evaluation and in experimental studies.
Although the conductance catheter’s particular advantage over non-invasive methods is its capacity to measure dynamic ventricular volumes during the cardiac cycle and couple this simultaneously with pressures, conductance catheter has its limitations (14). One reason why conductance catheter measurements are supposed to be inaccurate is that the RV shape is modelled as a symmetric conus, where in reality it has a more complex anatomy and contraction pattern. Absolute volume determination depends on accurately calculating the volume through catheter, which can be unreliable in the thin-walled RV and, due to the close proximity of the RV to mediastinal structures, decreases the conductance signal-to-noise ratio (15, 16). Moreover, for absolute volume measurements the conductance catheter must be calibrated with a reference method. Often this reference method is, as in this study, a thermodilution method. Herberg et al. measured SV with transpulmonary thermodilution and found a high bias with wide limits of agreement compared to CMR (17). Comparing 3D echocardiography-derived volume measurements with CMR data they found that 3D echocardiography correlated better with CMR data than transpulmonary thermodilution measurements and showed smaller bias and limits of agreement. As a consequence, they decided to calibrate the conductance catheter with volumes obtained by 3D echocardiography which were closer to the CMR data. On the other hand, one experimental study on rats with monocrotaline-induced pulmonary arterial hypertension found an excellent correlation of cardiac output between high-frequency echocardiography and high-field-strength CMR and demonstrated that both correlated well with high-fidelity catheter (18). Volume through conductance catheter also varies during the cardiac cycle, although the use of dual field excitation catheters can reduce this effect (16, 19). Together, these factors diminish the accuracy of volume measurements through conductance catheter (20). One study showed that a relative change in volume (i.e. SV) remains unbiased by the volume through catheter (21), an observation that we could not confirm for SV. Regardless, we found that EF calculated from conductive catheter data did not differ significantly from cine CMR.
It has also been shown that PC CMR is more accurate than the Fick method in measuring pulmonary blood flow (22). However, several limitations have to be considered for PC CMR-based flow measurements. In patients with either arrhythmias during acquisition or turbulent blood flow, measurements may be inaccurate. Moreover, if not actively suppressed by dedicated steps, eddy current induction can distort measurement results. Additionally, the object under consideration must be placed exactly in the isocenter of the scanner to get reliable results. Furthermore, the PC CMR sequence requires an estimation of real blood flow velocity a priori to avoid frequency aliasing. This estimation can now be quantified by applying a frequency scout sequence. Finally, there are two ways to acquire flow data: a breath-hold technique and a free breathing technique, both having their specific limitations (23).
Regarding cine CMR volume measurements based on Simpson’s method, the problem of the basal slice (at the tricuspid annulus) must be taken into account, if older volume evaluation tools are applied (3). Cine CMR volumetry also requires that data are acquired over several heartbeats and does not assess beat-to-beat variability. Arrhythmias and motion artifacts may therefore strongly influence measurement accuracy. In our study, the difference between cine CMR and PC CMR SV measurements was 13% and the ICC was moderate with 0.639. We assume that cine CMR measurements are mainly responsible for these discrepancies for the reasons mentioned above, and because the endocardial contours of the RV are more difficult to draw than for example those of the LV, and thus more prone to measurement errors.
A limitation of this study is that the time gap between CMR examination and final invasive pressure-volume examinations was in the range of 5–8 days in our experiments. It is known that there can be considerable spontaneous variations in RV functional parameters even over a short period of time (24, 25). Simultaneous invasive measurements of pressure, PC CMR flow velocities, and volumes should provide more reliable results (26, 27).
In conclusion, RV volumes derived from cine CMR differed significantly from those obtained invasively by conductance catheter. The conductance catheter method underestimated RV volumes compared to cine CMR. This has important implications when comparing measurement results obtained by these methods. Good correlations were found between the PC CMR and cine MR-derived SV measurement results, but not for PC CMR and conductance catheter-based measurements. We conclude that the main cause of this lack of agreement must be ascribed to the conductance catheter measurements, where the thermodilution method is used to calibrate for RV volumes. Therefore, to improve precision of conductance catheter measurements, calibration for RV volumes by CMR would be an option.
Footnotes
Declaration of conflicting interests
The author(s) declared no potential conflicts of interest with respect to the research, authorship, and/or publication of this article.
Funding
The author(s) received no financial support for the research, authorship, and/or publication of this article.