
Abstract
Background
Early and accurate detection of liver fibrosis are important for clinical treatment.
Purpose
To compare the diagnostic accuracy of liver diffusion kurtosis imaging (DKI) and conventional diffusion-weighted imaging (cDWI) in differentiating patients with mild and substantial fibrosis from normal individuals.
Material and Methods
Twenty-seven healthy volunteers with no fibrosis (S0) and 45 patients with mild (S1) or substantial (S2) liver fibrosis underwent DWI with multiple b-values. Liver mean apparent diffusion (MD) and mean kurtosis (MK) values derived from DKI and apparent diffusion coefficient (ADC) derived from cDWI were measured and compared. Their discriminative abilities were analyzed and compared by receiver operating characteristic (ROC) curve analysis.
Results
Significant differences in MD and ADC values were found between groups (P < 0.05). MD value was statistically different between S0 and S1 (P = 0.028) and S0 and S2 (P = 0.005). ADC value was statistically different between S0 and S2 (P = 0.012). MK value was similar between groups (P = 0.646). MD and ADC values significantly correlated with fibrosis stages (rs = −0.668, −0.341; P < 0.01). MK values had no correlation with fibrosis stages (rs = 0.180; P = 0.130). The area under ROC curves (AUC) for MD and ADC was 0.937 and 0.707 for characterization of S1–2 and 0.817 and 0.658 for S2, respectively. MD performed better than ADC for characterization of S1–2 and S2 (P < 0.05).
Conclusion
Differentiating patients with mild or substantial fibrosis from normal individuals is feasible using DKI, which performs better than cDWI.
Introduction
Liver fibrosis is a common pathology that occurs in almost all cases of chronic liver disease. Left untreated, it can progress to cirrhosis, which substantially increases the risk for the occurrence of hepatocellular carcinoma (1,2). Originally considered to be irreversible, hepatic fibrosis is now regarded as a dynamic process with the potential for regression (2,3). Thus, early and accurate detection of liver fibrosis are important for clinical treatment. Liver biopsy is currently the standard of reference for the diagnosis and staging of liver fibrosis. However, it is an invasive technique and there is the possibility of sampling error due to the uneven distribution of fibrosis within the liver (4,5). Currently, many non-invasive methods have been attempted to assess liver fibrosis, such as serum markers and several imaging techniques. However, serum markers might be influenced by many factors and the specificity is low (6). Transient elastography (TE) is limited to steatitis, inflammation, and patients who are obese or have narrow intercostal spaces and ascites (7–9). Perfusion computed tomography (CT) and dynamic or liver-specific contrast-enhanced magnetic resonance imaging (MRI) need the use of contrast agents. In addition, CT perfusion is limited with amount of radiation exposure (10–15). MR elastography is limited to high iron overload, portal hypertension, inflammatory activity, and the need for dedicated installation equipment (16–19). Further, conventional diffusion-weighted imaging (cDWI) showed only a limited ability to distinguish each stage of liver fibrosis (20–23).
Diffusion kurtosis imaging (DKI) is an advanced DWI model that quantifies the non-Gaussian behavior of diffusion by using high b values and kurtosis analysis. Previous studies of DKI in animal models and clinical patients have reported the possibility of staging liver fibrosis, but results regarding whether DKI provided similar or better diagnostic performance compared to cDWI were inconsistent (24–29). In addition, the diagnostic performance of mean apparent diffusion (MD) and mean kurtosis (MK) derived from DKI for liver fibrosis was different, especially MK (24–29). More studies are needed to investigate the discriminative ability of DKI for liver fibrosis in clinical patients. The clinical practice guidelines on the management of hepatitis advocates that patients with a mild form of the disease can be monitored, but those with substantial or advanced fibrosis (≥S2) should be treated immediately (2,30). The ability of DKI to differentiate patients with mild (S1) or substantial (S2) fibrosis from normal individuals remains to be shown. Therefore, the purpose of our study was to prospectively assess the utility of DKI for differentiating patients with S1 and S2 fibrosis from healthy controls and compare the diagnostic accuracy with cDWI.
Material and Methods
Participants
This prospective study was approved by our institutional review board and written informed consent from all patients was obtained before the MR examinations.
From January 2015 to March 2018, a total of 30 healthy volunteers and 75 patients suspected of having liver fibrosis underwent DWI with four b values. Healthy volunteers were from the physical examination department and their inclusion criteria were: (i) good health status according to their medical history; (ii) negative findings for chronic viral infection by the hepatitis B virus (HBV) or hepatitis C virus (HCV); (iii) liver function-related laboratory data within normal range; and (iv) no MRI signs of chronic liver disease or fatty liver. Patients suspected of having fibrosis were from the hepatology clinic and their inclusion criteria were: (i) serologic evidence of HBV or HCV infection; (ii) previous repeat abnormal liver function tests; (iii) no evidence of other causes of chronic liver disease, such as drug abuse and autoimmune disease; and (iv) S1 or S2 fibrosis confirmed by liver biopsy for pre-therapeutic evaluation. Exclusion criteria for all recruited individuals were: (i) contraindications to undergoing MRI; (ii) imaging evidence of multiple or large liver lesions, such as cysts or tumors; (iii) poor image quality; (iv) advanced fibrosis (≥S3) confirmed by liver biopsy; or (v) a hepatic fat fraction derived from mDIXON images or pathological results >5% (31).
Finally, 45 patients with S1 or S2 fibrosis (23 patients were excluded because they showed no pathologic results, three had liver tumors in the right lobe, and one because of steatosis score 2, three with insufficient image quality) and 27 controls (two patients were excluded owing to insufficient image quality and one because their fat fraction derived from mDIXON imaging was >5%) were recruited in this study. For ethical reasons, healthy volunteers did not undergo liver biopsy. All controls were regarded as having no fibrosis (S0). Demographic data are summarized in Table 1.
Demographic data of healthy controls and patients with liver fibrosis.
*Data are the means ± standard deviation, and data in parentheses are the range.
†There are no significant differences among the groups (all P > 0.05).
BMI, body mass index; HBV, hepatitis B virus; HCV, hepatitis C virus; S0, healthy controls; S1, patients with mild fibrosis; S2, patients with substantial fibrosis.
Histopathologic analysis
An ultrasound-guided percutaneous liver biopsy of the right lobe was performed within three days following MRI. An experienced hepatic pathologist (JL, with five years of experience in liver pathology) who was blinded to the imaging findings reviewed the liver specimen and staged the extent of the fibrosis using the METAVIR scoring system. The degree of fibrosis was graded on a five-point scale from 0 to 4 (S0 = no fibrosis, S1 = portal fibrosis without septa, S2 = portal fibrosis with few septa, S3 = numerous septa without cirrhosis, S4 = cirrhosis) (32). Taking into consideration the possibility of hepatic steatosis on ADC values, steatosis was also evaluated. Steatosis was scored as the fraction of hepatocytes presenting lipid droplets on a scale of 0–3: 0 = <5% of hepatocytes; 1 = 5–33% of hepatocytes; 2 = 34–66% of hepatocytes; and 3 = >67% of hepatocytes (33).
MR examination
MRI was performed on a 3.0-T MRI system (Ingenia; Philips Healthcare, Best, the Netherlands) with a 36-channel torso coil. Respiratory triggering (respiratory belt) was used to minimize respiratory motion artifacts, which allowed the patient to breathe freely during image acquisition in the supine position. Volume shimming was used to minimize B0 inhomogeneity.
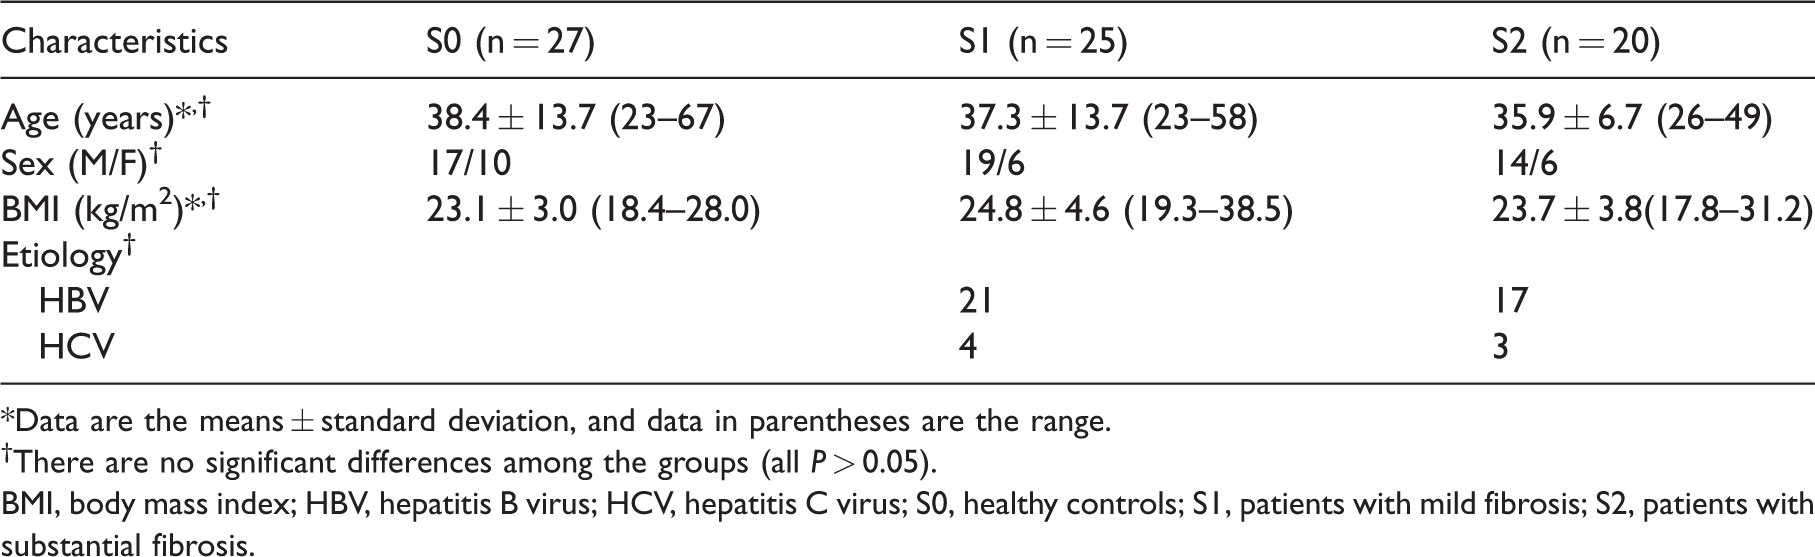
DW images were acquired using a respiratory-triggered fat-suppressed single-shot echo-planar sequence. The imaging parameters were as follows: repetition time (TR)/echo time (TE) = 2000/67 ms; number of signals averaged (NSA) = 2; diffusion directions = 3; section thickness = 6 mm; no intersection gap; field of view (FOV) = 380 × 304 mm; resolution = 3.02 × 3.08 × 6 mm; parallel imaging factor = 2.2; b values of 0, 1000, 1500, and 2000 s/mm2 (34); acquisition time = approximately 10 min (Fig. 1).
Example of diffusion weighted imaging with different b values: b = 0 (a), 1000 (b), 1500 (c), 2000 s/mm2 (d).
For normal individuals, a six-echo variant of the mDIXON sequence with single breath-hold (TR/TE1 = 4.2/0.95 ms; six echoes with delta TE = 0.8 ms; fractional anisotropy = 3°; FOV = 300 × 360 mm; resolution = 2.5 × 2.5 × 3.0 mm; slice thickness = 6 mm; slice number = 40; scan time = 10.2; NSA = 2; and sensitivity encoding [SENSE] factor = 2) were also acquired for the entire liver, to calculate the fat fraction.
Image analysis
MRI data was analyzed using post-processing software performed in a proprietary programming environment (PRIDE; Philips Medical Systems, Best, The Netherlands).
The MD and MK values were calculated by kurtosis fitting of four b values according to the following equation (35):

Two b values were usually used when performing cDWI in clinical practice. Thus, the ADC was calculated by monoexponential fitting of two b values (0, 1000 s/mm2) according to the following equation:

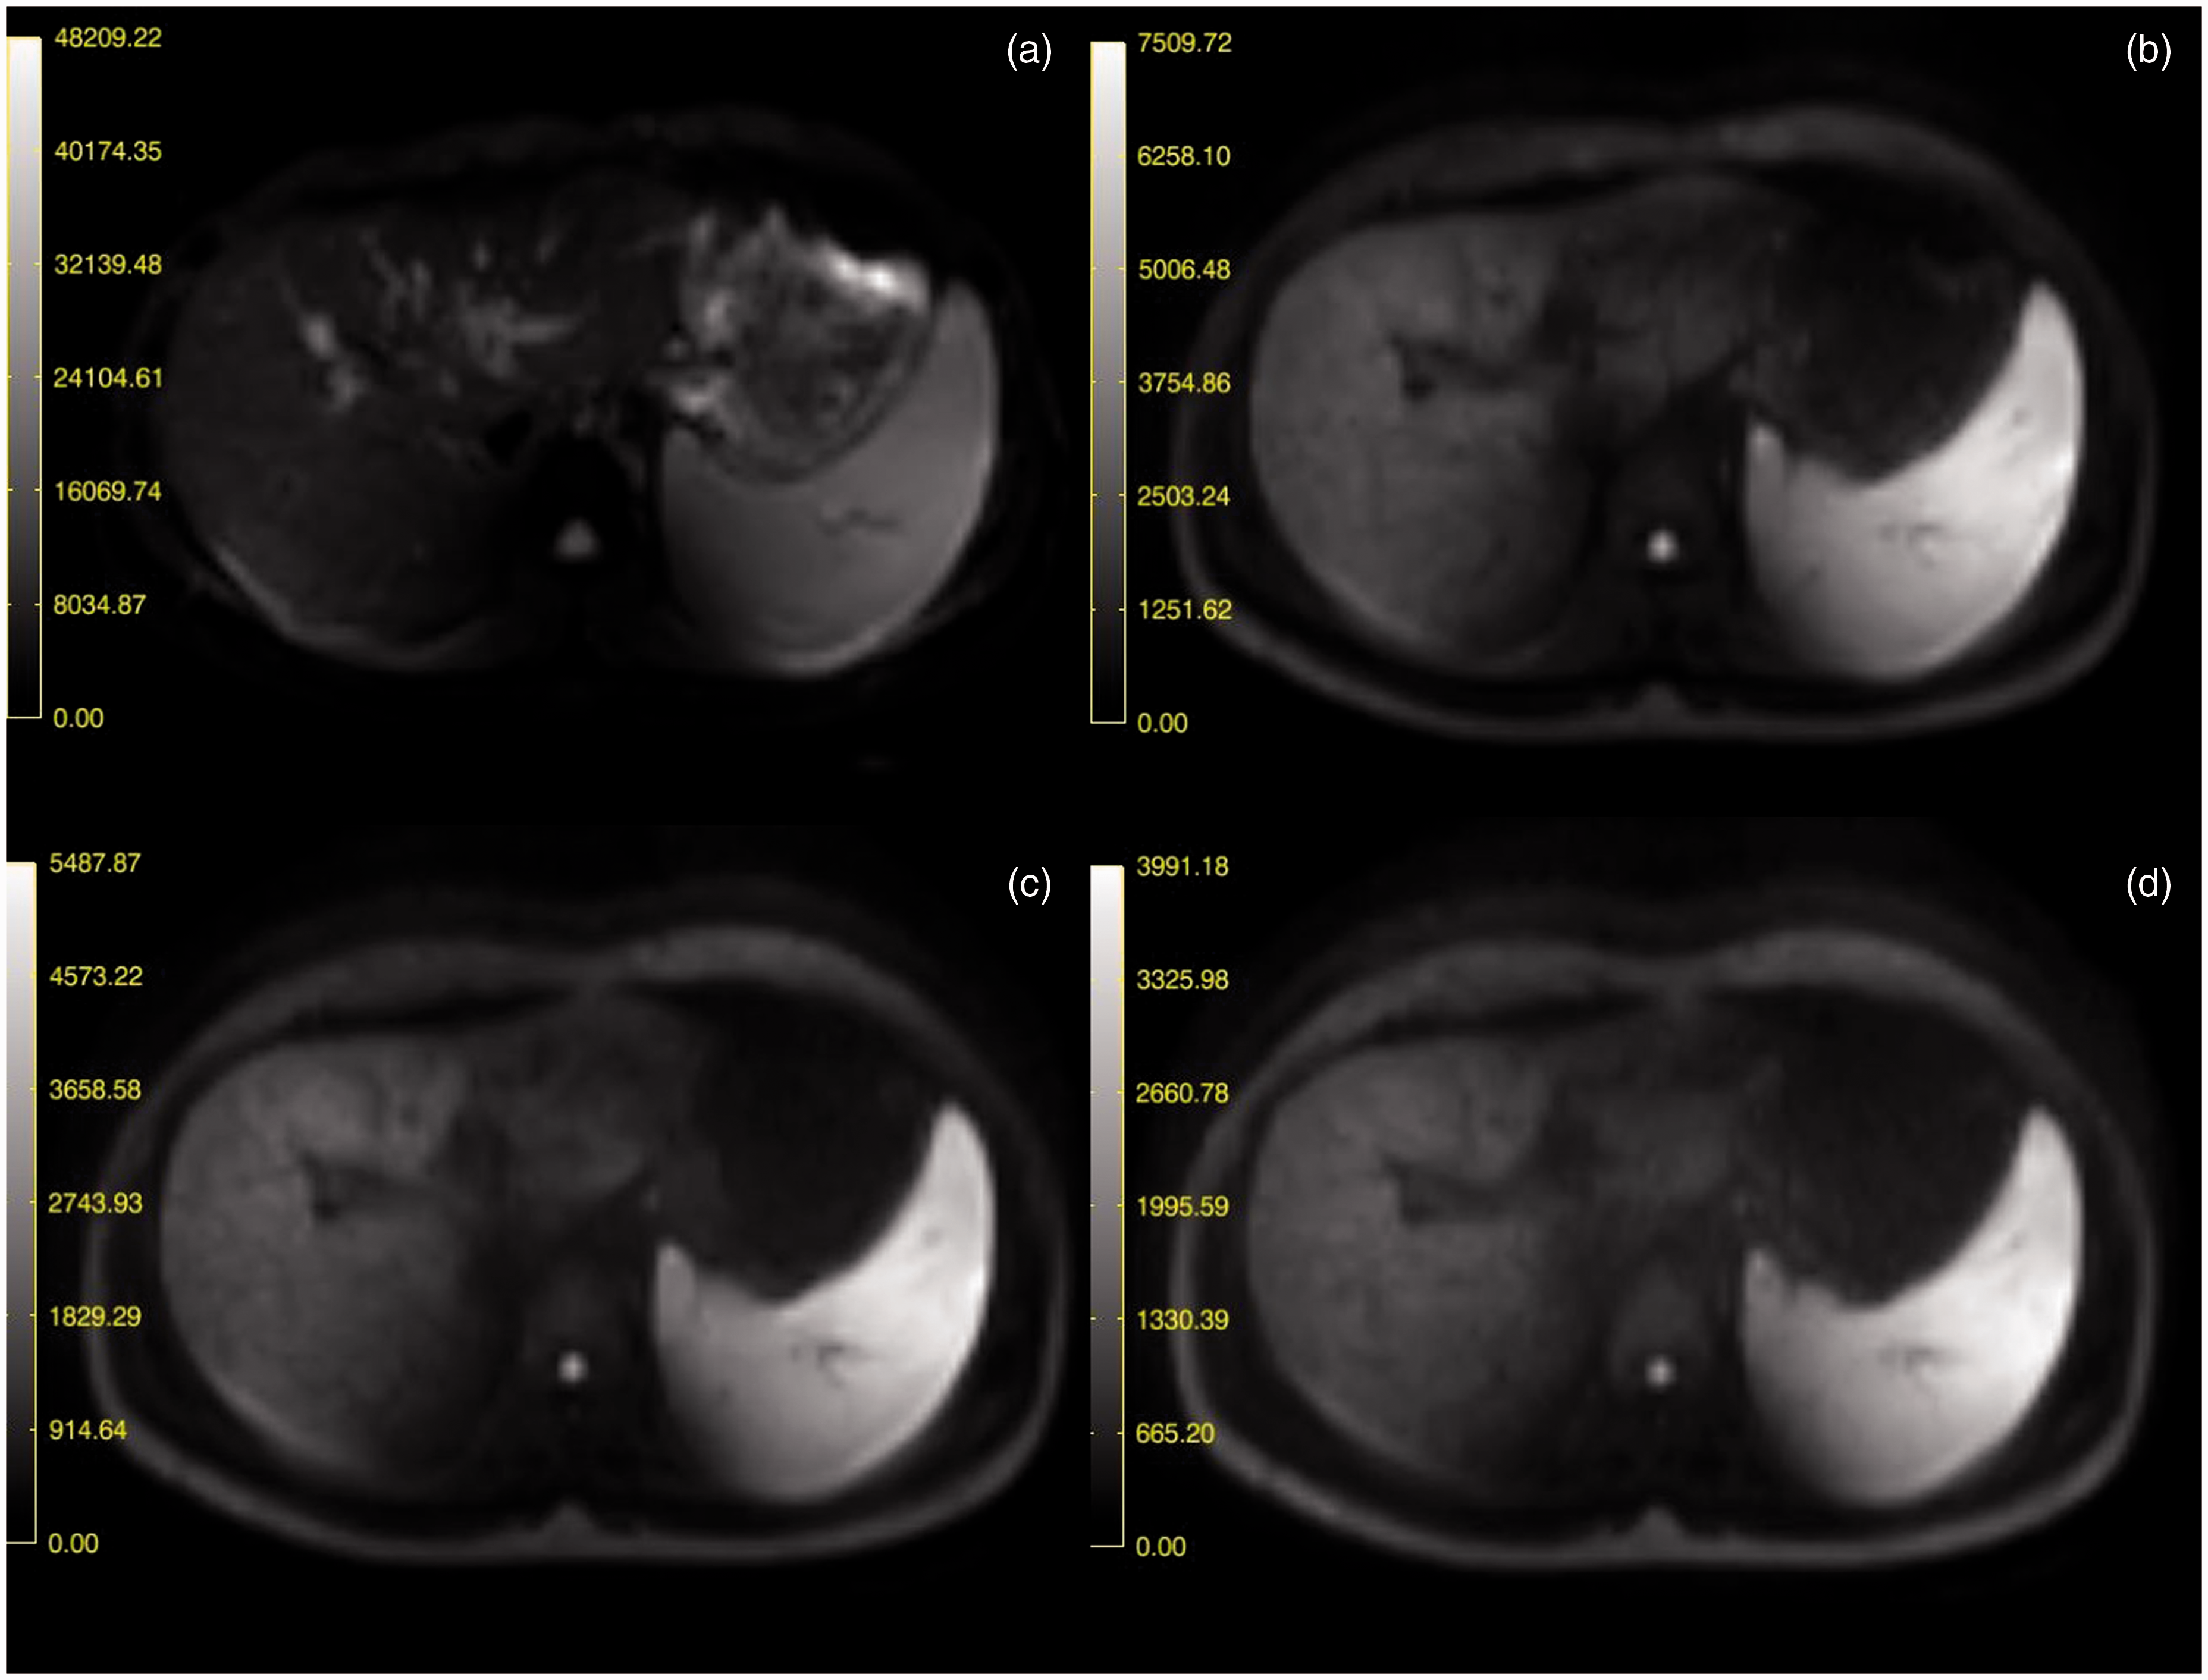
Two radiologists (SSX and YC with 5 and 11 years of experience in abdominal imaging, respectively) postprocessed the raw data and then made quantitative measurements on each parameter image on the same postprocessing workstation independently. Both readers were blinded to the group of patients and pathological results. The upper, middle, and lower liver slices were chosen. In order to avoid error from cardiac motion, six regions of interest (ROI) were positioned in the right liver lobe to measure the MD, MK, and ADC of liver parenchyma, avoiding large vessels, lesions, artifacts, and the border of the liver. The location and size of each ROI were the same in different parametric maps (Fig. 2). The mean size of all ROI was 25 pixels ± 2, with a range of 20–28 pixels. The mean values of MD, MK, and ADC were obtained by averaging all ROI measurements.
Examples of placement of regions of interest (ROIs) on MD map (a), MK map (b), and ADC map (c).
Statistical analysis
The one-sample Kolmogorov–Smirnov test was used to test the normal distribution of quantitative variables. The age, body mass index, MD, MK, and ADC values were compared between patients with S1 and S2 fibrosis and healthy controls using a one-way analysis of variance followed by a Tukey test (normal distribution and equal variances) or a Kruskal–Wallis followed by a Nemenyi test (non-normal distribution or unequal variances). The correlation between pathological results and imaging parameters were analyzed using Spearman’s rank correlation test. The accuracy of MD, MK, or ADC for characterization of the fibrosis stage was evaluated by calculating sensitivity, specificity, positive predictive values, negative predictive values, and receiver operative characteristic (ROC) curves. The area under the ROC curve (AUC) was compared with DeLong et al.’s testing. Inter-observer reproducibility of MD, MK, and ADC measurements were assessed using the intraclass correlation coefficient (ICC) as poor (< 0.04), fair to moderate (0.4-0.75), and good (>0.75). All statistical tests were two sided; a P value ≤0.05 or less was considered to indicate a significant difference. Statistical analyses were performed using the SPSS software for Windows, version 21.0 (SPSS, IL, USA) and Medcalc (version 11.2; 2011 MedCalc Software bvba, Mariakerke, Belgium).
Results
Diffusion parameters in healthy controls and patients with mild or substantial fibrosis
The inter-observer reproducibility for the MD, MK, and ADC measurements were good (ICC = 0.894, 0.908, 0.912, respectively).
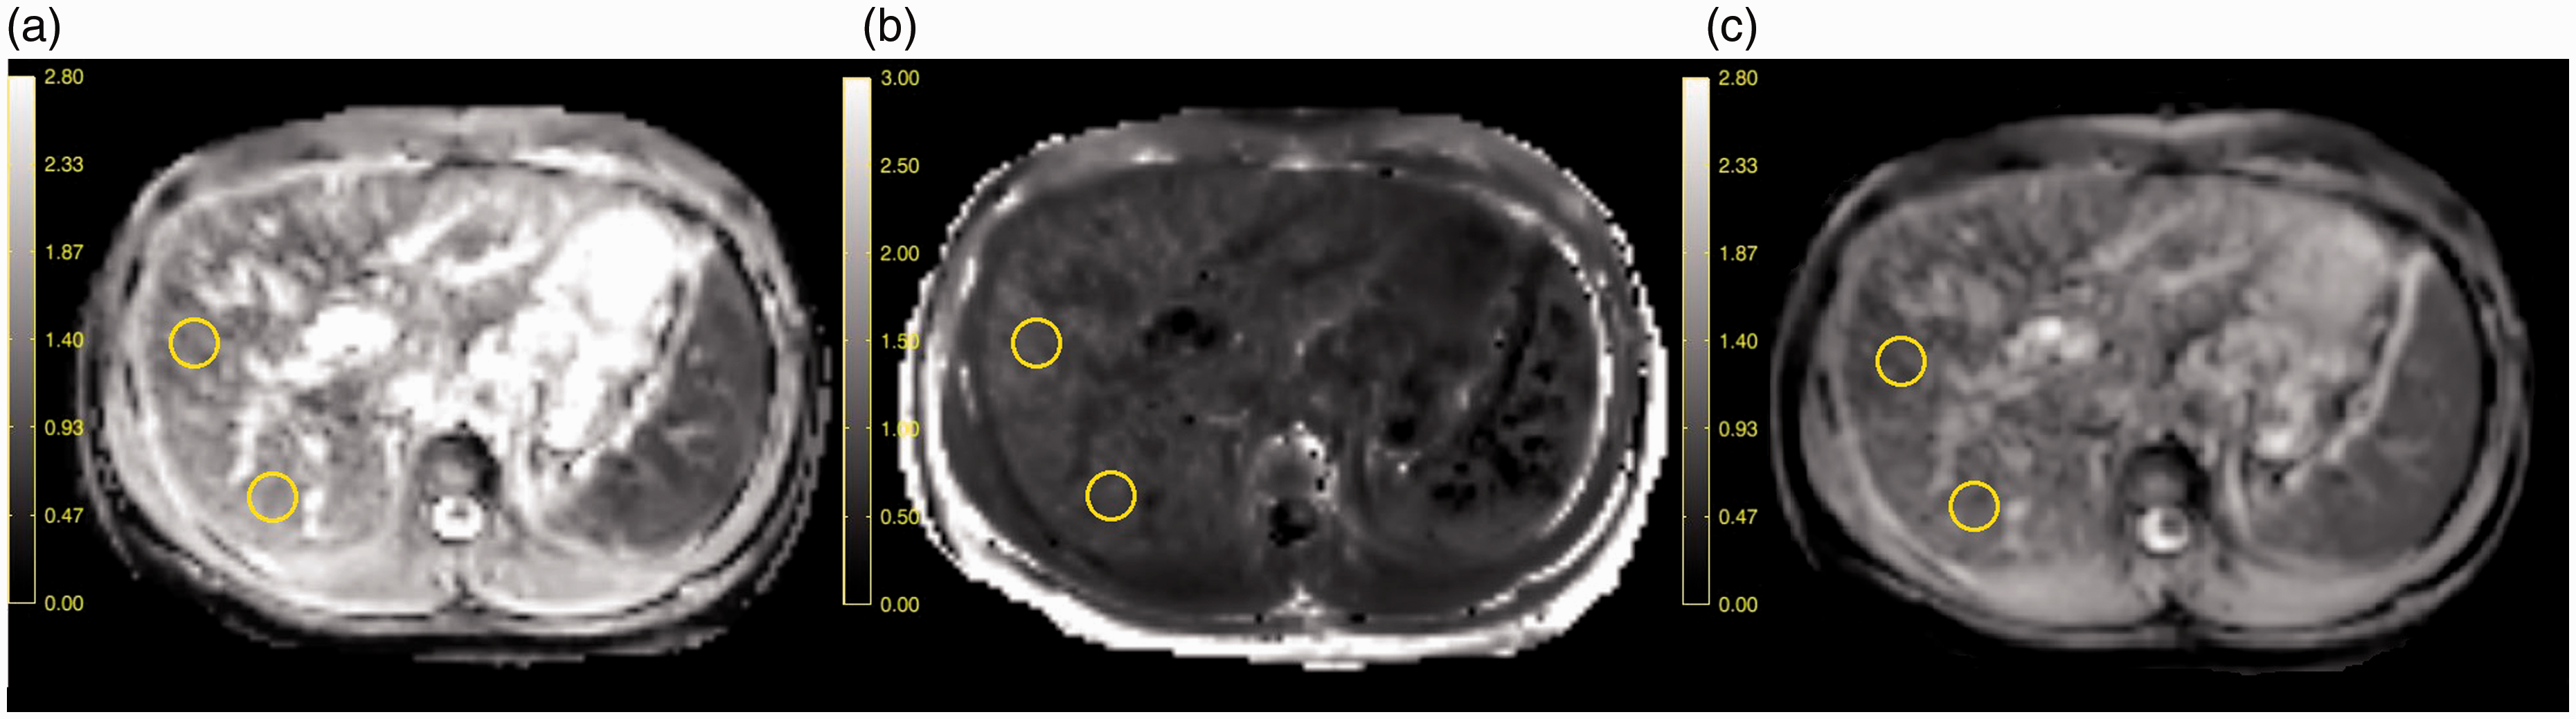
The MD (P < 0.001) and ADC (P = 0.013) values decreased as the fibrotic stage increased and had significant differences between healthy controls and patients with S1 and S2 fibrosis. Moreover, MD values were statistically different between S0 and S1 (P = 0.028) and S0 and S2 (P = 0.005), and there was no significant difference between S1 and S2 (P = 0.452). The ADC values were statistically different between S0 and S2 (P = 0.012), and there was no significant difference between S0 and S1 (P = 0.216) and S1 and S2 (P = 0.653). There was no significant difference in the MK values between healthy controls and patients with S1 or S2 fibrosis (all P > 0.005) (Table 2, Fig. 3). Color-coded MD, MK, and ADC maps that depict typical cases of S0, S1 and S2 fibrosis are shown in Fig. 4.
MD, MK, and ADC distribution in healthy controls and those with mild and substantial fibrosis.
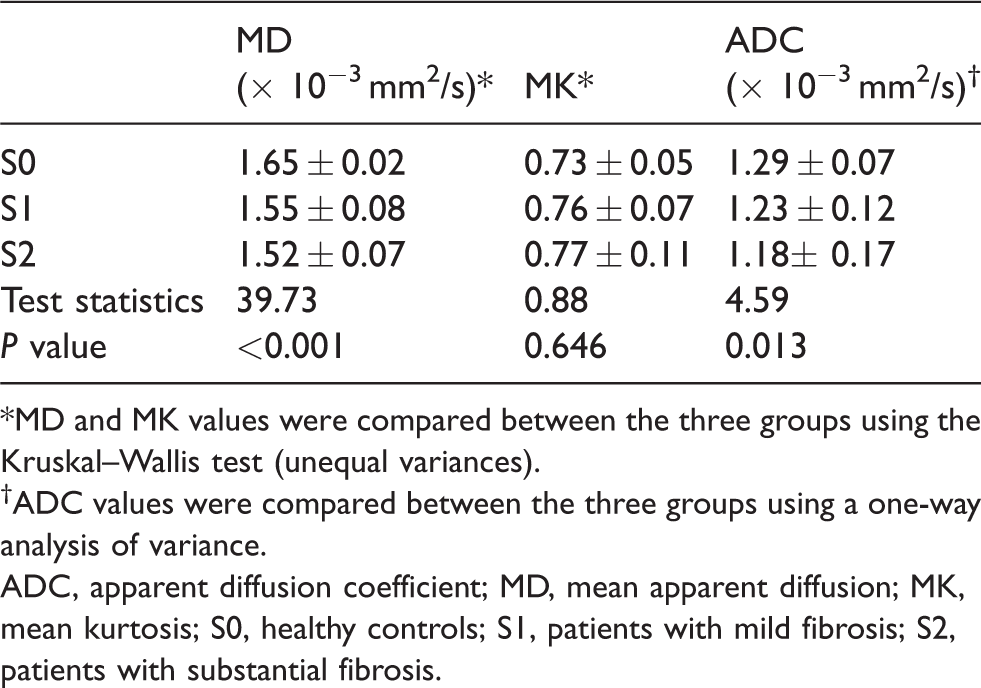
*MD and MK values were compared between the three groups using the Kruskal–Wallis test (unequal variances).
†ADC values were compared between the three groups using a one-way analysis of variance.
ADC, apparent diffusion coefficient; MD, mean apparent diffusion; MK, mean kurtosis; S0, healthy controls; S1, patients with mild fibrosis; S2, patients with substantial fibrosis.
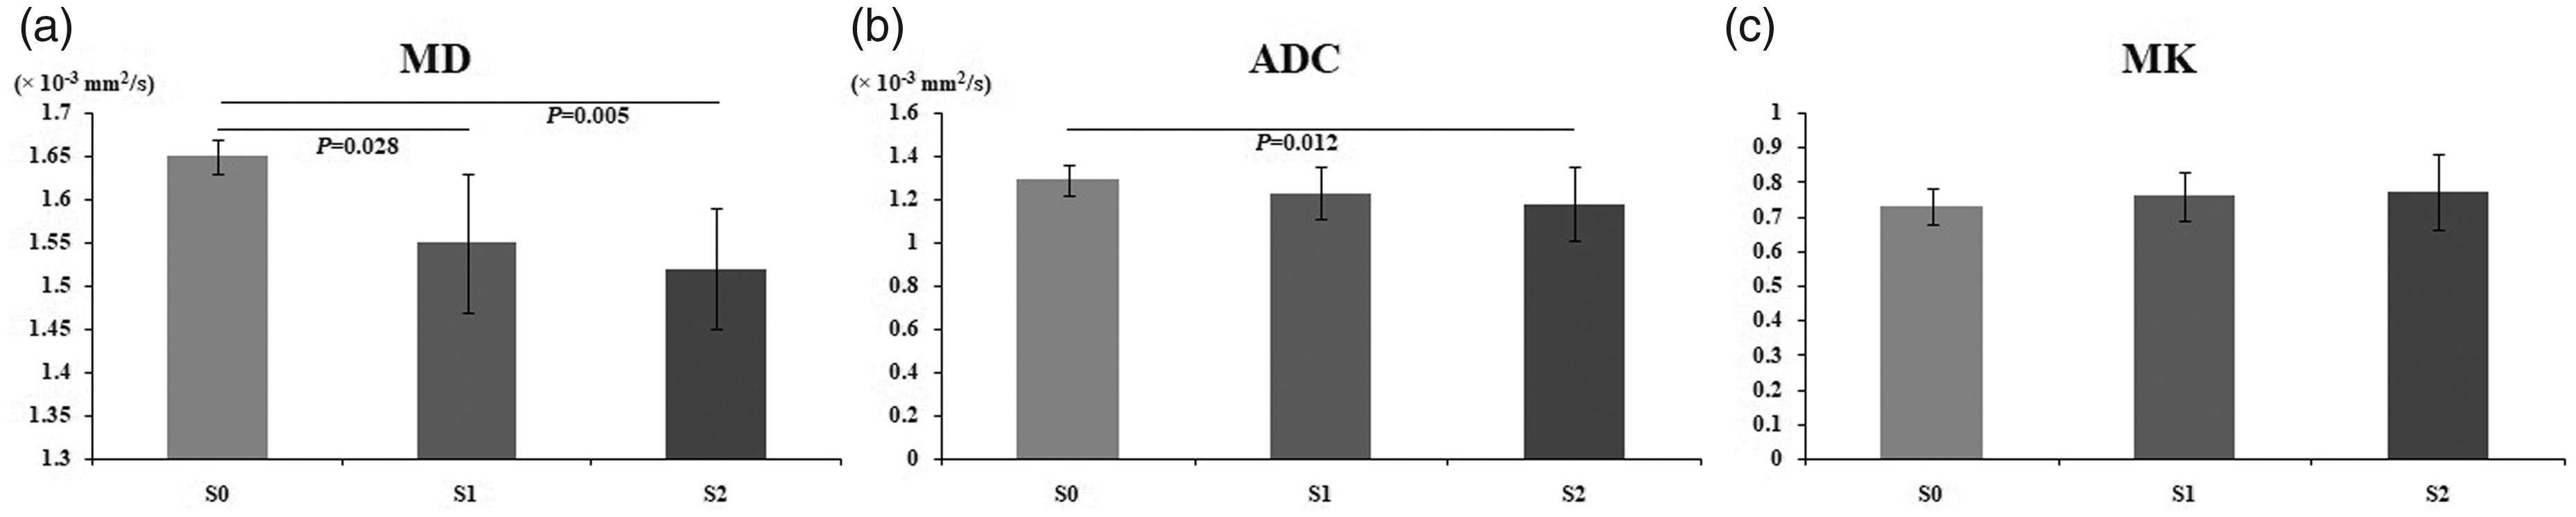
Histogram of MD, ADC, and MK in healthy controls (S0) and patients with mild (S1) and substantial fibrosis (S2). MD and ADC decreased as the fibrosis advanced. Both MD and ADC were different between S0 and S2 (all P < 0.05), and MD was also different between S0 and S1 (P = 0.028).
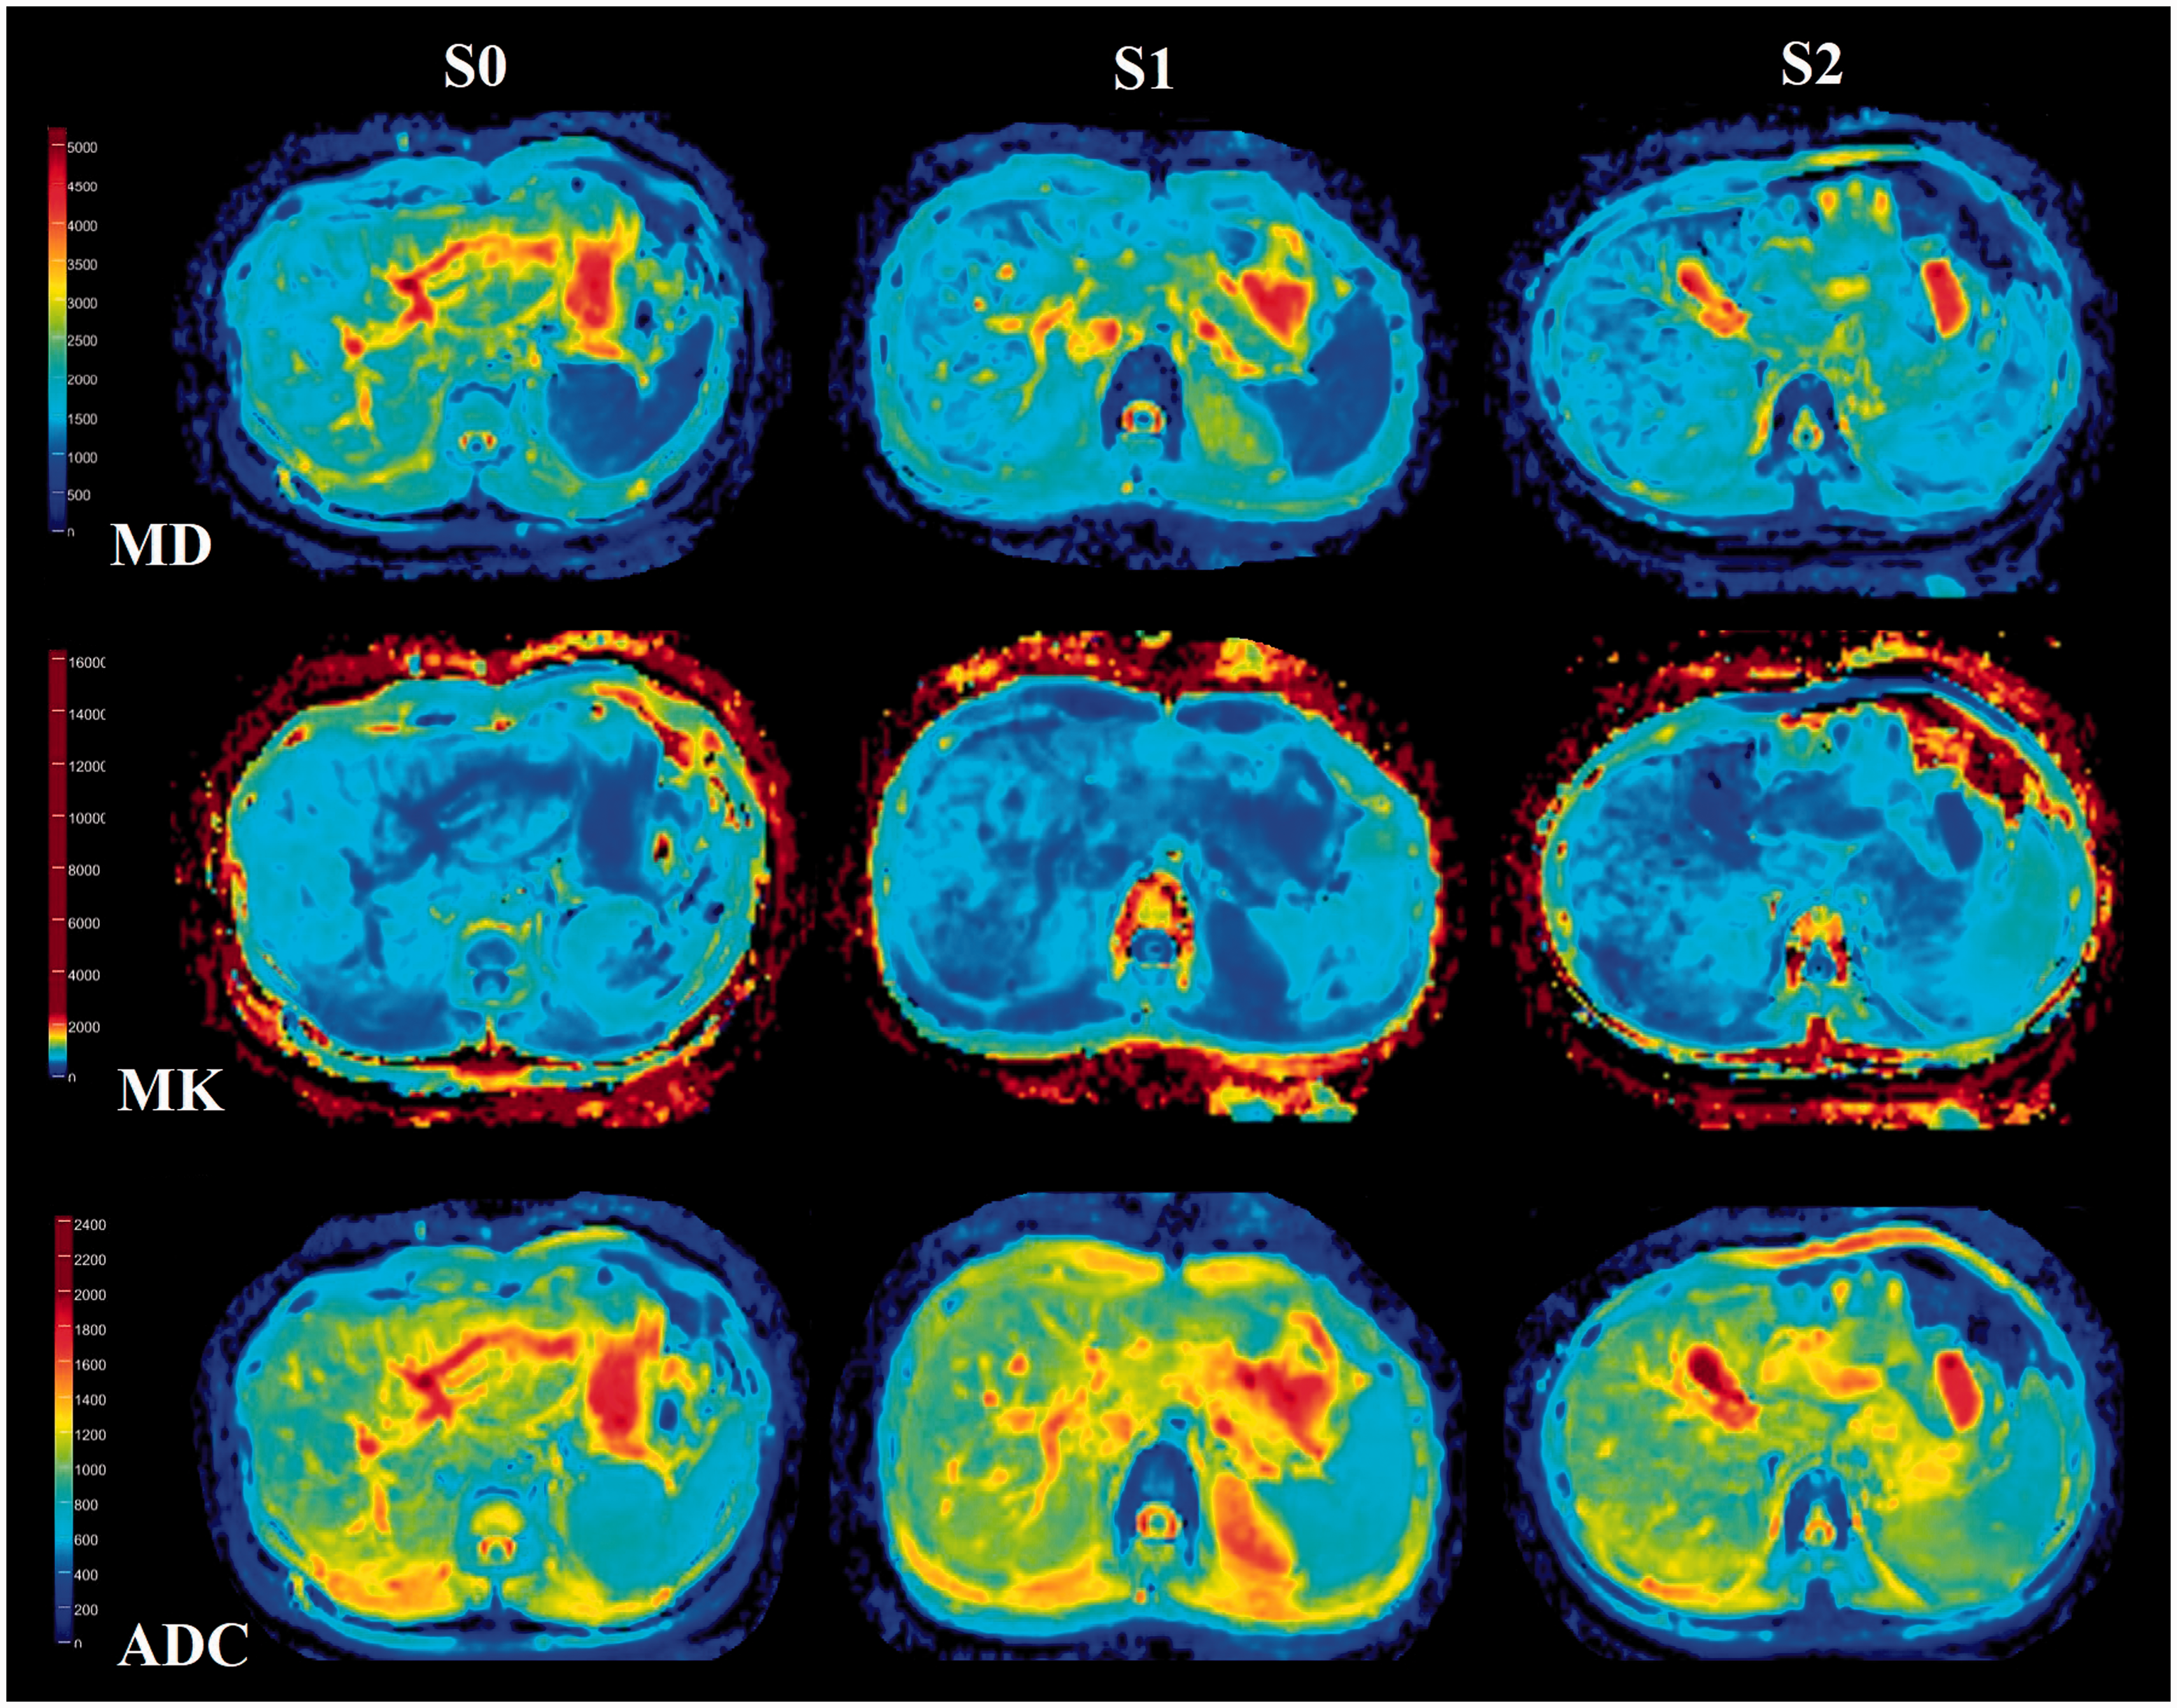
Example of MD, MK, and ADC maps in healthy controls (S0) and patients with mild (S1) and substantial fibrosis (S2). S0 in a 36-year-old man: mean MD value is 1.69 × 10⁻³ mm2/s, MK is 0.75, ADC is 1.34 × 10⁻³ mm2/s; S1 in a 33-year-old man: mean MD value is 1.55 × 10⁻³ mm2/s, MK is 0.74, ADC is 1.25 × 10⁻³ mm2/s; S2 in a 35-year-old woman: mean MD value is 1.44 × 10⁻³ mm2/s, MK is 0.76, ADC is 1.19 × 10⁻³ mm2/s.
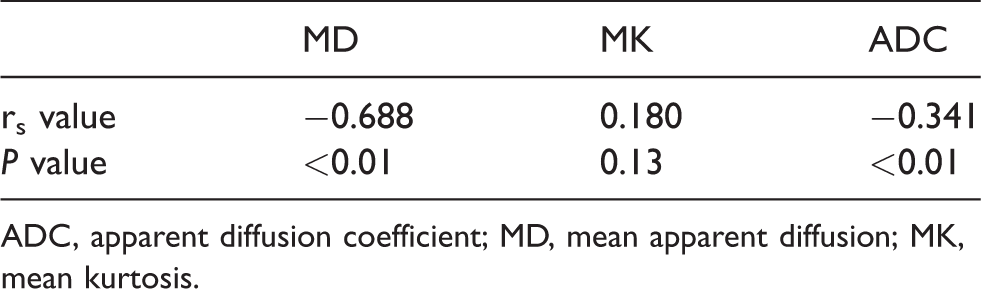
The MD and ADC values were inversely correlated with the fibrosis stages (rs = −0.668, –0.341; P < 0.01) and the MK values had no correlation with the fibrosis stages (rs = 0.180; P = 0.13) (Table 3).
Correlation between MD, MK, and ADC values with fibrosis stages.
ADC, apparent diffusion coefficient; MD, mean apparent diffusion; MK, mean kurtosis.
Diagnostic performance for predicting mild and substantial fibrosis
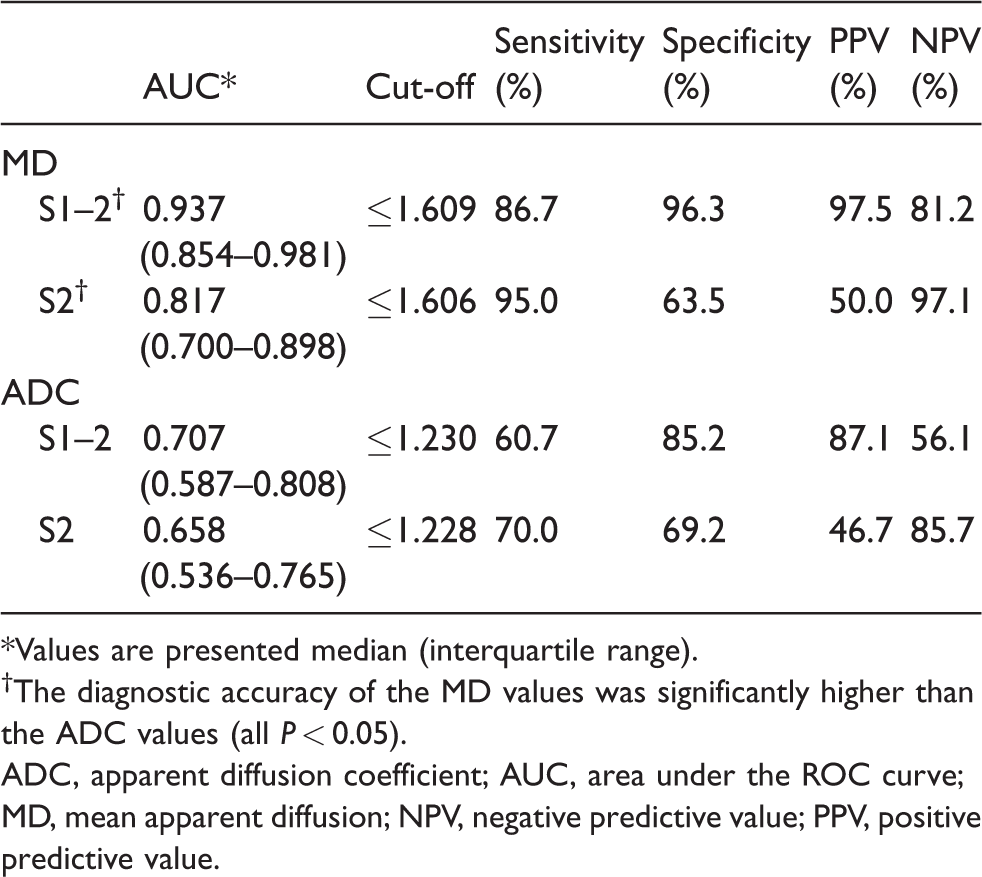
For the diagnosis of S1 and S2 fibrosis, the AUC was 0.937 (95% confidence interval [CI] = 0.854–0.981) in the MD at a threshold of 1.609 × 10⁻³ mm2/s and 0.707 (95% CI = 0.587–0.808) in the ADC at a threshold of 1.230 × 10⁻³ mm2/s. The diagnostic accuracy of the MD values was higher than that of the ADC values for the diagnosis of S1-2 (Z = 3.977, P < 0.001). For the diagnosis of S2 fibrosis, the AUC was 0.817 (95% CI = 0.854–0.981) in the MD at a threshold of 1.606 × 10⁻³ mm2/s and 0.658 (95% CI = 0.536–0.765) in the ADC at a threshold of 1.228 × 10⁻³ mm2/s. The diagnostic accuracy of the MD values was higher than that of the ADC values for the diagnosis of S2 (Z = 2.582, P = 0.01) (Table 4, Fig. 5).
Diagnostic performance of MD and ADC for the assessment of fibrosis stage.
*Values are presented median (interquartile range).
†The diagnostic accuracy of the MD values was significantly higher than the ADC values (all P < 0.05).
ADC, apparent diffusion coefficient; AUC, area under the ROC curve; MD, mean apparent diffusion; NPV, negative predictive value; PPV, positive predictive value.
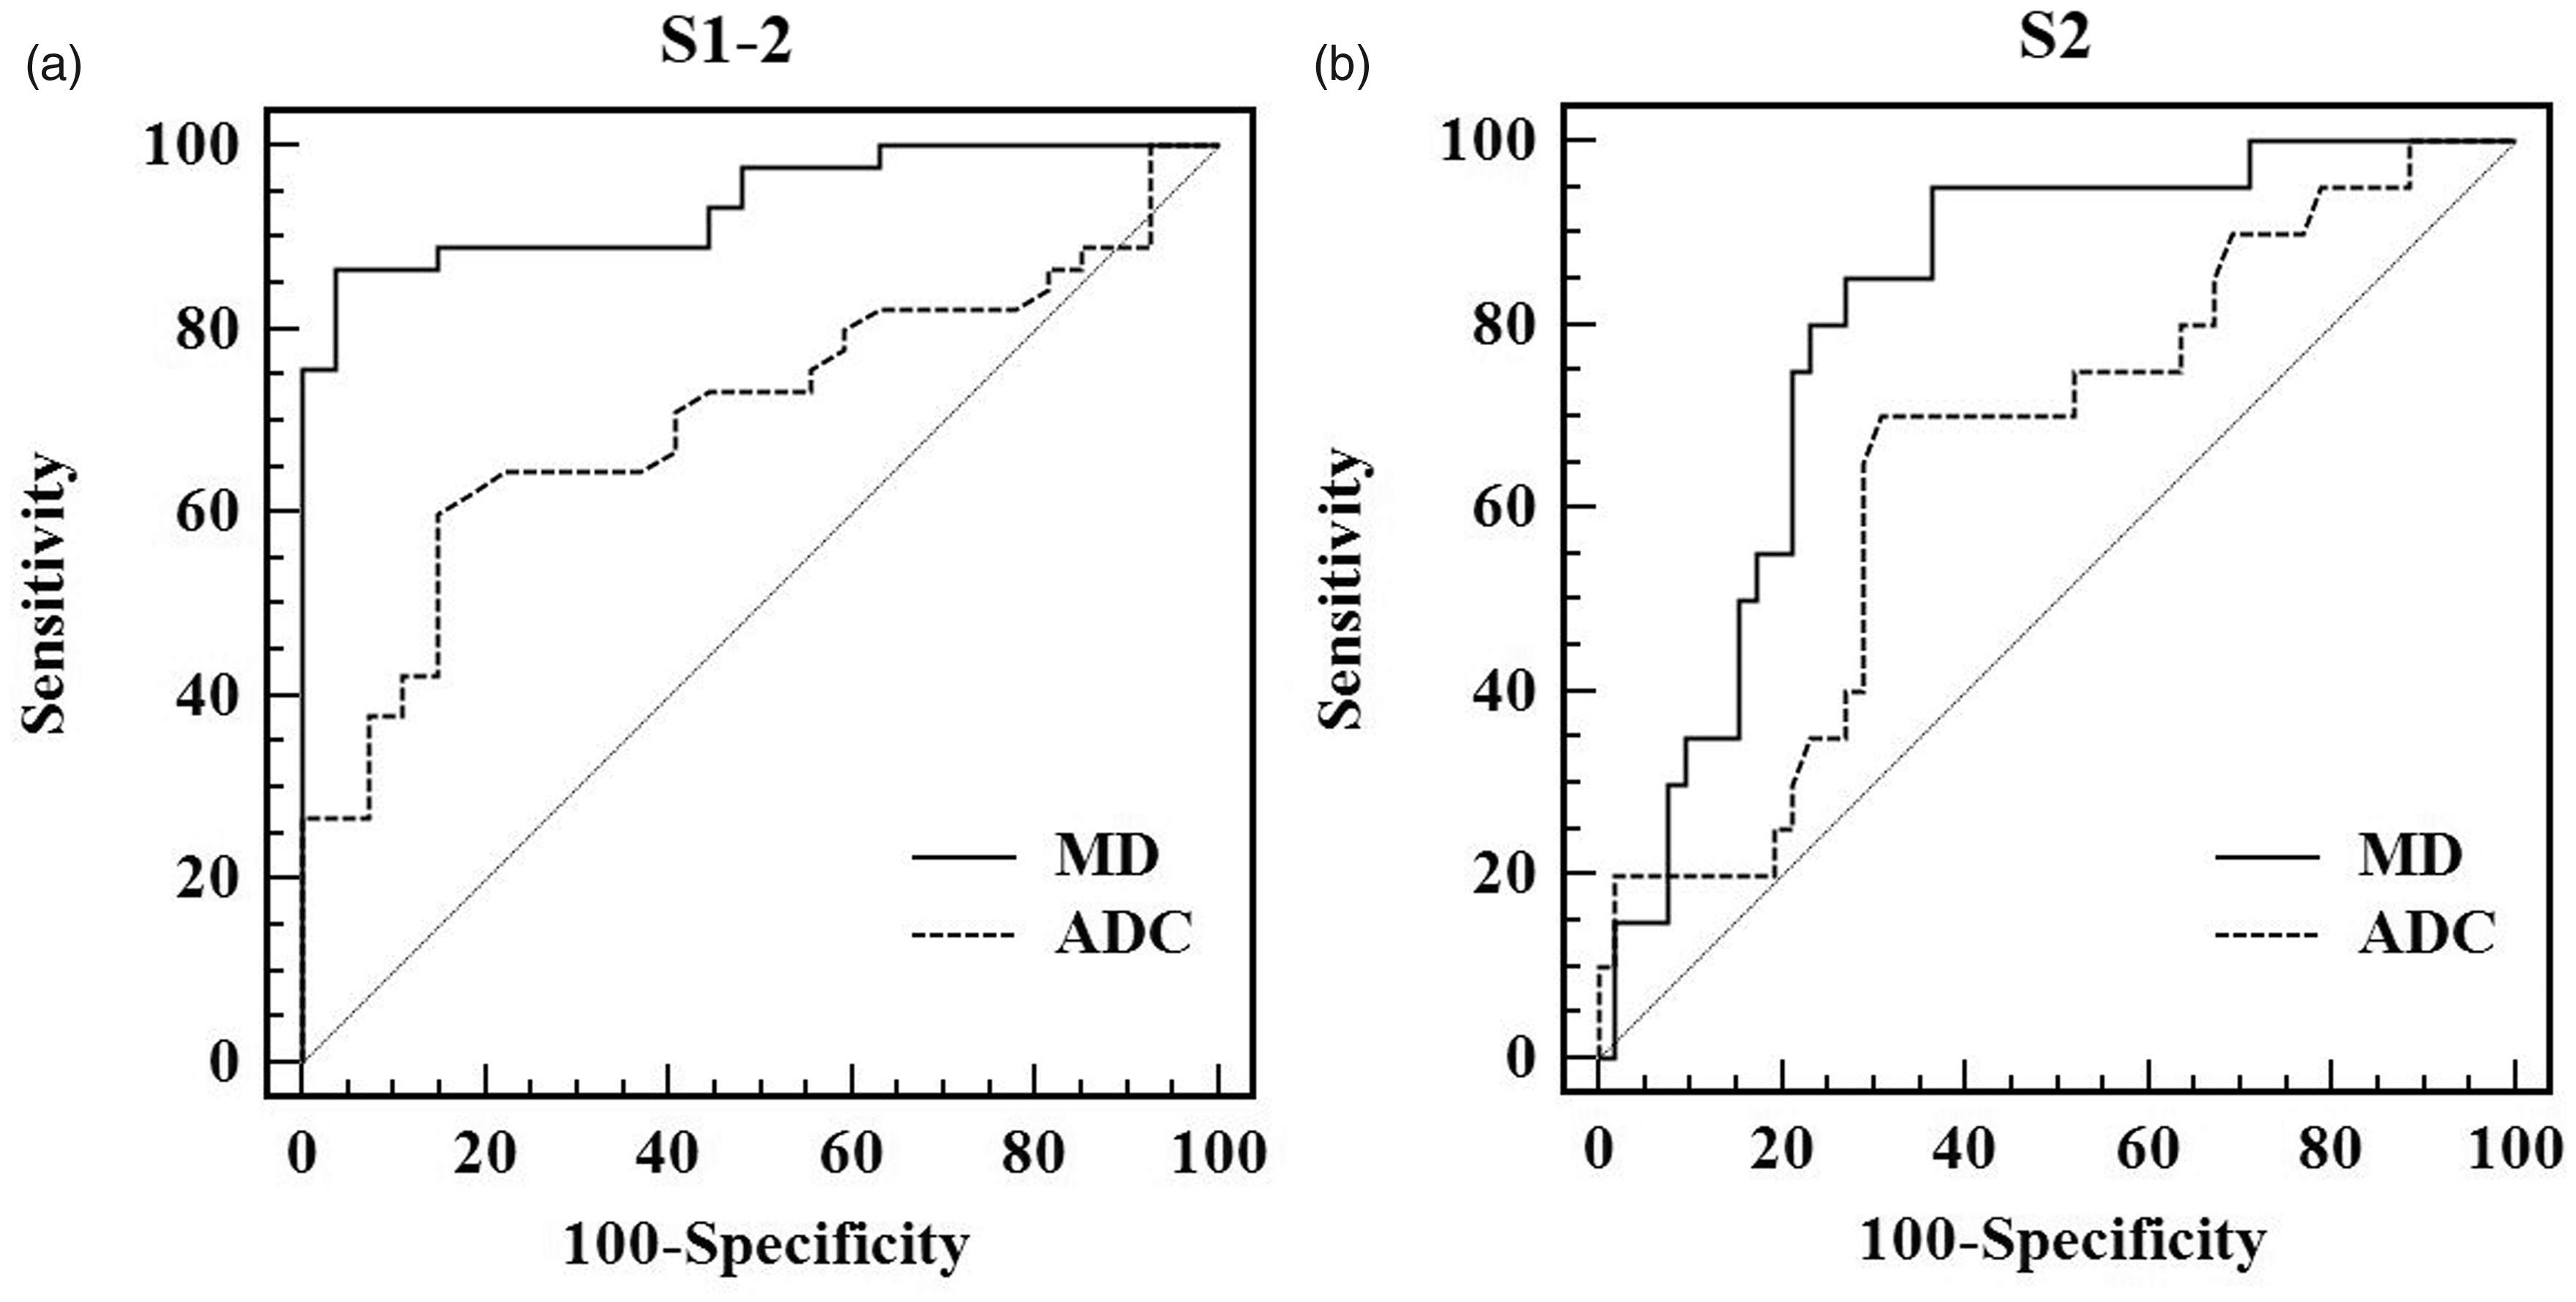
Receiver operating characteristic curves to diagnose mild and substantial fibrosis (S1–2) (a) and only substantial fibrosis (S2) (b). The diagnostic accuracy of MD is significantly higher than ADC (all P < 0.05).
Discussion
Both DKI-derived metric MD values and cDWI-derived metric ADC values can reveal the diffusivity of water molecules in tissue (36,37). In this study, we recruited study participants according to the pathological result of liver biopsy. The pathological results of inflammation grade in fibrosis group showed concentrated distribution (89% in grade 2). In addition, two previous studies reported that liver fibrosis was the only variable associated with MD, MK, and ADC, and inflammation did not influence the diffusion parameters (21,28). Therefore, we only analyzed the relationship between fibrosis stages and those diffusion parameters.
Our results showed that the MD values decreased as the fibrosis advanced, which is consistent with the pathological changes of liver fibrosis, a complex assembly of collagen fibers, glycosaminoglycans, and proteoglycans in liver parenchyma that restricted the molecular diffusion, and the results of previous animal and clinical studies (24–29). MD values could differentiate S0 from S1 and S0 from S2, had an excellent diagnostic accuracy for predicting S1–2, and a moderate diagnostic accuracy for predicting S2. This suggests the possibility of using MD values for the differentiation of patients with S1 or S2 liver fibrosis from healthy controls. But, the ability to use MD values to differentiate S2 fibrosis from S1 fibrosis was limited. Correlation analysis showed that MD values had a moderate correlation with fibrosis stages, which is comparable to the clinical study by Yoshimaru et al. (27), but higher than that in the clinical study by Yang et al. (28). This may be a result of the different patient distribution in each fibrosis stage and the use of relatively low b values (200, 500 s/mm2) in Yang et al.’s study, and the potential perfusion may affect the result. In addition, the correlation between MD values and fibrosis stages in our study and previous clinical studies was lower than that seen in animal studies, which was in the range of −0.74 to −0.840 (24–26,29). This may be because of the different etiology of fibrosis between clinical patients and animal models and the long course of disease in clinical patients. However, healthy volunteers had no liver fibrosis and inflammation, and the majority of S1 and S2 patients had grade 2 hepatic inflammation in this study. Our result showed that MD can differentiate S0 from S1 and S0 from S2 but cannot differentiate S1 from S2. Therefore, the possibility of hepatic inflammation affecting MD value cannot be excluded. Further studies are needed to determine the effect of hepatic inflammation on MD values.
Our study also demonstrated that ADC values decreased as the fibrosis advanced, which is also consistent with the deposition of macromolecular materials in liver parenchyma. However, ADC values can only differentiate S0 from S2, had a moderate diagnostic accuracy for predicting S1–2, and a low diagnostic accuracy for predicting S2. The diagnostic accuracy of the ADC was lower than that of the MD, which is consistent with previous clinical and animal studies (24–27). In addition, correlation analysis showed that ADC values only had a low correlation with fibrosis stages, which is lower than the MD. This indicates that MD values offer better performance than ADC values in differentiating patients with S1 or S2 fibrosis from healthy controls. The reason may be that DKI quantifies the non-Gaussian behavior of diffusion, while cDWI quantifies the Gaussian behavior of diffusion (6). Inside liver tissue with fibrosis, the deposition of extracellular collagen changed the way of water molecular movement. Therefore, non-Gaussian behavior of diffusion is more consistent with the true state of water molecule movement.
In theory, the MK reflects the tissue complexity (36–38). In our study, MK values showed no significant differences between healthy controls and those with S1 or S2 fibrosis, and had no correlation with the fibrosis stages, which was inconsistent with previous clinical and animal studies (24–29). However, the MK value in the same fibrosis stage was inconsistent across different studies, and the different values of MK in different fibrosis stages are very small. The diagnostic accuracy of MK values for differentiating different fibrosis stages was variable in previous clinical and animal studies, which was in the range of 0.675–0.959, as well as the correlation between MK values and fibrosis stages, which was in the range of 0.405–0.851. Furthermore, Goshima et al. (36) compared the MK among different Child-Pugh grades and found negative results. Therefore, a possible explanation to similar MK values in our study may be that the ability of MK to reflect the changes of microstructural complexity was not very sensitive, and the microstructural complexity in S1 or S2 fibrosis changed too slightly or had overlap among varying degrees, which was not enough to create a difference in the MK value in healthy controls and those with S1 or S2 fibrosis. Further studies are needed to confirm the most likely explanation of the MK in our study and the value of MK in wider clinical settings.
This study has several limitations. First, in order to avoid cardiac motion artifacts and keep consistent with biopsy location, the ROIs were only placed in the right lobe, and this may not reflect the fibrosis distribution of the entire liver. Second, although both liver biopsy and ROI measurement were performed on the right lobe, the area of biopsy was very small and it was difficult to ensure that the ROI was placed in exactly the same place as in the biopsy site. Third, the healthy controls did not have any pathological results. For ethical reasons, healthy controls did not undergo a liver biopsy, but we ensured that they all had no background of chronic liver disease. Additionally, concerning the small simple size and concentrated distribution, we did not analyze the possible effects of inflammation on MRI parameters.
In conclusion, the MD value derived from DKI can be readily used to differentiate patients with S1 or S2 fibrosis from healthy controls and offer better performance than the ADC derived from cDWI. However, both DKI and cDWI do not help in differentiating S1 fibrosis from S2 fibrosis.
Footnotes
Acknowledgements
The authors thank Zhizheng Zhuo (Clinical Science, Philips Healthcare, PR China) for the support with the software for image processing and help with statistical analysis and Sudhir Joshi for language editing.
Declaration of conflicting interests
The authors declared no potential conflicts of interest with respect to the research, authorship, and/or publication of this article.
Funding
The authors received the following financial support for the research, authorship, and/or publication of this article: This study is supported by National Natural Science Fund of China (81671657, 81901710 and 81873888), Science and Technology Fund of Tianjin (15KG133), Tianjin Clinical Research Center for Organ Transplantation Project (15ZXLCSY0007).