
Abstract
Background
Differentiation of adenoma and pheochromocytoma on computed tomography (CT) may be problematic.
Purpose
To investigate if adenoma and pheochromocytoma can be differentiated with adrenal CT.
Material and Methods
A total of 147 pathologically proven adrenal masses (119 adenomas, 28 pheochromocytomas) that had undergone adrenal CT were retrospectively evaluated. Lesion attenuation on unenhanced phase (UEP), portal phase (PP), 15-min delayed phase (DP), absolute/relative percentage enhancement wash-out (APEW/RPEW), and qualitative features were recorded. Student’s t-test for parametric data, Mann–Whitney U test for non-parametric data, and Fisher’s exact test for categorical data were used. Diagnostic performance of CT attenuation was assessed by area under the curve (AUC) of the receiver operating characteristics.
Results
APEW of adenomas was not significantly different from pheochromocytomas; 68.4% and 59% (P = 0.284). Adenomas had significantly higher RPEW; 57.3% vs. 37.4% (P = 0.004). Of pheochromocytomas, 50% met APEW >60% or RPEW >40% criteria, and therefore were misclassified as adenoma on wash-out CT. Of those, 80% (4/5) were < 3 cm. UEP, PP, and DP attenuations of pheochromocytomas were significantly higher than adenomas; however, they were overlapping. AUC for UEP, PP, and DP was 0.906, 0.784, and 0.926, respectively. Larger pheochromocytomas were more likely to contain necrosis compared to smaller pheochromocytomas and adenomas; 41.6% vs. 12.5% vs. 3%. Homogeneous enhancement was seen in 25% of pheochromocytomas and 49% of adenomas (P = 0.018). No significant difference was found in terms of lesion borders and presence of fat/calcification (P > 0.05).
Conclusions
A considerable percentage of pheochromocytomas, especially smaller ones, demonstrate adenoma-like wash-out on CT. Heterogeneous enhancement, higher attenuation, and necrosis are more suggestive of pheochromocytoma.
Introduction
The first step in the characterization of an adrenal lesion is usually to decide whether it is an adenoma; since it is the most frequent lesion of adrenal glands. In the diagnosis of an adrenal adenoma, unenhanced computed tomography (CT) and chemical-shift magnetic resonance imaging (CS-MRI) are commonly used to detect intracytoplasmic fat. If an adrenal lesion has unenhanced density of 10 HU or lower or shows signal drop on CS-MRI, it is considered a lipid-rich adenoma. However, it is known that a considerable percentage of adenomas (10%–40%) is lipid-poor; therefore, they remain indeterminate on unenhanced CT and CS-MRI (1). For those, wash-out CT, which omits wash-out characteristics of adrenal lesions, is used (2). Previous studies showed that wash-out CT could further characterize adrenal lesions which remained indeterminate on CS-MRI (3,4). It has also been reported that dedicated adrenal CT can reliably differentiate adenomas from non-adenomas (5). However, in that study, cohort non-adenomas mostly consisted of metastasis with a small number of pheochromocytoma. Furthermore, even though pheochromocytomas usually secrete adrenergic hormones and cause clinical symptoms which make the diagnosis easier, non-functional and incidentally discovered pheochromocytoma are not uncommon (6). Importantly, 9% of incidentally detected adrenal lesions were reported to be pheochromocytoma (7). Therefore, imaging plays a crucial role in this group. Notably, additional studies comparing wash-out characteristics of adenoma and pheochromocytoma reported that a significant subset of pheochromocytomas mimicked adenoma on dedicated adrenal CT; therefore, wash-out CT may be misleading (8–13). These studies mostly focused on wash-out ratios without taking qualitative features into account; in addition, some lacked pathology confirmation. The purpose of our study is to investigate if adenoma and pheochromocytoma can be differentiated with adrenal CT. We hypothesize that they can be differentiated with CT when both qualitative and quantitative CT features, including wash-out ratios, were taken into account. Histopathology was the reference standard for all lesions.
Material and Methods
Patients
This retrospective study was approved by our institutional review board. An electronic records search was performed in our pathology database between 1 January 2000 and 31 December 2009 using the search term “adrenal.” Pathologically proven adrenal adenoma and pheochromocytoma that met the following criteria were included in the study: age > 18 years at the time of CT; CT with at least portal venous phase within six months of the pathologic analysis; size of adrenal lesion > 1 cm; and more than twice the CT slice thickness. In total, 139 patients (147 lesions) met our inclusion criteria (Fig. 1). Age and sex were recorded for all patients. The histopathological nature of the adrenal nodules had been determined from surgery (n = 143), surgical biopsy (n = 3), or fine needle aspiration (n = 1). All procedures performed in studies involving human participants were in accordance with the ethical standards of the institutional and/or national research committee and with the 1964 Helsinki declaration and its later amendments or comparable ethical standards.
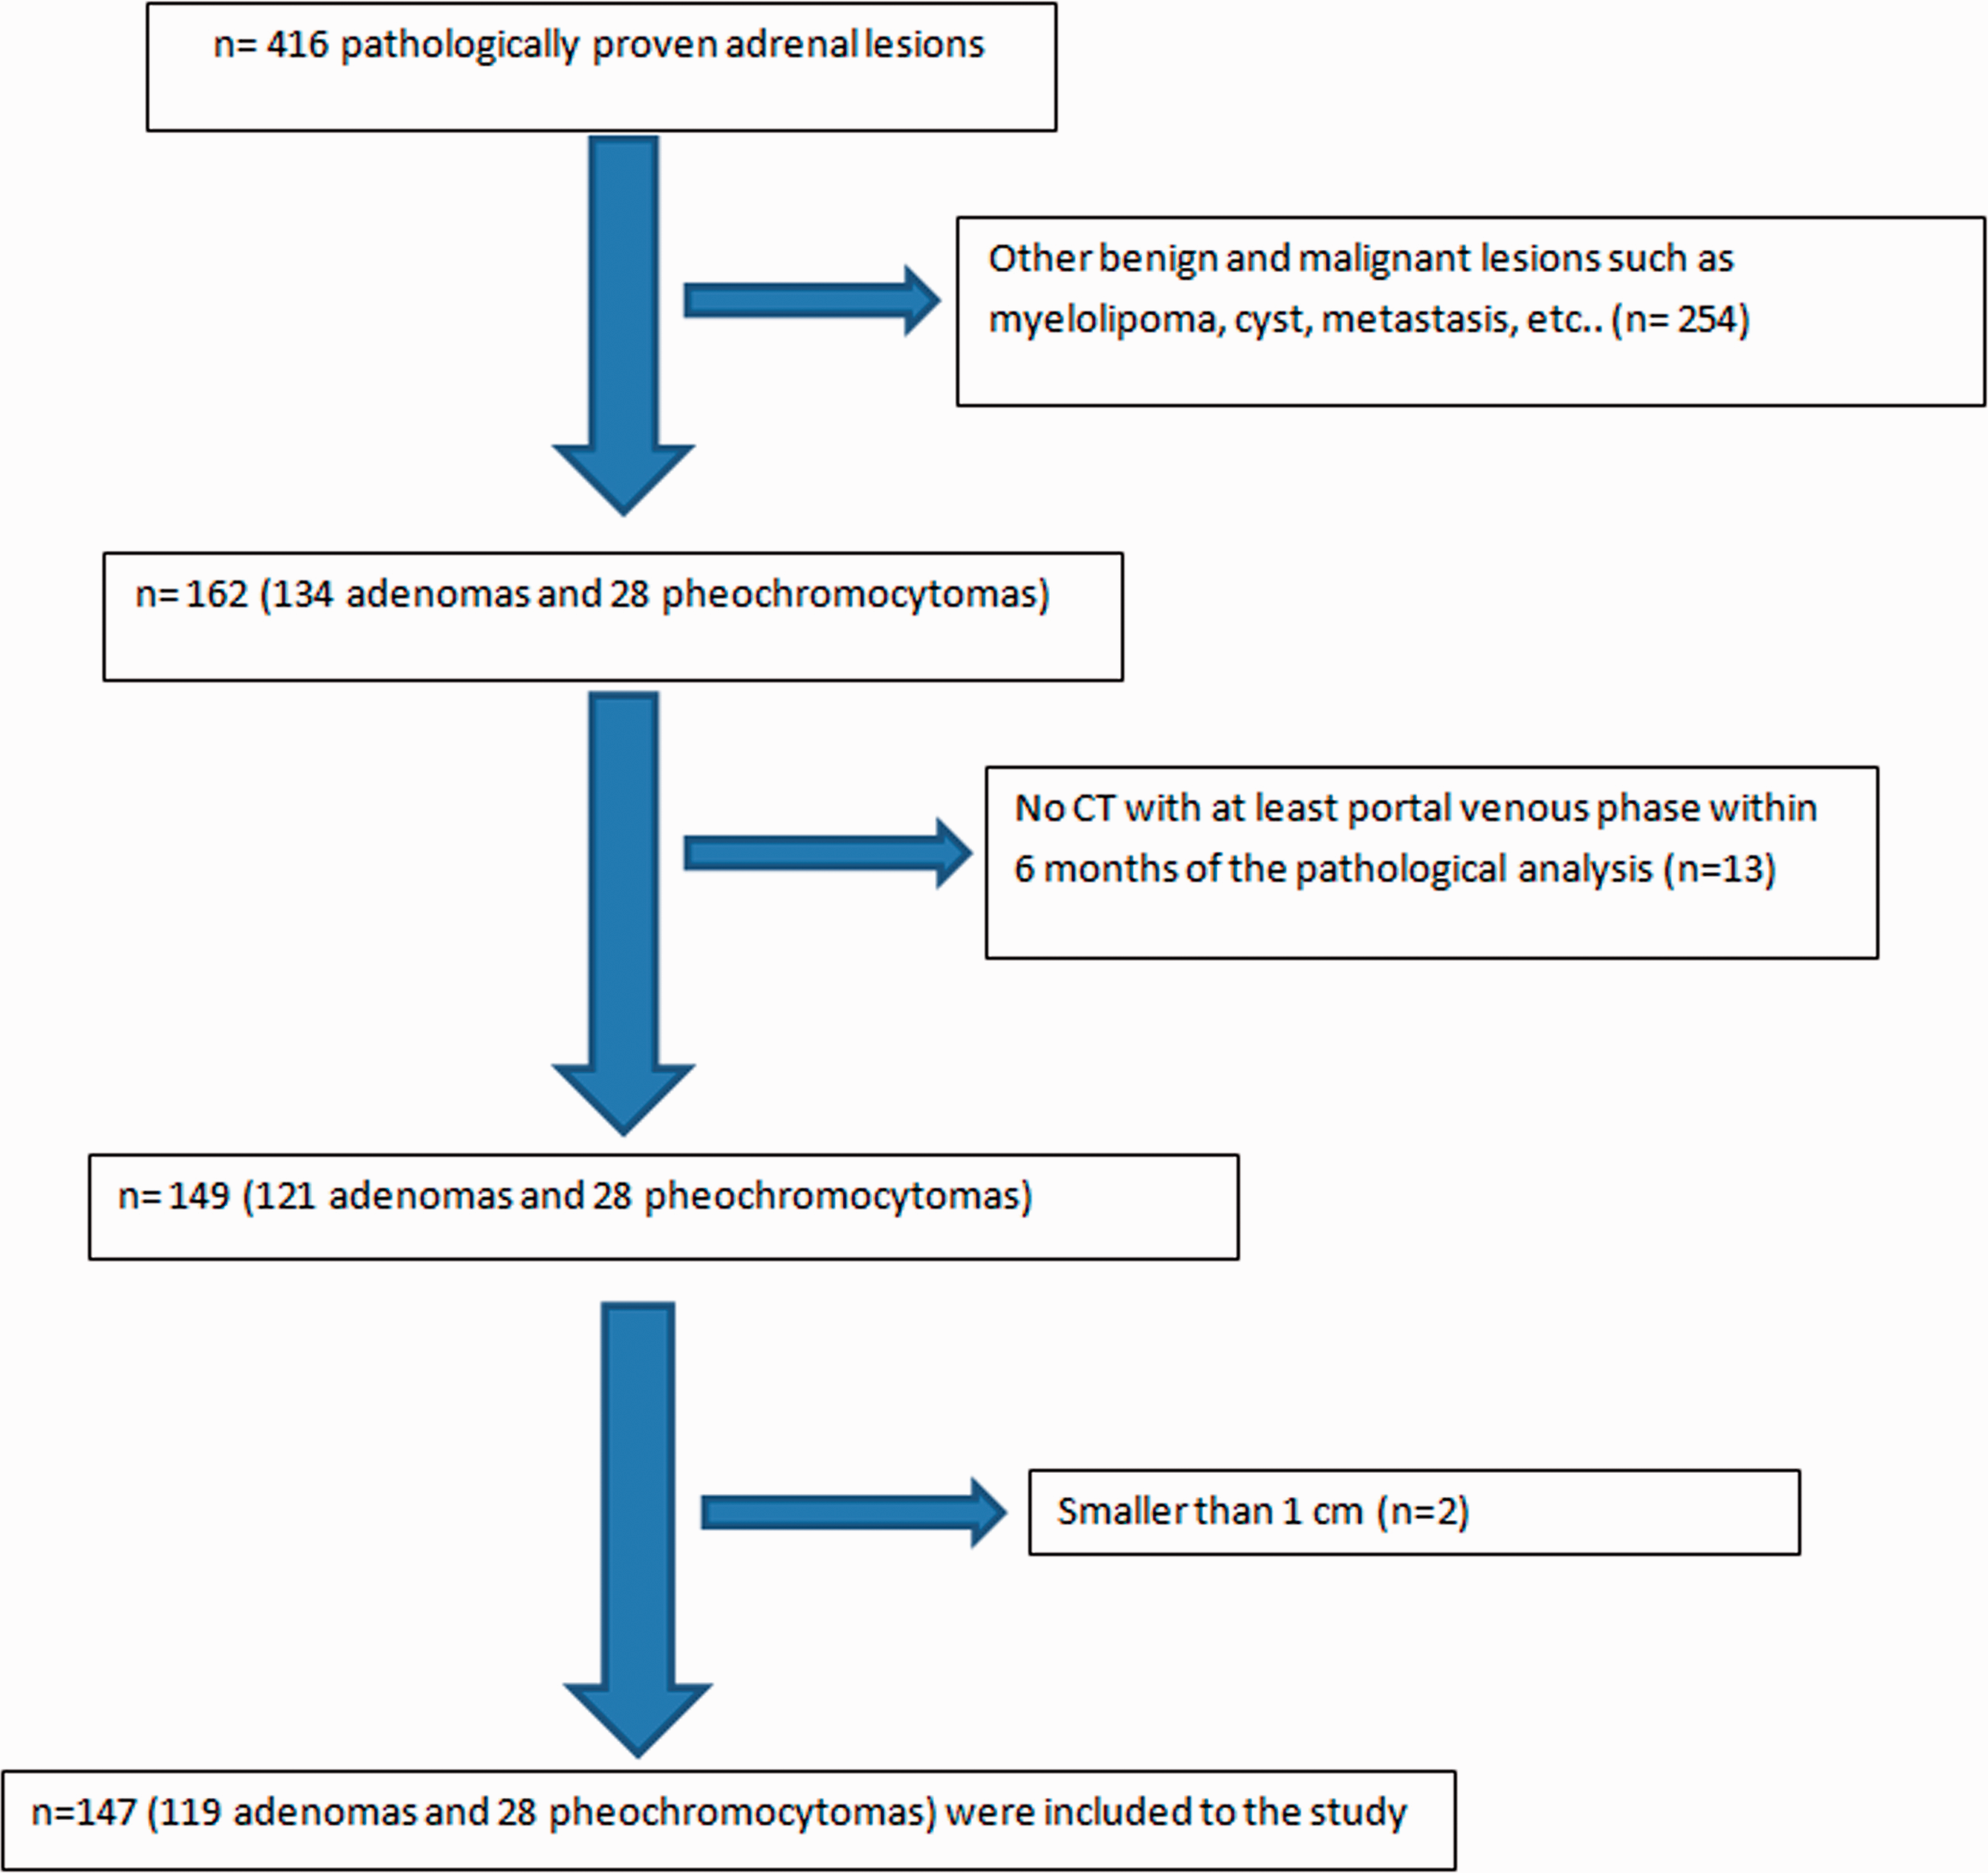
Flow chart of the inclusion.
CT scan and analysis
Three different CT scanners were employed: General Electric Light Speed 16; Light Speed VCT; and Light Speed QX/I, Milwaukee, Wisconsin. CT parameters were as follows: median mA = 300 mA (range = 40–659 mA); 120–140 kVp; and median slice thickness = 2.5 mm (range = 2.5–5.0 mm). After intravenous administration of 100–150 mL of non-ionic contrast agent (iohexol 300 mg/mL, GE Healthcare Inc., Princeton, NJ, USA) at a rate of 2.0–3.0 mL/s by power injector, contrast-enhanced CT scans were obtained at 25–30 s, 60–70 s, and 15 min. On our PACS system (Intelli Space PACS Radiology, v4.4, Philips, San Francisco, CA, USA), both qualitative and quantitative features of the adrenal lesions were evaluated by a radiologist (EA) with >5 years of experience in abdominal radiology. Images were reviewed on soft-tissue windows (W = 400; L = 40). Presence of calcification was recorded. Any area < –20 HU was considered as fat component. Evaluation of necrosis was performed when unenhanced and enhanced images were available. No or less than 10 Hounsfield Unit (HU) increase in attenuation on post-contrast phase compared to unenhanced phase (UEP) was considered as necrosis. Free-hand region of interest (ROI) was carefully drawn around the borders of the adrenal mass and this identical ROI was transposed onto other available series by using a graphic user interface (GUI) in Mat lab (Version 2013b, Math Works®, Natick, MA, USA) interfacing the NIH Image J software (14). Extreme edges of the mass were avoided in order to prevent partial volume artifacts. The attenuation values for each ROI were captured. Absolute percentage enhancement wash-out (APEW) and relative percentage enhancement wash-out (RPEW) characteristics of lesions were calculated as follows: APEW = ([portal phase – delayed]/[portal phase – unenhanced]) × 100 and RPEW = ([portal phase – delayed]/portal phase) × 100; where unenhanced, portal phase and delayed are the mean attenuations on UEP, portal venous phase (PP) and delayed phase (DP) contrast-enhanced CT, respectively (5).
Statistical analysis
Statistical analysis was performed using SPSS version 22 (IBM Corp., Armonk, NY, USA). Medians and frequencies were calculated to summarize the study data. Normal distribution was examined using the Kolmogorov–Smirnov and Shapiro–Wilk tests according to the sample size. Student’s t-test was used to compare two groups if the variable fit a normal distribution curve. Otherwise, the Mann–Whitney U test was used. Categorical data were expressed as numbers of patients with percentages and compared using Fisher’s exact test. Receiver operating characteristics (ROC) analysis was computed to evaluate the extent to which attenuation values on UEP, PP, and DP can be used to distinguish adenoma and pheochromocytoma. P ≤ 0.05 was considered significant.
Results
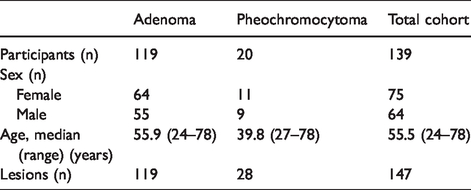
Our cohort consisted of 139 patients (64 men, 75 women) with 147 lesions: 119 adenomas and 28 pheochromocytomas. Patient demographic characteristics are summarized in Table 1. In the adenoma group, the reason for surgery was either their functional status or presence of ipsilateral renal cell carcinoma.
Patient and lesion characteristics.
A 15-min DP was available for 75 lesions (65 adenomas and 10 pheochromocytomas). In terms of APEW, there was no significant difference between adenomas and pheochromocytomas: the values were 68.4% and 59%, respectively (P = 0.284). However, RPEW of adenomas was significantly higher than pheochromocytomas: 57.3% and 37.4% (P = 0.004). Of the pheochromocytomas, 50%, 50%, 40%, and 40% were falsely categorized as adenoma, respectively, when the following criteria were individually applied to our cohort: APEW > 60%; APEW > 60% or RPEW > 40%; RPEW > 40%; and APEW > 60% and RPEW > 40%. On the other hand, 19.6% (12/65) of adenomas had APEW < 60% and RPEW < 40%; hence, they were classified as non-adenomas.
Larger (>3 cm) pheochromocytomas had higher APEW and RPEW values than smaller (<3 cm) pheochromocytomas: 63% versus 47.2% (P = 0.274) and 45.1% versus 25% (P = 0.277), respectively. Adenoma-like wash-out pattern was seen in 4/5 (80%) of small pheochromocytomas and 1/5 (20%) of larger pheochromocytomas. Sixty-five adenomas had a 15-min DP on CT. Of those, 33 were <3 cm and 32 were >3 cm. Similarly, small adenomas had higher APEW and RPEW values compare to large adenomas: 69.5% versus 62.9% (P = 0.453) and 59.4% versus 53.4% (P = 0.323), respectively. Twenty-nine (87.8%) out of 33 small adenomas and 23 (71.8%) of 32 large adenomas were classified correctly on adrenal CT.
Quantitative CT features are summarized in Table 2. Median (range) diameters of adenoma and pheochromocytoma were 2.8 cm (range = 1.0–8.6 cm) and 2.7 cm (range = 1.2–8.6 cm), respectively (P = 0.381). UEP was available for 117 adenomas and all pheochromocytomas. None of the pheochromocytomas had UEP attenuation <10 HU. Median (range) UEP, PP, and DP attenuation of pheochromocytoma was significantly higher than that of adenoma: 36.1 HU (range = 13.0–60.9 HU) versus 13.3 HU (–14.8 to 52.5 HU) (P < 0.001), 94.4 HU (range = 28.1–153.4 HU) versus 71.9 HU (range = 24.3–208.2 HU) (P = 0.005), and 70.2 HU (range = 48.5–74.9 HU) versus 35.9 HU (range = 4.2–79.3 HU) (P < 0.001), respectively (Fig. 2). In ROC analysis, the area under curve was 0.906 for UEP, 0.784 for PP, and 0.926 for DP (Fig. 3). Optimal cut-off was 29.9 HU in UEP, 80.4 HU in PP, and 61.5 HU in DP. For these cut-off values, sensitivity and specificity were found as 84.6% and 84.5%, 82.1% and 72.2%, and 80% and 92.8%, respectively. Arterial phase (AP) was available for nine pheochromocytomas and 43 adenomas. Only 2/9 pheochromocytomas and 9/43 adenomas had higher enhancement on AP compare to PP.
Qualitative and quantitative CT features of adenoma and pheochromocytoma.
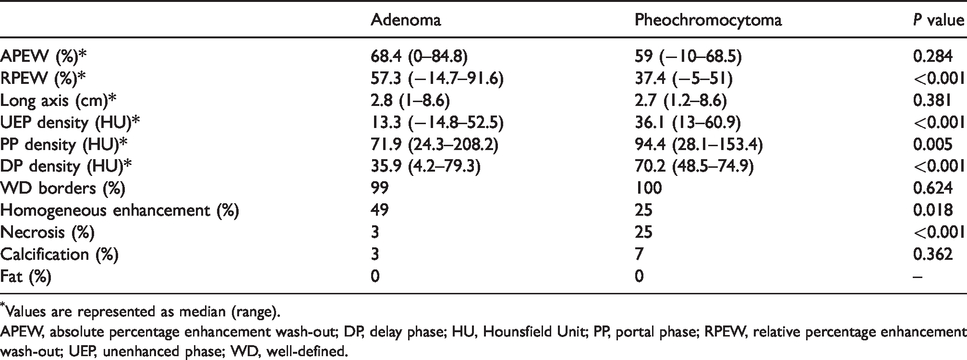
Values are represented as median (range).
APEW, absolute percentage enhancement wash-out; DP, delay phase; HU, Hounsfield Unit; PP, portal phase; RPEW, relative percentage enhancement wash-out; UEP, unenhanced phase; WD, well-defined.
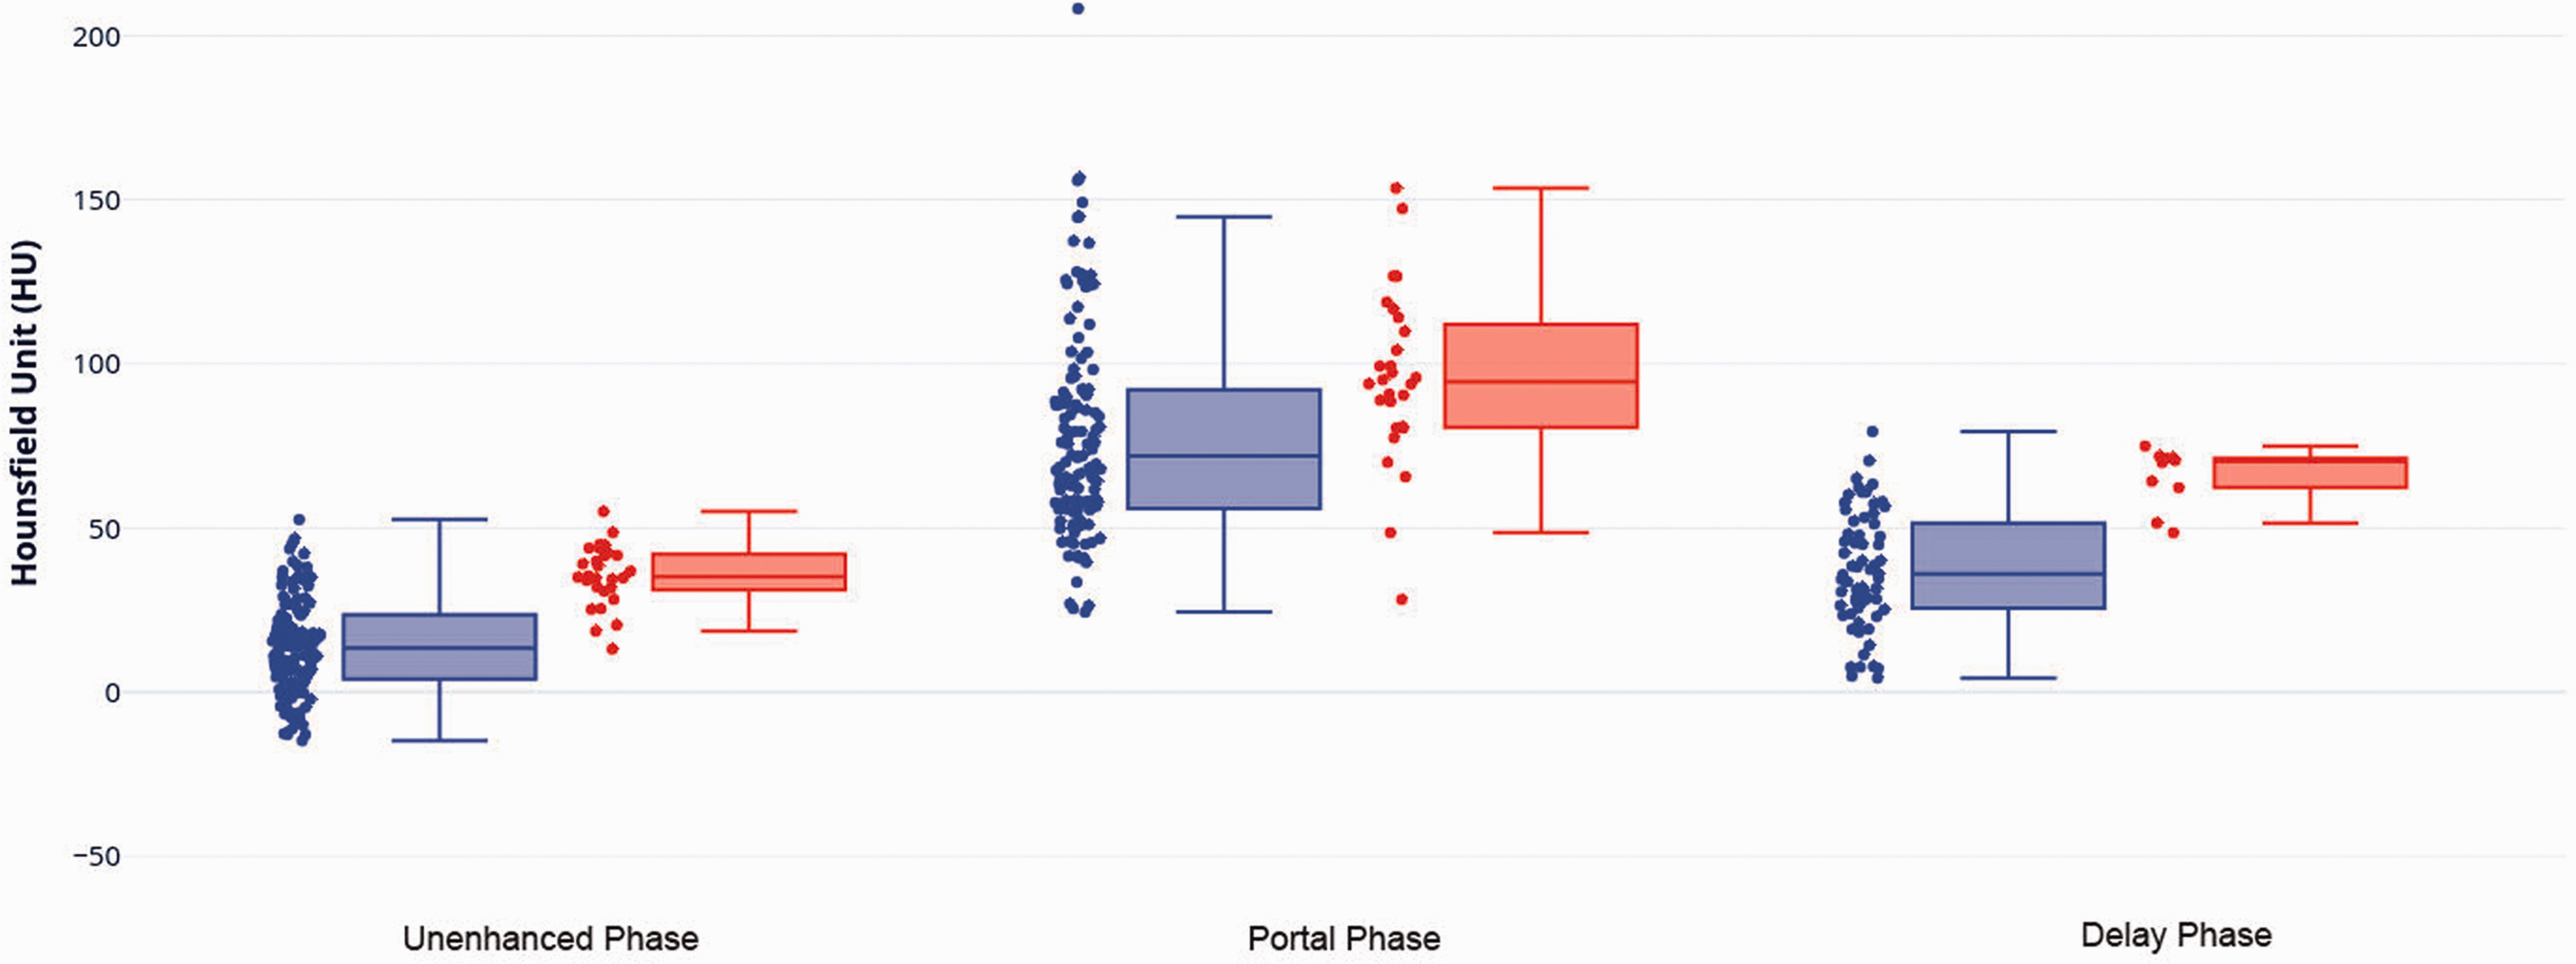
The box plots illustrate the unenhanced phase (UEP), portal phase (PP), and delayed phase (DP) attenuations of adenoma (purple) and pheochromocytoma (pink).
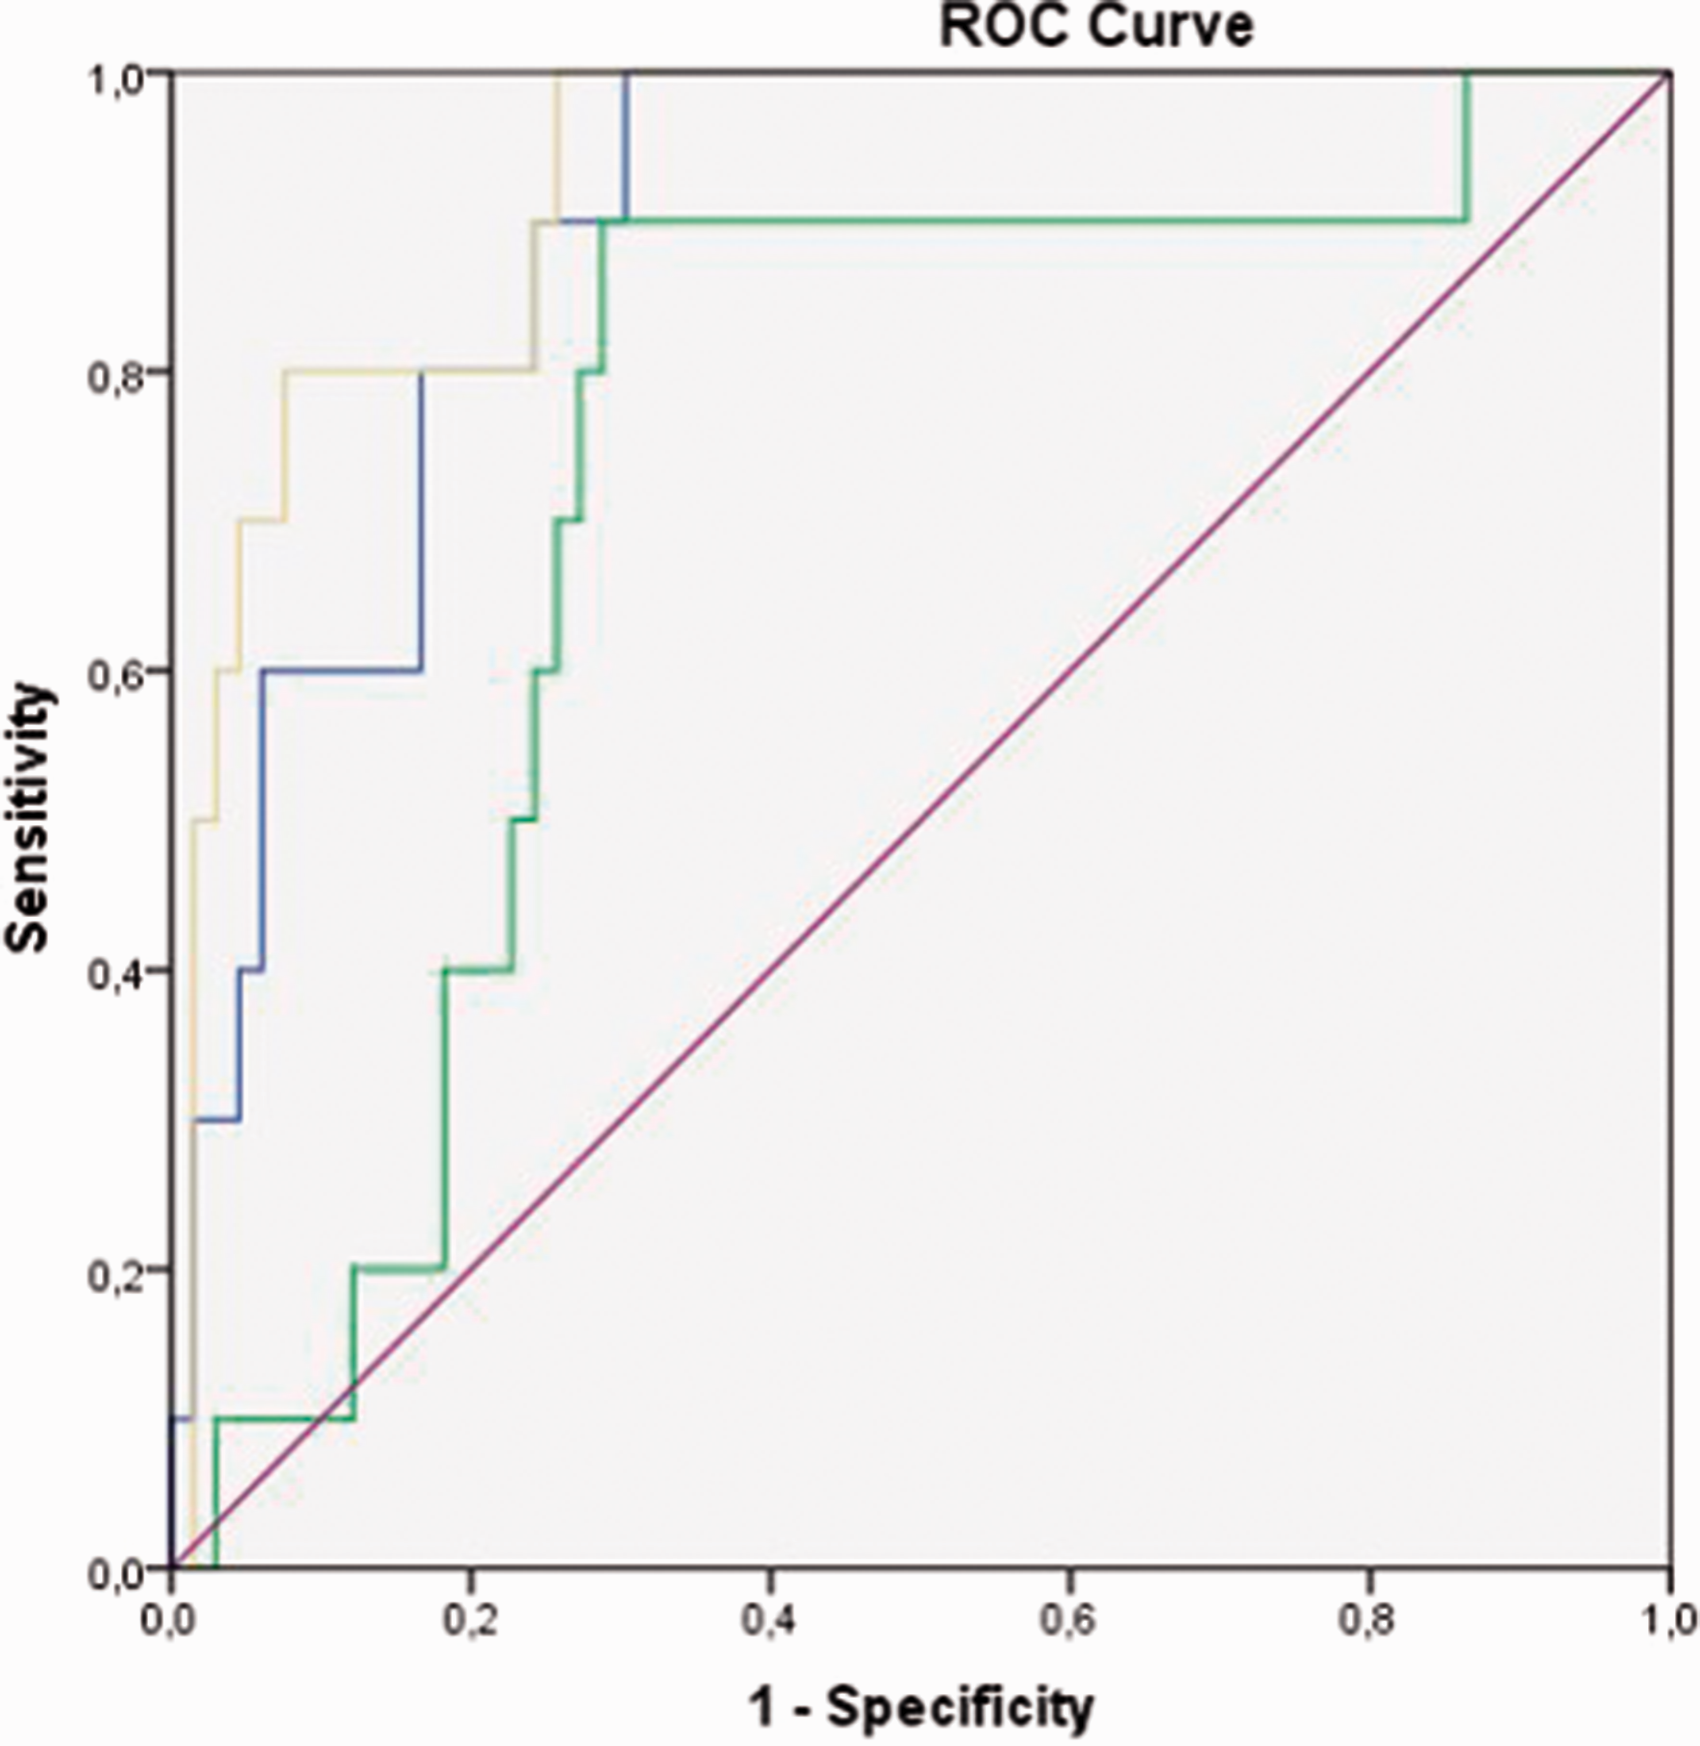
The receiver operating characteristic (ROC) analysis for UEP (blue), PP (green), and 15-min DP (yellow) attenuation for the differentiation of adenoma and pheochromocytoma.
On qualitative CT analysis, homogeneous enhancement was seen in 49% of adenomas and 25% of pheochromocytomas (P = 0.018). Pheochromocytomas had necrosis more often did adenomas: 25% and 3%, respectively (P < 0.001). No significant difference was noted in the presence of calcification or fat (P > 0.05). However, small pheochromocytomas had less necrosis and calcification than larger ones: 12.5% (2/16) versus 41.6% (5/12) and 0% (0/16) versus 16.6% (2/12), respectively. Except for one adenoma, all lesions had well-defined borders.
Discussion
In this study, we found that considerable percentage of pheochromocytomas, especially small ones (<3 cm), demonstrated adenoma-like wash-out pattern on dedicated adrenal CT. Therefore, other quantitative features as well as qualitative features should be considered when differentiating between adenoma and pheochromocytoma on CT. Higher attenuation on UEP, PP, and DP along with the presence of necrosis and heterogeneous enhancement are more suggestive of pheochromocytoma rather than adenoma.
In a patient with no known primary tumor, the first differential diagnosis for an incidentally discovered adrenal lesion is adenoma. They are usually non-functional and can be easily diagnosed with unenhanced CT or CS-MRI if there is sufficient intracytoplasmic fat. However, 10%–40% of adenomas are lipid-poor and cannot be characterized by these methods; therefore, they require further imaging. On the other hand, pheochromocytomas which arise from the chromafinn cells of the adrenal glands are usually functioning and represented by clinical symptoms including hypertension, diaphoresis, and headache. However, it is also known that some pheochromocytomas are clinically silent (6).
For indeterminate adrenal lesions, wash-out CT is a widely accepted technique which omits high wash-out ratios of adenomas. Szolar et al. reported that wash-out CT could differentiate adenomas from non-adenomas with high sensitivity and specificity (5). However, the cohort of this study mostly consisted of adenoma and metastasis with small number of pheochromocytomas. Other studies comparing wash-out characteristics of adenoma and pheochromocytoma reported that pheochromocytomas might exhibit adenoma-like wash-out on 15-min DP (8–13). However, some of these studies lacked uniform pathology confirmation (10–12) and most focused on 15-min wash-out ratios without taking other quantitative and qualitative features into account. Park et al. compared 25 adenomas and 11 pheochromocytomas which had 15-min DP CT. In that study, they found that pheochromocytomas had higher PP attenuation than adenomas: 37.4 HU and 13.7 HU, respectively (8). They also found that adenomas had higher APEW than pheochromocytomas, yet there was overlap; APEW values for adenoma and pheochromocytoma were reported as 72.4% and 53.7%. In that study, 45% (5/11) of pheochromocytomas showed adenoma-like wash-out based on APEW. RPEW and qualitative CT features were not reported (8). In our study, we found similar PP attenuation and APEW values with Park et al. Our PP attenuation and APEW values for pheochromocytoma and adenoma were as follows: 36.1 HU versus 13.3 HU (P = 0.005) and 59% versus 68.4% (P = 0.284), respectively.
In another study, Patel et al. reported that 33% (8/24), 29% (7/24), and 25% (6/24) of pheochromocytomas mimicked adenoma on wash-out CT based on the following criteria: RPEW > 40%; APEW > 60%; and APEW > 60% or RPEW > 40%. They also found that pheochromocytomas were significantly less likely to be homogeneous compared to adenomas and no difference was observed between the two groups in terms of presence of calcification. In that study, only 32% of the lesions had pathology confirmation (10). In a study including 43 adenomas and 34 pheochromocytomas, Mohammed et al. reported that 66% of pheochromocytomas were misclassified as adenoma on dedicated adrenal CT. In that study, the criteria for adenoma were APEW > 60% and RPEW > 40% (13). A PP enhancement ≥ 85 HU was found to be much more likely to be pheochromocytoma than adenoma. Sensitivity, specificity, positive predictive value (PPV) and negative predictive value (NPV) for 85 HU were reported as 88.2%, 83.7%, 81.1%, and 90%. For the same cut-off, our results were as follows: 71.4%; 63.8%; 31.7%; and 90.4%. The authors concluded that PP attenuation should be considered along with APEW and RPEW in the differentiation between adenoma and pheochromocytoma.
Further studies investigated AP enhancement of pheochromocytomas and found AP more helpful than other phases (16,17). Northcutt et al. compared AP and PP attenuations of pheochromocytomas and adenomas. In that study, 25% of pheochromocytomas were found to have higher enhancement on AP than PP. All adenomas had their peak enhancement on PP (14). They also found that 58% of pheochromocytomas had 110 HU or higher attenuation on AP. Similarly, Goroshi et al. reported that pheochromocytomas have their peak enhancement on AP (16). In contrast to these studies, in our cohort, only 22.2% of pheochromocytomas and 20.9% of adenomas had higher enhancement on AP than PP. Out of nine pheochromocytomas, 2 (22.2%) had an AP enhancement ≥ 110 HU.
In the present study, we combined qualitative and quantitative CT features including wash-out ratios in 139 patients with 147 lesions (adenoma and pheochromocytoma) with histopathology as the reference standard for all. Similar to other reports, a substantial percentage of pheochromocytomas in our study showed an adenoma-like wash-out pattern on 15-min DP. Of the pheochromocytomas, 50%, 50%, 40%, and 40% were misclassified when the following criteria were applied to our cohort: APEW > 60%; APEW > 60% or RPEW > 40%; RPEW > 40%; and APEW > 60% and RPEW > 40%. Using the same criteria, Park et al. reported misclassifications of 65%, 68%, 48%, and 45%, respectively (9). The higher accuracy rate of RPEW compared to APEW might be related to significantly higher UEP attenuation of pheochromocytomas which led to higher APEW values and, in turn, misclassification. Of those pheochromocytomas which showed adenoma like wash-out, 80% (4/5) were <3 cm. In the larger group, only 20% (1/5) showed this pattern.
Like prior studies, we attempted to determine a specific cut-off value that might differentiate pheochromocytoma from adenoma. Although median UEP, PP, and DP attenuations of the two histologies were significantly different, they were overlapping. The attenuation difference in two groups was more pronounced on DP; therefore, higher accuracy was achieved with this phase. When the previously reported PP cut-off of 85 HU was applied to our cohort, sensitivity, specificity, PPV, NPV, and accuracy were 71.4%, 63.8%, 31.7%, 90.4%, and 65.3%, respectively. The highest accuracy of 92% was achieved with a DP cut-off of 66 HU. This cut-off provided 60% sensitivity, 96.9% specificity, 75% PPV, and 94% NPV.
Pheochromocytomas are characteristically, although not uniformly, large, heterogeneous masses with the areas of necrosis and cystic changes (15). Prior studies have reported that pheochromocytomas were significantly more likely to contain necrosis compared to adenomas (10,13). For example, Park et al. reported that 35% (11/31) of pheochromocytomas had necrosis (9). In terms of presence of calcification, no difference was found between the two groups (10,13). Our results were similar to the published data. We found that enhancement pattern and presence of necrosis were significantly different between the two groups. Pheochromocytomas were more likely to be heterogeneous and contain necrosis than that of adenomas: 75% versus 51% and 25% versus 3%, respectively. We also found that necrosis and calcification are less common in smaller pheochromocytomas.
Our study has limitations. First, it is a retrospective study; therefore, it is subject to sampling bias. However, only patients with pathological diagnosis have been included in the study, which is also deemed a strength. Second, there was asymmetry in the distribution of adenoma and pheochromocytoma in our cohort; however, as adenomas are much more common than pheochromocytomas, this reflects the relative frequency of these lesions in the population. Third, ROI measurements were done by one radiologist; therefore, we could not assess intra-observer variability. Finally, different CT scanners have been used in the 10-year span of this study, which may also be considered as strength since it offers some potential generalizability of our findings.
In conclusion, our results suggest that wash-out values alone may be misleading in distinguishing pheochromocytoma from adenoma. Necrosis and avid enhancement in a large adrenal mass may be sufficient for the diagnosis of pheochromocytoma in a symptomatic patient and therefore may not require further imaging. However, small pheochromocytomas tend to have less necrosis or calcification and can mimic adenoma in terms of wash-out characteristics. Higher CT attenuation along with presence of necrosis and heterogeneous may be helpful in the diagnosis of pheochromocytoma. In addition to wash-out ratios, other quantitative and qualitative features should be taken into account.
Footnotes
Acknowledgements
The authors thank Nilgun Sinan for her help in creating figures of the manuscript and Dr. Haluk Celik who helped with the statistical analysis.
Declaration of conflicting interests
The authors declared no potential conflicts of interest with respect to the research, authorship, and/or publication of this article.
Funding
The authors received no financial support for the research, authorship, and/or publication of this article.