
Abstract
Background
Stroke is a severe health problem, and magnetic resonance imaging (MRI) plays a significant role in stroke.
Purpose
To investigate the clinical value of MRI T2-mapping in carotid artery plaque.
Material and Methods
To locate the plaque in the carotid artery, 25 patients with carotid atherosclerosis were examined by 3.0-T MRI with three-dimensional (3D) time-of-flight and 3D fast spin-echo (FSE) T1-weighted scanning. The original images were obtained after T2-mapping (multi-spin-echo sequence) scanning. The T2 values of the plaque in the narrowest lumen were measured on T2 maps after postprocessing of the original images. Based on the symptoms, the patients were divided into two sub-groups; independent sample t-test was employed to compare the difference between the T2 values of the plaque in the two groups. We evaluated the optimal threshold and diagnostic efficacy of T2 values in predicting cerebrovascular symptoms by the receiver operating characteristic (ROC) curve.
Results
The T2 values of the carotid artery plaque in symptomatic and asymptomatic patients were 111.43 ± 46.54 ms and 59.25 ± 39.77 ms, respectively (t = −3.421, P < 0.01). ROC analysis showed that the T2 value of 65.38 ms was the optimal threshold to predict cerebrovascular symptoms. The specificity, sensitivity, and accuracy attained were 94.1% (16/17), 93.3% (14/15), and 93.8% (30/32), respectively.
Conclusion
We quantitatively assessed carotid plaque components by MRI T2-mapping technology. The T2 values of the carotid plaque were associated with cerebrovascular symptoms. The T2 values of the symptomatic plaque group were significantly higher than those of the asymptomatic group.
Introduction
High-field magnetic resonance (MR) accurately displays plaque morphology and structure, and is even used to evaluate the stability of atherosclerotic plaque via plaque signals (1,2). Therefore, more attention has been paid to the value of high-field MR in atherosclerotic plaque. However, obvious disadvantages hinder the applications of this technology in clinical work, including its unbearably long scanning time, non-quantitative characteristics, and superabundant imaging illustration (3). Corrections of the heterogeneity are difficult because the sensitivity of the surface coil that signal intensity of the plaque could be affected (4). However, quantitative T2-mapping technology is an alternative method that allows the evaluation of the properties of the plaque by direct detection of the mean of the T2 relaxation time. In vitro studies were conducted that were focused on lipid-rich necrotic core (LRNC) and fiber texture (5,6), whereas few in vivo investigations have been performed on the correlation between carotid plaque and ischemia stroke by quantitative T2-mapping. Here, we aimed to explore the value of the application of the T2-mapping technology in the quantitative assessment of carotid atherosclerotic plaque.
Material and Methods
Study population
The Institutional Review Boards of each facility approved the consent forms and study protocols; all participants provided informed consent. Patients suspicious of carotid atherosclerosis underwent cardiovascular MR (CMR) and T2-mapping scanning between March 2016 and December 2016. This study was approved by the Institutional Ethics Committee of our hospital and written informed consent for participation was obtained from all patients before the procedure.
The following exclusion criteria were applied:
Contraindications for MRI; Based on the vascular ultrasound findings: patients with plaque deficiency in the bilateral carotid arteries; and lumen stenosis caused by plaque <20%, resulting in inability to measure accurately the intracranial vascular stenosis or occlusion; Arteritis complications, bolt from heart, dissemination of the aorta, hypercoagulable state, cardiac insufficiency, and arrhythmia; Patients with basic diseases, such as infection, rheumatism, malignancy, etc.; Patients with blurred images caused by swallowing or head-moving artifacts.
Patients were divided into two groups, symptomatic and asymptomatic, according to whether they had cerebral ischemia symptoms (included transient ischemic attack) or ischemia stroke located in the front loop within three months before MRI examination.
MR imaging scanning
All patients were imaged using 3.0-T MR imaging (MRI; Siemens Verio, Erlangen, Germany) with eight-channel phased-array head-and-neck coils. Multi-spin-echo (SE) parameters were as follows: TE = 12.9/25.8/38.7/51.6/64.5/77.4/90.3/103.2 ms; TR = R-R; slice thickness = 2 mm; matrix size = 320 × 256; field of view (FOV) = 160 × 128 mm; in-plane resolution = 640 × 512; tape width = 130 Hz/pix. Three-dimensional fast spin-echo (3D-FSE) T1-weighted (T1W) imaging parameters were as follows: peripheral gating = TE 14 ms; TR = R-R; echo train length = 9. 3D time of flight (TOF) parameters were as follow: TR = 45 ms; TE = 4.1 ms; FOV = 200 × 150 mm; matrix size = 256 × 192; and slice thickness = 1 mm. Initially, considering the carotid bifurcation as the center, we located the atherosclerotic plaque through 3D-TOF and 3D-FSE T1W imaging. Multilayer multi-SE scanning was then performed with the plaque serving as the center.
Image processing and analysis
We processed all T2-mapping raw data using Syngo.via workstation and automatically generated plaque T2 pseudochromatic images. All MR images were examined by two blinded MR radiologists, who measured the T2 values of the plaque without knowing the patient’s clinical history.
The steps performed were as follows:
The generated T2 maps were placed in a fixed window wide-window position (300, 148); We then drew contours to delineate the region of interest (ROI) on the pseudochromatic images at a ROI range ≥2 mm2. Next, we measured the T2 values of the narrowest plaque in the carotid artery lumen in the symptomatic and asymptomatic group; This plane was chosen as the center and measured the T2 values of plaque of the adjacent planes in the same way as described above; the mean of the T2 values of the three planes of plaques obtained was calculated; The measurements were repeated three times and the mean value of the plaque was calculated as the final T2 value.
Statistical analysis
All analyses were performed using SPSS16.0. Normality test and variance analysis of all metrological data were performed; the normal distribution was represented as
Results
The sample consisted of 25 patients (15 men, 10 women; age range = 47–86 years; mean age = 70 ± 10 years). The risk factors for carotid atherosclerosis were as follows: diabetes = 40.00% (10/25); hypertension = 68.00% (17/25); hyperlipidemia = 20.00% (5/25); and heavy smoking (defined as smoking >20 packs per year) = 32.00% (8/25).
Out of the 13 patients in the symptomatic group, seven had a left-sided plaque, four right-sided, and two in both carotid arteries. The T2 values were 111.43 ± 46.54 ms in the symptomatic group (Fig. 1). In contrast, out of the 12 patients in the asymptomatic group, five had a left-sided plaque, two right-sided, and five in both carotid arteries. The T2 values were 59.25 ± 39.77 ms in asymptomatic group (Fig. 2). The difference was statistically significant (t = –3.421, P < 0.01) (Fig. 3). The ROC analysis showed that the T2 value of 65.38 ms was the optimal threshold for prediction of cerebrovascular symptoms; the specificity, sensitivity, and accuracy were 94.1% (16/17), 93.3% (14/15), and 93.8% (30/32), respectively (Fig. 4). The area under ROC curve (AUC) was 0.878 (95% confidence interval = 0.72–1.037).
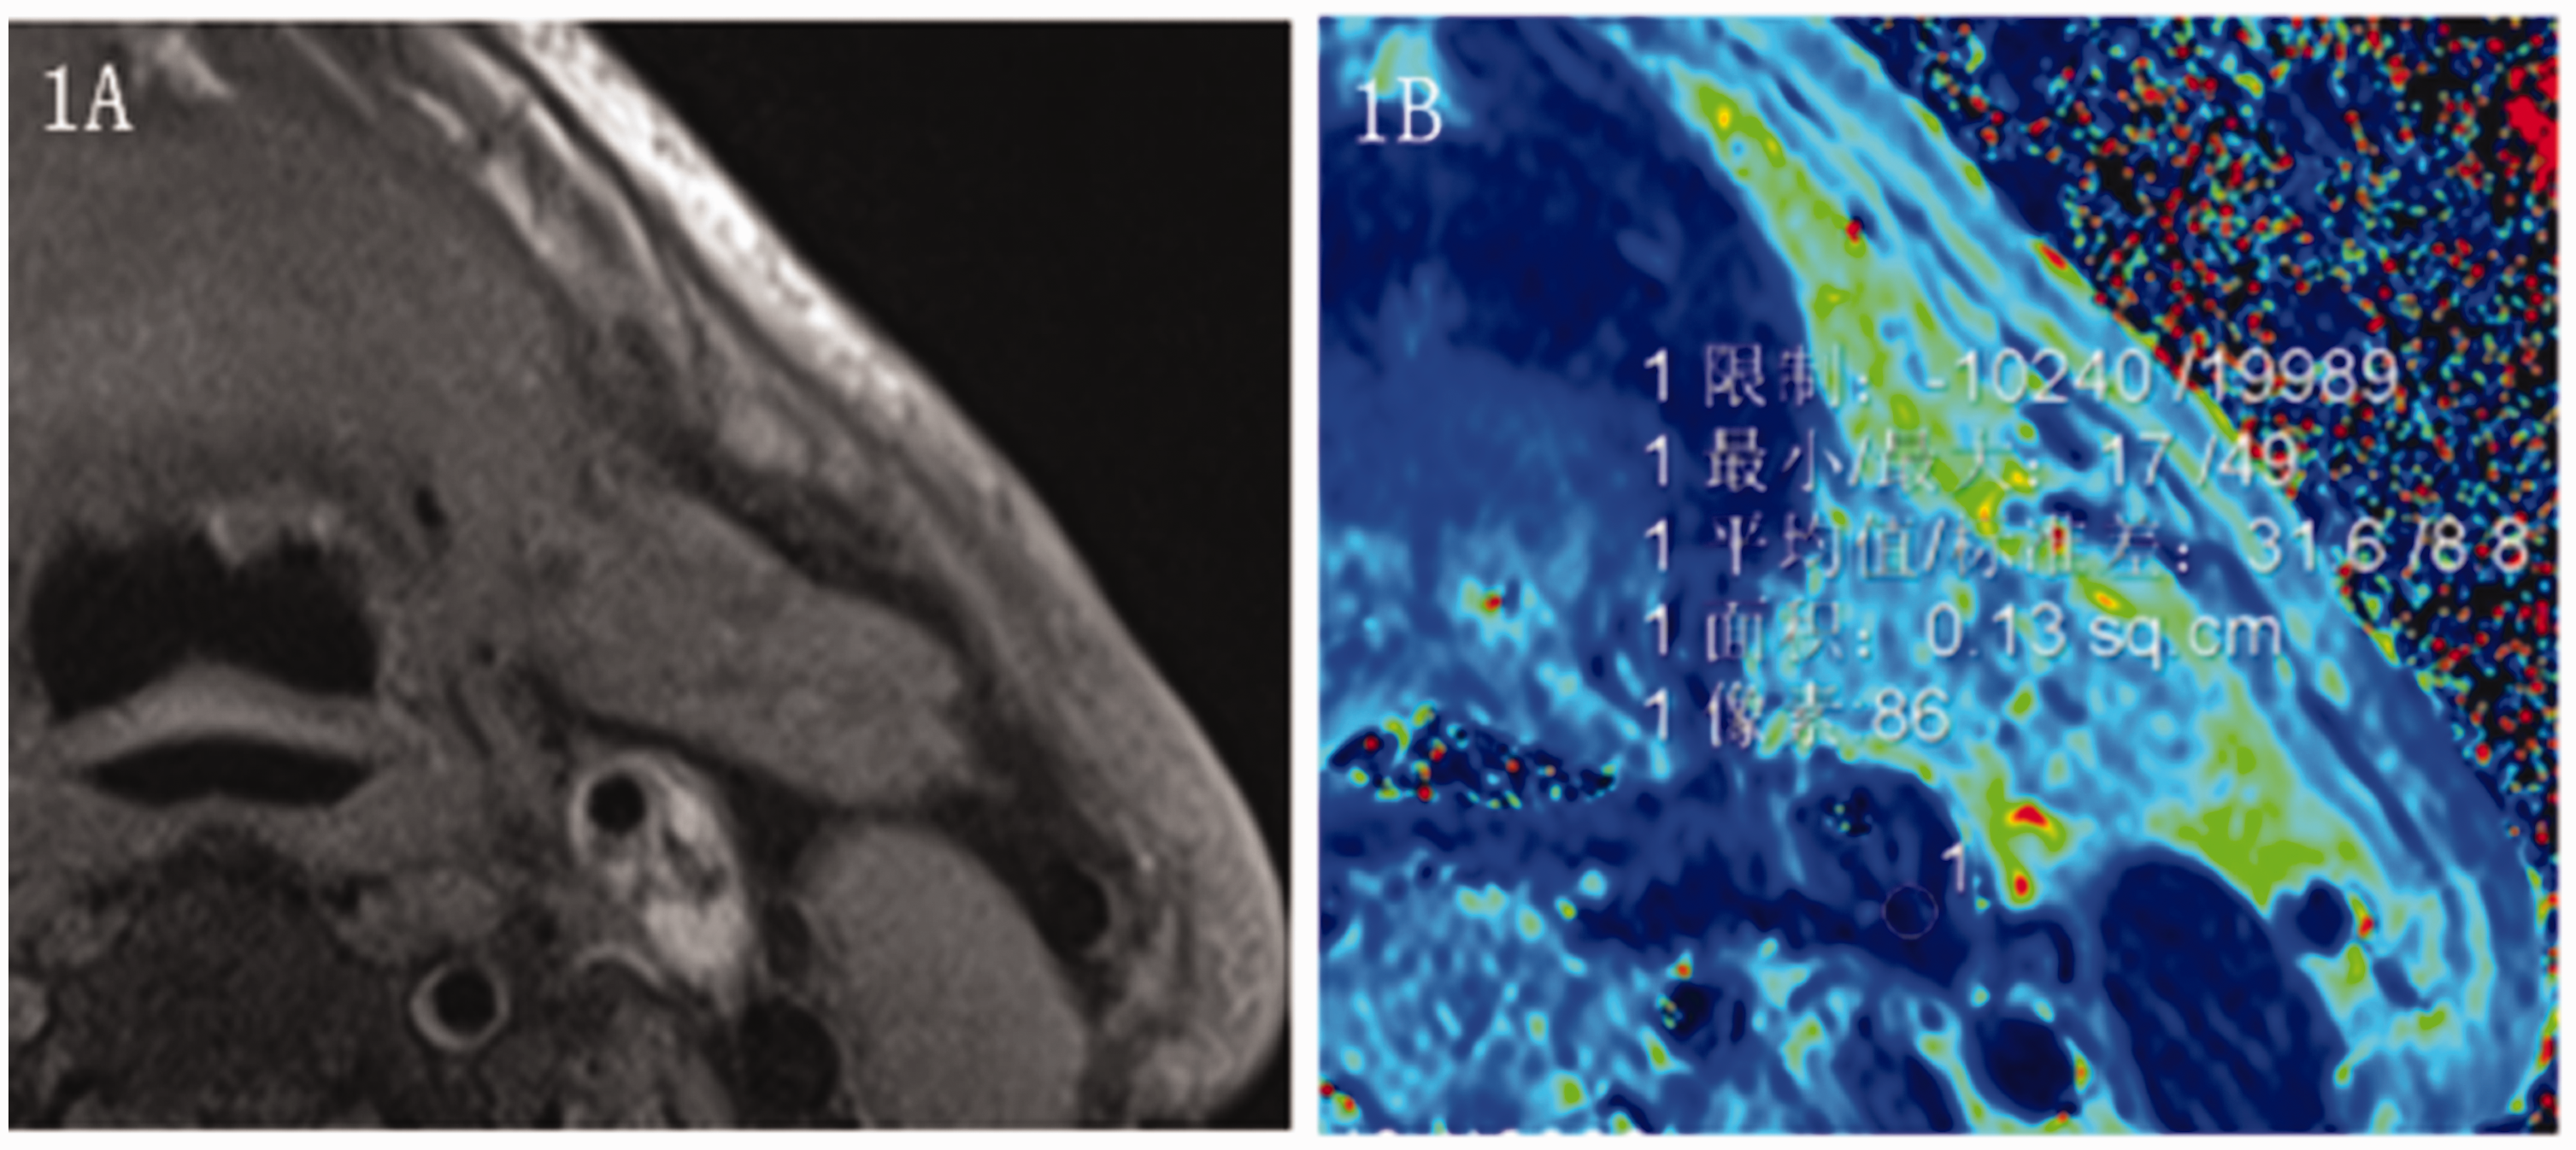
A 78-year-old man was unsteady walking for four days. No significant cerebral infarction was observed on MRI. A mixed plaque was found at the proximal bifurcation of the left common carotid artery. The T2 value of the plaque measured at the corresponding position on the T2 maps was 31.6 ms.
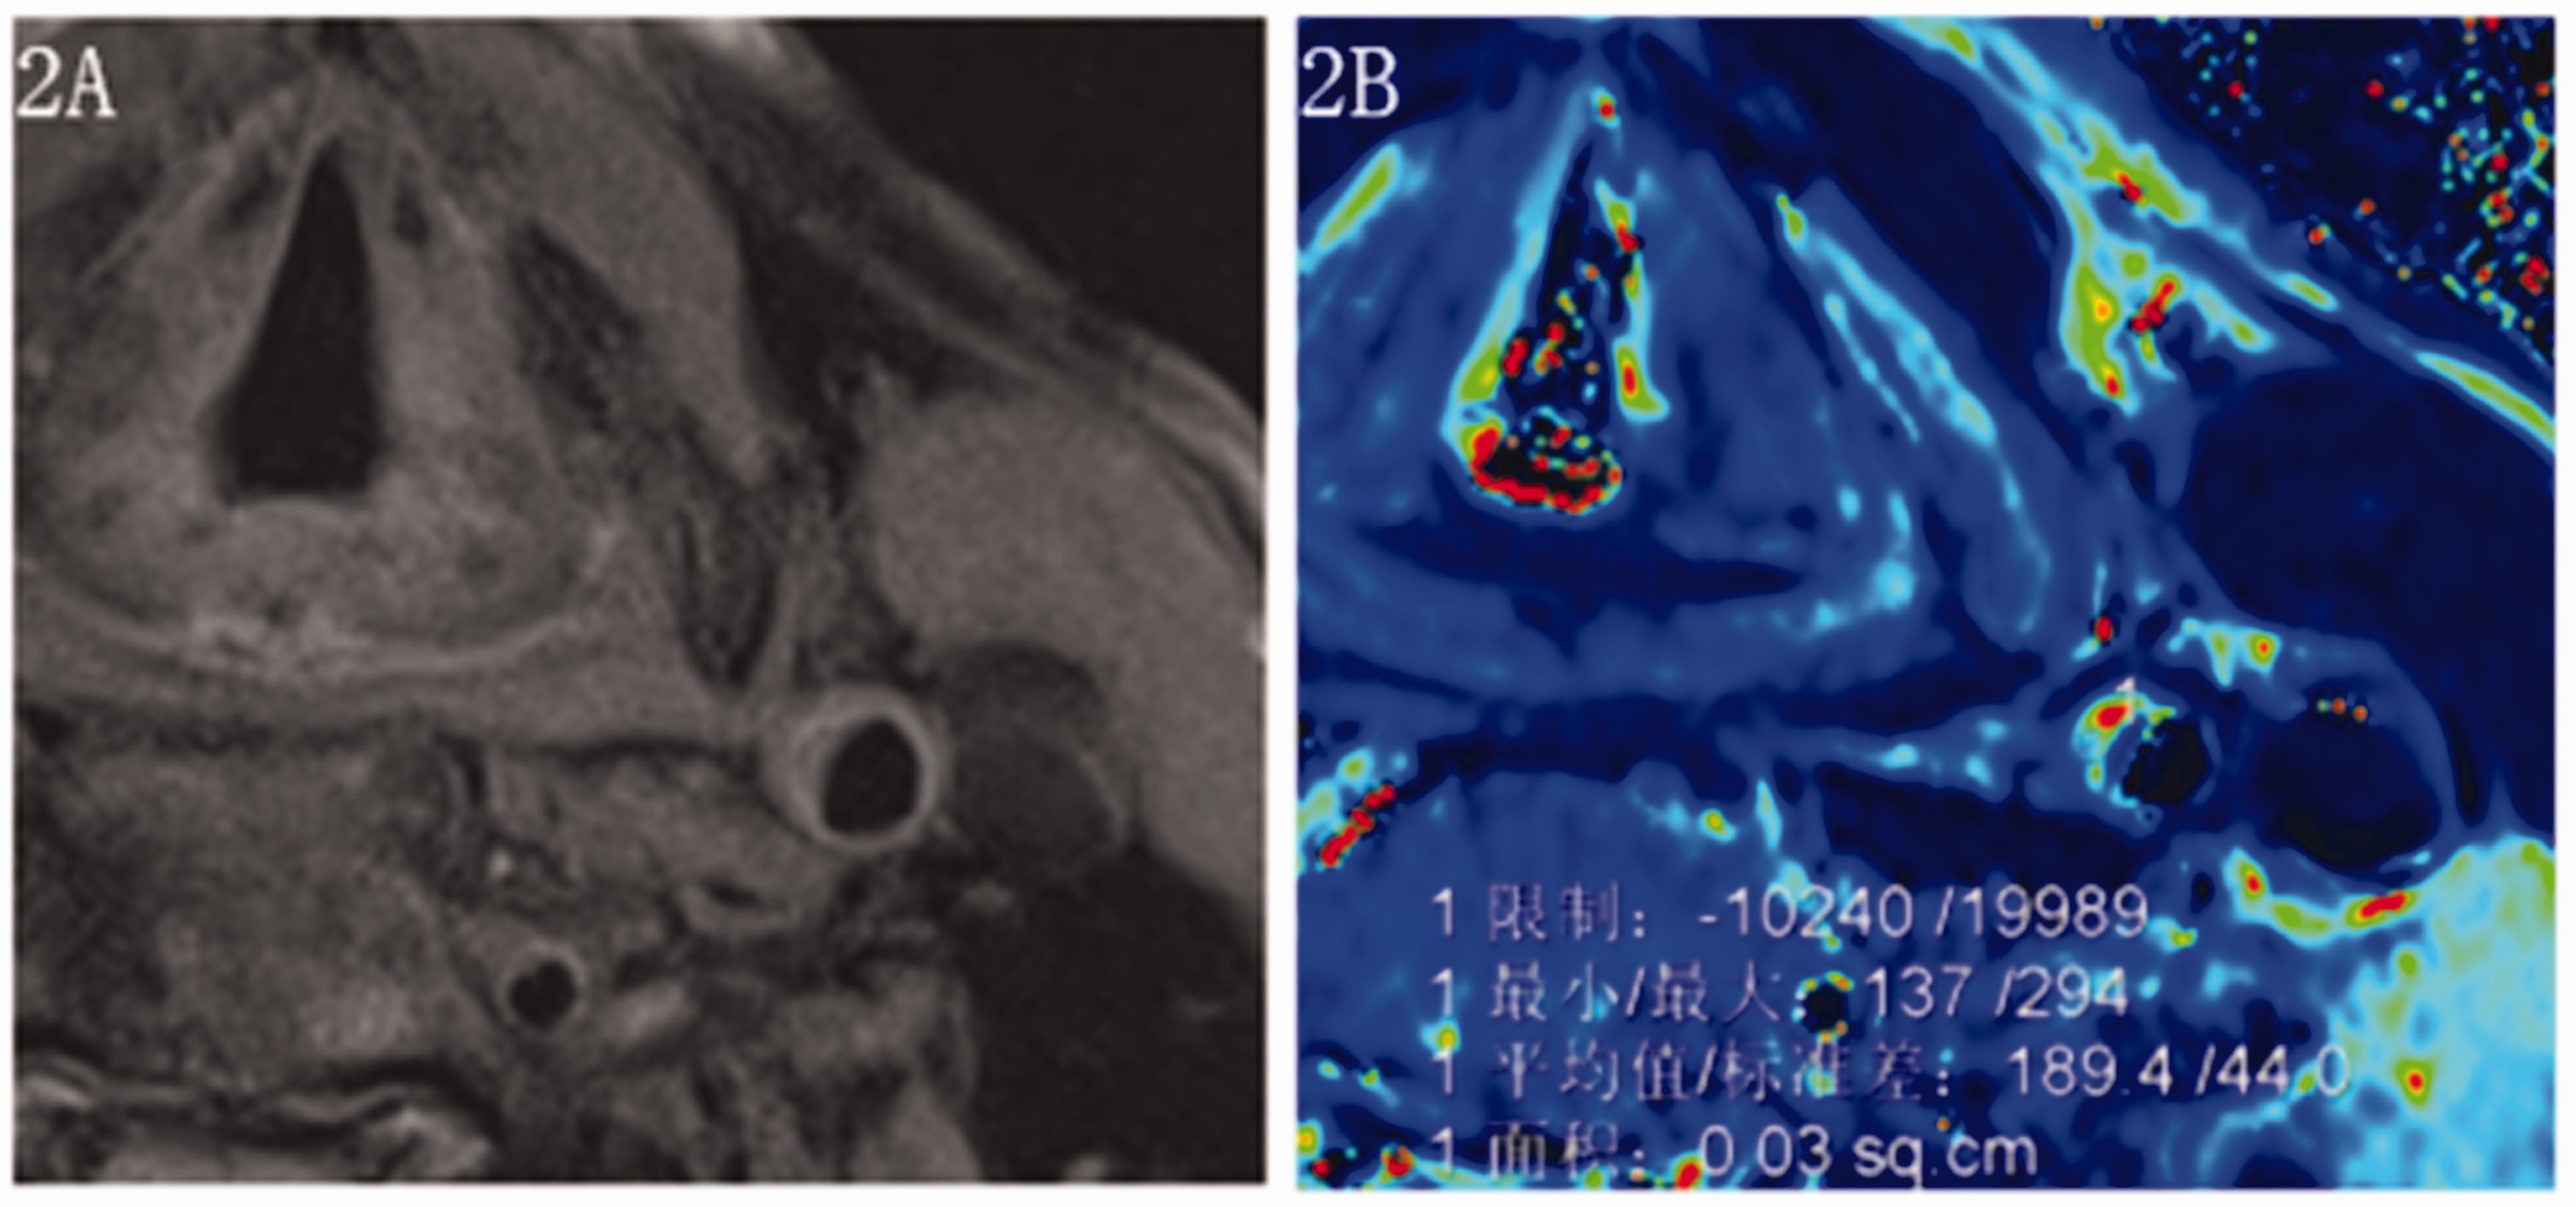
A 76-year old man with paroxysmal awareness blurred with alalia for 2 h. MRI indicated acute cerebral infarction in the left basal ganglia. A homogeneous plaque was observed in the left common carotid artery. The T2 value of the plaque measured at the corresponding position on the T2 maps was 189.4 ms.
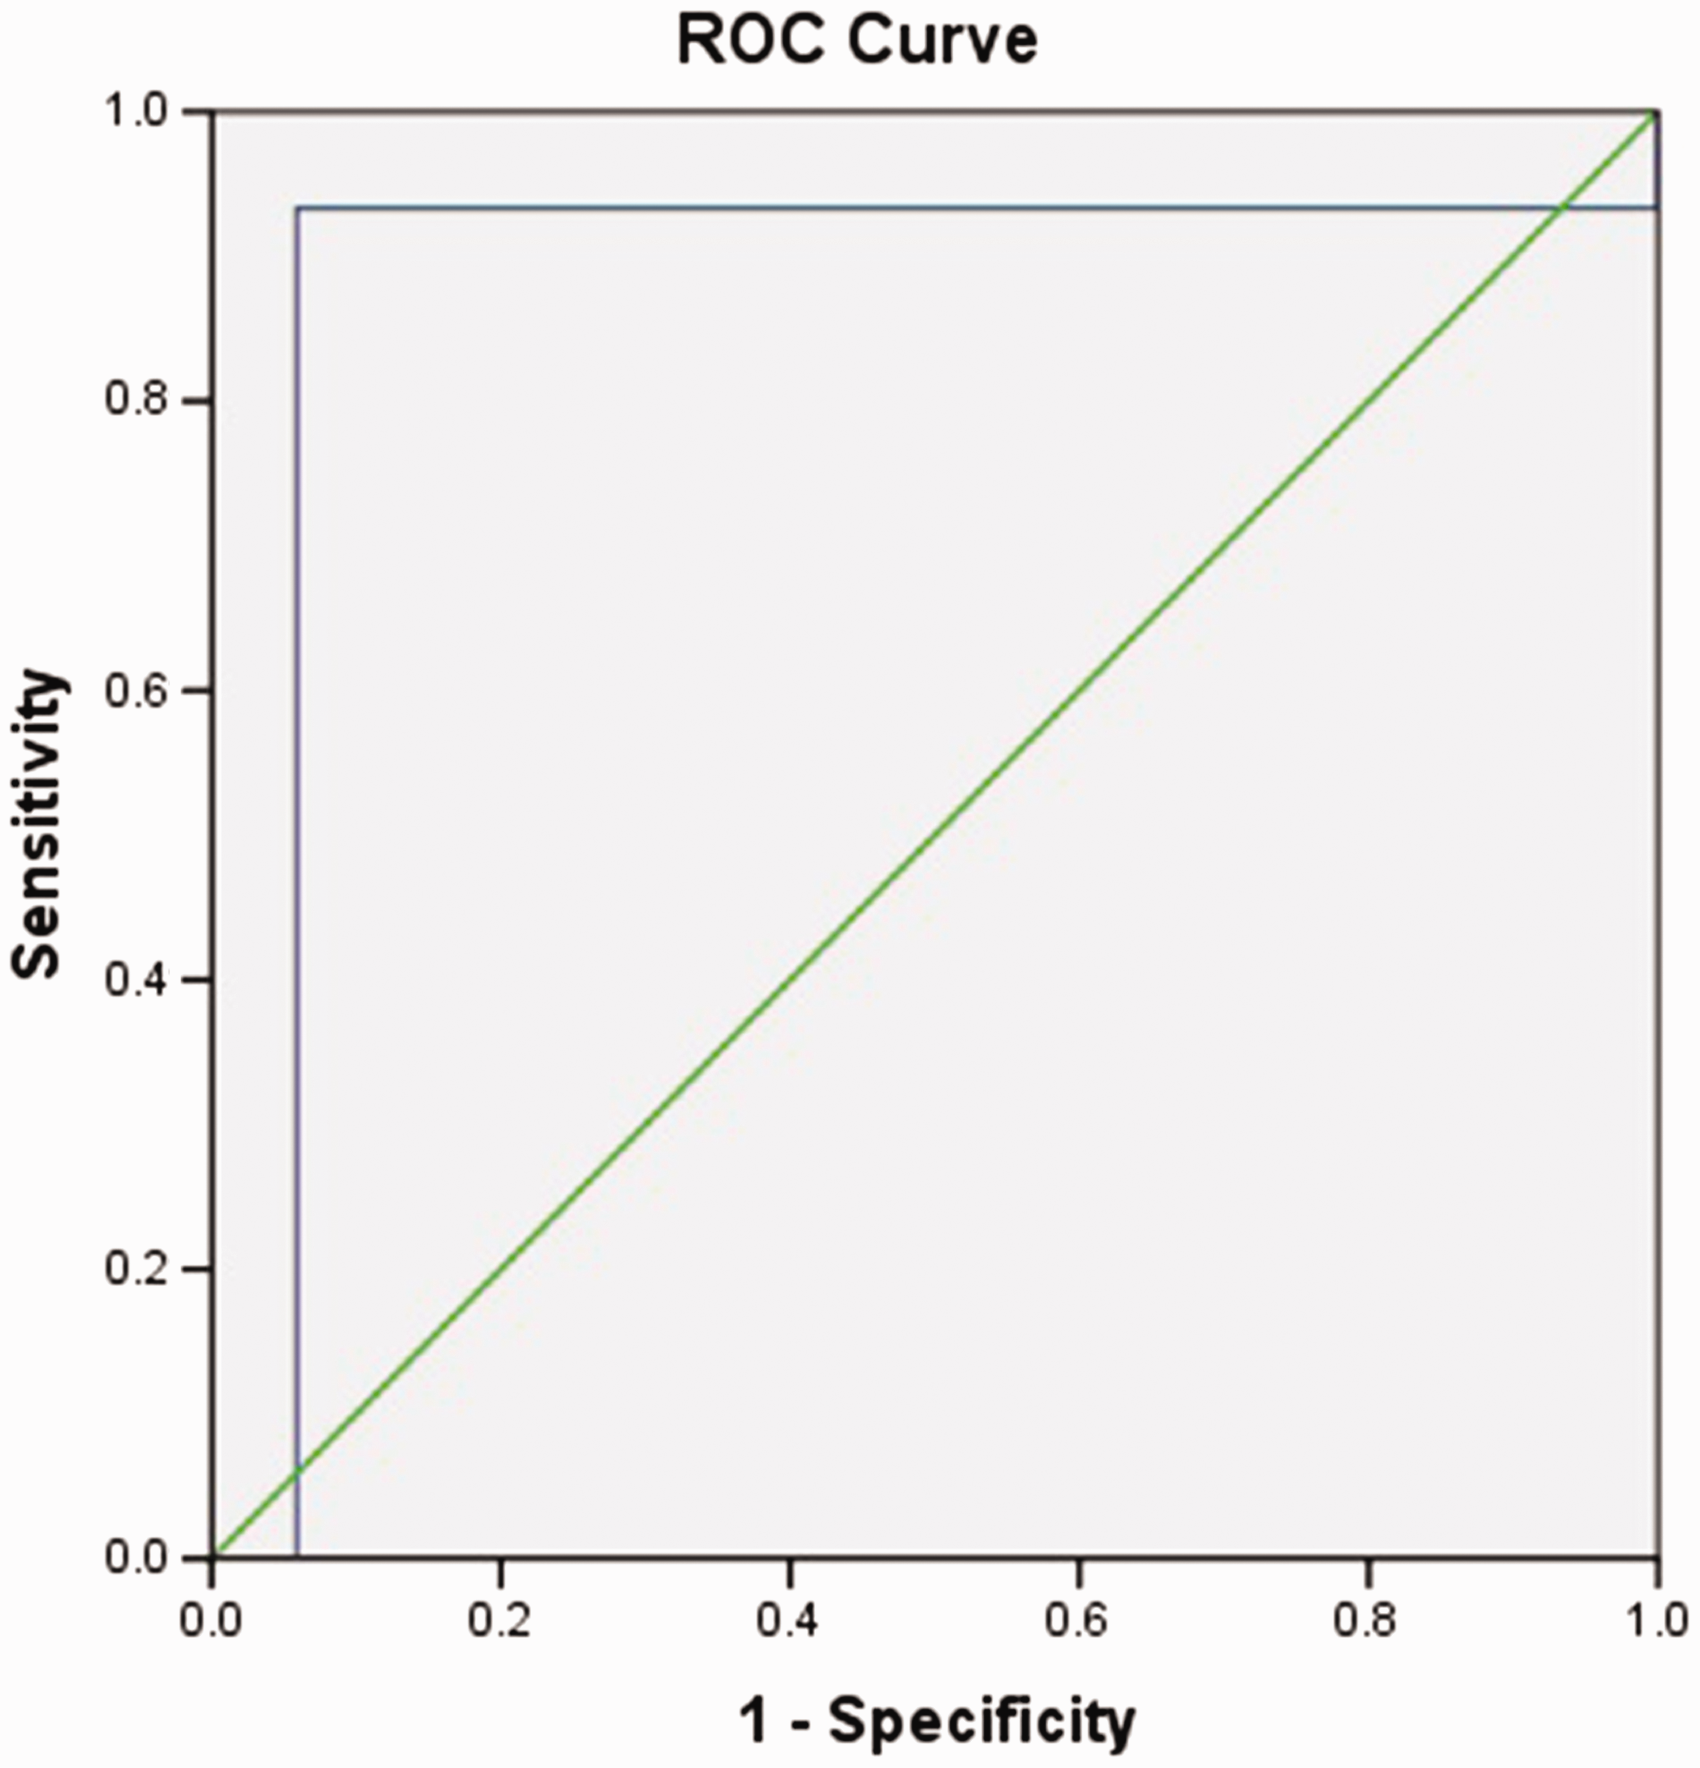
Receiver operating characteristic curve for judging whether cerebral vascular symptoms were caused by T2 values of plaque.
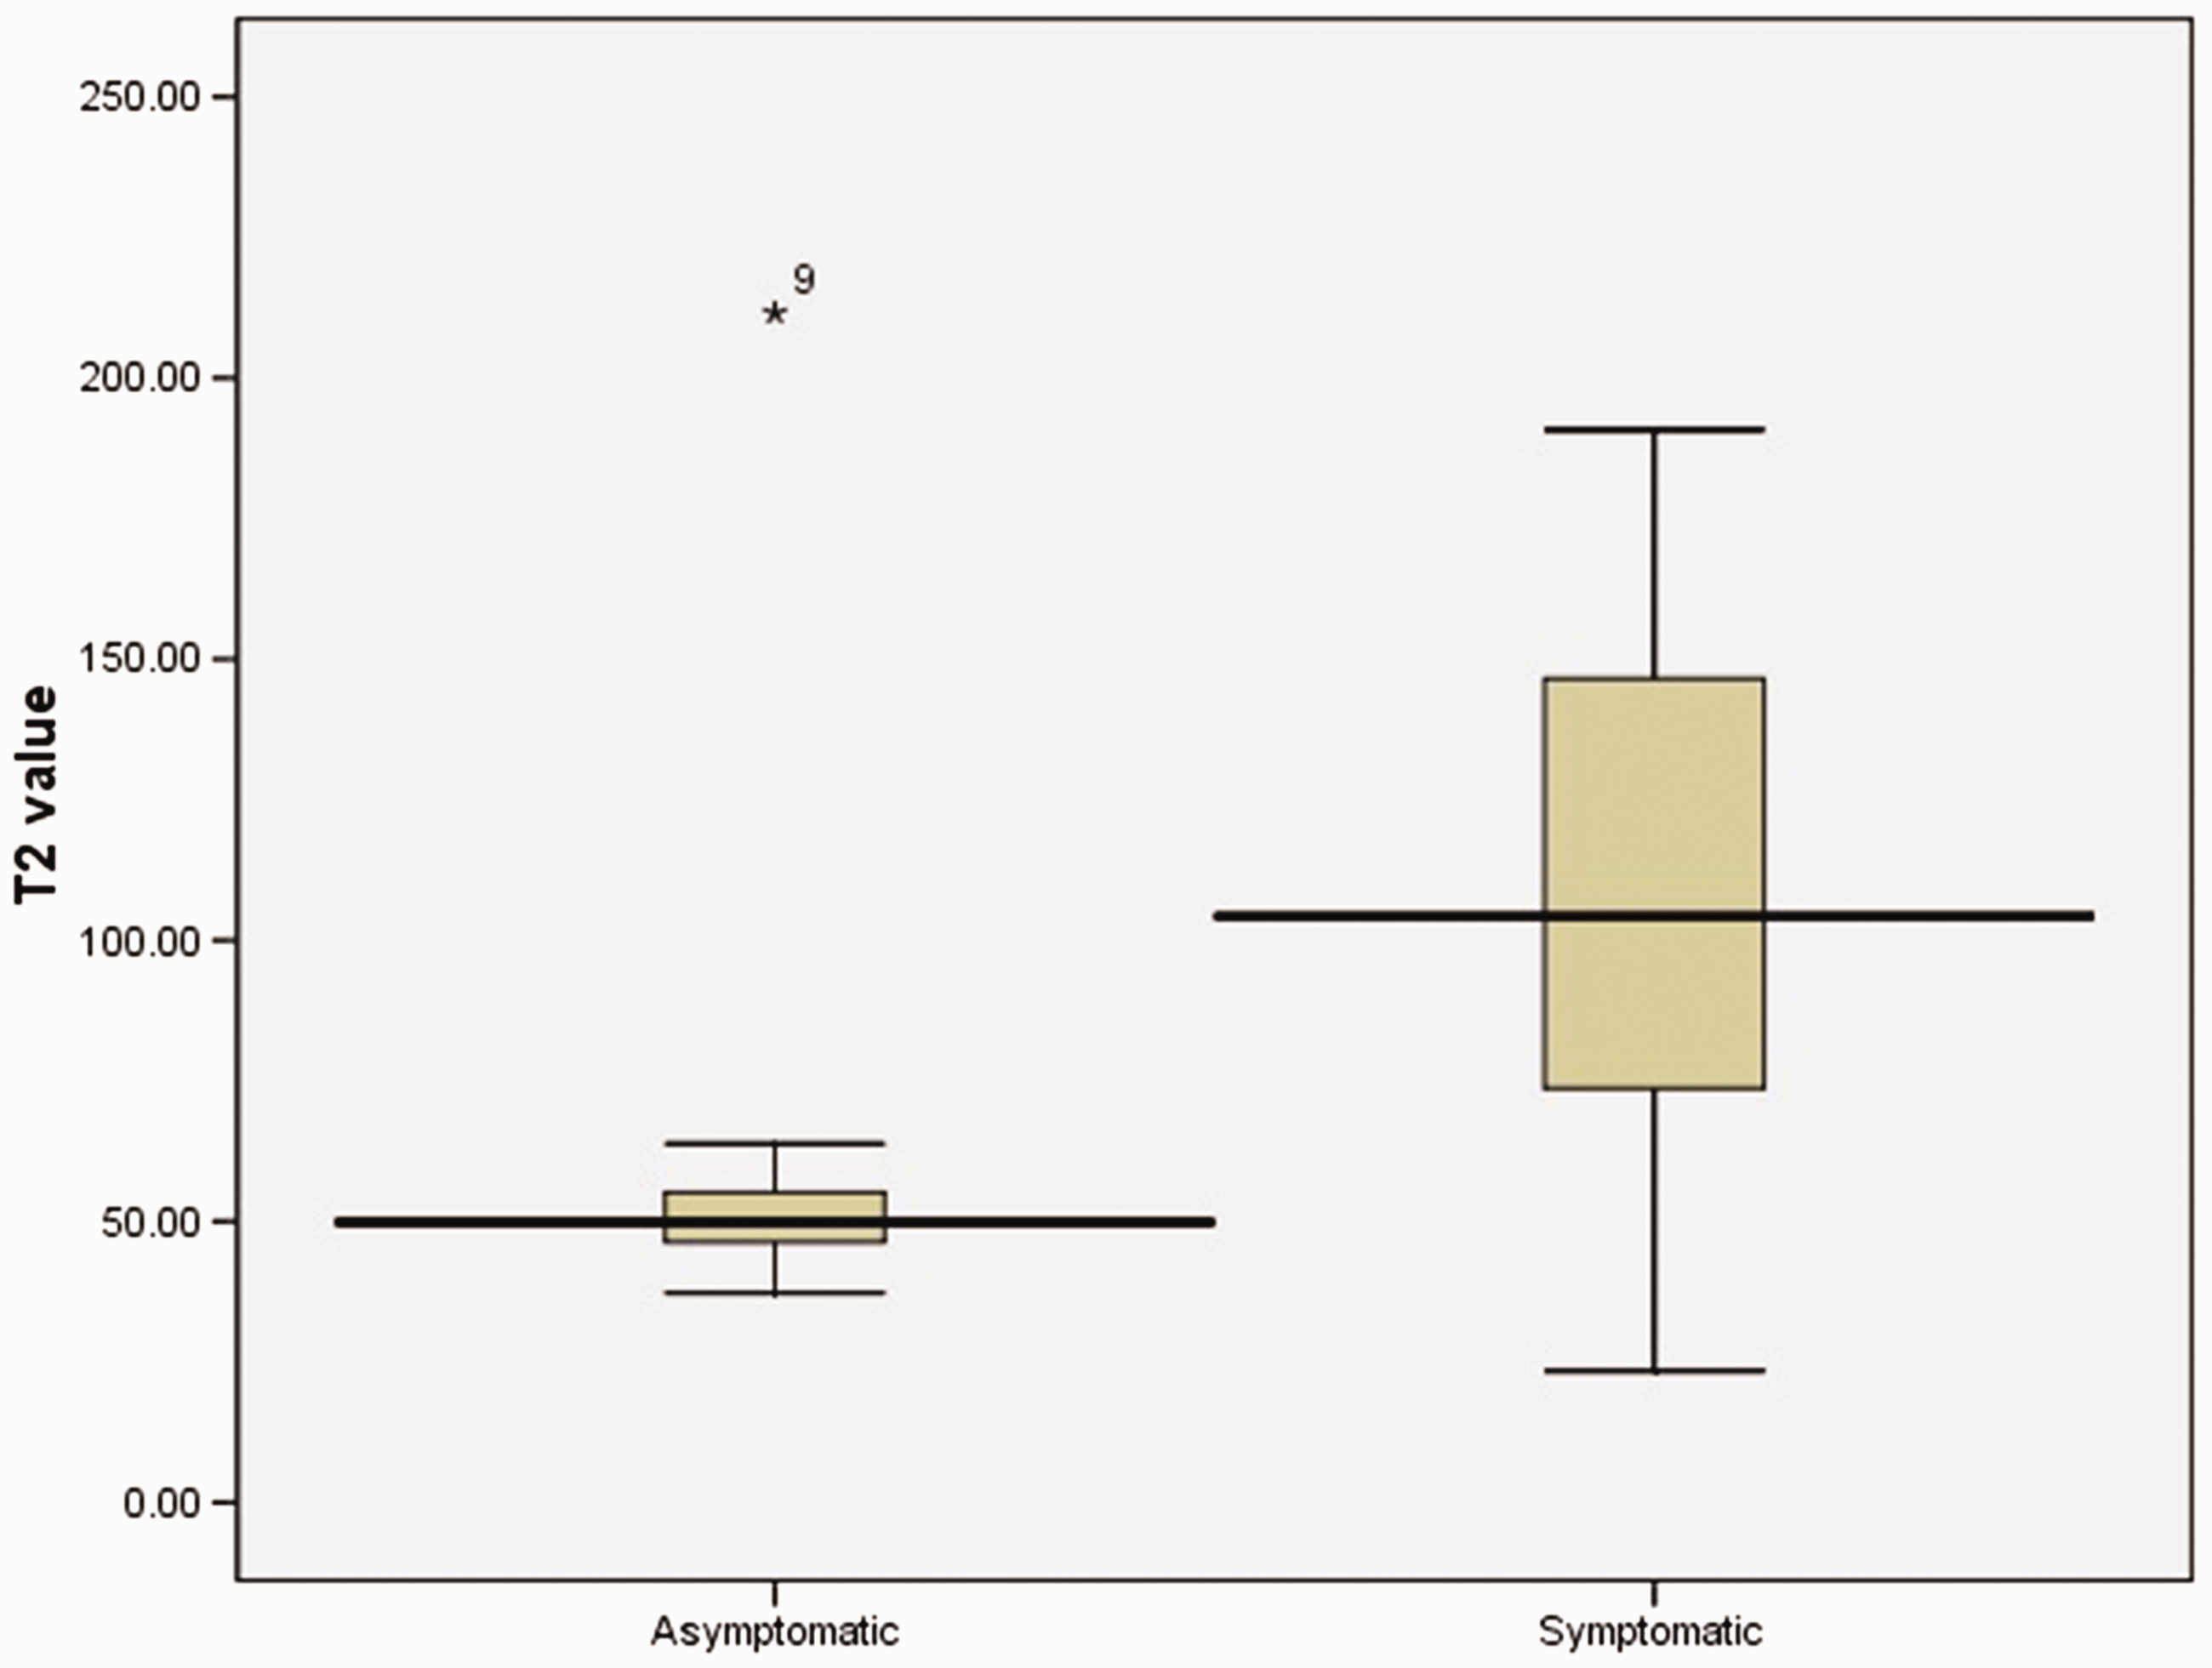
Box diagram of the T2 values of the cervical plaque of patients in the asymptomatic and symptomatic groups.
Discussion
The aim of the present study was to investigate the value of MRI T2-mapping in the evaluation of carotid plaque and to quantitatively analyze the relationship between plaque and cerebrovascular symptoms. In this investigation, high-resolution T2-mapping of the carotid artery was obtained by multi-echo SE sequence in 25 patients with atherosclerosis. T2-mapping had excellent consistency, compared with conventional sequences (T1W imaging, T2-weighted imaging, and proton density-weighted imaging) and 3D-TOF images. Carotid atherosclerotic plaque is a common cause of ischemic stroke. Moreover, the incidence of ischemic stroke is significantly higher in patients with unstable plaque. A previous study showed that unstable plaque was histologically characterized by large lipid cores, infiltration of inflammatory cells, thin or ruptured fibrous caps, and intraplaque hemorrhage (7). Importantly, a close correlation was established between the compositions of the carotid atherosclerotic plaque and the subsequent cerebrovascular events (8).
Carotid T2-mapping technology can identify different types of plaque and automatically define the threshold for segmentation of the plaque tissue composition (3). The direct measurement of T2 relaxation time of different plaque tissues and the quantitative analysis of plaque composition showed high repeatability (9). In addition, this absolutely physical measurement could standardize different CMR research systems and multicenter studies, enabling the comparisons and analyses of different research results. Furthermore, it is of great value for longitudinal research.
Degnan et al. (5) found that the lipid-rich necrotic core and fibrous tissue had lower and higher T2 relaxation time than other plaque components, respectively, on the studies of isolated carotid plaque. The results from Biasiolli et al. (3) showed that the T2 values of rich in the core of lipid necrosis, fibrous tissue, and intraplaque hemorrhage were approximately 36 ± 5 ms (55 ± 9 ms) and 89 ± 20 ms, respectively. However, it was of great importance to focus on the temperature and fixation, which significantly affected plaque tissue samples comparing in vivo and in vitro plaque T2 values (10). Therefore, some plaques had slightly larger T2 values during the course of measurement in this study, which, as a whole, were still consistent with the reports from foreign related literature (3,5). The proportions of plaque bleeding and thrombus in damaged plaques were significantly higher than those in undamaged plaques (11). In this study, the T2 value of the plaque in the symptomatic group was 111.43 ± 46.54 ms, higher than that in the asymptomatic group (59.25 ± 39.77 ms), which might reflect the instability of the plaque with bleeding components in the symptom group. On the other hand, in the asymptomatic group, the plaque with lower T2 values might have been stable plaque with fibrous tissue components. The cholesterol and phospholipid released from the bleeding red blood cells the in plaque could have caused the expansion of the lipid core, promoted the accumulation of inflammatory cells, and increased the plaque instability (12). Recurrent plaque hemorrhage can enlarge the plaque volume and the lipid necrosis core, accelerating plaque progression (13). Recurrent hemorrhage is considered a complication of necrosis of the lipid core, which could increase the mean T2 values of the plaque. Therefore, the plaques in the symptomatic group might have also been accompanied by necrosis of the lipid core with recurrent hemorrhage. Our ROC analysis showed that the T2 value of 65.38 ms was the optimal threshold for the prediction of cerebrovascular symptoms; its specificity, sensitivity, and accuracy were 94.1%, 93.3%, and 93.8%, respectively.
Therefore, the T2-mapping technology based on the multi-SE sequence could be used to quantitatively analyze carotid atherosclerotic plaque. In this study, the T2 value of the carotid plaque was related to the severity of cerebrovascular symptoms and the T2 value of the carotid plaque in symptomatic patients was higher than that in asymptomatic patients.
This study had some limitations. First, the sample size of the group was small while the coefficient of variation of the statistical results was large. Moreover, class I or II mistakes tended to occur. Thus, expansion of the sample size is required for a further study. Second, plaques were not compared histopathologically and a confirmation is needed by further animal studies. Finally, the fresh intraplaque hemorrhage combined the core of lipid necrosis is short T2 signal (13), which was difficult to detect on T2-mapping and needed to be recognized combined with T1W imaging.
In conclusion, the findings from the present study are of great value for the risk assessment of ischemic stroke secondary to plaque rupture. Meanwhile, it might also provide a new opportunity for quantifying MRI of carotid atherosclerotic plaques, which would be useful for clinical studies evaluating the biological characteristics of emerging drugs directly targeting plaque (14).
Footnotes
Declaration of conflicting interests
The authors declared no potential conflicts of interest with respect to the research, authorship, and/or publication of this article.
Funding
The authors received no financial support for the research, authorship, and/or publication of this article.