
Abstract
Background
Bone marrow composition varies with stage of development.
Purpose
To assess differences in apparent diffusion coefficient (ADC) derived from clivus bone marrow in healthy children by age, pubertal status, and gender as a benchmark when monitoring local and systemic treatment-induced effects.
Material and Methods
Non-oncological pediatric patients (30 pre-pubertal [15 girls, 15 boys] and 30 post-pubertal [15 girls, 15 boys]) with previous normal magnetic resonance imaging (MRI) of the brain including diffusion-weighted magnetic resonance imaging (DW-MRI; 1.5-T Philips Achieva-Ingenia, b-values 0 and 1000s/mm2) were studied. A 4–6 mm diameter region of interest (ROI), drawn within the clivus on two or three DW-MRI slices, yielded mean and centile ADC values. Pubertal status was recognized from imaging appearances of the pituitary gland and from fusion of the spheno-occipital synchondrosis. Correlations between ADC and age were assessed (Pearson’s coefficient). Mann–Whitney U tests compared ADC by age, pubertal status, and gender.
Results
Age and ADC were significantly negatively correlated (median ADC r=–0.48, mean ADC r=–0.42, P=0.0001 and 0.0008, respectively) which held true when divided by gender. Mean and median ADC differed significantly before and after puberty for the whole population (P=0.0001 and 0.0001, respectively). There was a left shift of the ADC histogram after puberty with significant differences in centile values. ADC differences before and after puberty remained when divided by gender (girls: P=0.04 and 0.009, respectively; boys: P=0.005 and 0.0002, respectively).
Conclusion
ADC of clivus bone marrow correlates with age in children. ADC decreases significantly after puberty, likely due to replacement of hypercellular marrow with fat. There are no gender-related differences in clivus bone-marrow ADC before or after puberty.
Keywords
Introduction
Bone marrow composition varies with biological and physiological requirements at different stages of development (1). Hematopoietic cells appear within the medullary cavities of bones at around 14 weeks of gestation (2). By birth, the bone marrow represents the principal anatomical location of hematopoiesis. The marrow space occupied by hematopoietic cells diminishes from 90% at birth to approximately 50% at the age of 30 years and 30% at the age of 70 years as it becomes progressively replaced by fat (3,4). The relative proportion of marrow hematopoietic components versus fat components also classically depends on the type of bone (long, short, flat, and irregular). Until puberty, the entire skeleton remains hematopoietically active, but by the age of 18 years, the production of blood cells persists only in the vertebrae, ribs, sternum, skull, pelvis, proximal humeral, and femoral epiphyses, while bones in other osseous locations undergo fatty infiltration (5). An indication of the proportion of cellular versus fatty component of the bone marrow in children would be informative on the proliferative state of the bone marrow and on changes that occur as a result of therapy.
Diffusion-weighted magnetic resonance imaging (DW-MRI) uses non-ionizing radiation without administration of extrinsic contrast agents to characterize tissues. Its quantified metric, the apparent diffusion coefficient (ADC), has been strongly linked to cell density of tissues (6). Moreover, the sequence uses a fat suppression pulse, so that fat interspersed within tissue results in a reduction in ADC. Although there is no direct quantification of fat, lower ADC values have been used as a surrogate for the appearance of fat within bone marrow of the axial and appendicular skeleton in several studies in adults (7,8). There are limited data on ADC values in normal, healthy children (9), but no studies to date have documented differences in cellular versus fat components of bone marrow in children by age, pubertal status, and gender.
This work retrospectively studied bone marrow in the skull because DW-MRI forms a routine part of brain imaging in children. The flat shape of the skull bones meant that region of interest (ROI) delineation in the skull was best done in the clivus. This area of the skull base represents one of thickest bones within the cranium, making ROI in multiple adjacent slices with an interval of 5 mm feasible. Additionally, its midline location means that the clivus is routinely included in the field of irradiation as a treatment for brain tumor, making it ideally placed for the measurement of treatment-related ADC changes in future studies. The aim of the present study was to assess the differences in ADC derived from the bone marrow of the clivus in a healthy pediatric population by age, pubertal status, and gender.
Material and Methods
Patient selection
Non-oncological pediatric patients who previously had brain MRI for clinical purposes and in whom DW-MRI was routinely performed as part of the examination were studied. The study was approved by the Institutional Review Board and the need for written consent was waived.
Inclusion and exclusion criteria chosen were to allow the retrospective selection of a cohort of pediatric patients (aged 5–17 years) with normal MRI brain scans (n = 60) with DWI that was artefact-free. Electronic patient records were assessed to confirm clinical presentation and any follow-up diagnosis. Indications for MRI were headaches, transient neurological symptoms, syncopal episodes, and possible seizures (but with normal electroencephalogram). Patients with any condition that might affect the bone marrow (infection, bone lesions at any site, systemic diseases, oncological diagnosis, or on medication) were excluded. Of 1140 children identified on the database over a two-year period (1 March 2016 to 31 March 2018), 60 individuals met these stringent exclusion criteria, all of whom were included in the analysis.
Image acquisition
All children had been scanned on a 1.5-T Philips Achieva-Ingenia upgraded to d-stream (digital rf) platform. Their examinations were anonymized and transferred to a research imaging repository at The Institute of Cancer Research through a secure web-based data analysis platform. Axial single-shot echo-planar diffusion-weighted images (b-values = 0 and 1000 s/mm2) were routinely acquired as part of the standard MRI brain scan. The voxel resolution was 0.9375 × 0.9375 × 4 mm. Axial T2-weighted (T2W) spin-echo (SE) and fluid-attenuated inversion recovery (FLAIR), as well as sagittal T1-weighted (T1W) SE and coronal T2W SE images were acquired in each case. In individuals aged > 16 years, the sagittal T1W SE was replaced by T2W SE. These images were part of a standard anatomical protocol for brain imaging and were not optimized for bone marrow study; they were not utilized in this study.
Image analysis
T2W images were used to identify the exact location of the clivus. The axial DW images were then correlated with morphological T2W images. A circular ROI of 4–6 mm in diameter was drawn within the clivus on the DW images (EP, pediatric radiologist with two years of experience) using in-house software (Adept®, The Institute of Cancer Research, UK). Care was taken to include the maximum number of pixels from clival marrow while avoiding contamination from surrounding bony cortex (Fig. 1). In 58 cases, this was possible on two central slices; in two cases, ROIs were possible in three adjacent slices. To avoid including artefacts, the ROIs were drawn within the clivus at the level of the fossa navicularis. Use of the high b-value image for ROI definition rather than the ADC map ensured reliable placement within the high signal of clivus marrow. Each patient measurement to review images, plan ROI placement and extract and tabulate the ADC values took approximately 15 min. To determine inter-observer variability of the measurement, a second observer (NdS, MR radiologist with 25 years of experience, non-specialist in pediatric neuroradiology) independently drew an ROI within the clivus on a single central slice of the DW images in a randomly selected subset of 20 individuals (five from each group). Data from the entire volume of the ROIs were extracted and the ADC calculated on a voxel-by voxel basis using a mono-exponential fit of the data. This yielded a range of ADC values for each individual from which median, mean, 10th, 25th, 75th, and 90th percentiles were derived. Traditional ADC maps were also created.
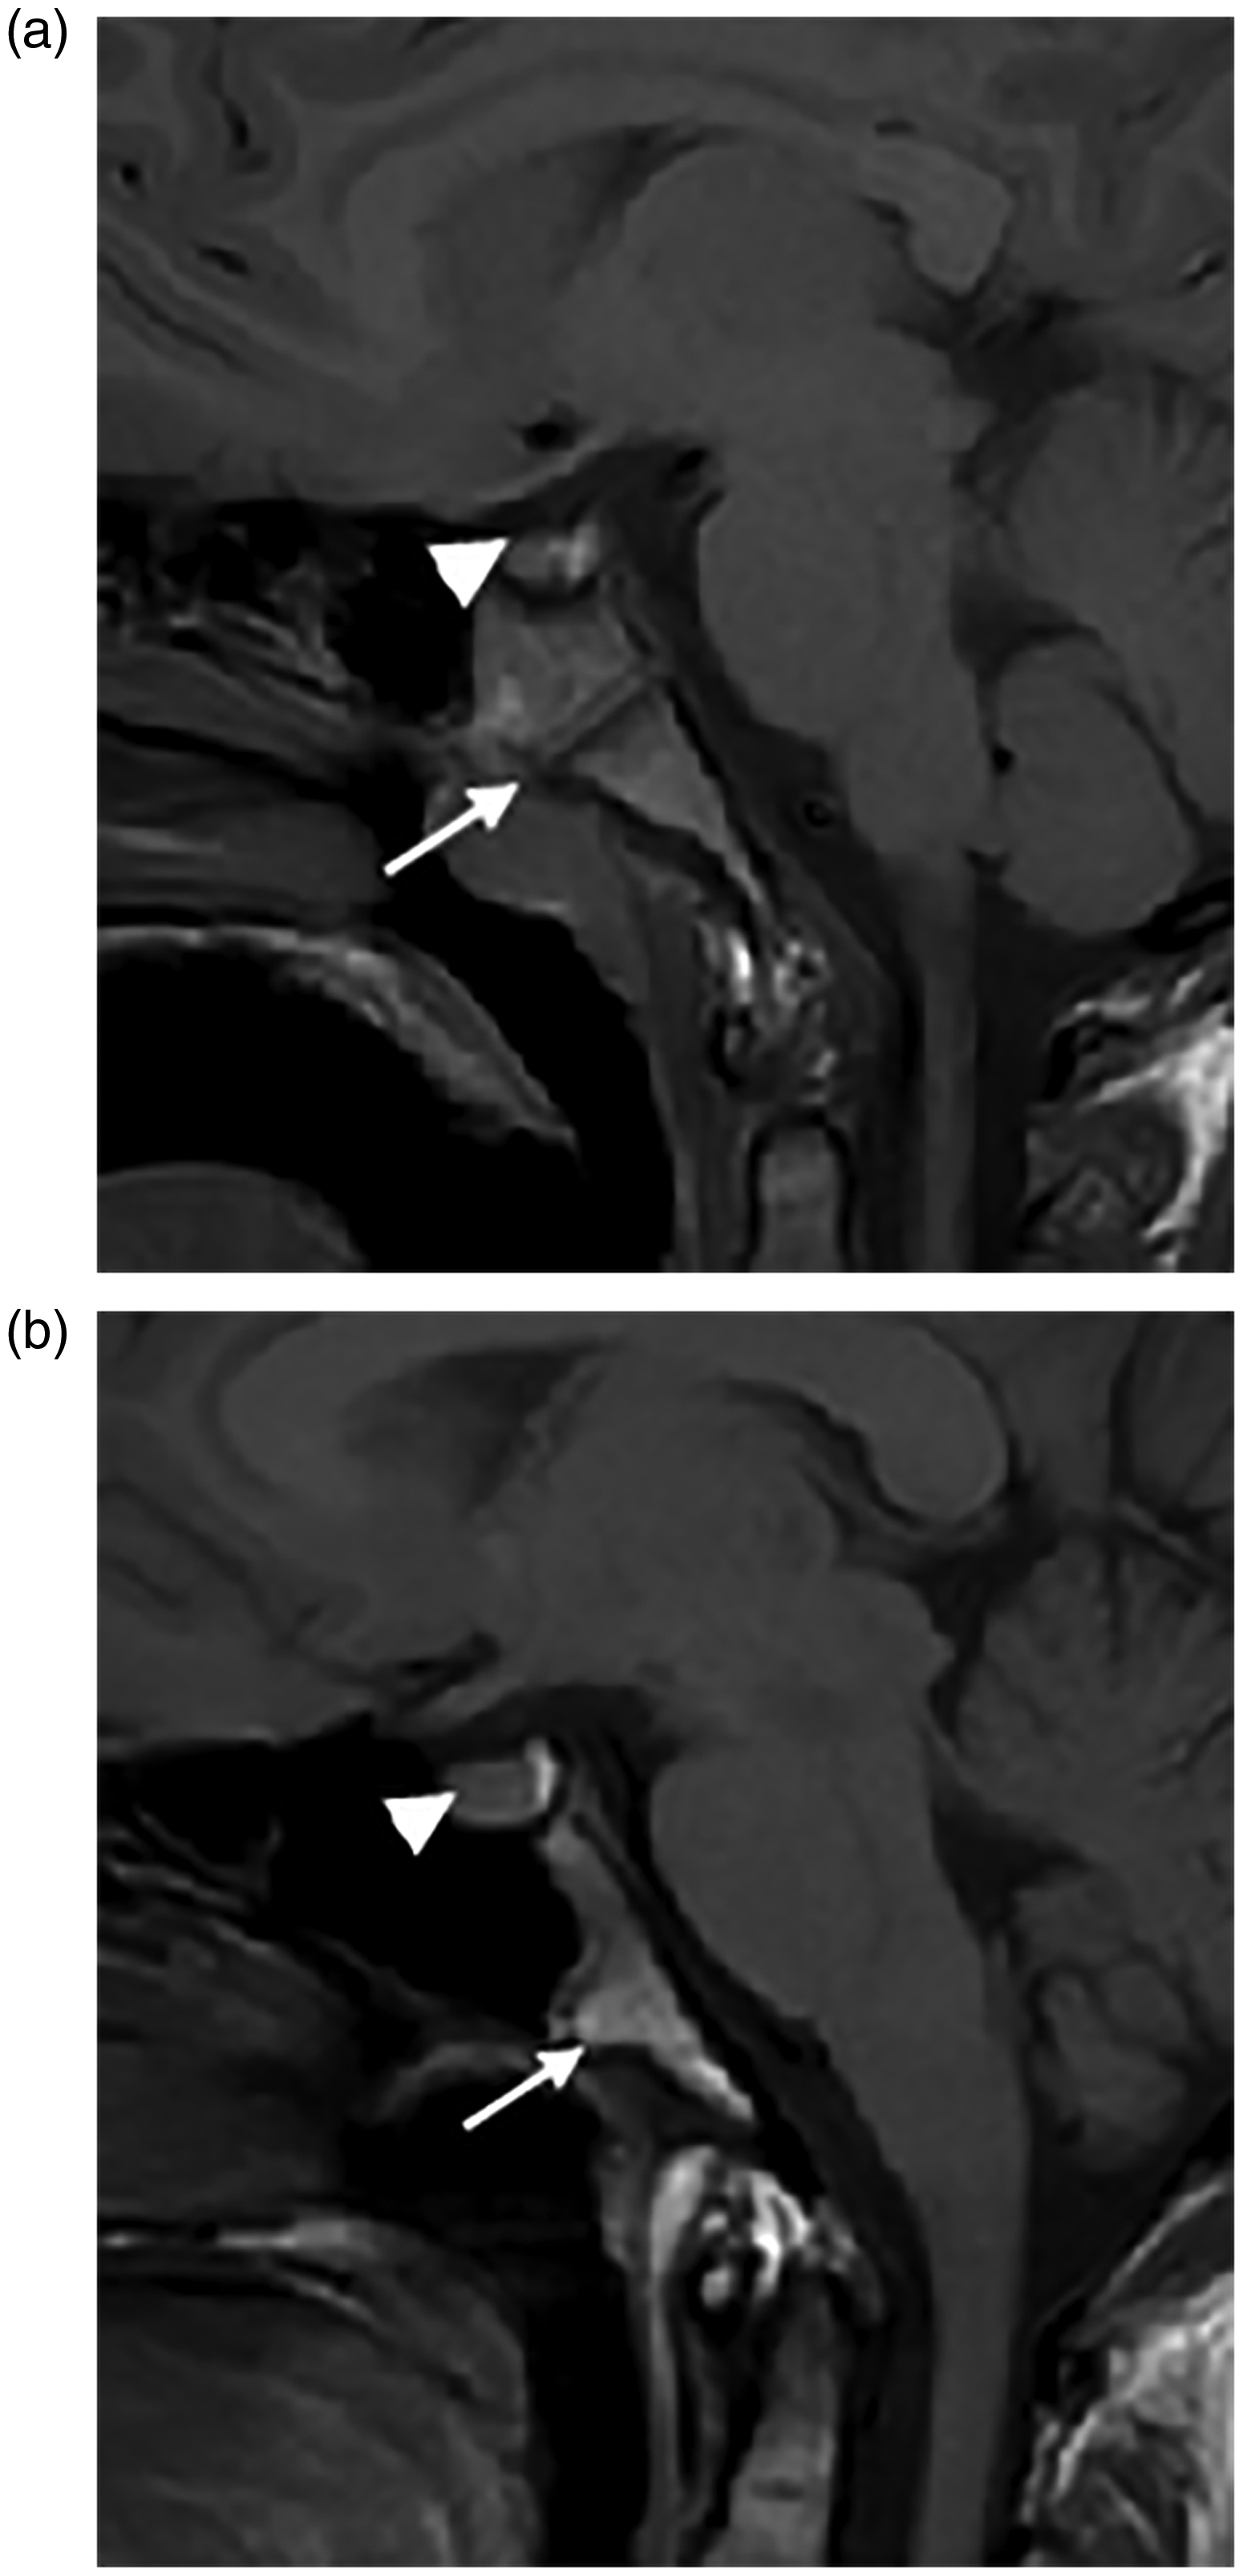
Sagittal T1W midline images through the clivus in a seven-year-old girl (a) and a 16-year-old girl (b). (a) The superior aspect of the pituitary is flat (arrowhead) and the synchondrosis is unfused (Stage 0, arrowhead). (b) The superior aspect of the pituitary bulges upward (arrowhead) and the synchondrosis is fused (arrow).
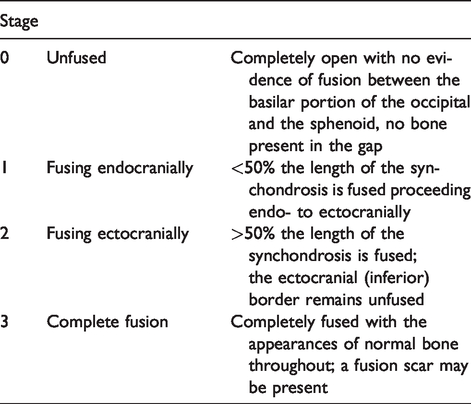
Recognition of pubertal status was radiological in the 10–17-year-old age group. Puberty was determined from the imaging appearances of the anterior pituitary gland (convex bulging above the sella superiorly) together with spheno-occipital synchondrosis fusion (Fig. 1). At puberty, there is physiological enlargement of the anterior pituitary gland, often more notable in girls, when the gland develops a convex superior border and often bulges just out of the sella. The appearance of the anterior pituitary gland was assessed on both sagittal (T1W images if aged < 16 years and T2 if older as per adult MR routine protocol) and coronal T2W images (10). In addition, the maturation stage of spheno-occipital synchondrosis closure was assessed on the sagittal MR images (Table 1). Its relationship to puberty has been described in a recent study and proposed on computed tomography. Stages 0 and 1 were considered pre-pubertal and stages 2 and 3 post-pubertal (11).
Staging system for pubertal status based on spheno-occipital synchondrosis closure on imaging (adapted from Alhazmi et al. (11)).
Data Analysis
Statistical analysis was performed using Excel and GraphPad Prism software (version 7.04, GraphPad, San Diego, CA, USA). Descriptive statistics were used to describe the data. Data were checked for normality (D’Agostino and Pearson normality test), although the data from female patients were normally distributed and those from male patients were not. Therefore, a Mann–Whitney U test was used to compare groups. A Pearson’s correlation coefficient examined the relationship between ADC and age.
Results
Of the 60 children who met the selection criteria, there were 15 aged 5–9 years (eight girls, seven boys), 15 pre-pubertal aged ≥10 years (seven girls, eight boys), 15 post-pubertal girls, and 15 post-pubertal boys.
The number of voxels included in each case was in the range of 21–182 and was significantly different among the groups (5–9 years: mean ± SD = 78.8 ± 30.8; pre-pubertal aged ≥10 years: mean ± SD = 57.1 ± 12.4; post-pubertal girls: mean ± SD = 40.5 ± 7.2; post-pubertal boys: mean ± SD = 39.5 ± 14.7; P < 0.0001).
Inter-observer variability (95% limits of agreement) was in the range of –11 to +13% for median ADC values and –13 to +14% for mean ADC values (Fig. 2).
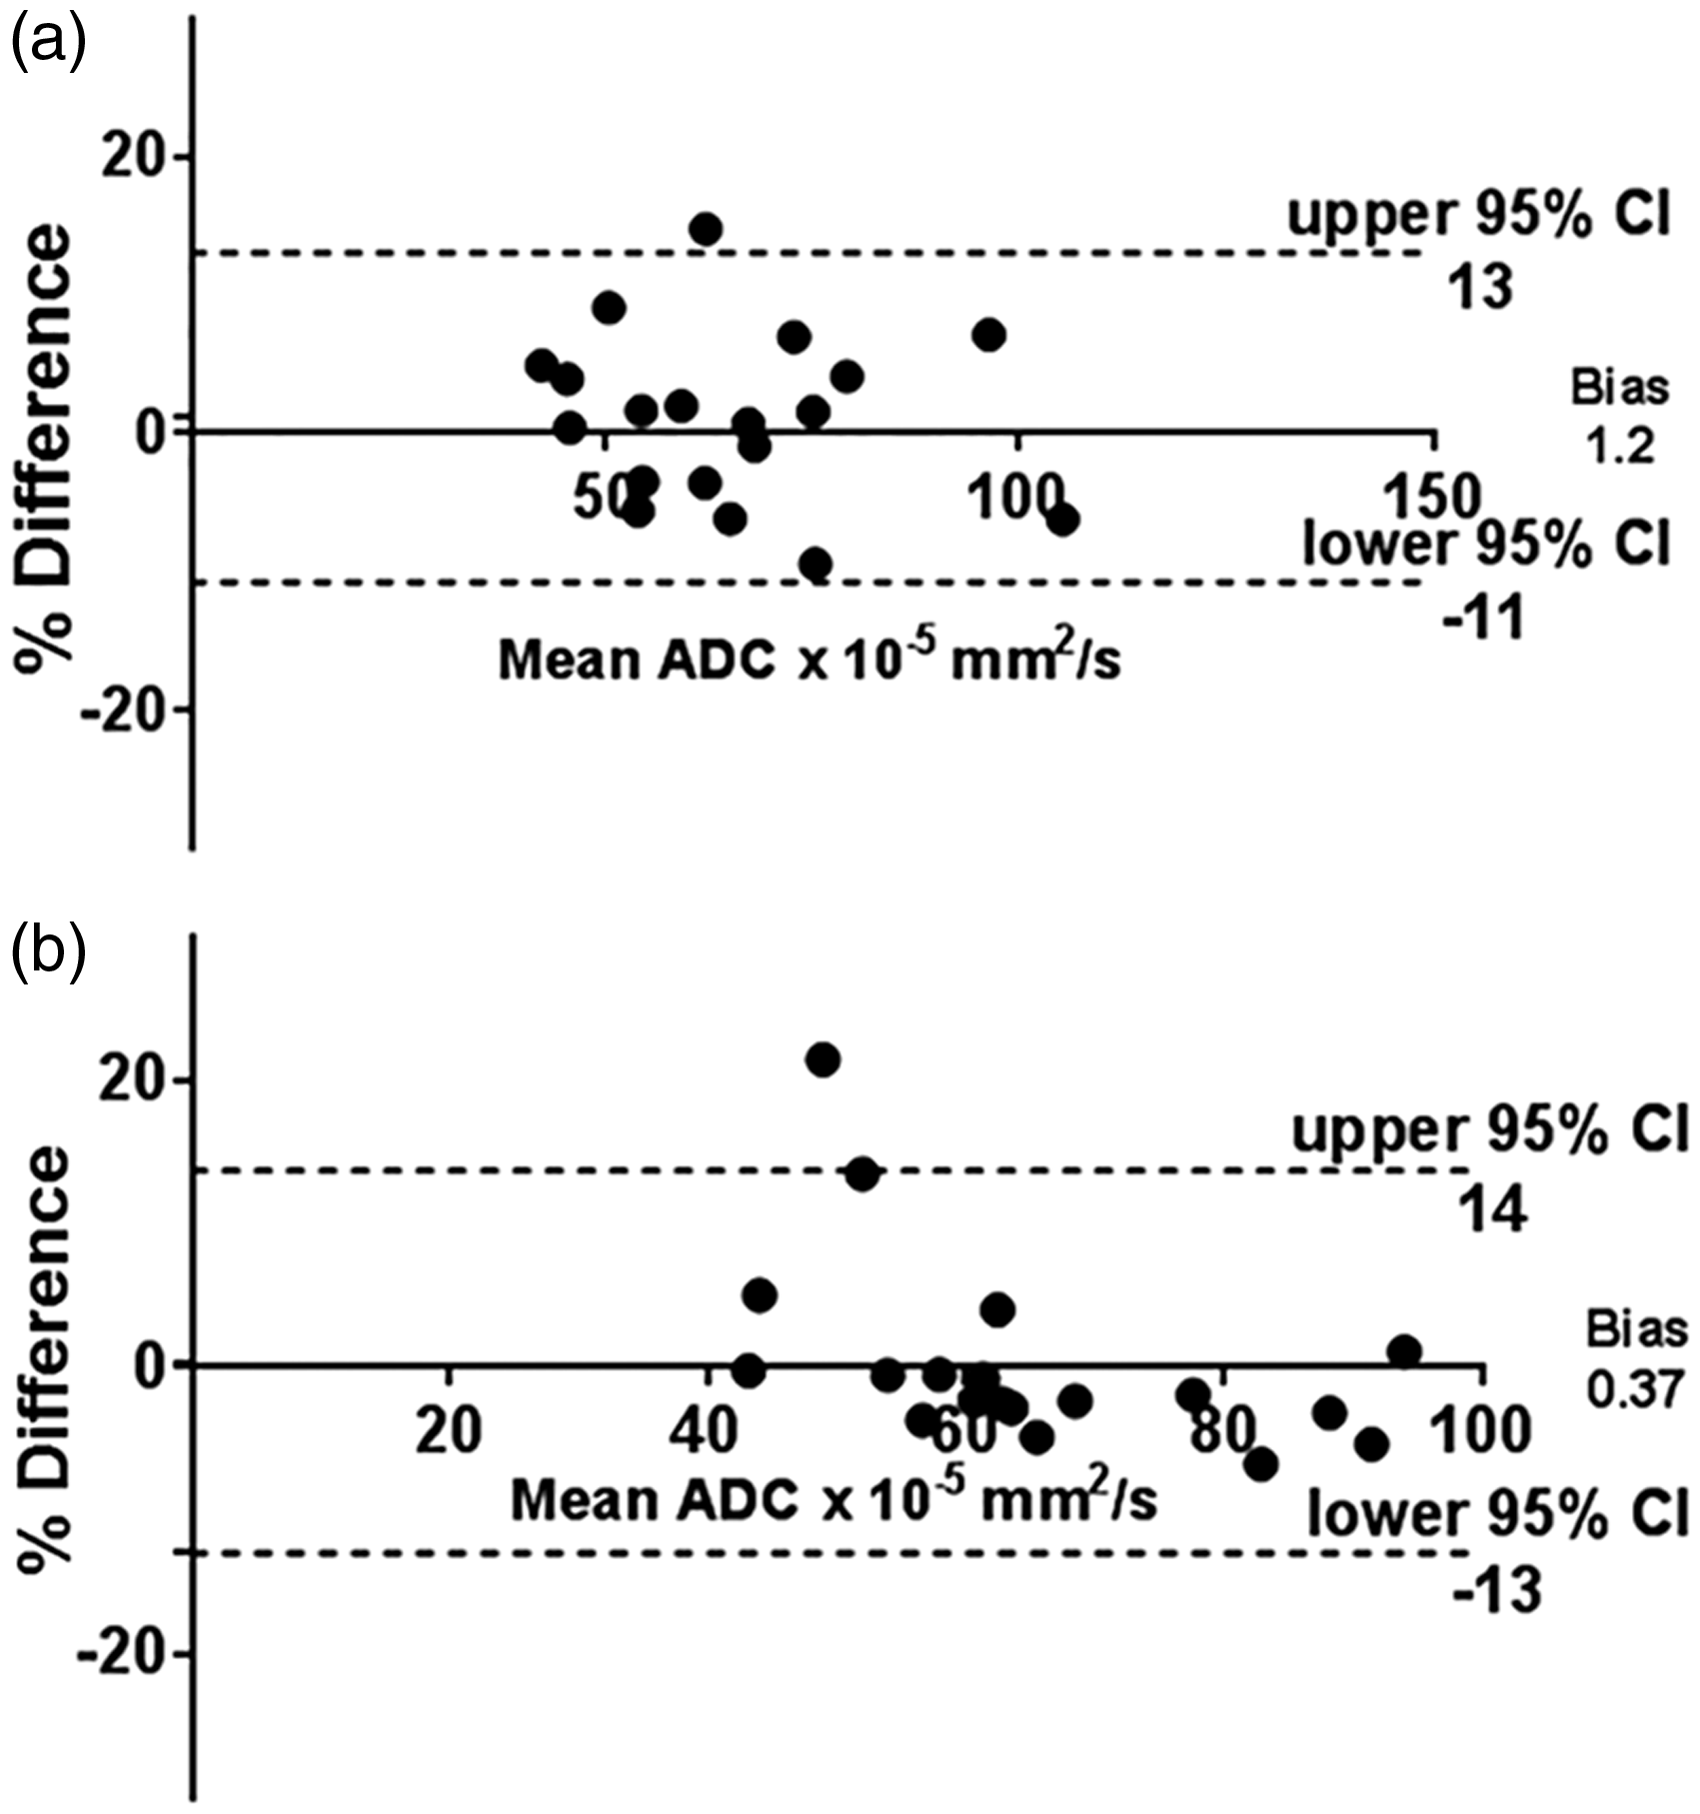
Bland–Altman plots (difference between two measurements vs. their mean) showing the variability of the ADC median values (a) and ADC mean values (b) from clivus marrow when derived by two independent observers. Data were obtained in a subset of 20 randomly selected patients (five from each group). All 95% CIs representing the limits of agreement were less than ±15%.
Variation with age
The age range of patients was 5.0–17.9 years (median age = 12.4 years). There was a significant negative correlation between age and ADC for the whole cohort (r = –0.48 for median and –0.42 for mean values, P = 0.0001 and 0.0008, respectively). There was also a significant negative correlation between age and ADC for girls (r = –0.5 for median and –0.4 for mean values, P = 0.005 and 0.03, respectively) and for boys (r = –0.53 for median and –0.48 for mean values, P = 0.002 and 0.008, respectively). Regression plots for median values are illustrated in Fig. 3.
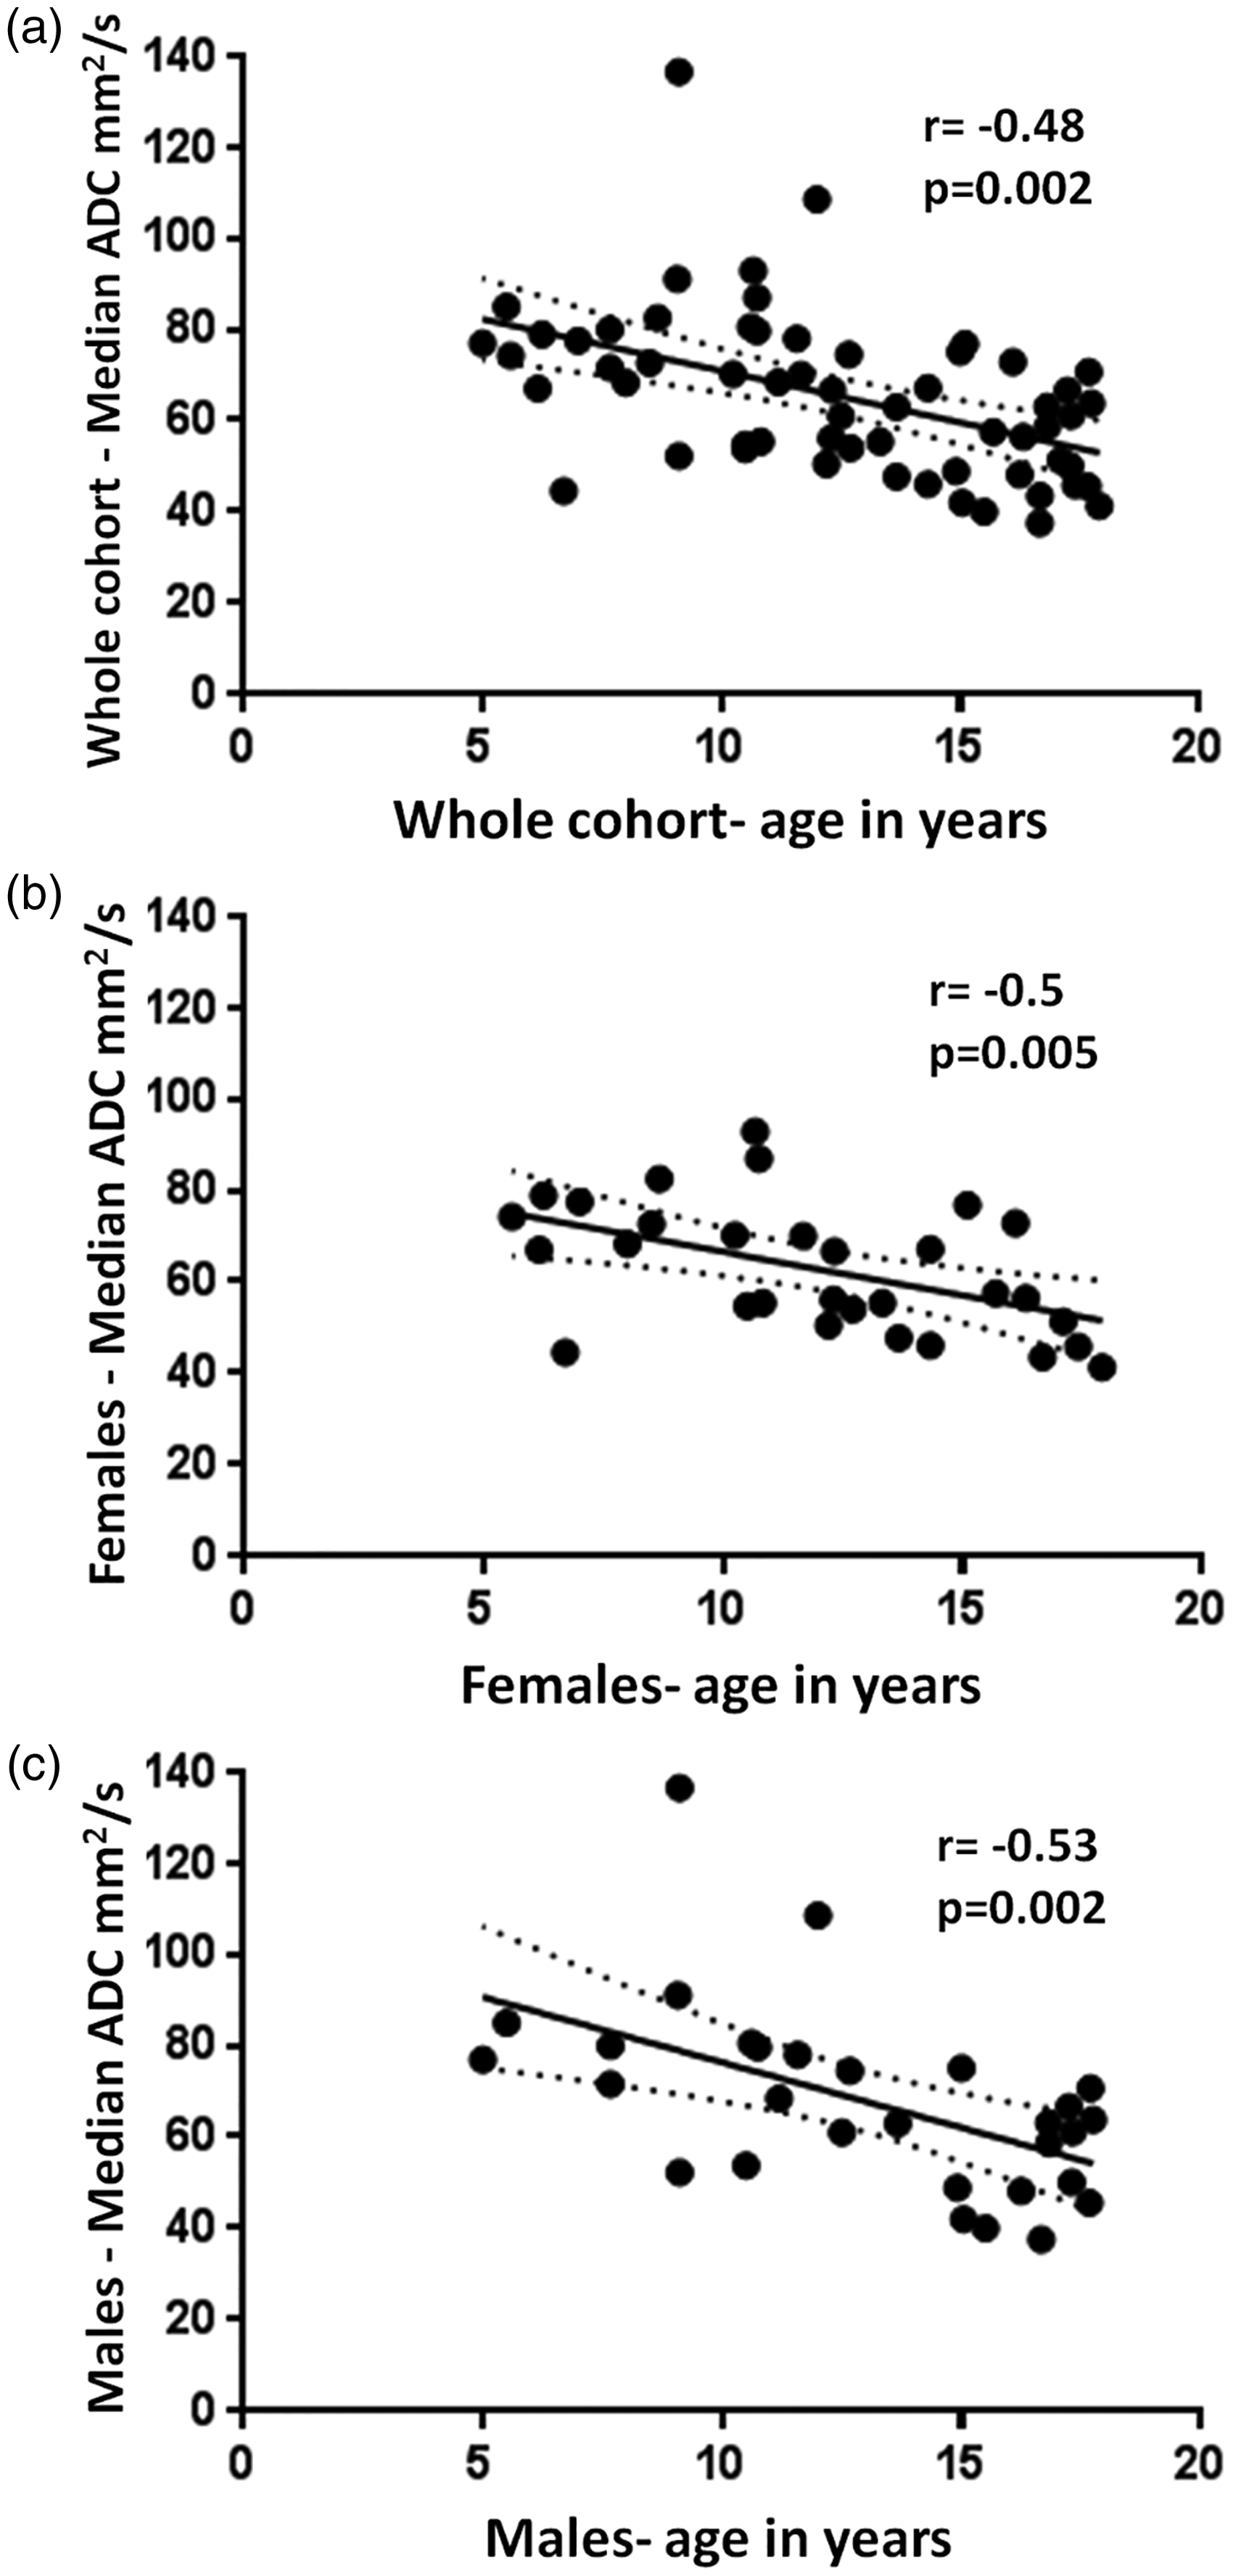
Scatter plots showing the negative correlation of the ADC with age in (a) the whole cohort; (b) girls alone; and (c) boys alone.
Variation with pubertal status
Age of the pubertal cohort was in the range of 12.3–17.9 years; it was lower in girls (median age = 15.1 years; age range = 12.3–17.9 years) compared to boys (median age = 16.8 years; age range = 13.7–17.8 years).
There was a significant difference between mean and median ADC values before and after puberty for the whole population (Table 2, Fig. 4), which was greater than the 95% limits of agreement for inter-observer variability. There was a shift of the ADC histogram to the left after puberty (Fig. 5a) as evidenced by the significant difference in centile values across the population. This is illustrated in exemplar cases before (Fig. 6) and after (Fig. 7) puberty. However, this was not reflected in an increased homogeneity of values as the interquartile range did not change (Table 2).
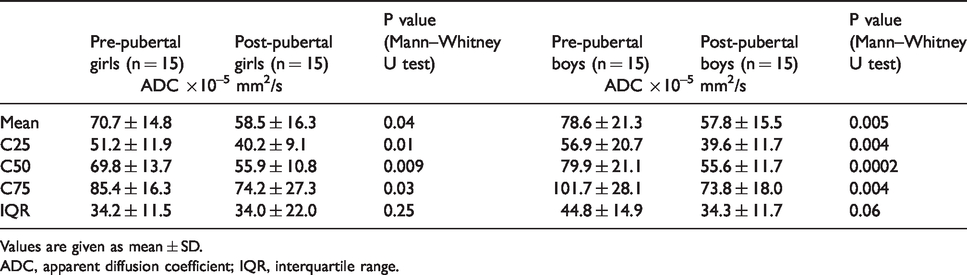
Pre- and post-pubertal mean and centile values of ADC showing significant differences with pubertal status.
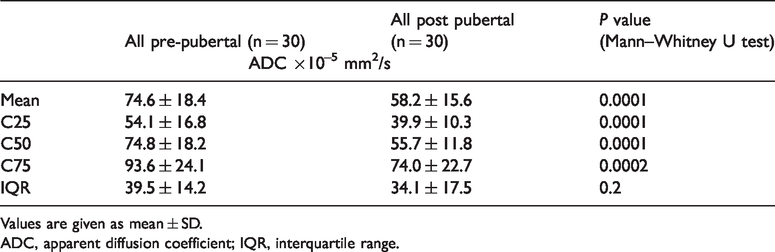
Values are given as mean ± SD.
ADC, apparent diffusion coefficient; IQR, interquartile range.
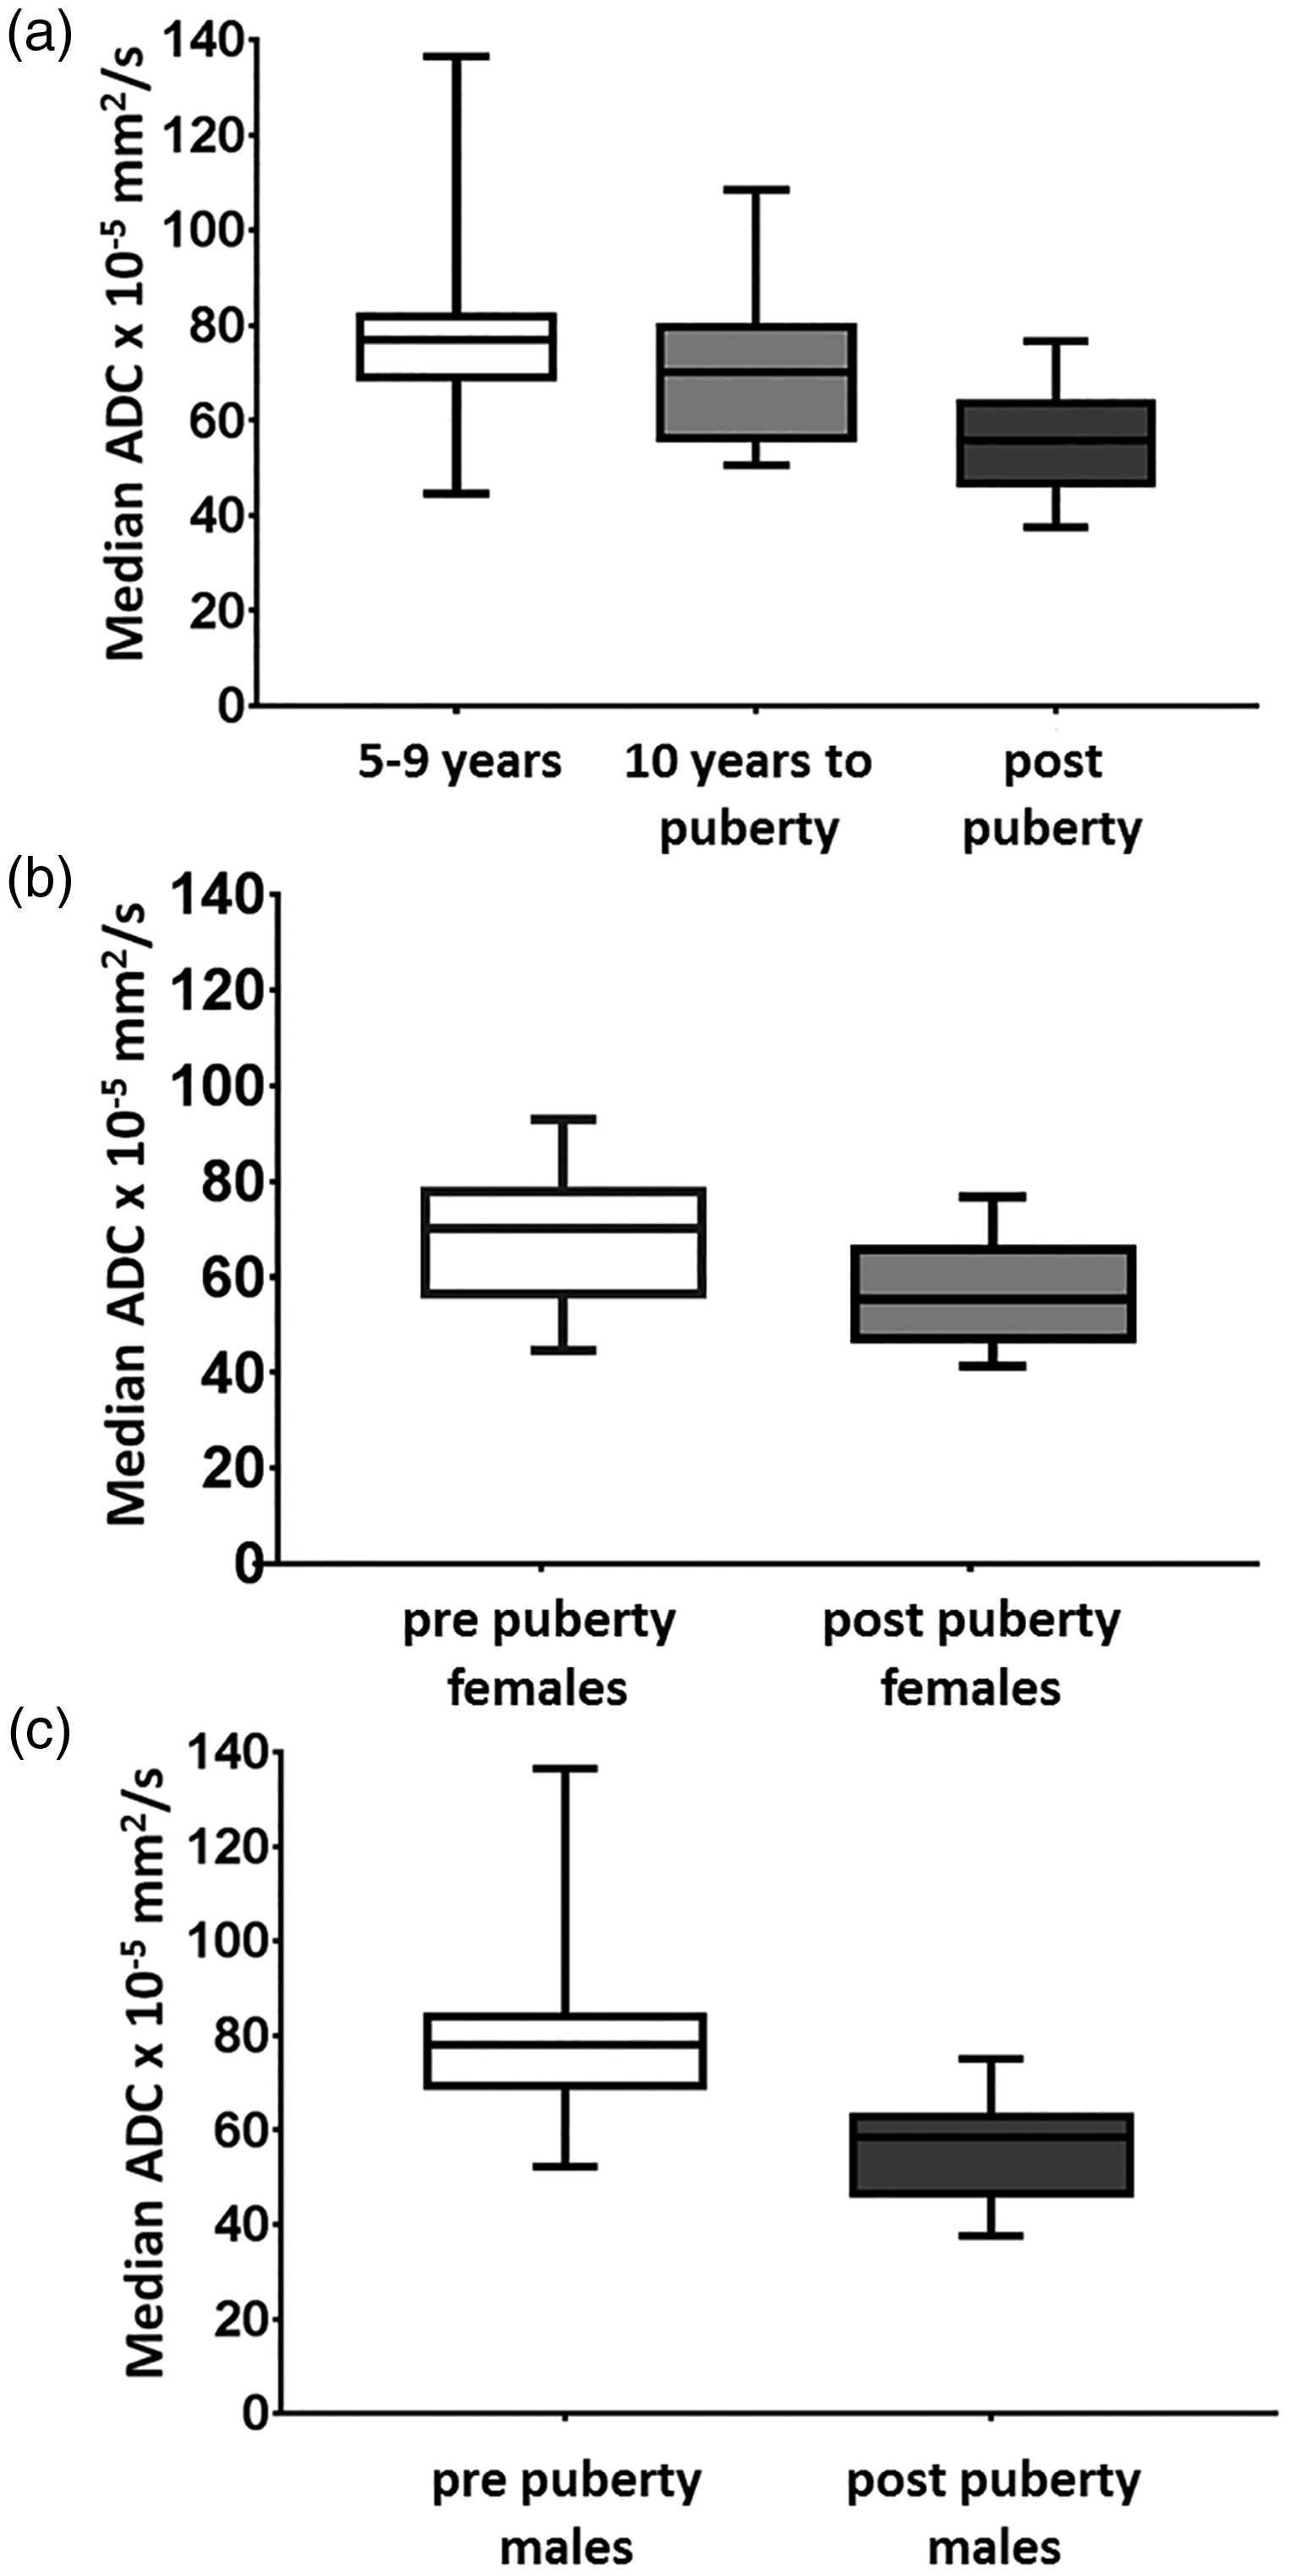
Box and whisker plot comparing ADC of 5–9-year-olds, 10 years to puberty, and all post-pubertal individuals (a), between pre- and post-pubertal girls (b) and pre- and post-pubertal boys (c).
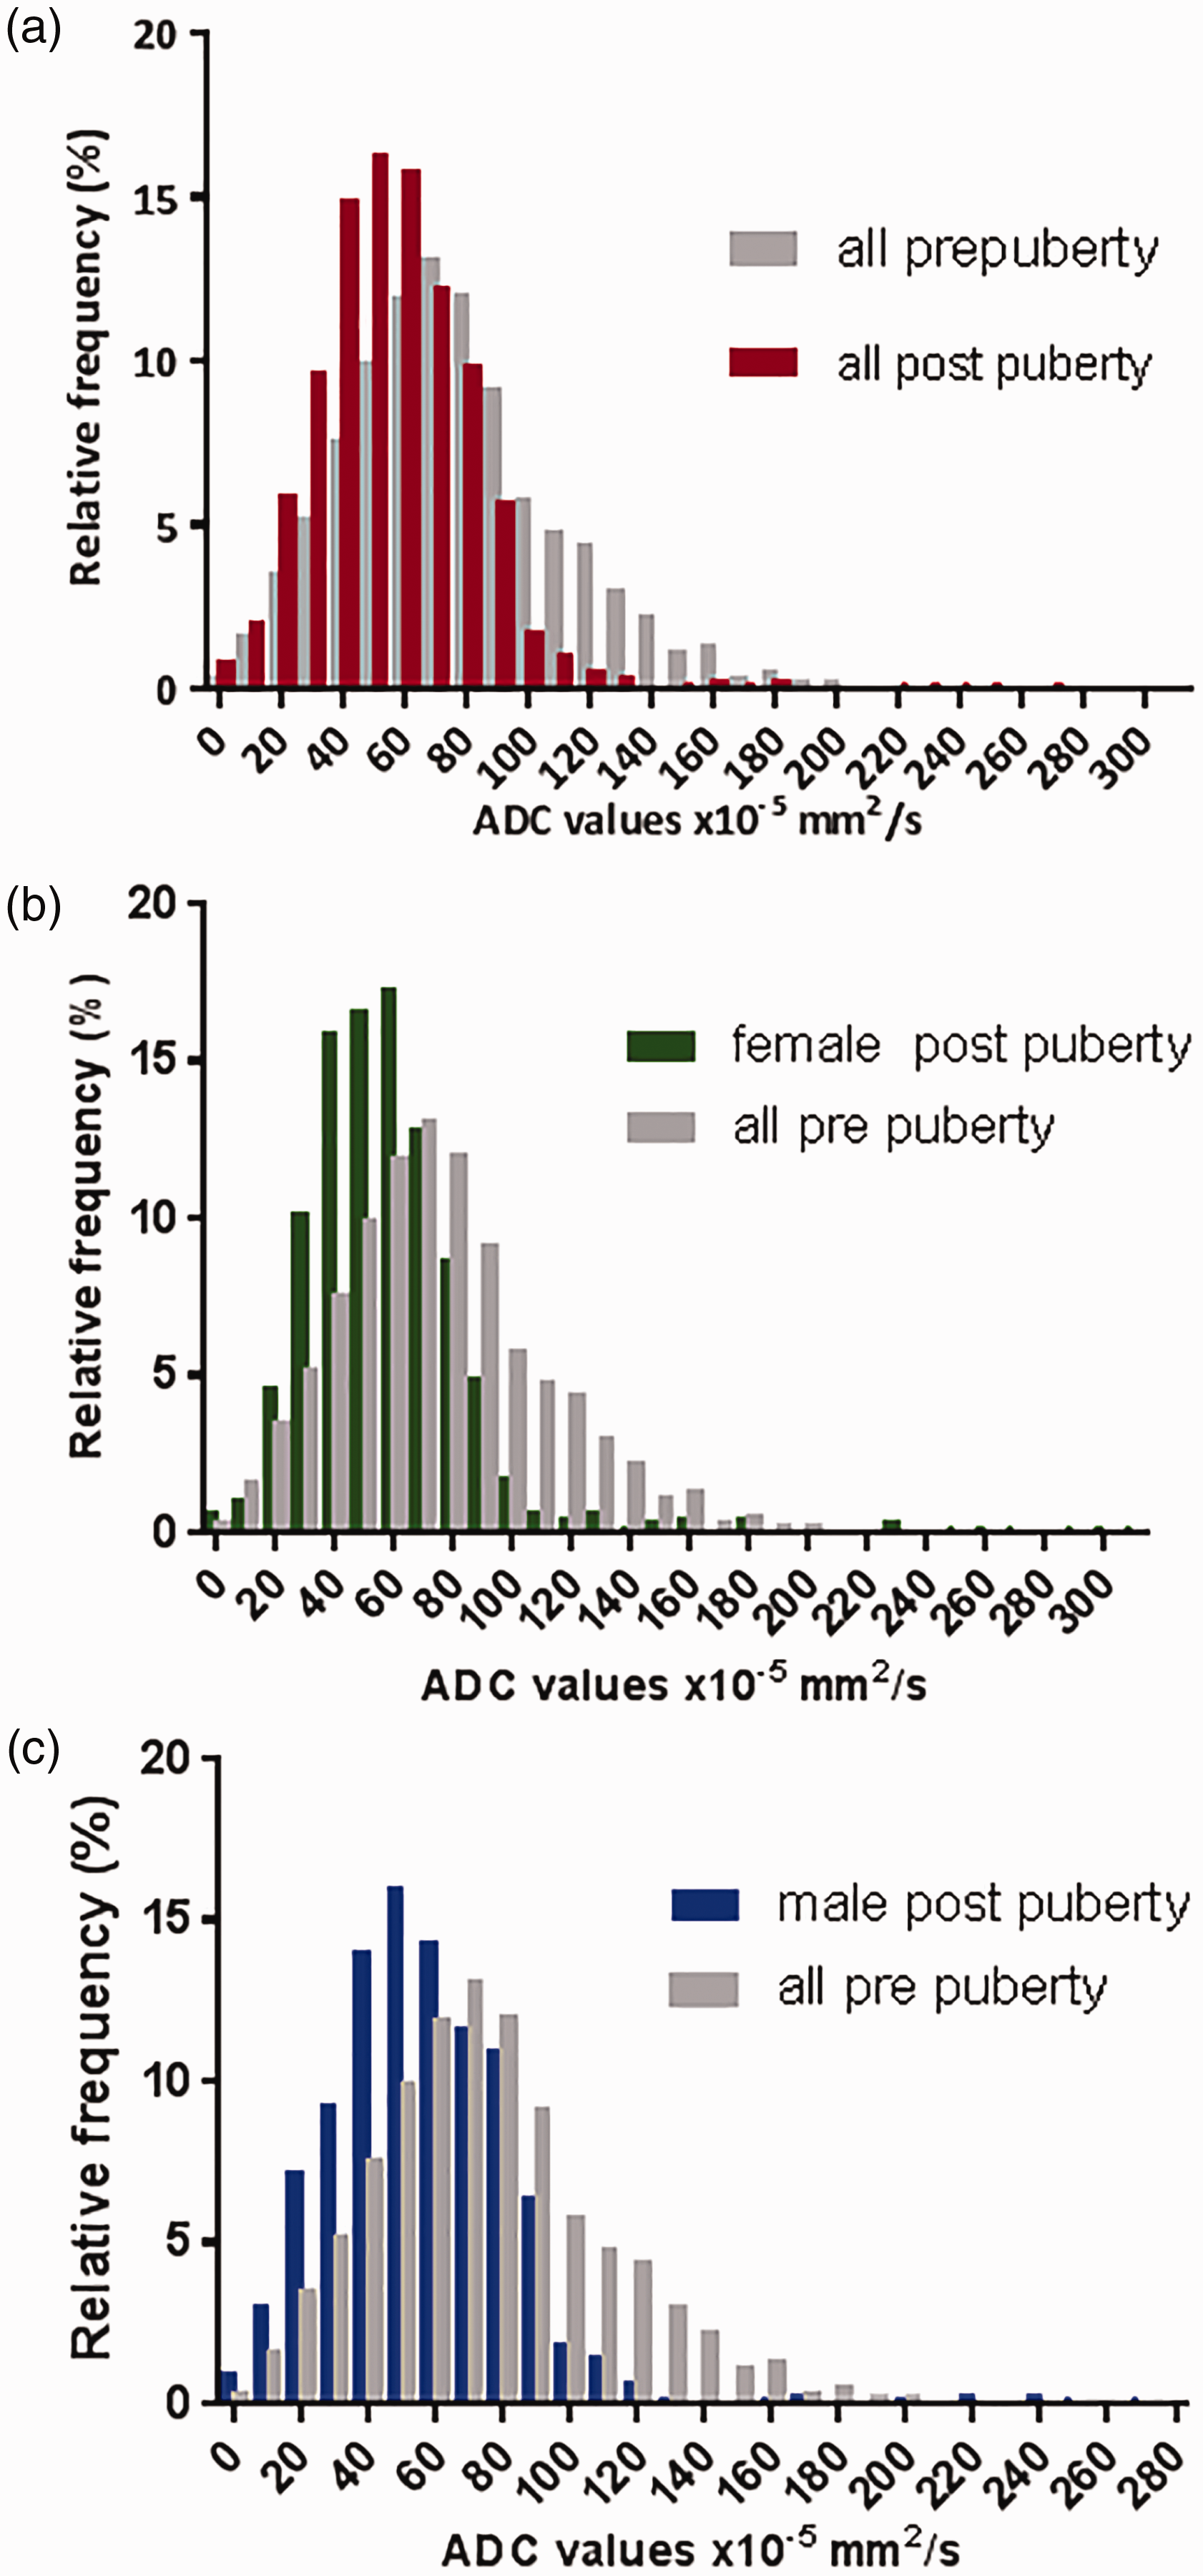
Histogram plots for the whole population before and after puberty (a) and for post-pubertal girls alone vs. all pre-pubertal individuals (b) and boys alone vs. all pre-pubertal individuals (c). There is a left shift in the histograms after puberty, regardless of gender.
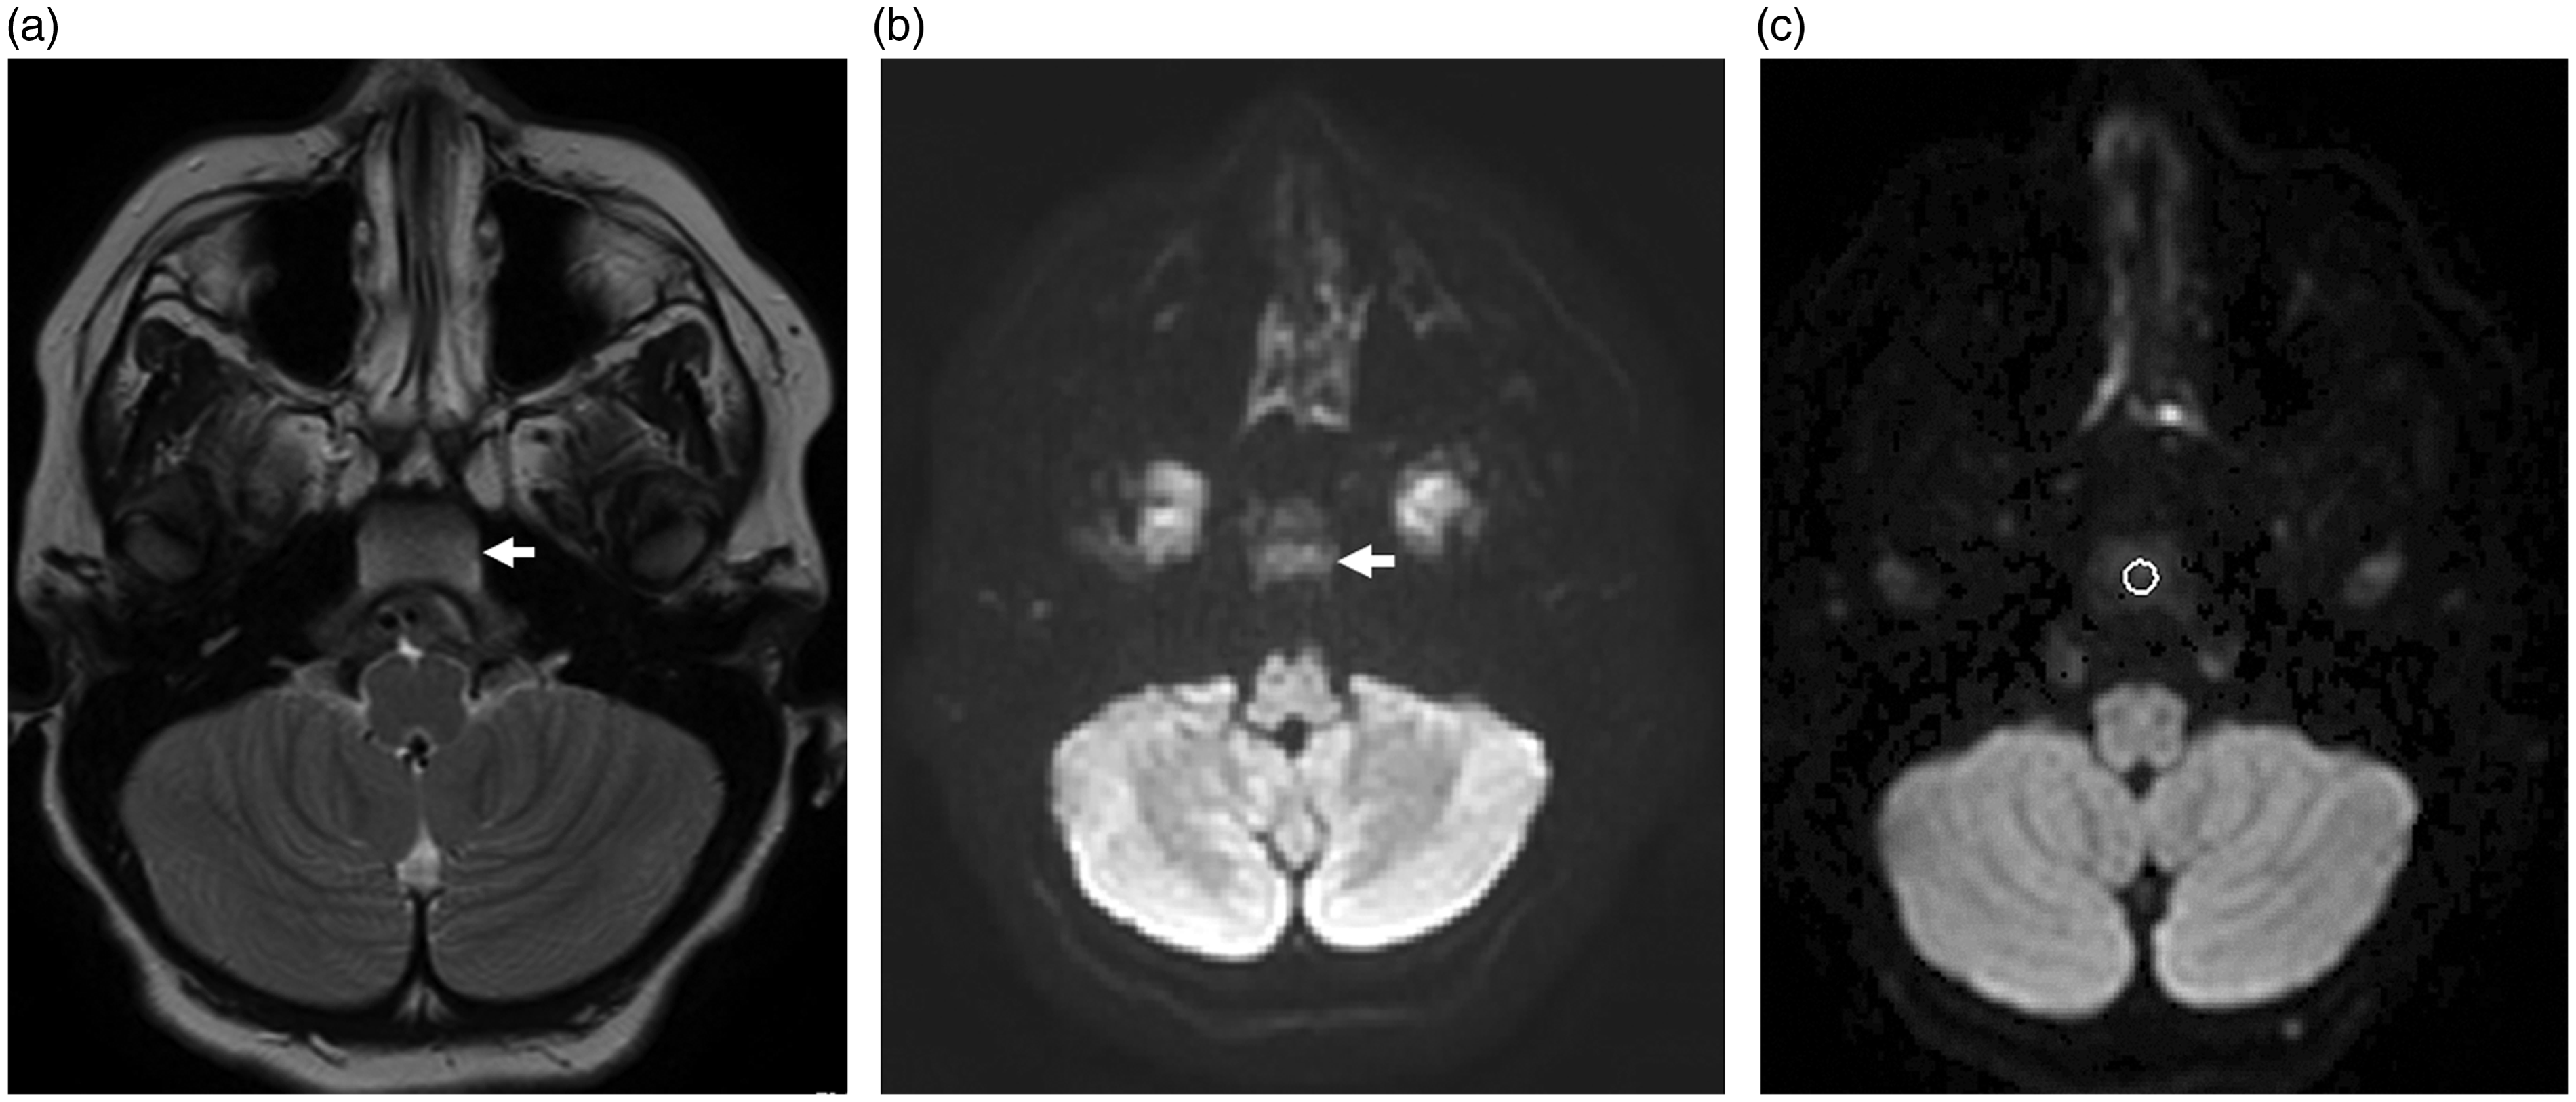
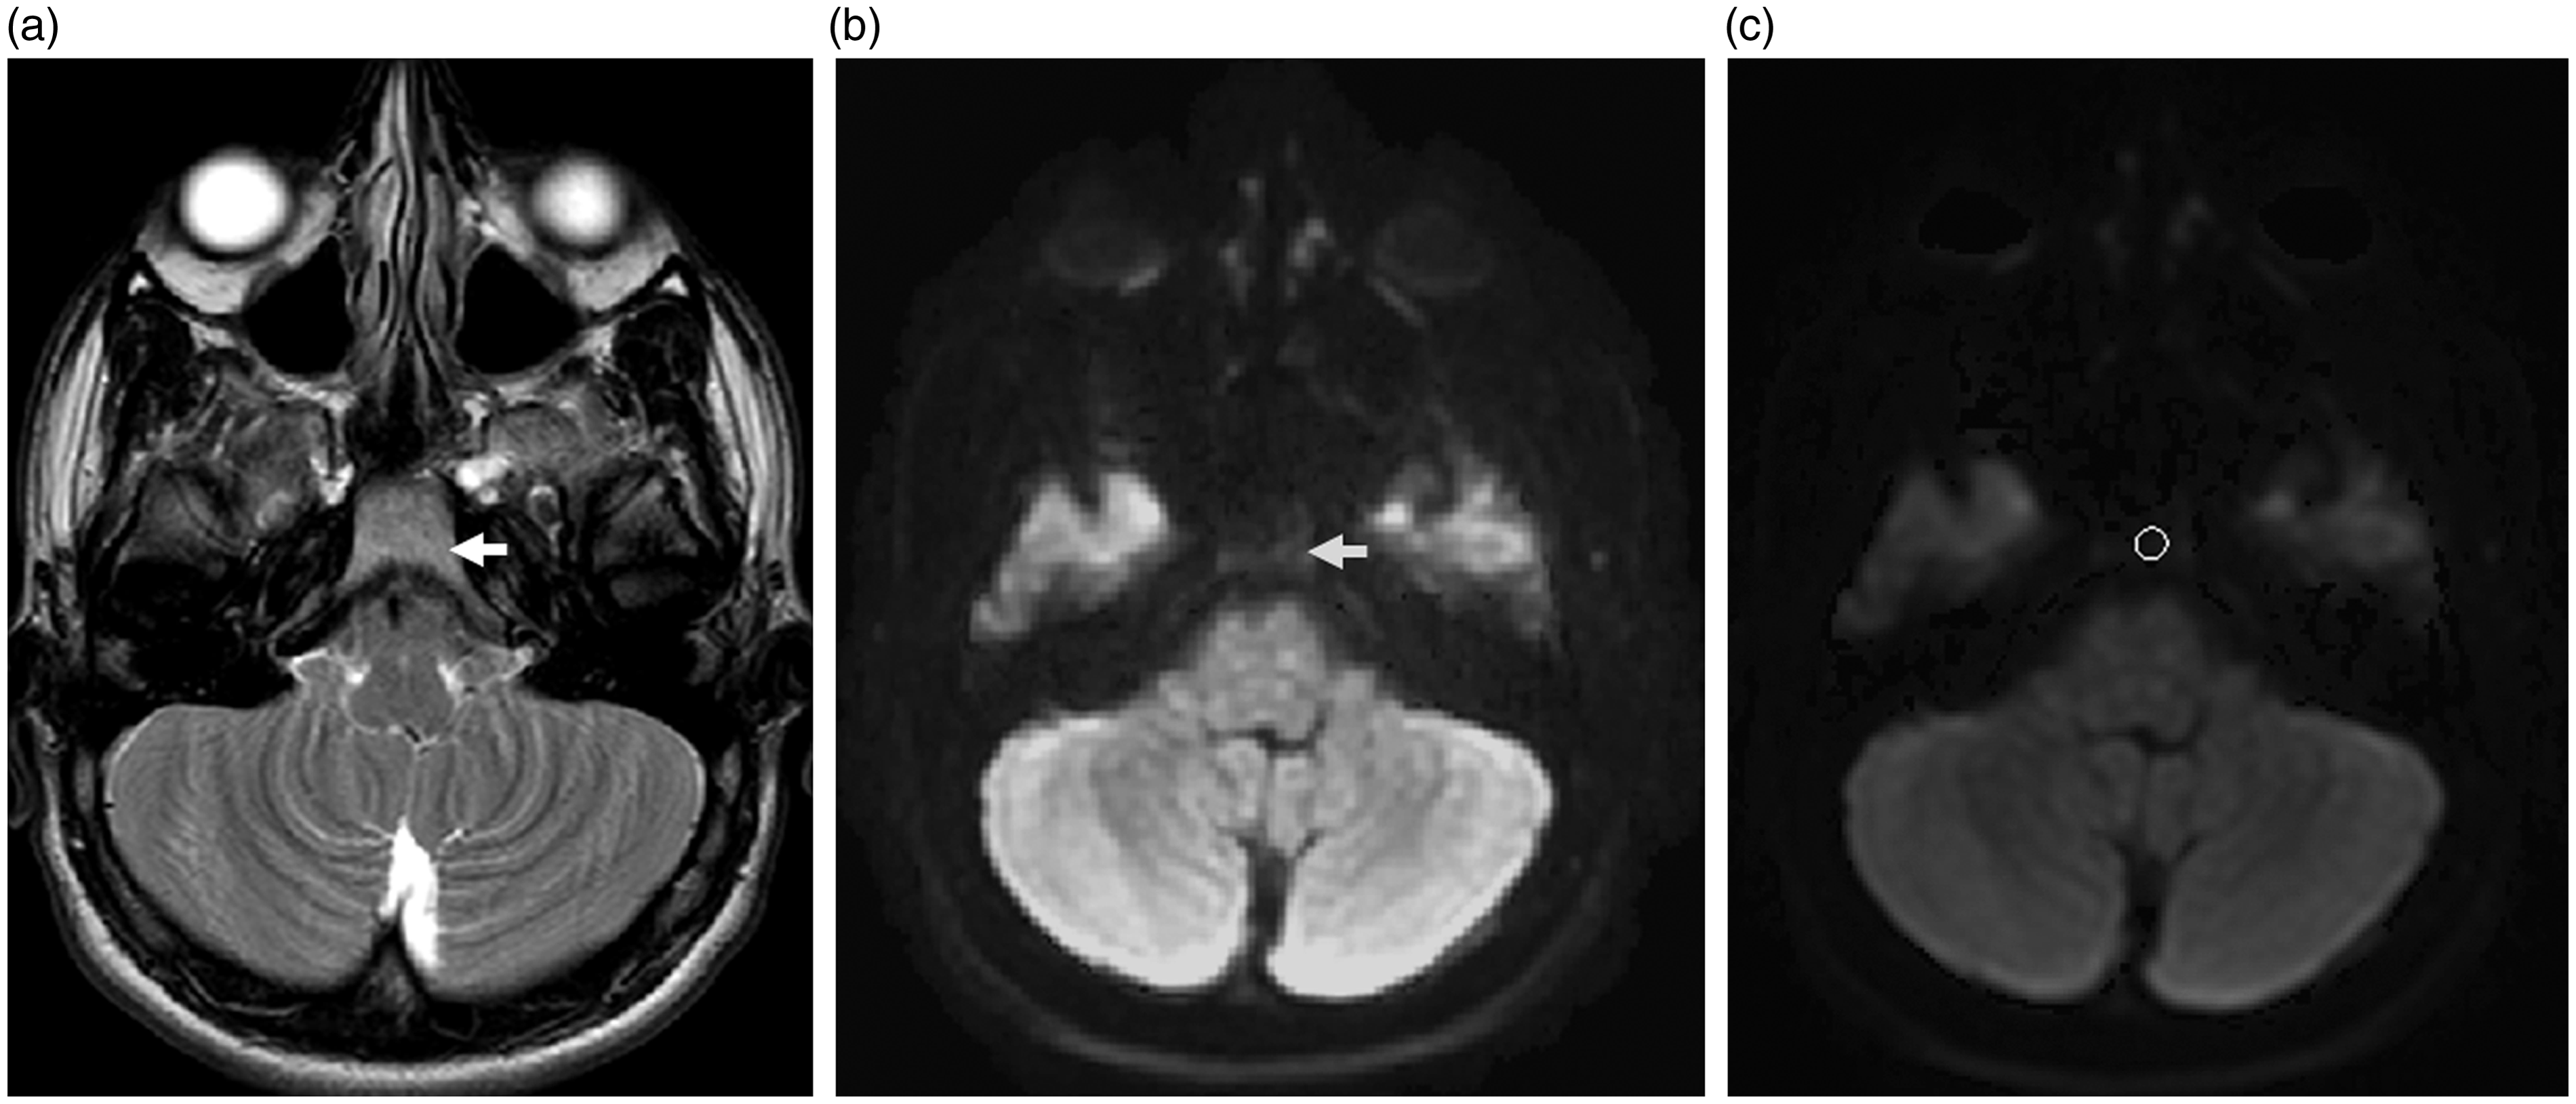
Axial T2W (a), diffusion-weighted (b), and ADC map (c) in a 5.5-year-old pre-pubertal boy. Intermediate signal intensity within the marrow of the clivus is noted (a) with corresponding high signal intensity (b). (c) ADC of the hypercellular marrow is 84.0 ± 22.2 mm2/s.
Axial T2W (a), diffusion-weighted (b), and ADC map (c) in a 16.8-year-old post-pubertal boy. High signal equivalent to that of fat is noted in the marrow of the clivus (a) with corresponding low signal intensity on the fat-suppressed DW image (b). (c) Low ADC (38.4 ± 15.9 mm2/s) of the fat replaced marrow is evident.
Variation with gender
Before puberty, there were no significant differences in mean or median ADC in girls versus boys (P = 0.3 for mean, 0.1 for median, and > 0.05 at all centile values).
The pre- and post-puberty differences seen for the whole cohort also held true for girls alone and boys alone (Table 3, Fig. 4) with striking reductions in mean and median ADC and a left shift of histogram centile values (Fig. 5b and c). Differences between the whole cohort comparison before and after puberty and the same comparison done by gender (girls alone and boys alone) were evident, e.g. the lack of significance between the 90th centile values for girls and the 10th centile values for boys. However, these differences are likely to relate to the smaller patient numbers when divided by gender rather than representing true differences.
Mean and centile values of ADC before and after puberty by gender, showing that the reductions in ADC after puberty were present in both girls and boys.
Values are given as mean ± SD.
ADC, apparent diffusion coefficient; IQR, interquartile range.
Discussion
This is a first report of variation in ADC values in bone marrow with age, pubertal status, and gender in a healthy pediatric population. A large study of 500 individuals in seven groups had the 6–14-year age group categorized as one and did not interrogate the effects of puberty on the bone marrow (12). While many reports exist linking sex hormones to cortical bone mass at puberty in both preclinical (13,14) and clinical (15,16) studies, there is a paucity of data on how the onset of puberty results in measurable changes within the marrow itself. This has been limited by the previous means of studying bone marrow, which required invasive biopsy and did not interrogate the entire skeleton. The advent of quantitative MRI biomarkers has changed the landscape in this regard (17,18) and makes it possible to prospectively derive measurements from bone marrow both within a region or at a whole skeleton level (using whole-body MRI) in order to study changes with normal physiology and with treatment (19).
We report a significant correlation of ADC with age. A recent publication reporting data in the lumbar spine did not indicate such a change with age as children matured (9). Their mean and median ADC values remained between 0.58 and 0.63 × 10⁻³ mm2/s across all age groups. However, their data did not separate individuals by pubertal status and the distribution of children versus young adults in their cohort is likely to have represented individuals who were chiefly post-pubertal.
It is well established that cancellous bone decreases and bone marrow fat content increases with age. This physiological replacement of hematopoietic cells with adipocytes correlates directly with age (20), reaching a peak in young adults. Marrow adiposity has been inversely related to cortical bone area in young adults (21) and to bone mineral content (12). However, this step-change at puberty has not been recognized. Although there is extensive evidence linking fat replacement in the marrow of adults to steroid therapy, there are no data linking the increase in marrow fat to the surge of sex steroid hormones at puberty. A recent study in a preclinical mouse model has elegantly demonstrated that leutinizing hormone is involved in hematopoietic stem-cell homeostasis (22); it may well be that the expression of this receptor particularly at sites within long bones and where hematopoietic function is no longer needed after puberty is one molecular mechanism driving the replacement of this functionally active tissue with fat.
The factors governing the relative amounts of hematopoietic and fatty components was elegantly hypothesized by Gurevitch et al. (23) where a dependence on the number of pluripotent mesenchymal stem cells (that differentiate to support both osteogenesis and hematopoiesis) was recognized. They hypothesized that as these cells are bound to endosteal and trabecular surfaces, they were numerous in growing tubular and cancellous bone, but once maturity was reached, they were far less numerous in tubular bones than in cancellous bone, because of the smaller internal bone surface area in the former. After maturity, therefore, mesenchymal stem cells in tubular bones favor support of a critical osteogenic function while in cancellous bone where they are more numerous, they retain a hematopoietic support function because of continued direct contact with hematopoietic cells. In the absence of hematopoietic cells, they change into fat-accumulating cells (24) so that fat fraction increases. T1 measurements have been used to estimate fat fraction (25). Although this was not possible in this retrospective study, it would be of interest to quantify regional bone marrow fat changes in the skeleton with the onset of puberty.
The relationship between bone marrow cellularity and ADC was established more than a decade ago, where a study that correlated cellularity in ilium aspirate was correlated with ADC values in 37 adults and children (26). The five young children in Nonomura et al.’s study did not have bone marrow aspirate performed, but their marrow was considered hypercellular in view of their age (0–3 years). Unfortunately, the b-values used in this study were low (0 and 350 s/mm2), so are likely to represent perfusional effects rather than true diffusion. This is reflected in the relatively high absolute values of 0.827 and 0.708 × 10⁻³ for normocellular marrow in the adults in their cohort. Unfortunately, also, the absolute cellularity of the aspirates was not quantified, so the relationship between the ADC and cellular “burden” has not been established.
Determining a ROI in the flat bones of a pediatric skull is challenging. Using the clivus ensured that a 4–6 mm diameter circular ROI could be obtained on two or three slices so that at least 21 voxels could be included in each scan. In future, automated segmentation methods may well enable more accurate delineation of the entire skull, which would enable larger scale analyses of this type. A previous extensive study in 500 individuals, 200 of whom were aged < 14 years (27), examined the differences in ADC values by skull location and correlated values with age. Interestingly, the occipital and parietal bones showed a variation with age, with a gradual downward trend between 0 and 30 years, whereas the frontal and temporal bones did not. This is in keeping with the findings in our study where the clivus as part of the occipital bone at the skull base shows this change. It indicates that, as with the tubular bones, the hemopoietic function of the skull base becomes less important with age, while that of the frontal and temporal regions is unaltered into adult life (27).
Signal-to-noise ratio is critically important in the reliability of the ADC measurement. ROIs within the clivus allowed inclusion of at least 21 voxels and had the advantage of avoiding sutures with a homogenous area from which to derive quantitative data. Other studies of bone marrow in children have focused on larger areas afforded by the vertebrae and iliac bones (9). Nevertheless, the values we obtained here are in keeping with those from these other studies.
Our study had several limitations. First, it was retrospective and relied on selecting healthy children with normal MRI brain scans. We attempted to mitigate against errors from inclusion of likely pathologies or treatment-related effects by having very strict inclusion and exclusion criteria. We interrogated a large pool of > 1000 children scanned over a two-year period to derive these patient numbers for investigation. In future, exploiting data from image biobanks may be possible. Second, only two b-values were used in the acquisition for derivation of ADC and one of them was b = 0. It is now established that elimination of perfusional effects to obtain a true D* necessitates that the lower b-value is >50 mm2/s (28). A third b-value in the range of 50–1000 mm2/s ensures robustness of the ADC calculation. Although this was not available, our quantified values were similar to other cited literature values (29). Third, we did not directly measure fat fraction, although this report assumes the relationship between ADC and fat fraction is inverse, thus explaining our findings (7). Fourth, our assessment of puberty, although objective and done on imaging grounds, was not confirmed by blood hormone profiles in these children. Although a prospective longitudinal study before and after puberty as verified by hormone profiles is the ideal, this is difficult to justify. It would, however, establish definitively whether there was a linear correlation of ADC with age or a step-change at puberty. Our data show a negative correlation of ADC with age and illustrates the range of normal values, but the sample size is too small to differentiate a linear decrease of ADC with age from a step-change at puberty. Finally, measuring ADC reproducibility would have been ideal, but as our cohort were children with minimal symptoms, a second/follow-up MRI scan was not justified. Measurement of ADC in adult populations has indicated that it is a robust measurement in normal bone marrow (30), and that the differences reported in this study are greater than the published limits of agreement.
In conclusion, this study shows a correlation of ADC with age in children. Moreover, it is the first study to document a significant change in marrow ADC related to puberty, using the ADC of marrow in the clivus as a quantitative biomarker. There were no discernible differences by gender. These data will form the basis for understanding changes that occur in the bone marrow following local and systemic treatments of hematological and non-hematological malignancies.
Footnotes
Acknowledgements
We gratefully acknowledge assistance from Jonathan Rhodes (Superintendent Neuroradiographer, Department of Neuroradiology, St George’s Hospital, London, UK); Simon Doran (Senior Staff Scientist, Cancer Imaging Centre, The Institute of Cancer Research, Sutton, UK); James D’Arcy (Computer Officer, Division of Radiotherapy and Imaging, Magnetic Resonance Unit, Sutton, UK) and Matthew Orton (Staff Scientist, Division of Radiotherapy and Imaging, Magnetic Resonance Unit, Sutton, UK).
Declaration of conflicting interests
The authors declared no potential conflicts of interest with respect to the research, authorship, and/or publication of this article.
Funding
The authors received the following financial support for the research, authorship, and/or publication of this article: CRUK and EPSRC support to the Cancer Imaging Centre at ICR and RMH in association with MRC and Department of Health C1060/A10334, C1060/A16464 and NHS funding to the NIHR Biomedical Research Centre and the Clinical Research Facility in Imaging.