
Abstract
Background
Patients with alcohol-use disorder (AUD) demonstrate dysfunctional cerebral network connectivity. However, limited studies have investigated attention systems in AUD.
Purpose
To assess functional (FC) and effective connectivity (EC) in the dorsal (DAN) and ventral attention networks (VAN) and default mode network (DMN) in patients with AUD using resting-state functional magnetic resonance imaging (rs-fMRI).
Material and Methods
MRI and rs-fMRI data were obtained from 28 men with AUD and 30 age-matched healthy controls. Independent component analysis was used to identify and extract network data, for comparison between the two groups. Effective connectivity was evaluated using Granger causality analysis (GCA) by selecting significantly different brain areas as regions of interest (ROI). Signed-path coefficients between ROIs were computed in bivariate mode.
Results
In patients with AUD, FC decreased in the left superior parietal gurus (SPG) and left interparietal sulcus (IPS, in DAN); FC decreased in the right superior frontal gyrus (SPG) and right middle frontal gyrus (MFG, in DMN). GCA values indicated that the DMN exerts a positive causal effect on the DAN (P = 0.007/0.027), which consequently exerts a negative causal effect on the DMN (P = 0.032). Signed-path coefficients from the right MFG to the left IPS correlated negatively with MAST scores (P = 0.015).
Conclusion
We found novel inter-network connectivity dysfunction in patients with AUD, which indicates abnormal causal relations between resting-state DAN and DMN. Thus, patients with AUD may have abnormal top-down attention modulation and cognition.
Introduction
Alcohol-use disorder (AUD) is a common psychiatric disorder characterized by alcohol tolerance, withdrawal, loss of control over alcohol intake, and continued alcohol consumption despite knowledge of adverse consequences (1). AUD impacts multiple organs and has severe neurological consequences. AUD contributes substantially to the burden of disease in many countries (> 76 million globally) (2).
A comprehensive neurobiological understanding of alcohol reactivity is critical for identifying the neuropathology of AUD and developing appropriate treatments to reduce relapse (3–6). AUD is marked by widespread gray and white matter damage in selected neural circuits (3–8). Morphometric magnetic resonance imaging (MRI) studies have reported reduced volume in cortical and subcortical cerebral structures in patients with AUD. These patients have altered spontaneous brain function and functional connectivity networks (9,10). Additionally, functional neuroimaging studies have identified the activation of many brain areas in response to alcohol intake. AUD is associated with specific and marked impairment in audiovisual processing (11) and altered activity in the superior temporal sulcus, inferior occipital gyrus, middle frontal gyrus (MFG), and superior parietal lobule (3,11).
Furthermore, AUD affects multiple cognitive processes supported by far-reaching cerebral networks (9,10,12,13), including the reward network (RN) (14), default mode network (DMN) (15), executive control network (ECN) (16,17), and salience network (SN) (18). Some studies have reported higher connectivity within the cognitive control network and lower connectivity in the RN (9), while others have suggested that individuals with AUD exhibit greater connectivity in the networks comprising the striatum, amygdala, and insula (10). In terms of network efficiency, patients with AUD show weaker within-RN motivational network connectivity and expanded ECN connectivity than healthy controls (HCs). Spontaneous slow fluctuations in the posterior cingulate and cerebellar resting-state functional MRI (rs-fMRI) signals in individuals with alcoholism are less synchronized than those in HCs, indicating compromised functional connectivity (FC) in the former.
Limited studies have assessed the attention function in patients with AUD. Results of some neuropsychological studies have suggested a correlation between attention impairment in patients with AUD and those with alcohol-use relapse (19), which could be used as a predictive index of the success of alcohol abstinence treatment (20). Studies on other addictive diseases show similar results (21,22). The attention bias of patients with AUD was correlated to alcohol consumption and resumption of alcohol consumption after abstinence (20). fMRI studies have demonstrated that relative to HCs, patients with AUD have a higher alcohol-cue induced attentional bias (21,22). Nevertheless, only few studies have investigated the mechanism underlying attention network dysfunction in patients with AUD.
Traditional assessment of FC can determine the interactions between the brain regions or networks, but not causal interactions. One study used independent component analysis to investigate large-scale network connectivity patterns to understand of the neuropathophysiology of AUD (24). Intrinsic interactions among neuronal systems are causally related to directivity, and the direct or indirect influence of activity in one brain region on another is modeled as effective connectivity (EC) (25,26). EC is the time-lagged correlation between time-series at spatially distinct brain regions of the brain, as opposed to correlations among between synchronized time-series. EC from region X to region Y implies that the neuronal activity in region X precedes and predicts the neuronal activity in region Y. Although some FC studies have investigated the interaction within and between networks, no study has reported an EC or network connectivity disruption in patients with AUD.
There are several ways to explore EC within the brain. Unlike dynamic causal modeling and structural equation modeling, Granger causality analysis (GCA) does not require a prior hypothesis to pre-select the interaction regions (27,28). GCA has been used to investigate the information flow in individuals with schizophrenia (29), epilepsy (30), and major depressive disorder (30). We hypothesized that the EC between the DMN and DAN or VAN would be disrupted in AUD. To better understand the network disturbances in patients with AUD, we analyzed both FC and EC between different regions of interest (ROIs) of the resting-state networks (RSNs: dorsal attention network [DAN], ventral attention network [VAN], and DMN) and investigated the possible causal relationships across networks via GCA. The results of this research may offer new insight into the neuropathophysiological mechanisms of attention dysfunction in patients with AUD.
Material and Methods
Participants
The present study was approved by the Medical Ethics Committee of our hospital and adhered to the Declaration of Helsinki. Patients provided written informed consent before their participation in the study.
A total of 28 male, right-handed patients (age range = 35–60 years) with AUD and 30 age-, sex-, handedness-, and education-matched HCs were recruited for the present study. Before the MRI examination, they underwent a screening process that included medical history, and physical and neurological examinations, assessed by a psychiatrist. Patients were excluded if they had any of the following: a history of organic brain disorders; significant medical, neurological, or psychiatric illnesses other than AUD; drug abuse (including nicotine) or dependence on any substance other than alcohol; or painful syndromes and/or other neurological/psychiatric disorders that might affect the MRI such as contraindications.
Patients with AUD were recruited from the primary-care outpatient department of our hospital. The inclusion criteria for patients were as follows: a history of alcohol dependence lasting 10–30 years; daily alcohol consumption (300–500 mL [standard, pure ethanol]); DSM-5 criteria for AUD; Michigan Alcoholism Screening Test (MAST) score ≥ 6; Alcohol Drinking Scale (ADS) score ≥ 14 (moderate or severe alcohol dependence) (32,33); abstinence from alcohol for at least three weeks before the study; and no prior history of AUD treatment or psychoactive medication use.
HCs were defined as individuals who never or rarely drank alcohol—including holiday drinking, < 1 standard unit per time, i.e. 14 g of pure ethanol (33)—with a MAST score < 6 and ADS score < 14 (mild or no alcohol dependence) (32).
Clinical measures
Before undergoing MRI scans, all participants completed the Mini-Mental State Examination (MMSE) for evaluation of their cognitive function; the level of alcohol independence was assessed only in the AUD group via the MAST and ADS scores.
MRI acquisition
MRI scan was performed using a 3.0-T GE Silent MRI scanner (Discovery 750W Silent MR, GE Healthcare, Milwaukee, WI, USA). Foam pads were placed on both sides of the lower jaw to limit head motion and earplugs were used to attenuate scanner noise. During data acquisition, all participants were instructed to keep their eyes closed, stay awake, and think of nothing in particular. rs-fMRI involved a gradient-recalled echo planar imaging sequence, with the following parameters: echo time (TE) = 25 ms; repetition time (TR) = 2000 ms; field of view = 240 × 240 mm2; slice thickness = 4 mm; no slice gap; matrix = 64 × 64; flip angle (FA) = 90°; interleaved axial slices = 40; and volumes = 240. T1-weighted high-resolution magnetization-prepared rapid gradient-echo structural images were also acquired for alignment and tissue segmentation purposes (TR = 8.5 ms; TE = 3.268 ms; FA = 12°; matrix = 256 × 256; slices = 156; and voxel size = 1 × 1 × 1 mm3).
Data preprocessing
Data were preprocessed using the Data Processing Assistant of rs-fMRI software (DPARSF Advanced Edition V4.3; http://www.rfmri.org/DPARSF). The first 10 volumes of each participant were discarded. Slice-timing and head movement were corrected for the remaining data. Seven participants were excluded because of excessive head movement (absolute displacement: translation or rotation > 2.0 mm or 2°). Subsequently, the corrected functional images were spatially normalized to the standard Montreal Neurological Institute template and resampled to 3 ×3 × 3 mm3. These data were spatially smoothed with a 4-mm full-width-at-half-maximum isotropic Gaussian kernel. Finally, nuisance signals, including the 24 head-motion parameters, cerebrospinal fluid signals, white-matter signals, and global signals, were regressed from the MRI data.
Independent component analysis
Group independent component analysis (ICA) was used to identify and extract RSNs by using the fMRI Toolbox (GIFT; University of New Mexico, Albuquerque, NM, USA). Based on all available fMRI data (both AUD and HC groups), the number of independent components was estimated using the minimum description length (MDL) technique, which yielded an average of 31 independent components. We performed group ICA on the data from both HCs and patients with AUD to ensure that all individuals had the same components. Next, we performed single principle component analysis (PCA), group PCA, ICA, and back reconstruction. Among the 100 independent components examined, 44 were identified as meaningful based on previously described criteria (34).
Using spatial correlation values between independent components and the template, the DMN and attention networks were identified in both patients with AUD and HCs with high correlations. Thus, the DAN, VAN, and DMN were further analyzed. We then reperformed ICA using the data of all participants to generate masks, using one-sample t-tests in the component’s spatial maps with false discovery rate correction at the cluster level (PFDR < 0.05), with clinical covariates variables of age, education level, and head motion as the covariates. Finally, we investigated the different brain regions that were significantly related to these three brain networks using two-sample t-tests (uncorrected, P < 0.005) for further validation.
Granger causality analysis
GCA helps to determine whether the past value of a time-course can correctly predict the current value of another. Therefore, it can be used to evaluate the causal influences and flow of information for fMRI time-series analyses.
We examined the direction and magnitude of the causal effect between the ROIs of the different networks according to the ICA results. Significant ROIs were extracted from ICA findings using the two-sample t-test group comparisons. These clusters were uncorrected, with a threshold of P < 0.005 and an extent cluster threshold of k = 10 voxels. After obtaining the ROIs from ICA, ROI-wise GCA was performed using the rs-fMRI data analysis toolkit RESTplus (34). For each individual, the signed-path coefficients among the ROIs were computed in bivariate-coefficient mode for subsequent parametric statistical analysis. Changes in EC between patients with AUD and HCs were assessed using dependent-samples t-tests in SPSS software (SPSS Inc., Chicago, IL, USA), with age and level of education as the covariates.
Correlation analysis
We assessed the relationships between the signed-path coefficients and clinical variables corresponding to patients with AUD using Spearman’s correlation coefficients (SPSS version 25.0 software, SPSS Inc.).
Results
Demographic and clinical data
Demographic and clinical data of the two groups are shown in Table 1. Patients with AUD performed more poorly than HCs in all cognitive function tests (P < 0.05; Table 1).
Demographics and clinical characteristics of patients in the HC group and AUD group.
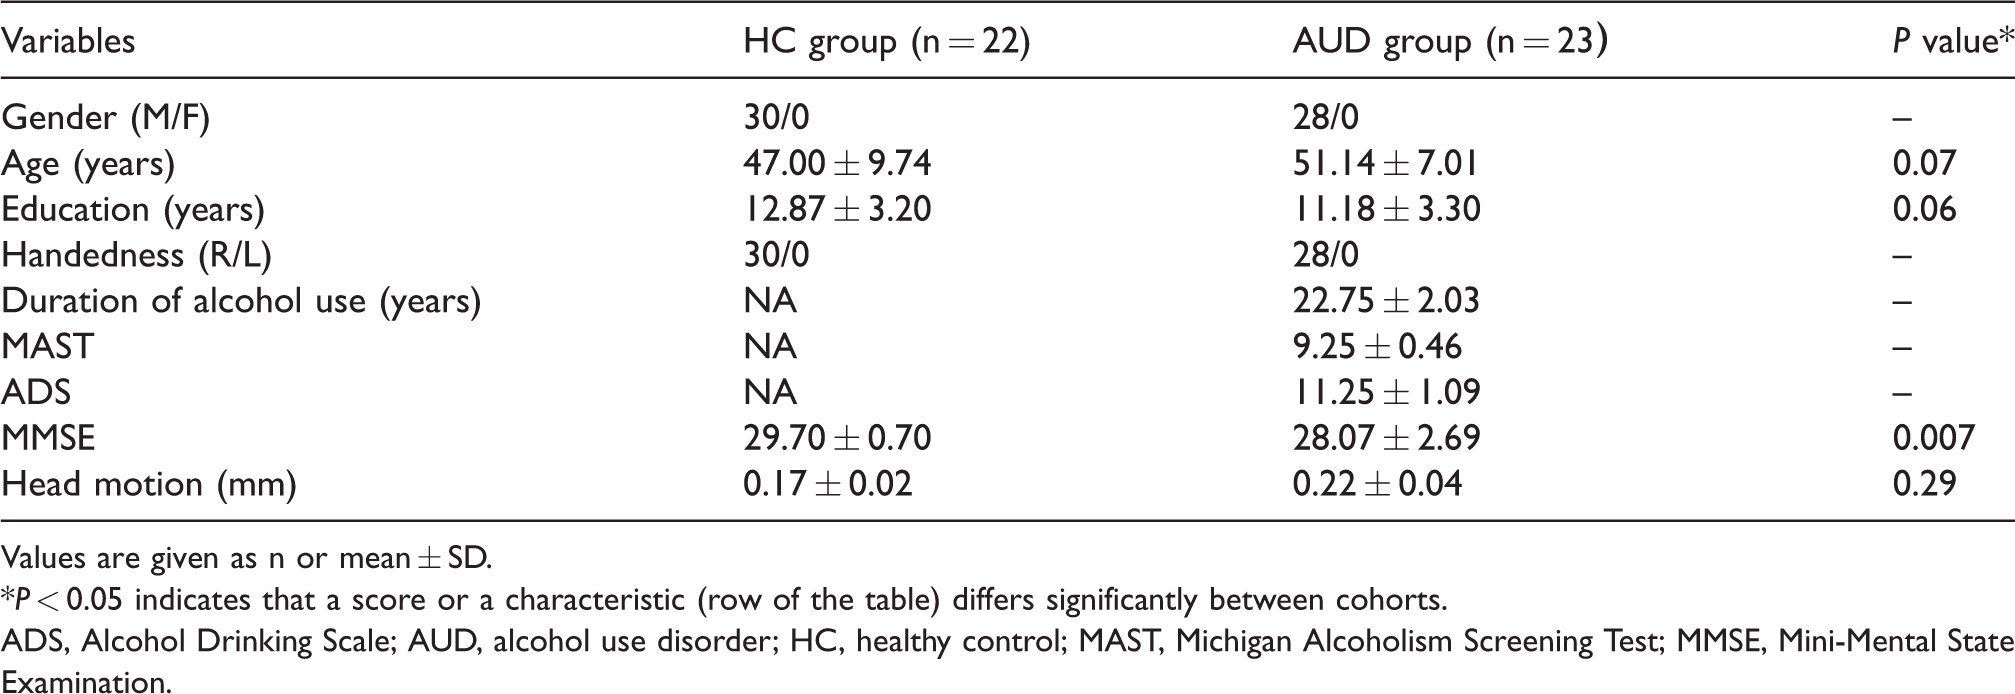
Values are given as n or mean ± SD.
*P < 0.05 indicates that a score or a characteristic (row of the table) differs significantly between cohorts.
ADS, Alcohol Drinking Scale; AUD, alcohol use disorder; HC, healthy control; MAST, Michigan Alcoholism Screening Test; MMSE, Mini-Mental State Examination.
Connectivity analysis
Group ICA was applied to extract the RSNs based on all participants’ data; the DAN, VAN, and DMN were identified and selected from 31 ICA components (Fig. 1).The selected networks were compared to identify brain regions that were significantly different between patients with AUD and HCs, using RESTplus (Fig. 2; Table 2). In the DAN, FC in the left superior parietal gurus (SPG) and left interparietal sulcus (IPS) decreased. In the DMN, FC decreased in patients with AUD, especially in the right superior frontal gyrus (SFGdor) and left middle frontal gyrus (MFG). Our results shows no significant difference in FC in the VAN.
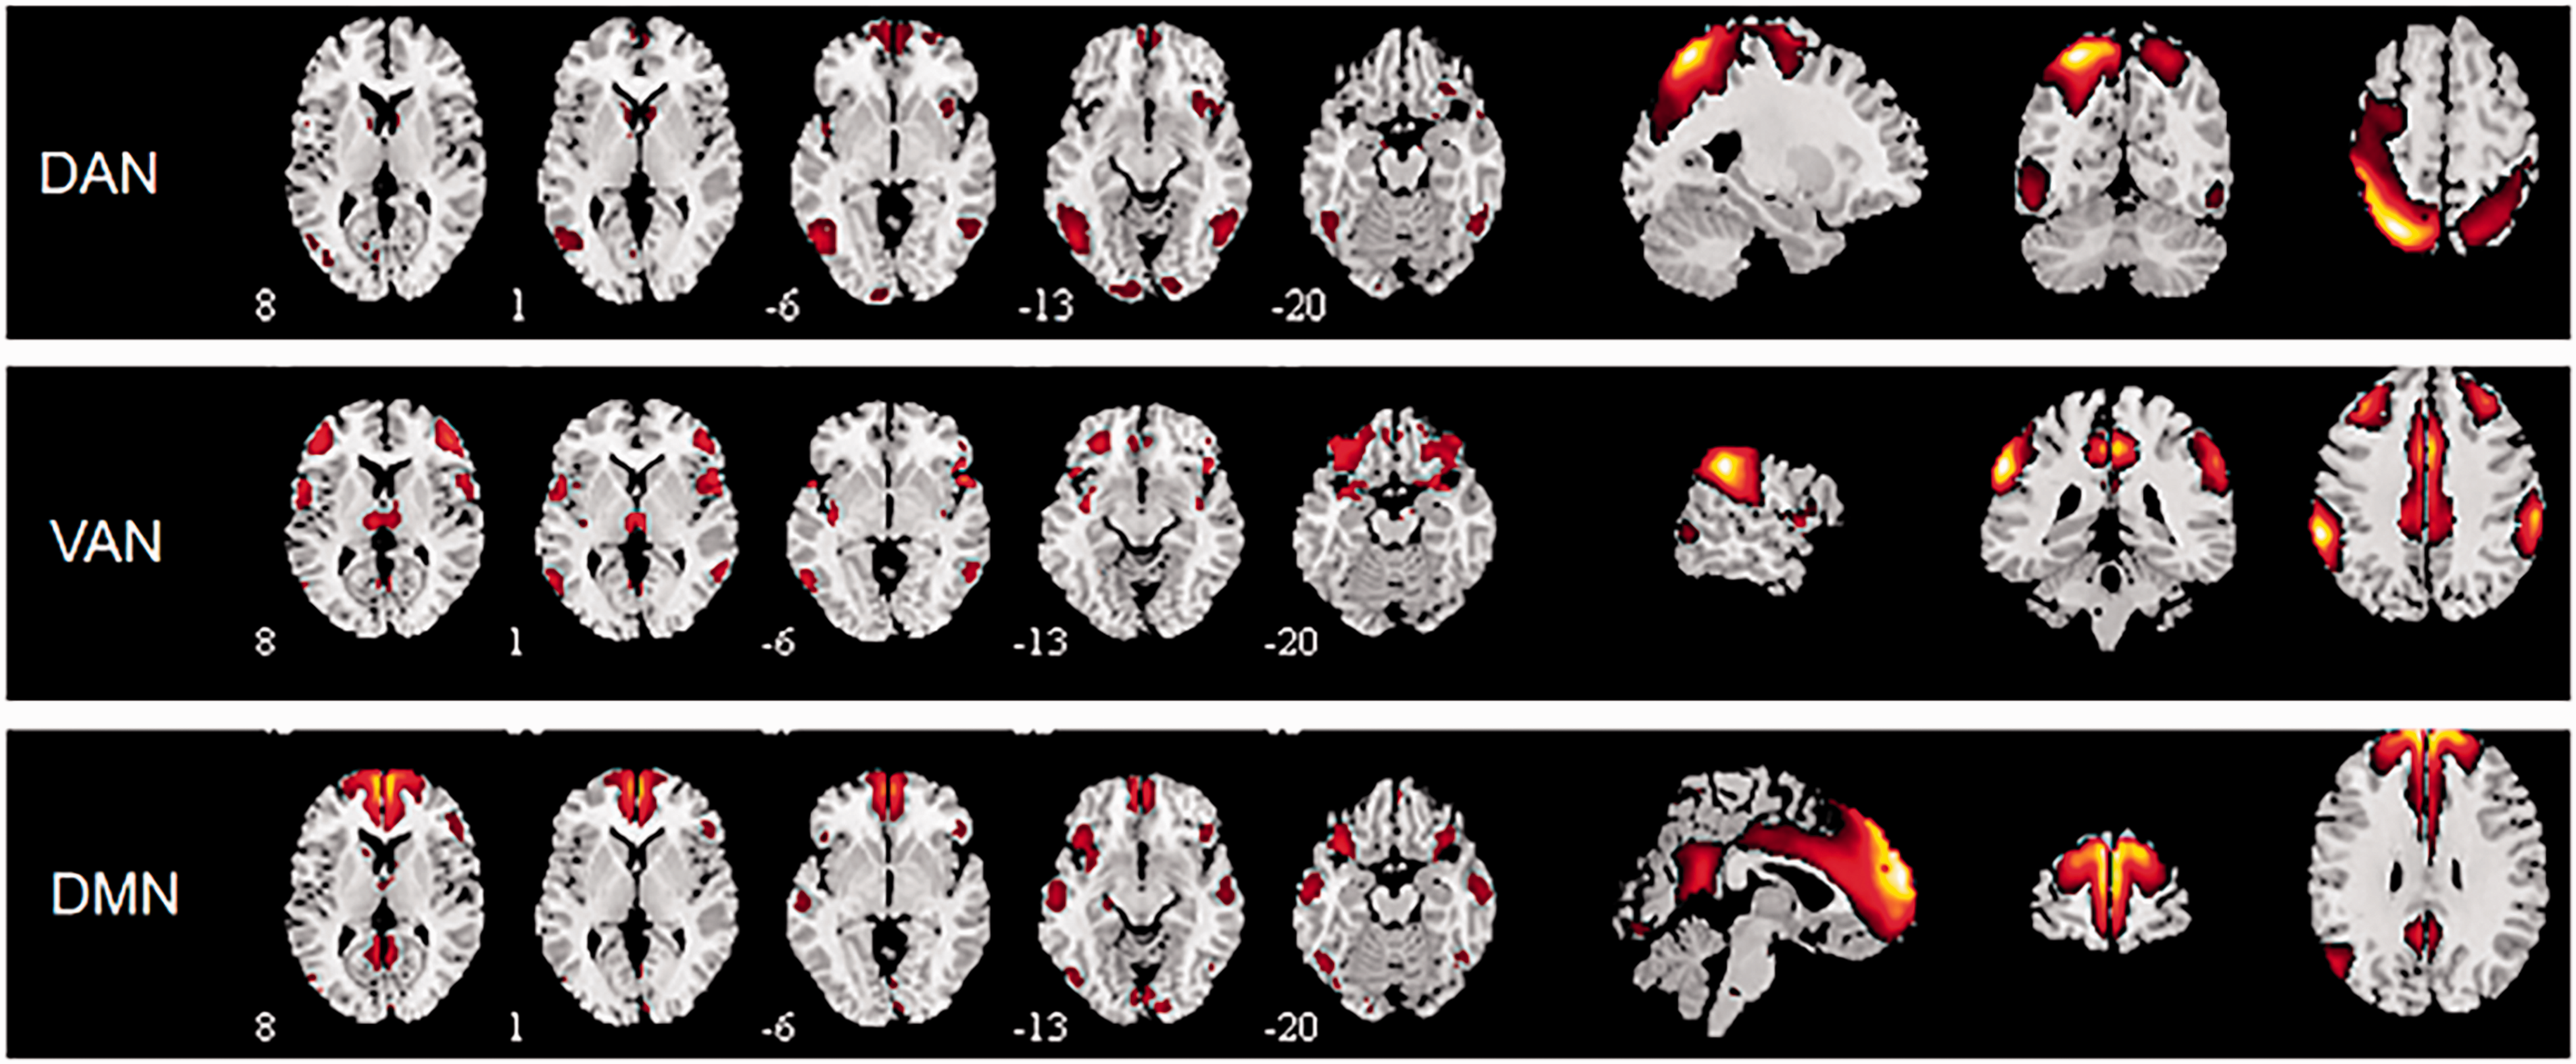
Components of the dorsal attention network (DAN), ventral attention network (VAN), and default mode network (DMN).
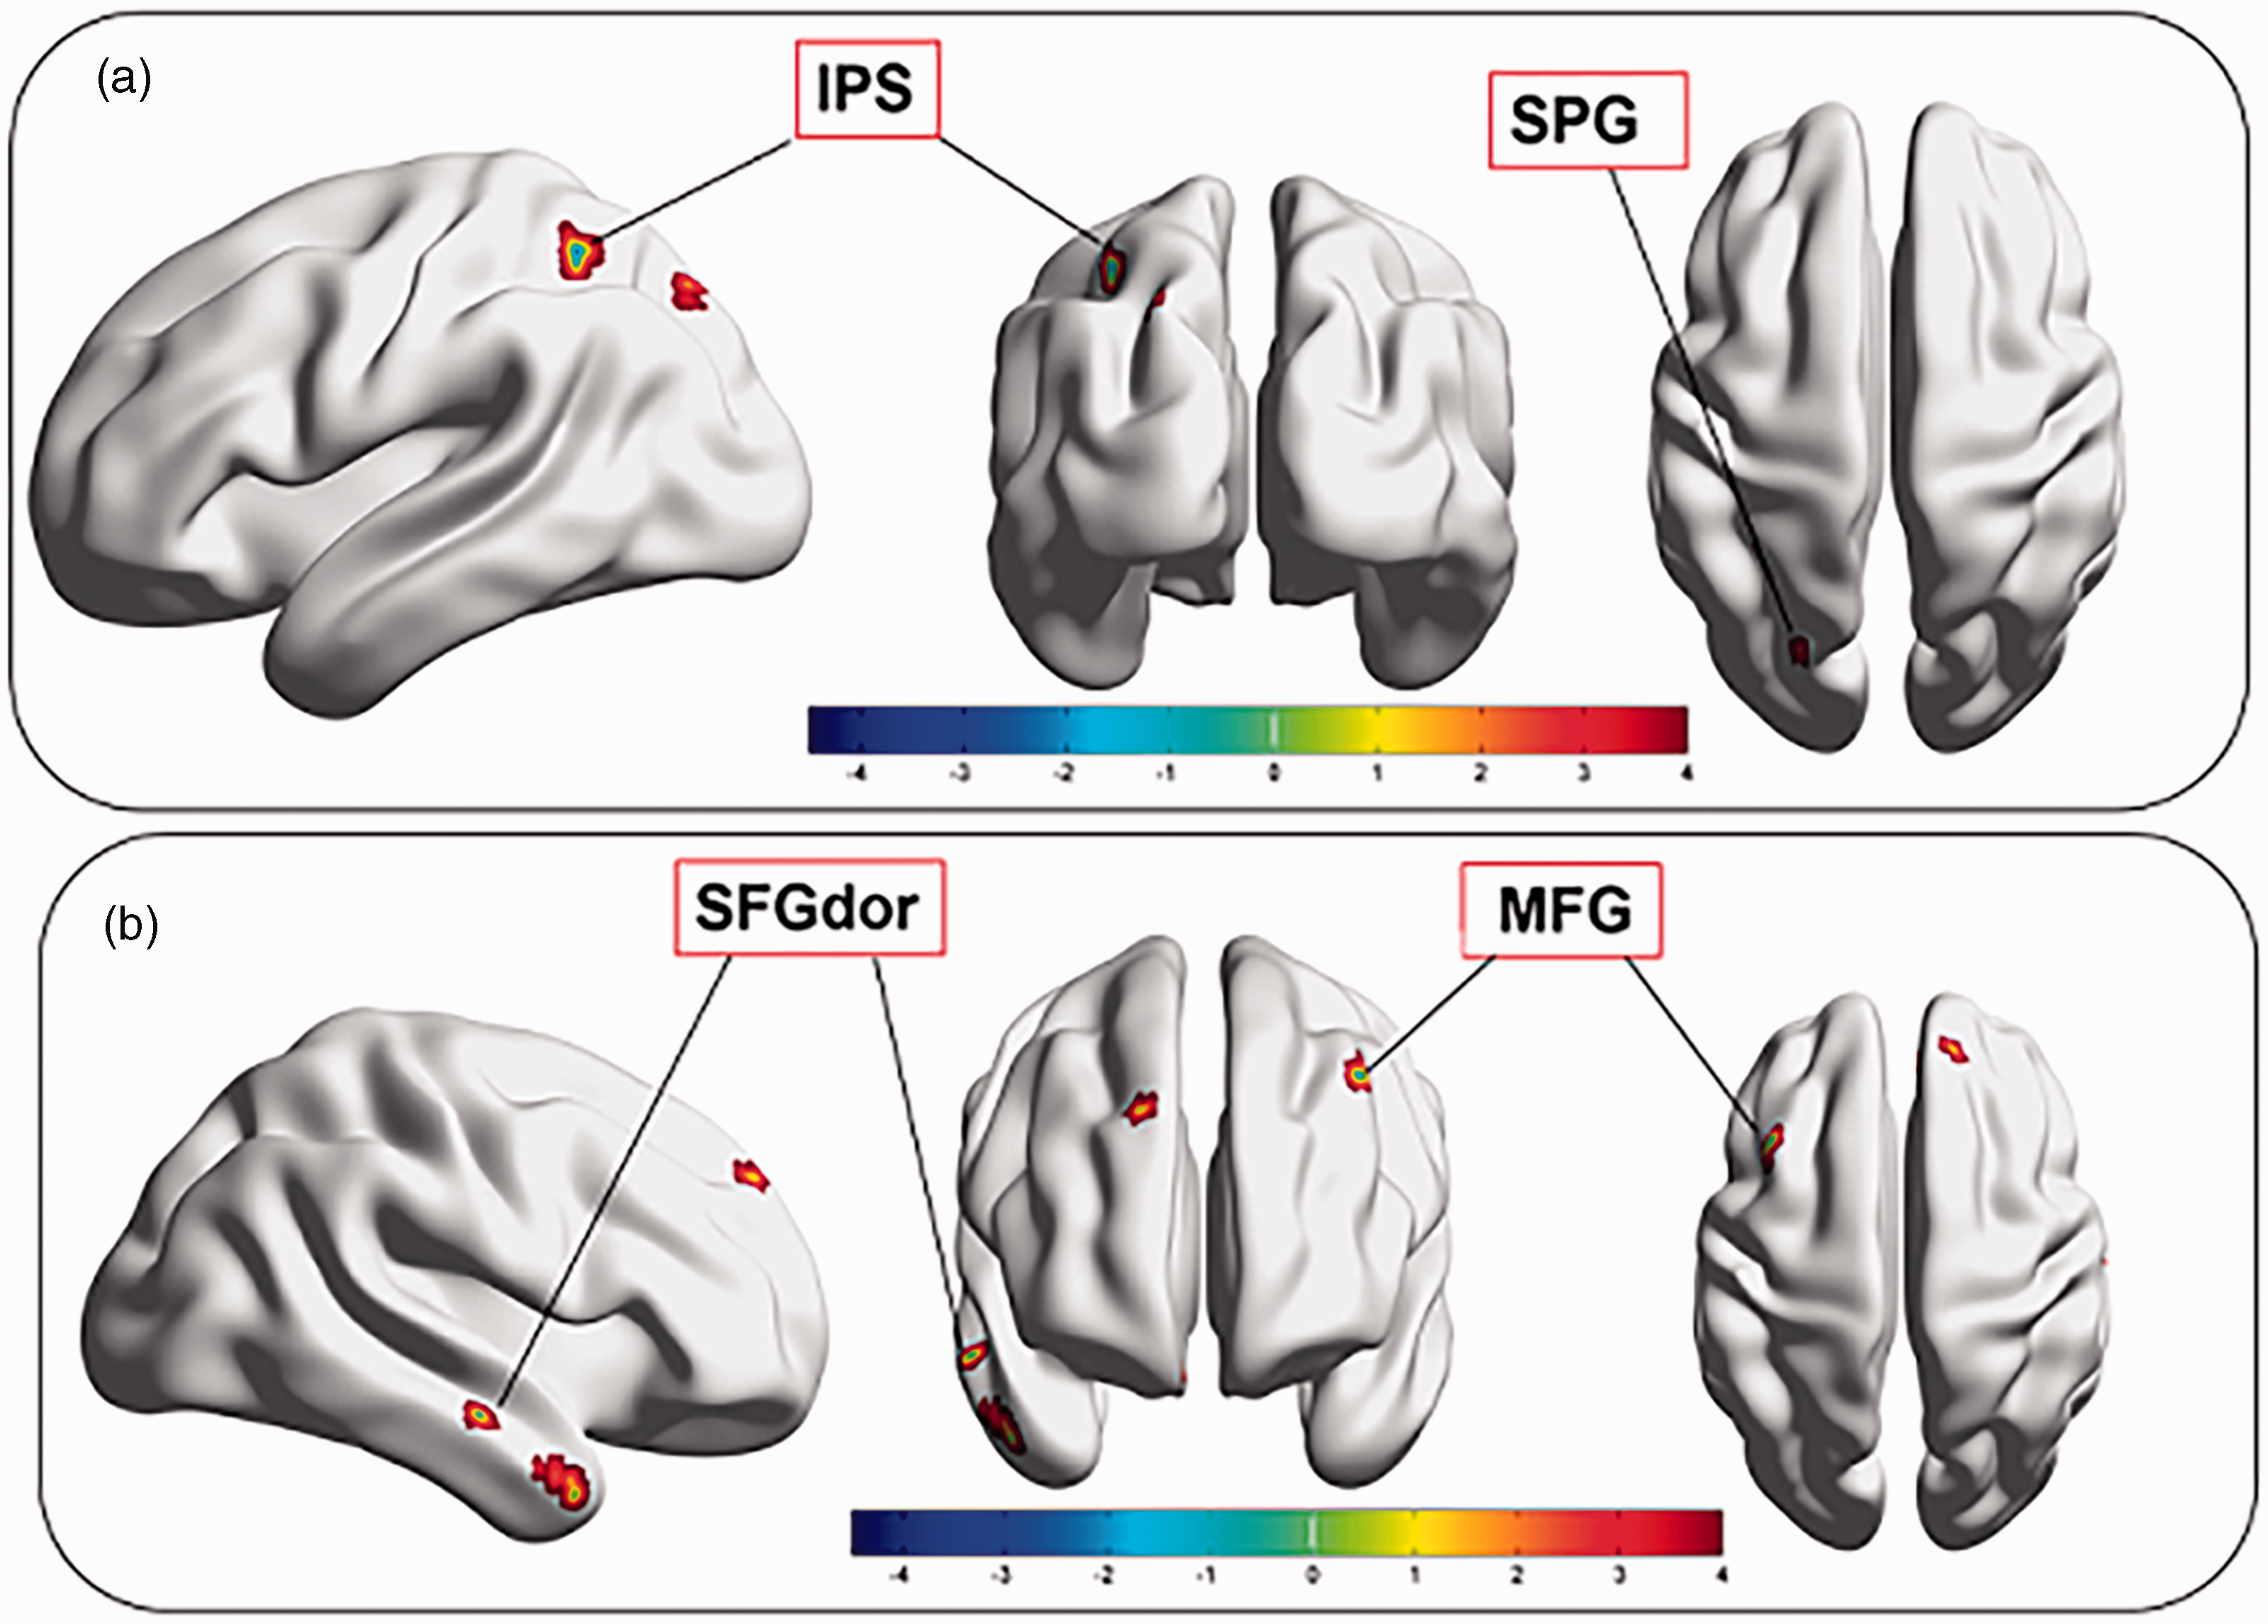
(a) Brain regions from the dorsal attention network (DAN). (b) Brain regions from default mode network (DMN).
Group comparisons of the ICA alterations between patients with AUD and HCs.
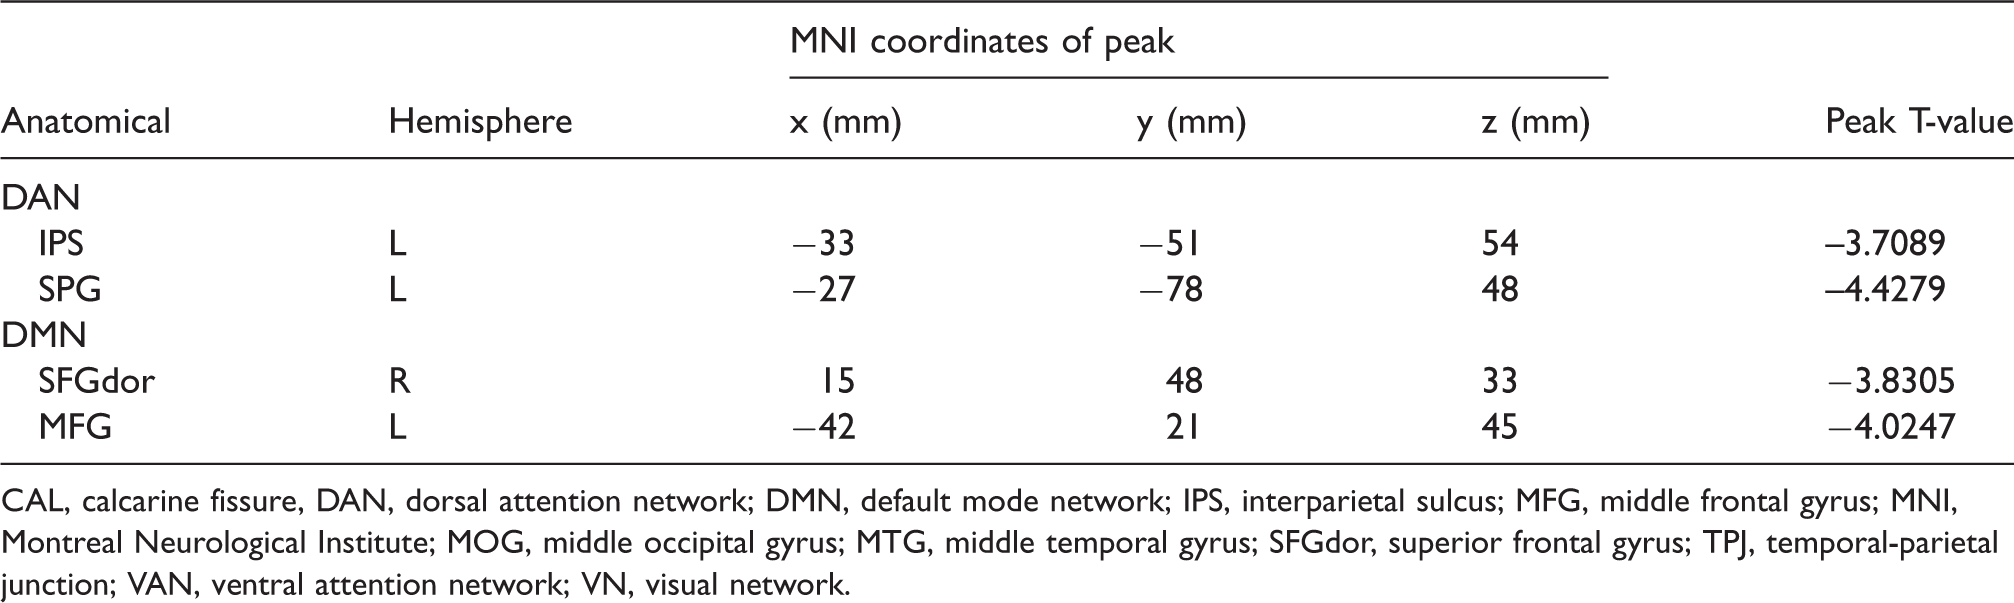
CAL, calcarine fissure, DAN, dorsal attention network; DMN, default mode network; IPS, interparietal sulcus; MFG, middle frontal gyrus; MNI, Montreal Neurological Institute; MOG, middle occipital gyrus; MTG, middle temporal gyrus; SFGdor, superior frontal gyrus; TPJ, temporal-parietal junction; VAN, ventral attention network; VN, visual network.
In GCA, a pairwise GC time sequence was used to find network interactions among the DAN and DMN. Significant causal connections among these ROIs are represented schematically in Fig. 3a. Numerical values from the GC analysis represent the strength of causal interactions (Table 3). We found a negative causal effect from the left IPS to the right SFGdor, indicating that the DAN exerts a negative causal effect on the DMN, whereas a positive causal effect was observed from the right SFGdor and left MFG to the left IPS indicating that the DMN exerts a positive causal effect on the DAN (Fig. 4).
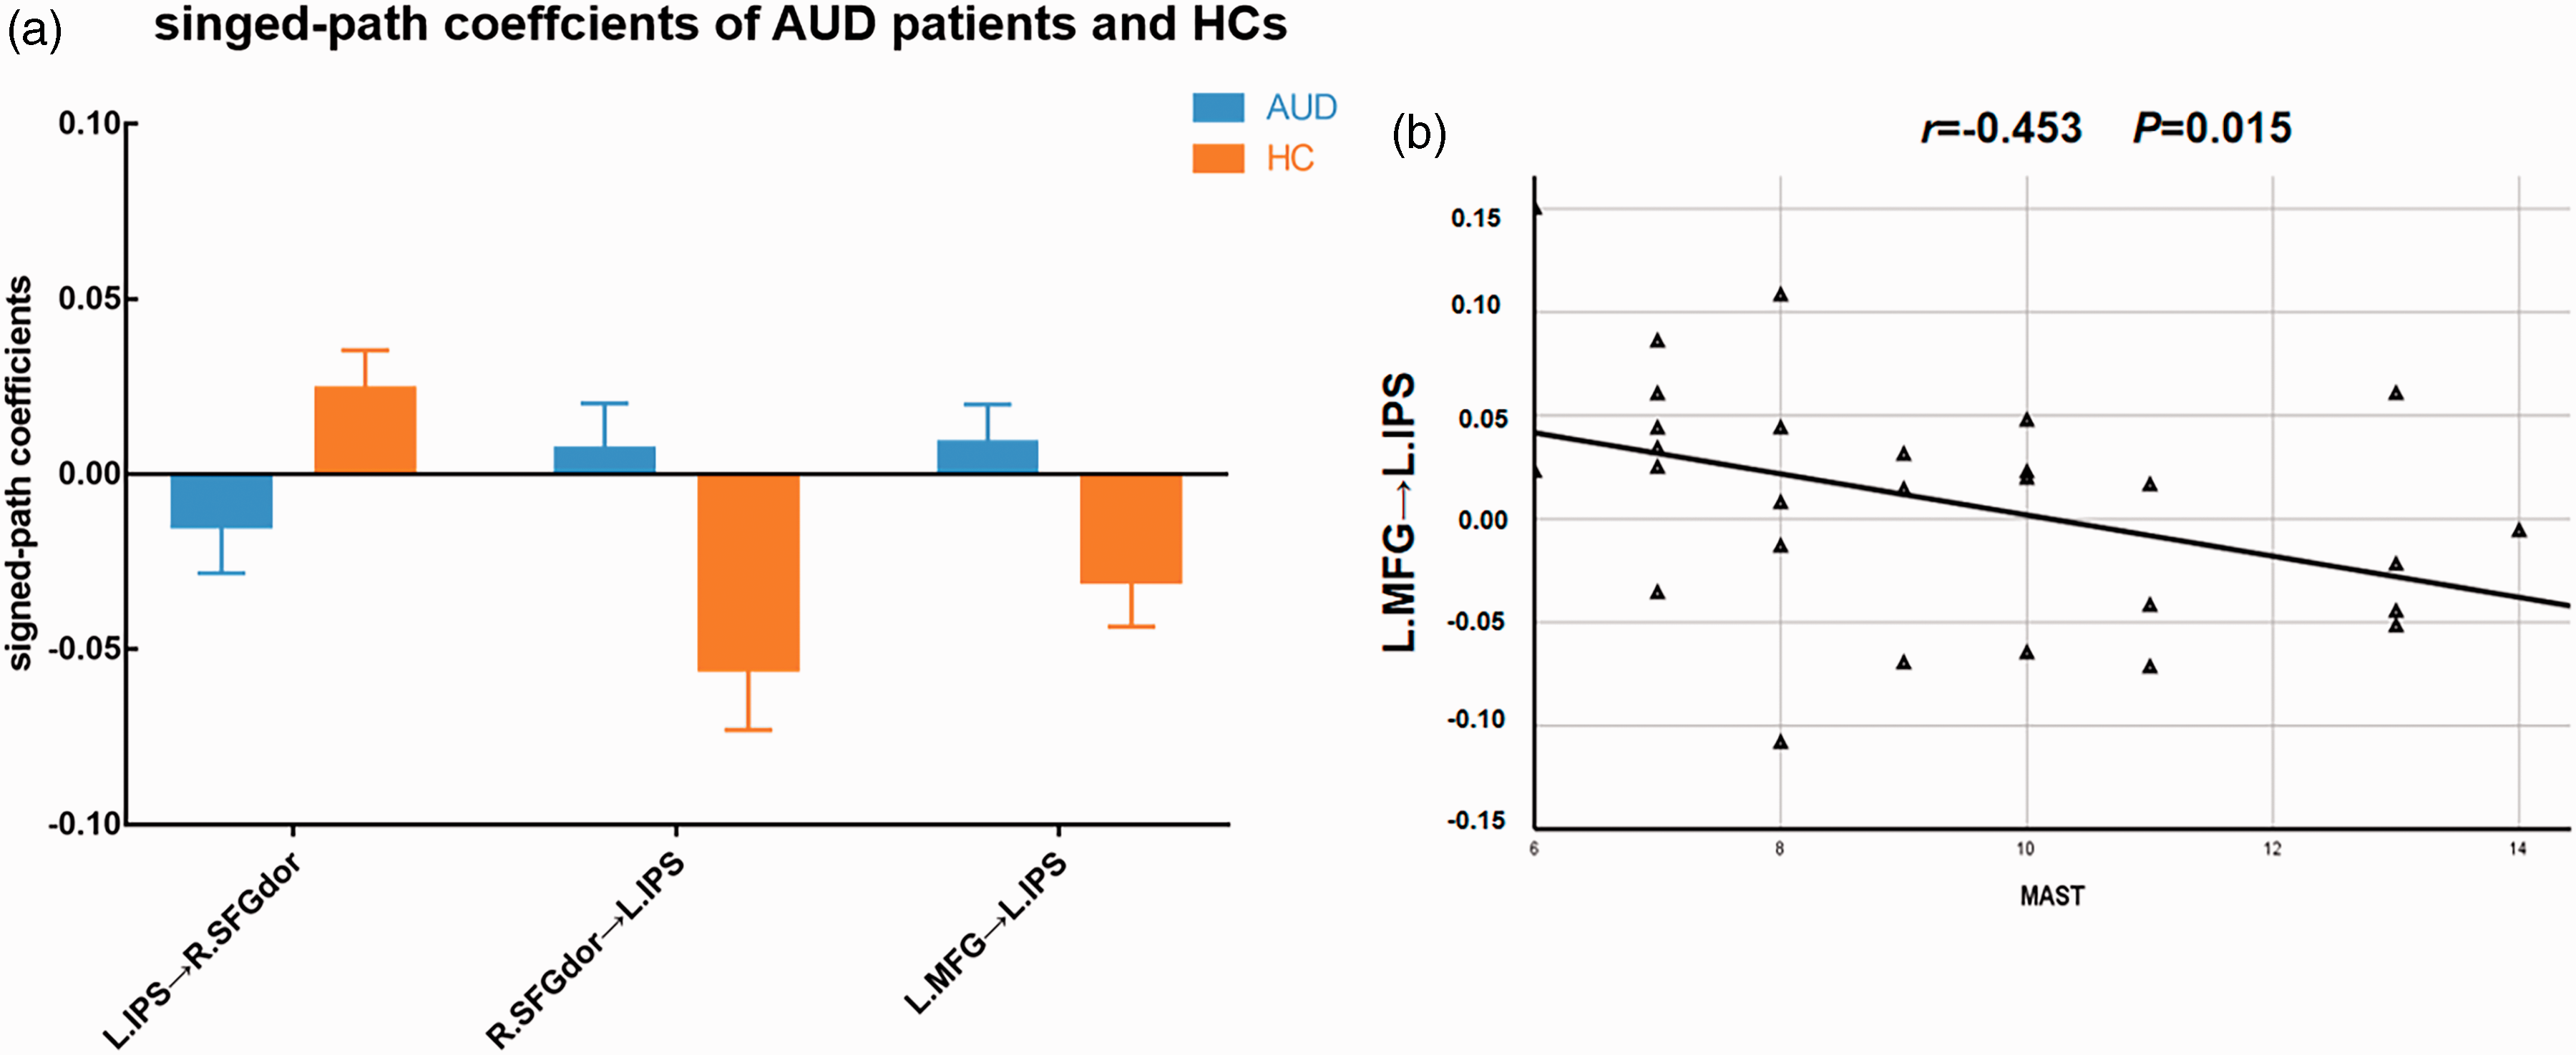
(a) Comparison of signed-path coefficients between patients with AUD and HCs; error bars define the SEM. (b) Correlation between signed-path coefficients from the left MFG to the left IPS and MAST scores. AUD, alcohol-use disorder; HC, healthy control; IPS, interparietal sulcus; MAST, Michigan Alcoholism Screening Test; MFG, middle frontal gyrus; SEM, standard error of the mean.
Significant difference in Granger causality analysis results among networks.
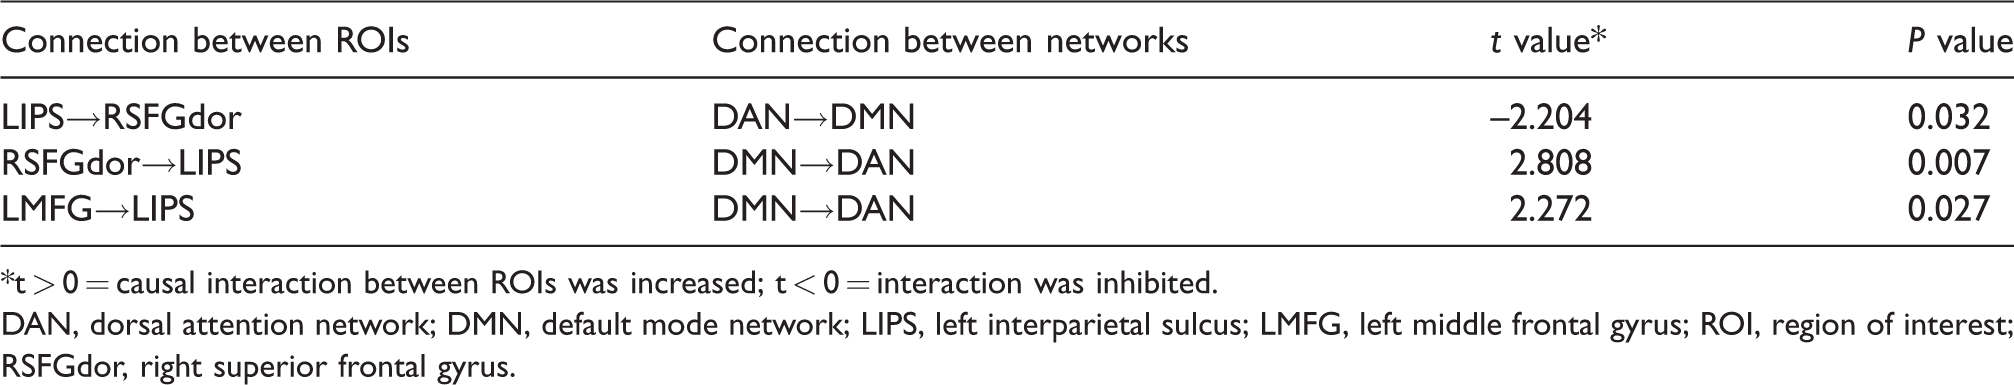
*t > 0 = causal interaction between ROIs was increased; t < 0 = interaction was inhibited.
DAN, dorsal attention network; DMN, default mode network; LIPS, left interparietal sulcus; LMFG, left middle frontal gyrus; ROI, region of interest; RSFGdor, right superior frontal gyrus.
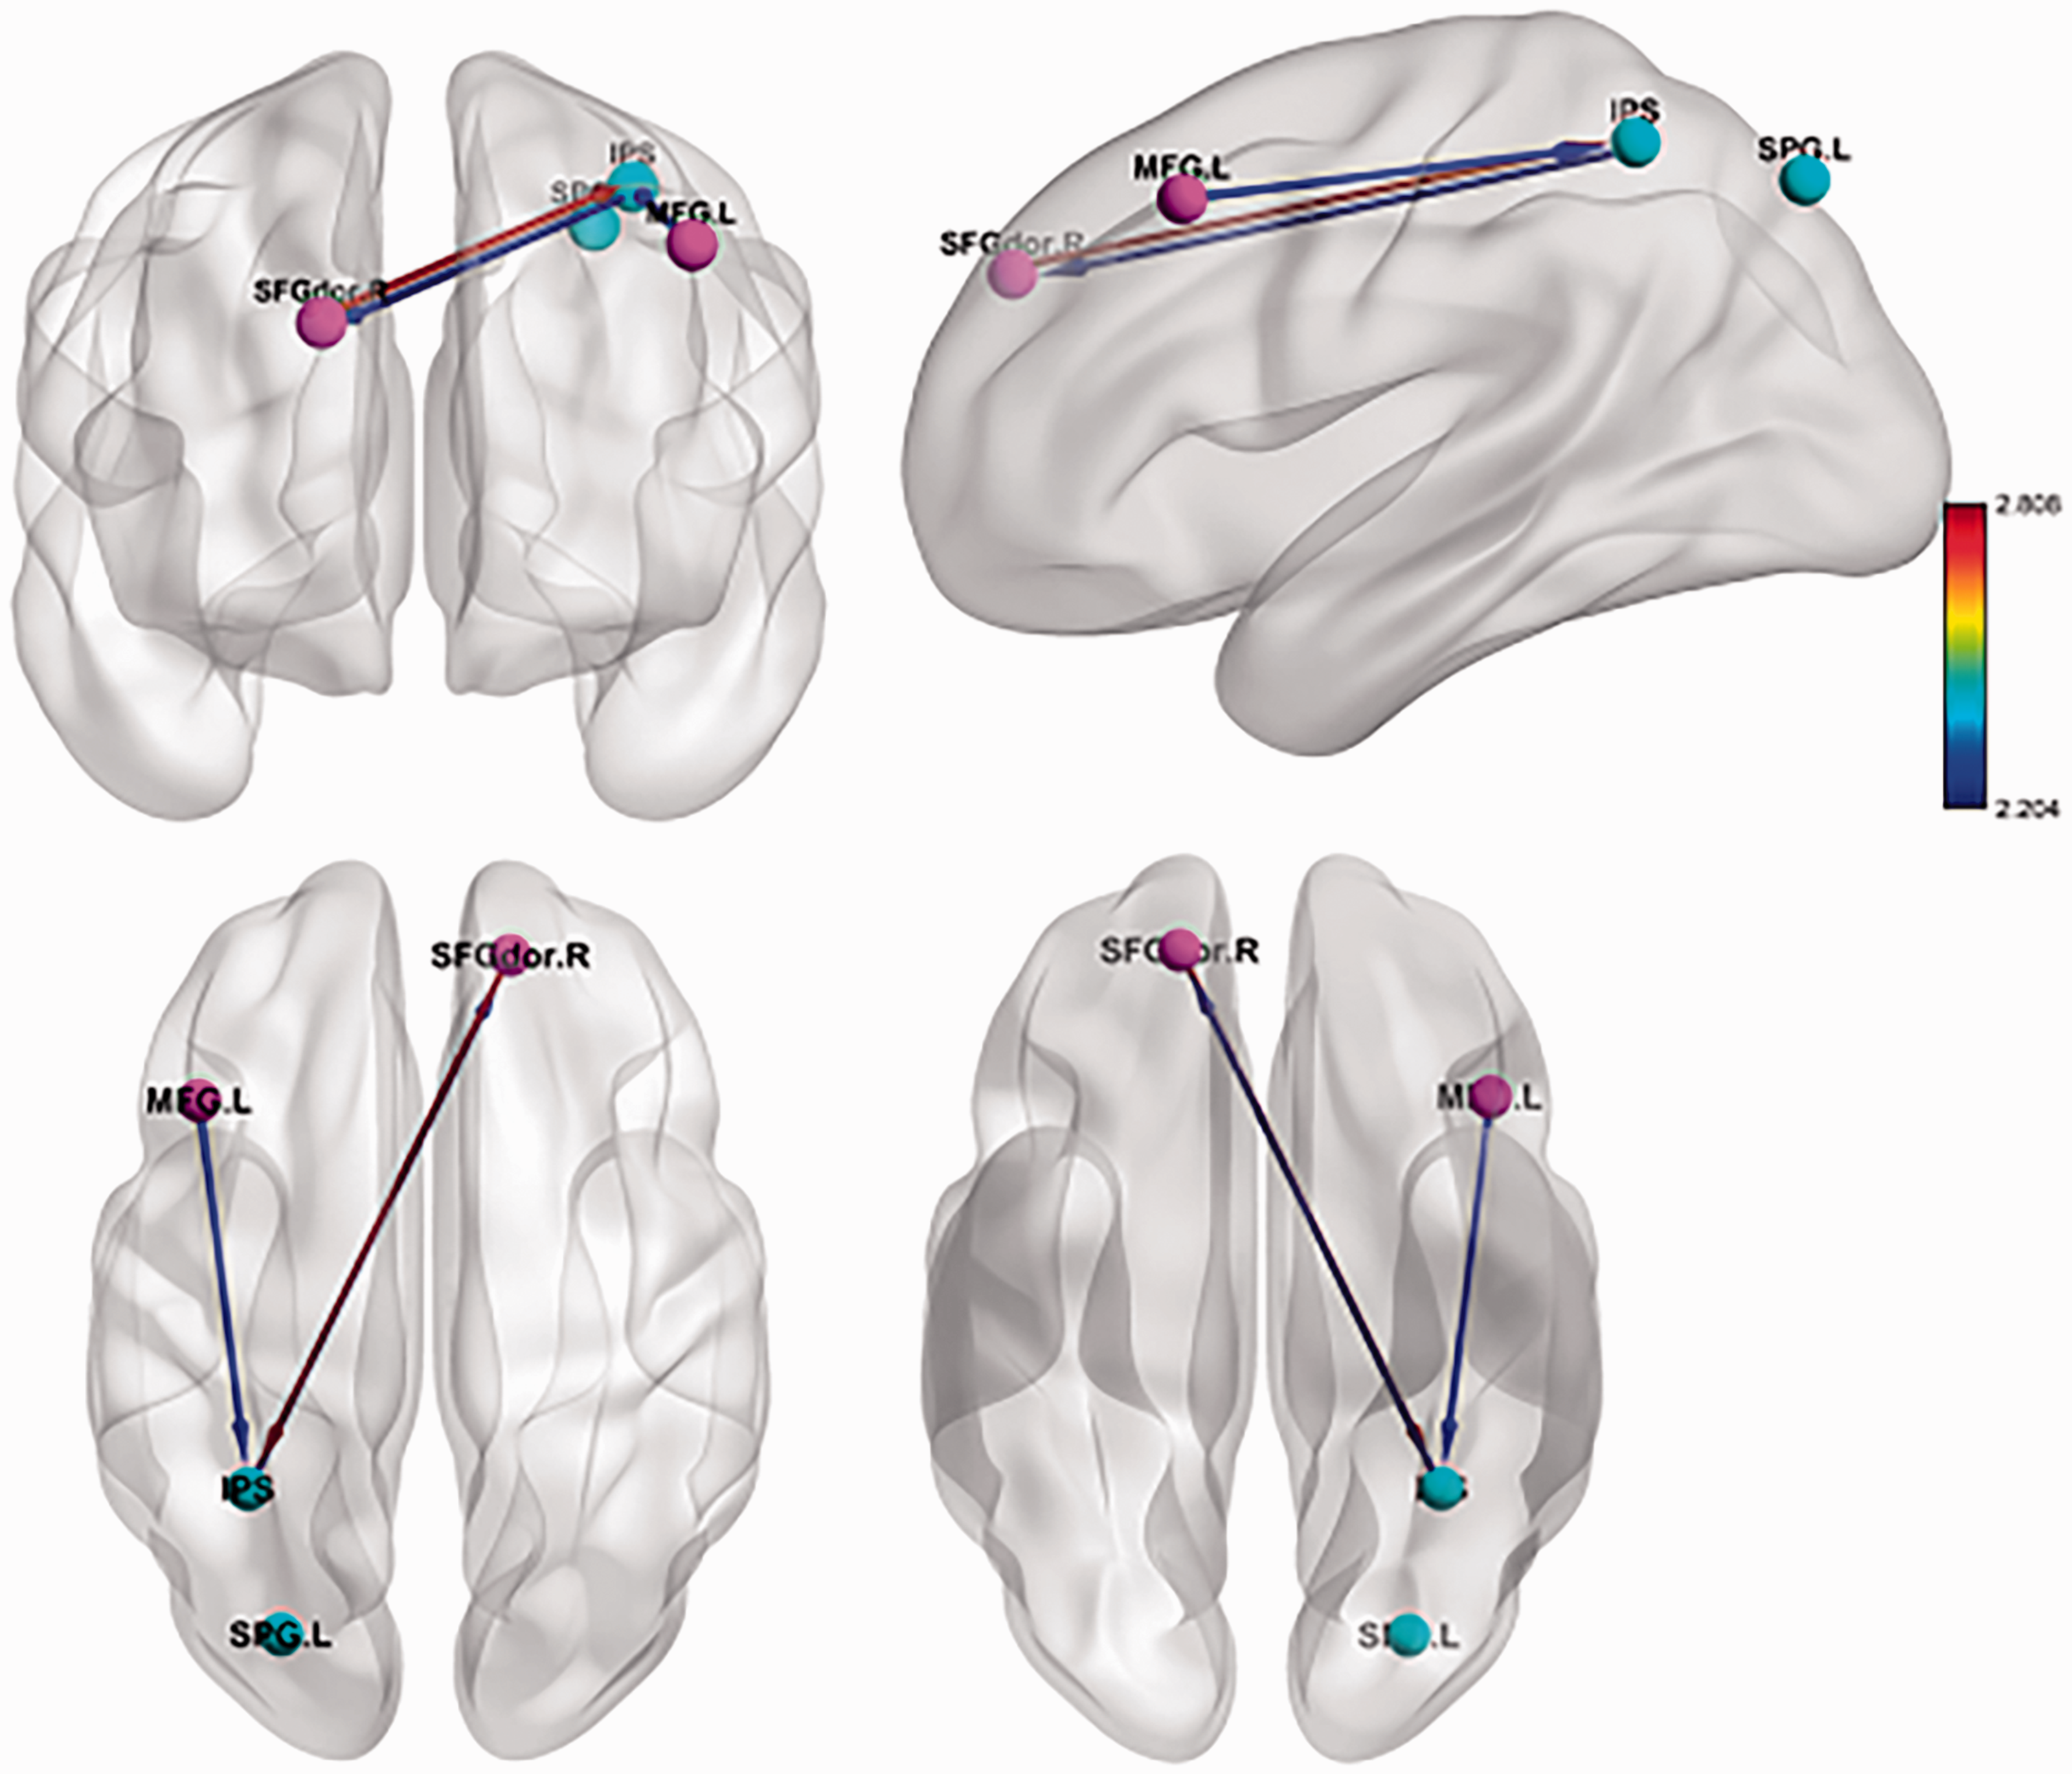
Arrows represent GC strength. Bold arrows indicate that GC strength survived multiple testing correction (uncorrected P < 0.005). Nodes are from the dorsal attention network (DAN) and default mode network (DMN). GC, Granger causality; LIPS, left interparietal sulcus; RMFG, right middle frontal gyrus; RSFGdor, right superior frontal gyrus.
Correlation analysis
The signed-path coefficients from the left MFG to the left IPS and MAST scores showed a significant negative correlation (r = –0.453, P = 0.015; Fig. 3b).
Discussion
Chronic alcohol consumption causes impaired attention as well as a series of other cognitive impairments (20,36,37). Chronic alcohol consumption can affect attention by limiting the capacity to process goal-relevant information and impeding the frontoparietal circuitry (38). Attention networks are primarily divided into the DAN and VAN. Processing of attentional functions in both hemispheres is asymmetrical; lateralization of the attention network to the left hemisphere in healthy individuals is advantageous for orientation function (39). The DAN is involved in voluntary (top-down) orienting and shows increased activity after presentation cues that indicate where, when, or what should receive individuals’ attention (40); the VAN is associated with non-spatial attention and bottom-up stimulus-driven attentional selection processes. However, because fMRI studies on attention networks in patients with AUD is scarce, we focused on attention networks in patients with AUD and investigated the interactions between these and other RSNs.
Patients with AUD showed significantly decreased FC in the left IPS, core regions of the DAN. Our results indicate that this is most likely because of brain function impairment might have caused restrained DAN functions in patients with AUD. The IPS is predominantly associated with attentional orientation, which refers to the ability to select target information from the sensory information received. Orientation dysfunction results in greater sensitivity to alcohol-related cues and no significant response to control stimuli, supporting the results of previous studies that reported an attentional bias toward alcohol stimuli in AUD (20,21).
In the DMN, both the SFGdor, and MFG exhibited reduced FC in the AUD group. The main regions of these brain networks are consistent with those reported previously (41). The changes in ReHo of individuals with AUD indicated that specific regional neural populations are more strongly connected in the resting-state; these include the SFGdor, MFG, and MTG (41). Furthermore, combined with functional and structural MRI findings (9,42), the abnormal neuronal activity in the bilateral frontal lobes of patients with AUD may be related to the occurrence and development of alcohol dependence and relapse after abstinence, which may be the main pathophysiological basis of failure of alcohol abstinence behavior in individuals with AUD (9).
Human brain networks do not function in isolation. Fox et al. (42) found a negative correlation between the DMN and DAN; the DMN systematically deactivates when the DAN is activated. This negative correlation suggests a competitive relationship between the DMN and DAN. A recent GCA study (43) showed that in healthy volunteers, the DMN exerted a positive causal effect on the external attention system (EAS), which comprise the DAN, CEN, and SN. Unlike healthy individuals, patients with AUD presented more complex causal influences between brain networks. Our observations suggest that the DMN exerts a positive causal effect on the DAN, which in turn exerts a negative causal effect on the DMN. We speculate that alcohol consumption may disrupt network interactions. For the DMN, the increased capacity to regulate the DAN in cases with alcoholism could be associated with compensation for DAN dysfunction. The temporal lobes of patients with epilepsy (30) and Alzheimer’s disease (44) show similar disrupted network interactions. Interestingly, the causal effect from the right MFG (in the DMN) to the left IPS correlated negatively with MAST scores, suggesting dysconnectivity between the DMN and DAN as a potential mechanism of chronic alcohol consumption induced cognitive impairment. A previous fMRI study (44) reported exchange of information between the DAN and VAN. However, our results showed no significant causal effect between them; the intrinsic correlation between the TPJ and IPS was not sufficiently strong for the IPS to be involved in top-down information transfer to the VAN (44).
Our study had some limitations. The sample size was relatively small, and larger sample sizes are required in future studies. This present study was cross-sectional, and we could not directly identify the causal relation between AUD and abnormal connectivity. Therefore, additional longitudinal studies might help to address this question. Finally, GCA of fMRI data is an exploratory method limited by potential spurious directionality, because of the variability in hemodynamic response function (46). Future studies are thus needed to improve the study design and analysis methods.
In conclusion, our study extends the current knowledge by identifying novel intrinsic connectivity patterns derived by ICA, as well as inter-network connectivity dysfunctions in patients with AUD. Our findings show that patients with AUD have abnormal causal relations between the DAN and DMN at rest. Thus, patients with AUD may present abnormal top-down attention modulation and cognition.
Footnotes
Declaration of conflicting interests
The author(s) declared no potential conflicts of interest with respect to the research, authorship, and/or publication of this article.
Funding
The author(s) received the following financial support for the research, authorship, and/or publication of this article: The study is supported by grants from the Hubei Key Laboratory of Medical Information Analysis and Tumor Diagnosis &Treatment (ZYYFY2014013).