
Abstract
Background
We know little about the changes of brain activity in patients with normal-tension glaucoma (NTG).
Purpose
To investigate the altered spontaneous brain activity in patients with NTG through the resting state functional magnetic resonance imaging–fractional amplitude of low-frequency fluctuation (rsfMRI-fALFF) technique, and to explore the relationship with optical coherence tomography (OCT) and field of vision.
Material and Methods
Twenty patients with NTG and 20 healthy controls (HCs) (matched for sex, age, and level of education) were enrolled. Spontaneous cerebral activity variations were investigated using the rsfMRI-fALFF technique in all individuals. The average fALFF values of patients with NTG and HCs were compared.
Results
Compared with HCs, patients with NTG had significantly lower fALFF values in the right angular gyrus and precuneus; however, higher fALFF values in the brain regions were not observed. The values showed statistically significant negative correlation with those of the retinal nerve fiber layer (right angular gyrus: r = −0.607, P = 0.010; right precuneus: r = −0.504, P = 0.020). There was no significant correlation between the fALFF value and cup-disc ratio (right angular gyrus: r = 0.158, P = 0.494; right precuneus: r = −0.087, P = 0.706), mean deviation (right angular gyrus: r = 0.096, P = 0.468; right precuneus: r = 0.026, P = 0.845), and pattern SD value (right angular gyrus: r = 0.064, P = 0.626; right precuneus: r = −0.145, P = 0.268).
Conclusion
Abnormal spontaneous activities were detected in numerous brain regions of patients with NTG, which may provide useful information for understanding the dysfunction in NTG. These activity changes in brain regions may be used as effective clinical indicators for NTG.
Keywords
Introduction
Normal-tension glaucoma (NTG) is a severe eye disease associated with aging and linked to a high probability of blindness. A survey among Chinese individuals in Singapore showed that the incidence of glaucoma in elderly persons aged >60 years was 4.8%; of those cases, 61% were NTG (1). The onset of this type of glaucoma is obscure; the disease progresses slowly and its course is long. The diagnosis of NTG at the initial stages of the disease is challenging, and the condition has a substantial social and economic impact. Therefore, research studies on the prevention and control of NTG are particularly important. In recent years, an increasing number of scholars have extended their investigations to the central level of NTG (2). The number of studies investigating NTG based on central nervous system functional research is increasing. In addition, the rapid development of living, non-invasive, and repeatable resting state functional magnetic resonance imaging–fractional amplitude of low-frequency fluctuation (rsfMRI-fALFF) imaging technology provides an effective means to explore the central changes occurring in NTG (3). We have previously discovered that rsfMRI in patients with angle-closure glaucoma demonstrated significant changes (4). The present study used the rsfMRI-fALFF method to observe changes in the brain function of patients with NTG and analyze in detail the correlation between each brain function test index and optical coherence tomography (OCT) and visual field. The aim of the present study was to evaluate the usefulness of the rsfMRI-fALFF technology in the diagnosis of NTG and its value in the assessment of disease severity.
Material and Methods
Participants
A total of 20 patients with NTG, examined at the hospital between August 2018 and October 2019, were enrolled in the present study.
The NTG group was diagnosed with NTG according to the standards established by the British Moorfields Eye Hospital (5). The inclusion criteria were: (i) untreated, 24-h mean intraocular pressure ≤21 mmHg (1 mmHg = 0.133 kPa), and lack of intraocular pressure measurements >24 mmHg (Goldmann applanation tonometer); (ii) the angle was open; (iii) no secondary causes of optic neuropathy in glaucoma, such as previous traumatic intraocular pressure elevation, long-term use of corticosteroids, history of uveitis, etc.; (iv) typical glaucomatous optic nerve damage (glaucoma cup formation and disc edge loss); (v) conventional visual field examination found visual field defects consistent with glaucoma optic nerve damage; and (vi) progressive glaucoma damage.
The exclusion criteria were: (i) other types of glaucoma (closed-angle glaucoma, secondary glaucoma, etc.) or other eye diseases; (ii) other systemic diseases, such as diabetes, hypertension, neurological or psychiatric diseases; (iii) metal foreign bodies present throughout the body (e.g. patients with pacemakers); and (iv) factors that may affect the results of the study, such as drinking, smoking history, claustrophobia, etc.
A total of 20 healthy controls (HCs) (matched with the corresponding patients in the NTG group in terms of age, sex, and level of education) were also recruited. The inclusion criteria for the control group were: (i) no history of systemic and ophthalmological diseases, absence of systemic disease determined through physical examination, exclusion of abnormal eye structure and function, and healthy volunteers with a history of eye surgery; (ii) sex, age, and level of education consistent with those in the NTG group; (iii) normal mental state and nervous system; and (iv) no contraindications for MR examination (i.e. presence of a pacemaker or metal device installed in the body, etc.).
The present study was conducted in accordance with the tenets of the Declaration of Helsinki and formally approved by the Medical Ethics Committee of the of the First Affiliated Hospital of Nanchang University (Nanchang, PR China). All participants provided written informed consent.
rsfMRI scan
The data were collected in the MR examination room of the Imaging Department of the hospital. A 3-T scanner (MAGNETOM Trio, A Tim System, Siemens AG, Munich, Germany) was used and an eight-channel head coil was selected. The participants were in the supine position, sponge pads were fixed on both sides of the head, and earplugs were worn to reduce noise during scanning. The scanning field covered the whole brain. The scanning sequence was as follows. First, we obtained a conventional T1-weighted imaging sequence (scanning parameters: TR = 1800 ms, TE = 2.25 ms, layer thickness = 1.0 mm, layer interval = 0.5 mm, matrix = 255 × 255, field of view [FOV] = 250 × 250 mm, inversion angle = 90°) to capture brain image pictures and exclude no substantial lesions of the brain. Second, a rsfMRI scan was acquired using a flat gradient sequence (scanning parameters: repetition time = 2000 ms, echo time = 30 ms, layer thickness = 4.0 mm, layer interval = 1.2 mm, matrix = 64 × 64, inversion angle = 900°, FOV = 220 × 220 mm). Twenty-nine axial layer pictures were captured at each time point, the scanning time was 8 min, and 240 functional brain images were captured.
rsfMRI data processing
For preprocessing and analysis, rsfMRI raw data were utilized with statistical parameter maps (Statistical Parametric Mapping, SPM5; http://www.fil.ion.ucl.ac.uk/spm) and the REST software (by Song et al., http://www.restfmri.net) to: (i) convert the original data to NIFTI format; (ii) perform inter-layer time correction and head motion correction on the remaining images, and estimate the head motion parameters during scanning; (iii) normalize the fMRI image to the standard EPI template provided by SPM and resampled (voxel size = 3 × 3 × 3 mm); (iv) improve the signal-to-noise ratio (a 4-mm half-high-full width Gaussian was used to perform spatial smoothing of the fMRI image); (v) remove linear trends; and (vi) reduce low-frequency drift and high-frequency noise (band-pass filtering was performed on the time series of each voxel with a band-limit range of 0.01–0.1 Hz).
Calculation of fALFF values
Following data preprocessing, we used the fALFF method to further analyze the rsfMRI data. We calculated the fALFF value of all voxels in the test data in the frequency bands of 0.01–0.1 Hz, 0.01–0.027 Hz, and 0.027–0.073 Hz. In addition, we normalized the fALFF value with the fALFF whole-brain mean to reduce inter-subject variability. The fALFF value is the ratio of the ALFF value of the specified frequency band (e.g. 0.01–0.08 Hz) to the ALFF of the entire frequency band, which can effectively reduce the difference in global effects between individuals. The REST software was used to calculate the fALFF value of the whole brain.
Collection of OCT data
The OCT instrument Cirrus HD-OCT (Carl Zeiss Meditec, Inc., Dublin, CA, USA) was used for inspection. All inspections and data measurements were performed by a single operator under identical conditions. The method of OCT examination was as follows: the examination was performed in a dark room, and the pupil status was natural. The information of the individuals was entered into the inspection interface, and the eye type and Optic Disc Cube 200 × 200 mode were selected. The participant was instructed to place the lower jaw on the lower jaw rest, with the forehead pressed against the forehead support, and adjust the height of the examination table and seat to ensure a comfortable position. The examinee was requested to look at the fixation cursor (green “meter” center) in the instrument, which was adjusted based on the subject’s refractive status to obtain the clearest image. With the center of optic disc as the center, the optic disc and its surrounding retina with a diameter of 3.4 mm were scanned in a circle. OCT examination data included the average retinal nerve fiber layer (RNFL) thickness (average RNFL) around the optic disc and the optic disc cup-disc (C/D) ratio.
Acquisition of computer visual field inspection data
The Humphrey-750i (Zeiss, Germany) type automatic perimeter was used for inspection. All participants were guided by a single experienced operator. The visual field inspection method was as follows: all individuals had more than one automatic visual field inspection experience. Before the test, they adapted to the dark room for 5–10 min and performed the test under the state of the natural pupil. If there is ametropia, they were corrected with corresponding lenses. The Threshold program, central visual field 30-2 detection program, and SITA-fast (Humphrey Field Analyzer; Zeiss-Humphrey Instruments, Dublin, CA, USA) performed a static central visual field inspection of the central 30° range on the subject. The fixation vision loss rate, false-positive rate, and false-negative rate <15% in the visual field results were considered reliable. Two parameters in the visual field results were selected: mean deviation (MD) and pattern standard deviation (PSD).
Statistical methods
Analysis of variance was used to evaluate the differences in general information, as well as OCT and visual field detection indicators between the two groups. The chi-squared test was used to analyze the sex differences between the groups. The fALFF values between the two groups were compared using a two-sample paired t test comparison. A P < 0.05 (Monte Carlo correction) denoted statistically significant difference in the fALFF values between the two groups. The correlation between the fALFF value in the brain area of the NTG group and the C/D ratio, RNFL thickness value of the disc, visual field MD value, and PSD value were analyzed using the SPSS version 19.0 statistical software (IBM Corp., Armonk, NY, USA).
Results
Analysis of general data, OCT, and visual field detection indices between two groups
There were no significant differences in age, sex, and level of education between the NTG and HC groups. However, there were statistically significant differences in RNFL thickness, C/D ratio, MD value, and PSD value between the two groups (P < 0.001) (Table 1, Fig. 1).
Comparison of general data, OCT, and visual field detection indexes between the NTG and HC groups (x ± s).
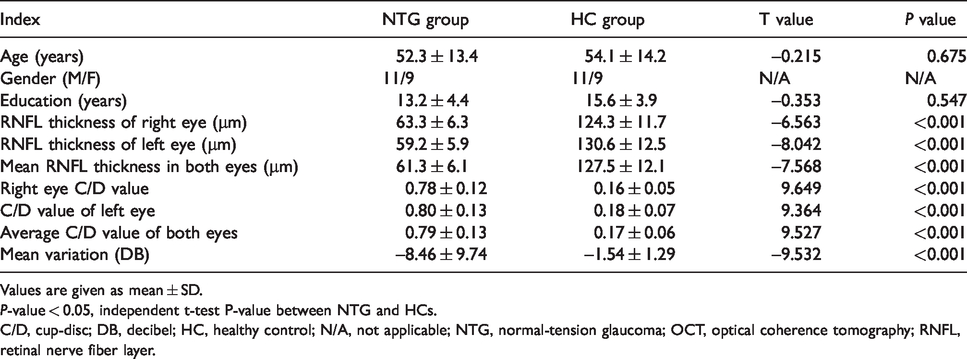
Values are given as mean ± SD.
P-value < 0.05, independent t-test P-value between NTG and HCs.
C/D, cup-disc; DB, decibel; HC, healthy control; N/A, not applicable; NTG, normal-tension glaucoma; OCT, optical coherence tomography; RNFL, retinal nerve fiber layer.
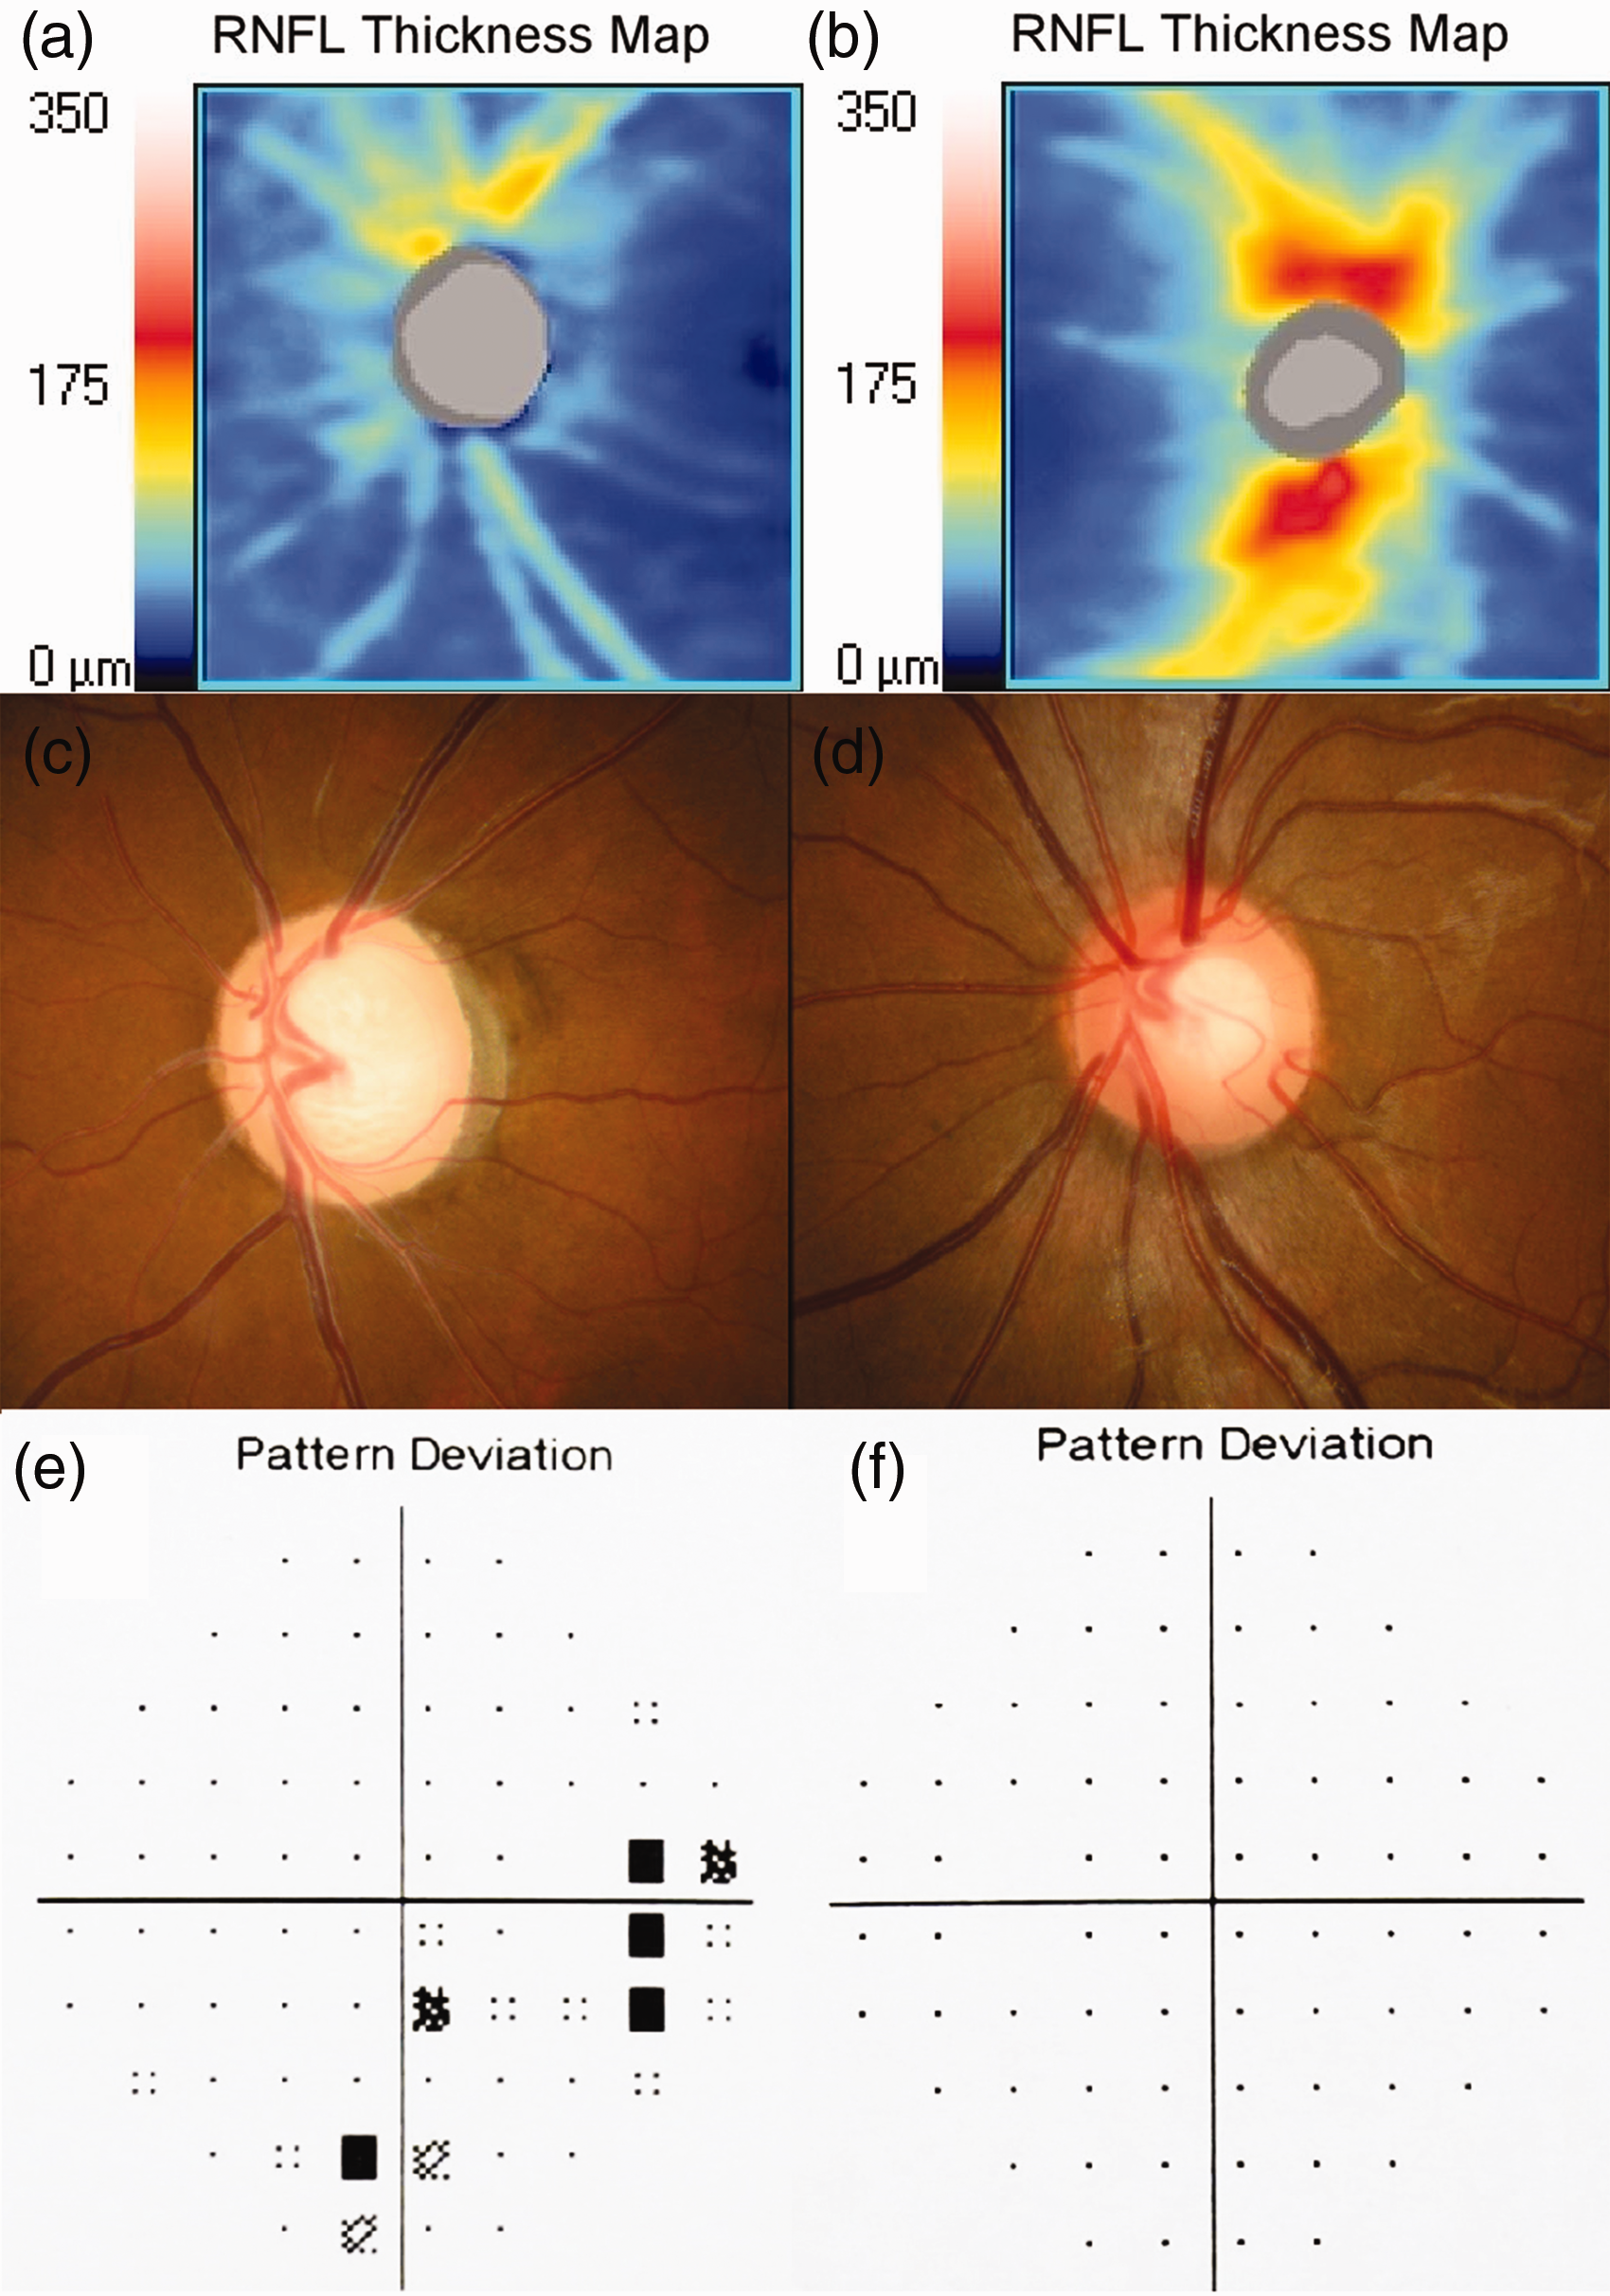
(a) A representative image of the distribution of RNFL thickness in the optic disc region of patients with NTG. (b) A representative image of the distribution of RNFL thickness in the optic disc region of HCs. (c) A representative image of the cup-disc ratio of normal tension glaucoma. (d) A representative image of the cup-disc ratio in HCs. (e) A representative image of the visual field of NTG and the boxes in (f) represent the location of visual field defect in patients with normal intraocular pressure glaucoma. (f) A representative image of the visual field of HCs. HC, healthy control; NTG, normal-tension glaucoma; RNFL, retinal nerve fiber layer.
rsfMRI-fALFF results and brain regions
The fALFF value in the right angular gyrus and the right anterior cuneiform lobe of the NTG group was significantly reduced compared with that recorded in the HC group (P < 0.05, AlphaSim corrected) (Table 2, Figs. 2 and 3). Moreover, there was no brain area found with an increased fALFF value.
Compared with the control group, the brain regions with reduced fALFF values in the NTG group.
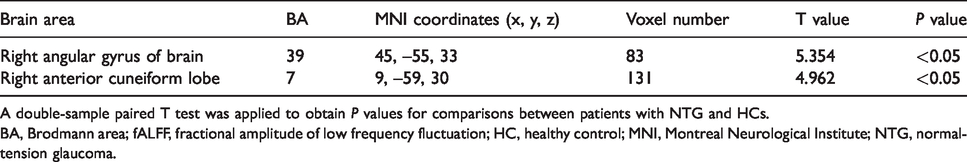
A double-sample paired T test was applied to obtain P values for comparisons between patients with NTG and HCs.
BA, Brodmann area; fALFF, fractional amplitude of low frequency fluctuation; HC, healthy control; MNI, Montreal Neurological Institute; NTG, normal-tension glaucoma.
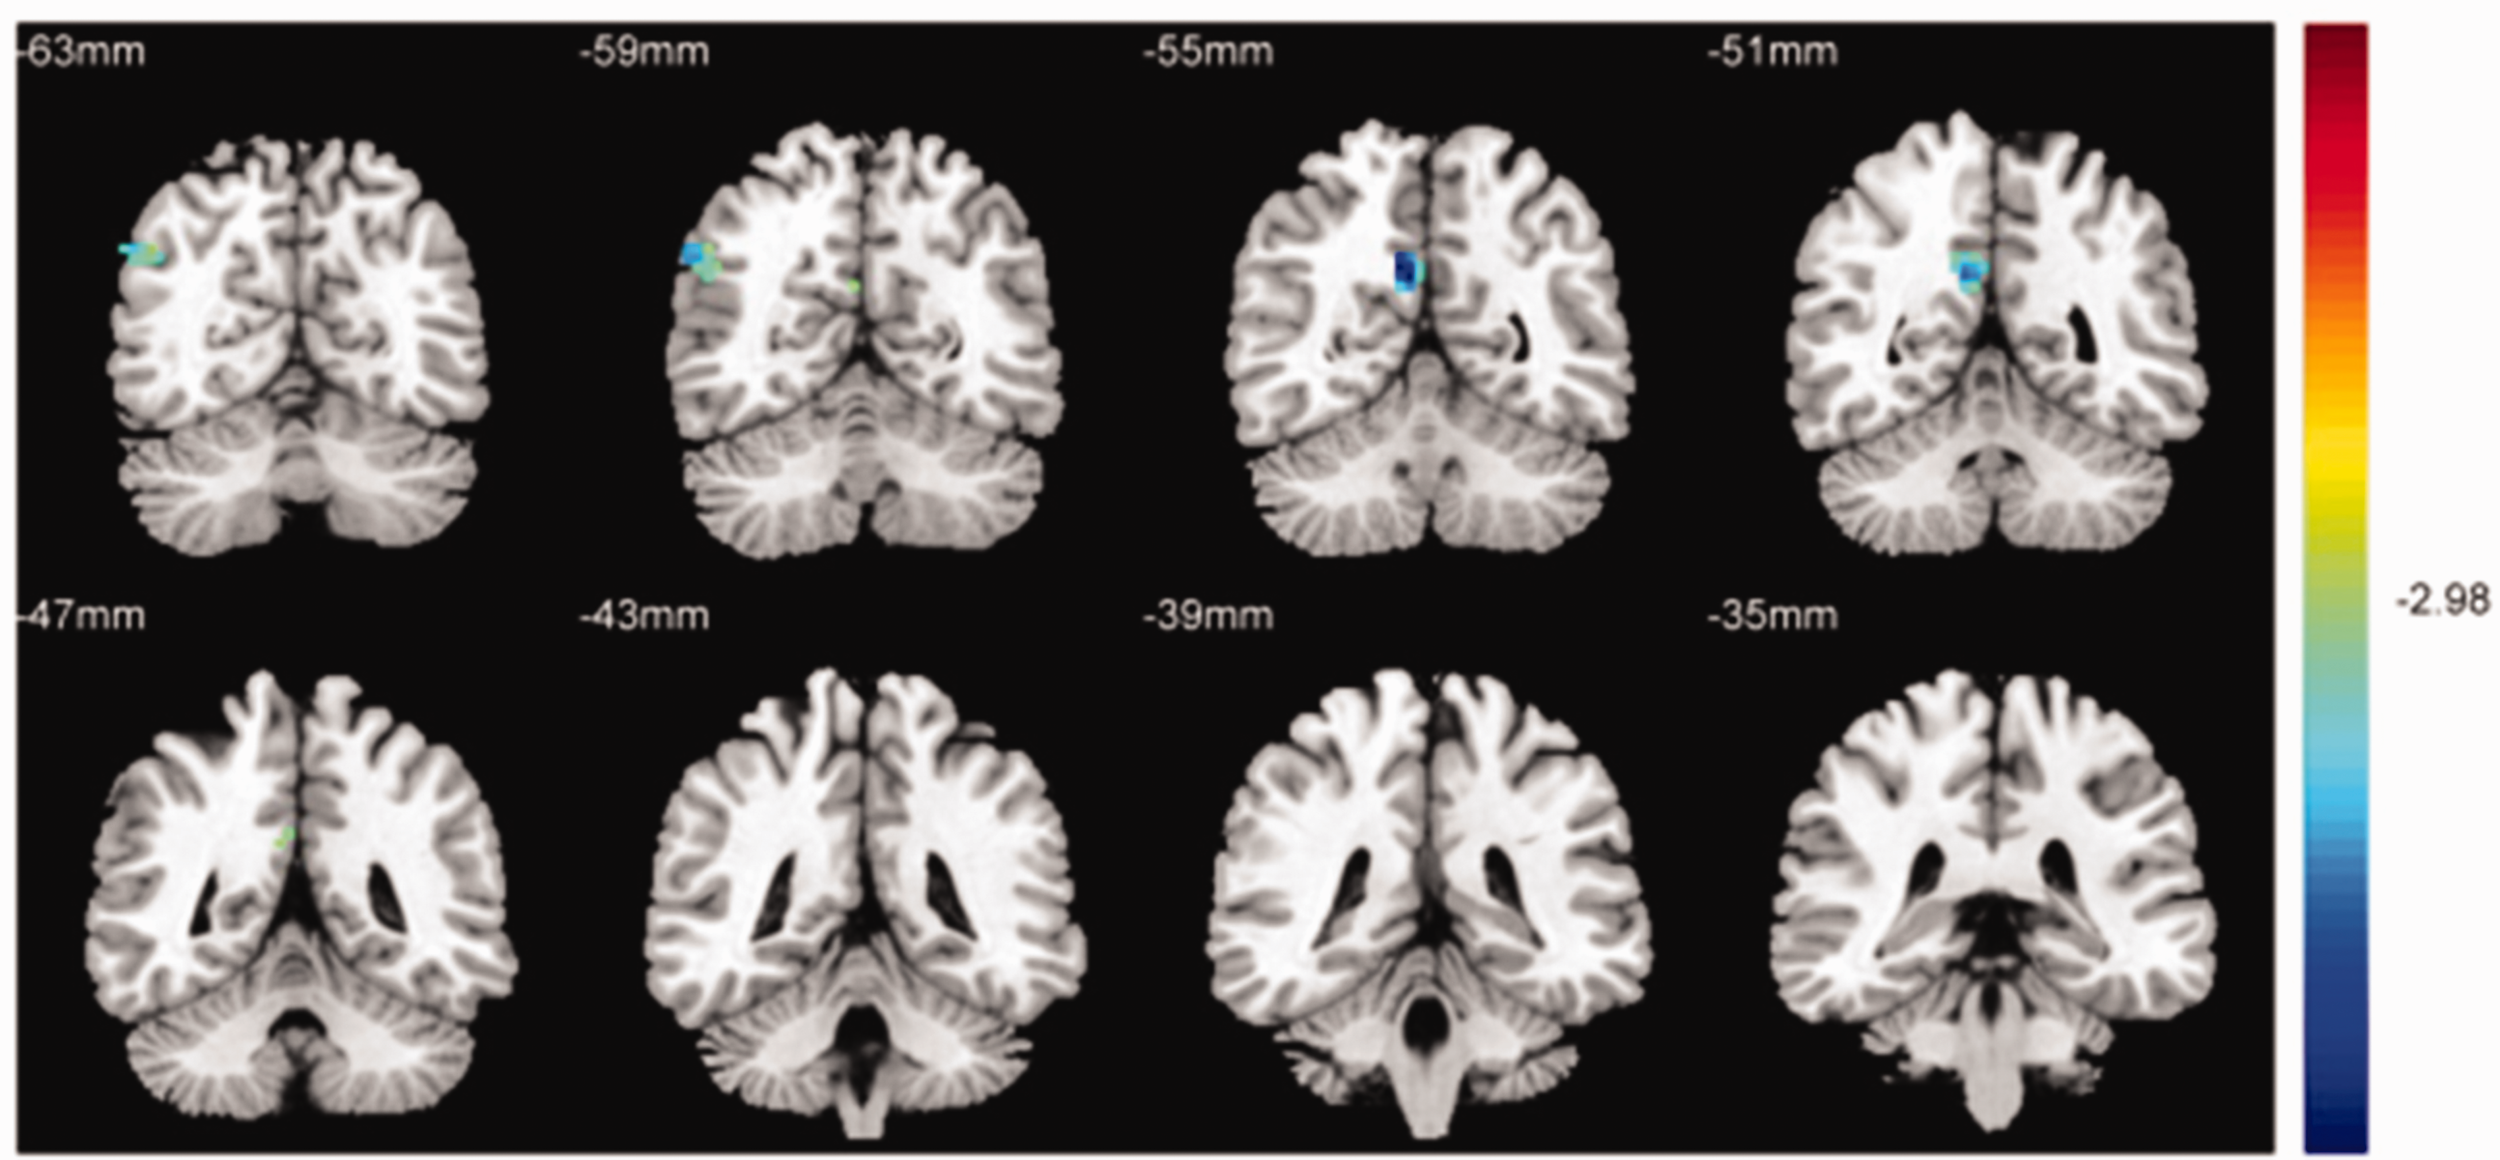
Significant differences in spontaneous brain activity between the NTG group and HCs. Differences were observed in the right angular gyrus of the brain and the right anterior precuneus of the brain, the blue areas denote brain regions with lower FALFF (P < 0.001 for multiple comparisons using Gaussian random field theory [z > 2.3; P < 0.001; cluster >13 voxels; Alphasim corrected]). FALFF, fractional amplitude of low‑frequency fluctuation; HC, healthy control; NTG, normal-tension glaucoma.
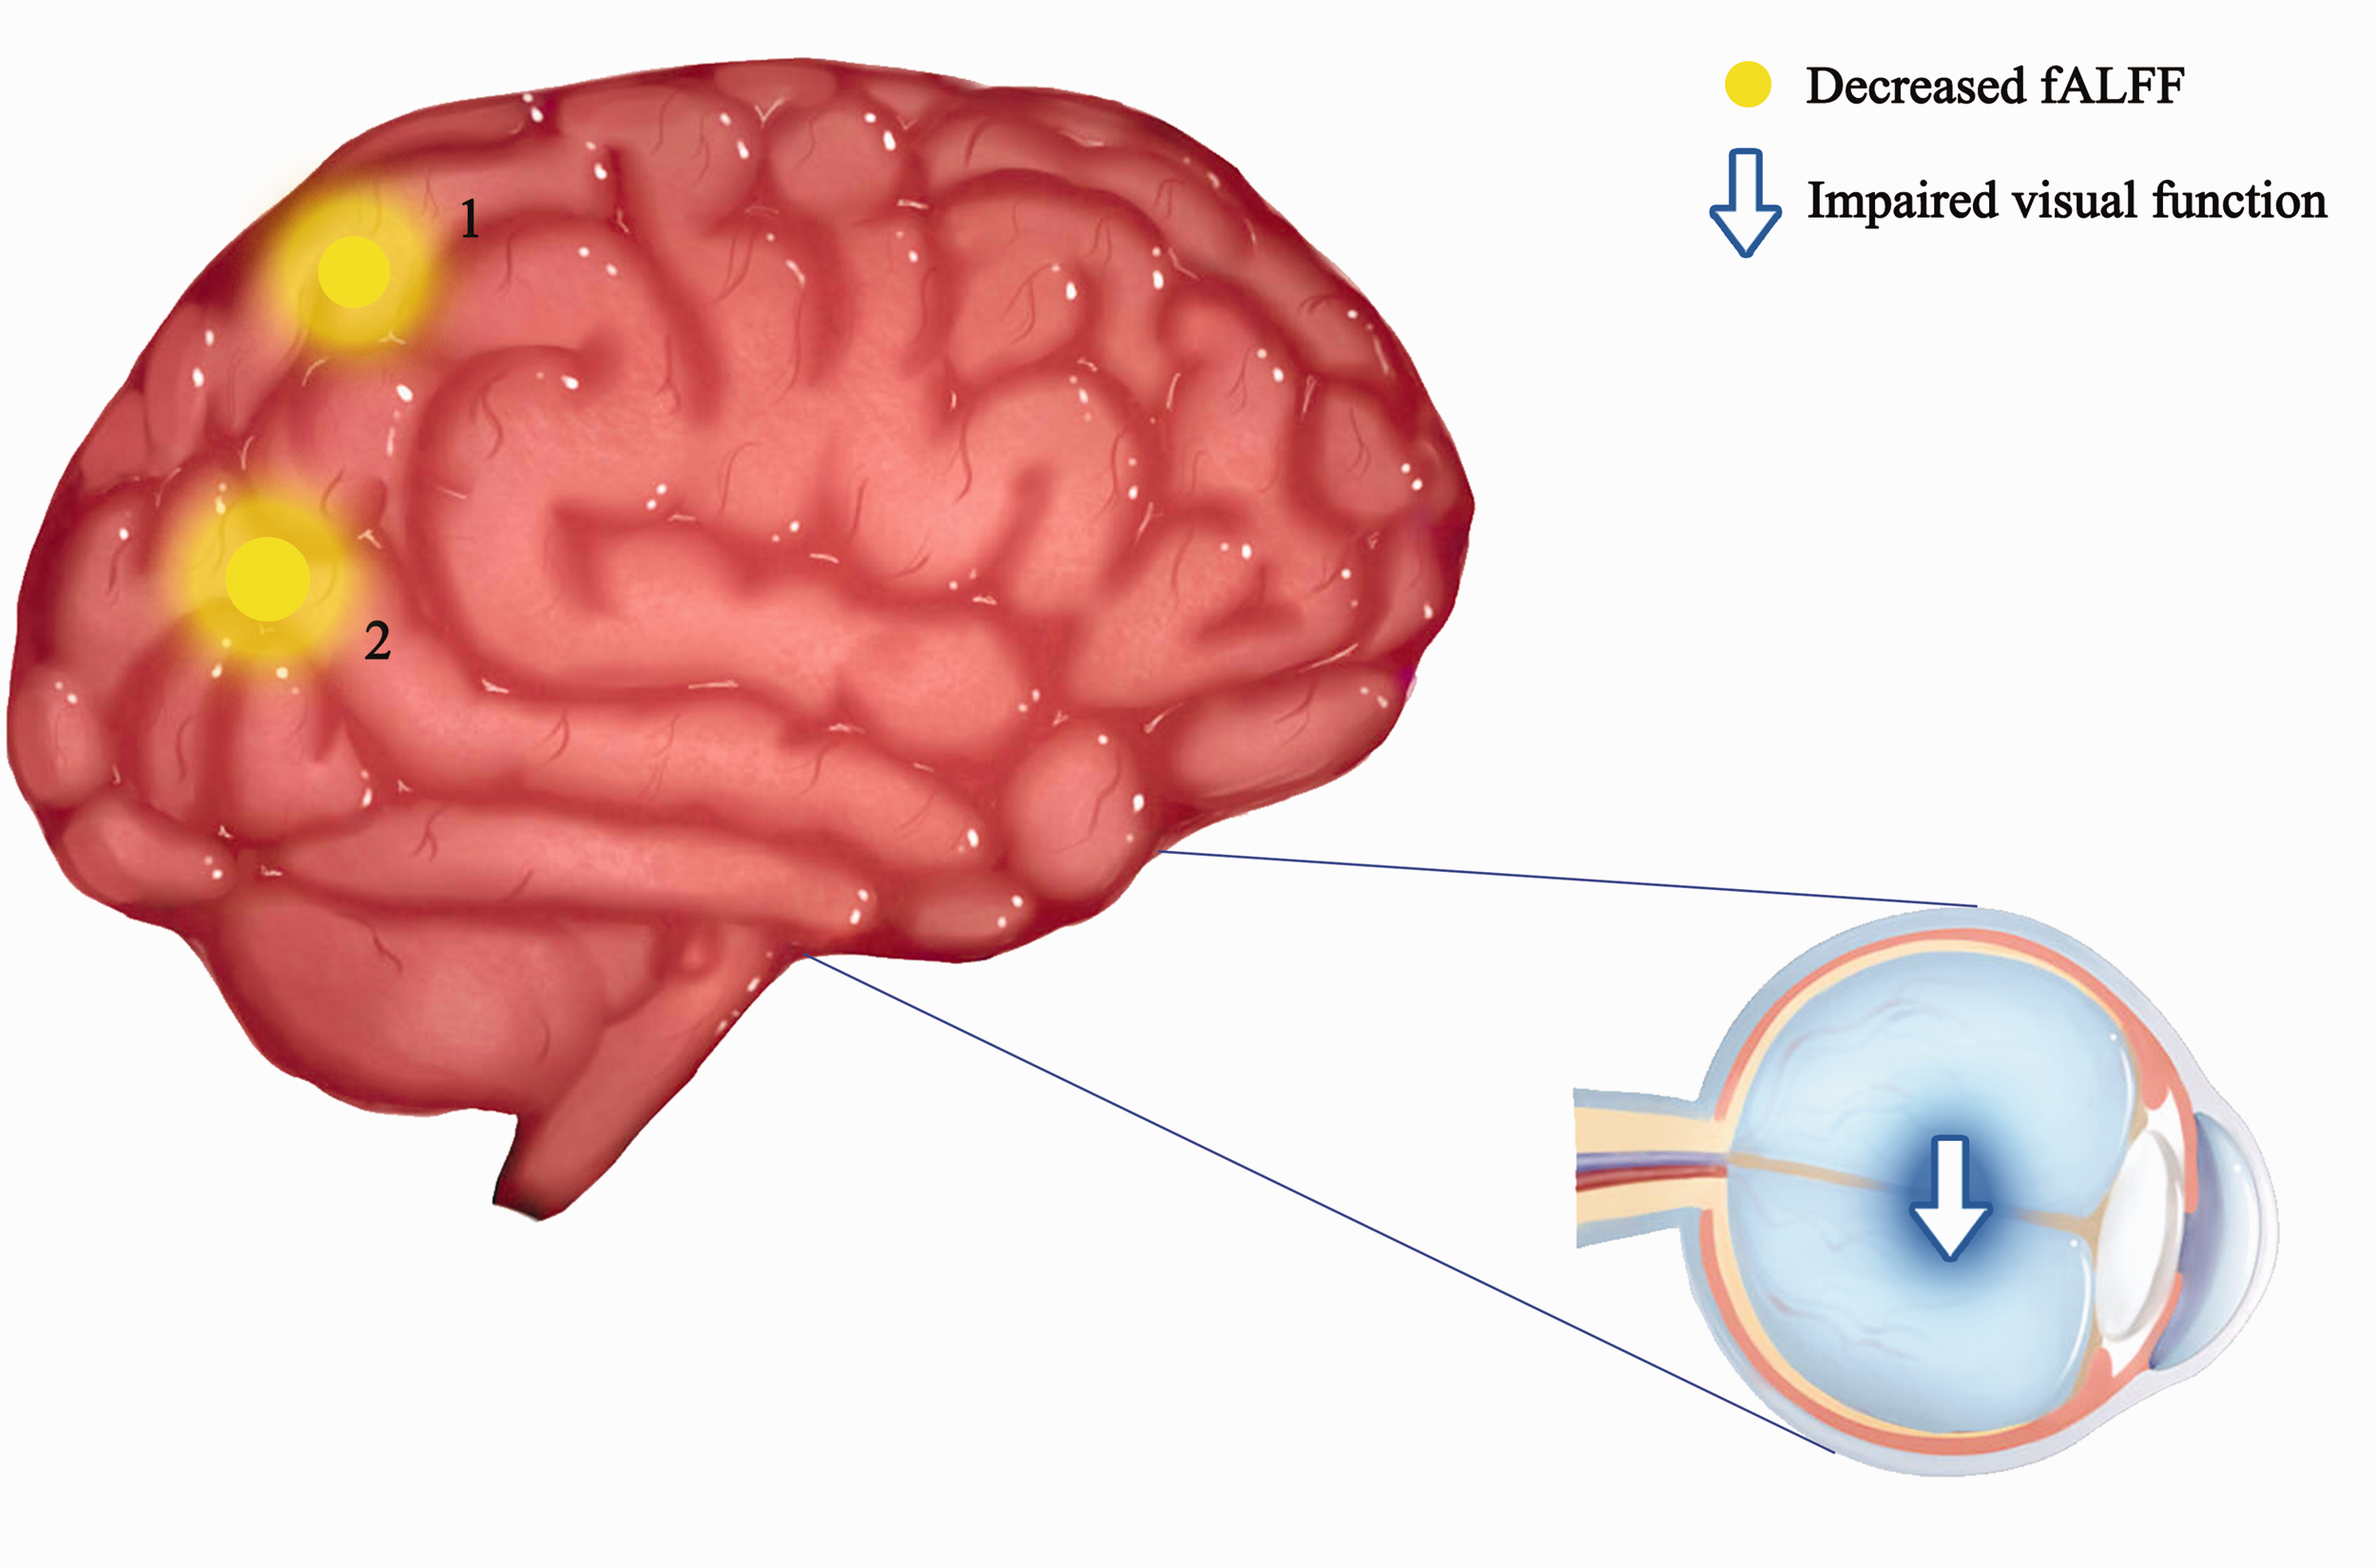
The fALFF results of brain activity in the NTG group. Compared with the HCs, the fALFF of patients with NTG in the following regions were decreased to various extents: 1 = right precuneus (t = 4.962), 2 = right angular gyrus (t = 5.354). The sizes of the spots denote the degree of quantitative changes. FALFF, fractional amplitude of low frequency fluctuation; HC, healthy control; NTG, normal-tension glaucoma.
Correlation analysis of rsfMRI-fALFF value of NTG abnormal brain area and its OCT detection results
FALFF values in the right angular gyrus and right precuneus of the NTG group showed a negative linear correlation with the average RNFL thickness (right angular gyrus: r = –0.607, P = 0.010; right precuneus: r = –0.504, P = 0.020) (Fig. 4), but there was no significant correlation with C/D values (right angular gyrus: r = 0.158, P = 0.494; right precuneus: r = −0.087, P = 0.706) (Fig. 5).
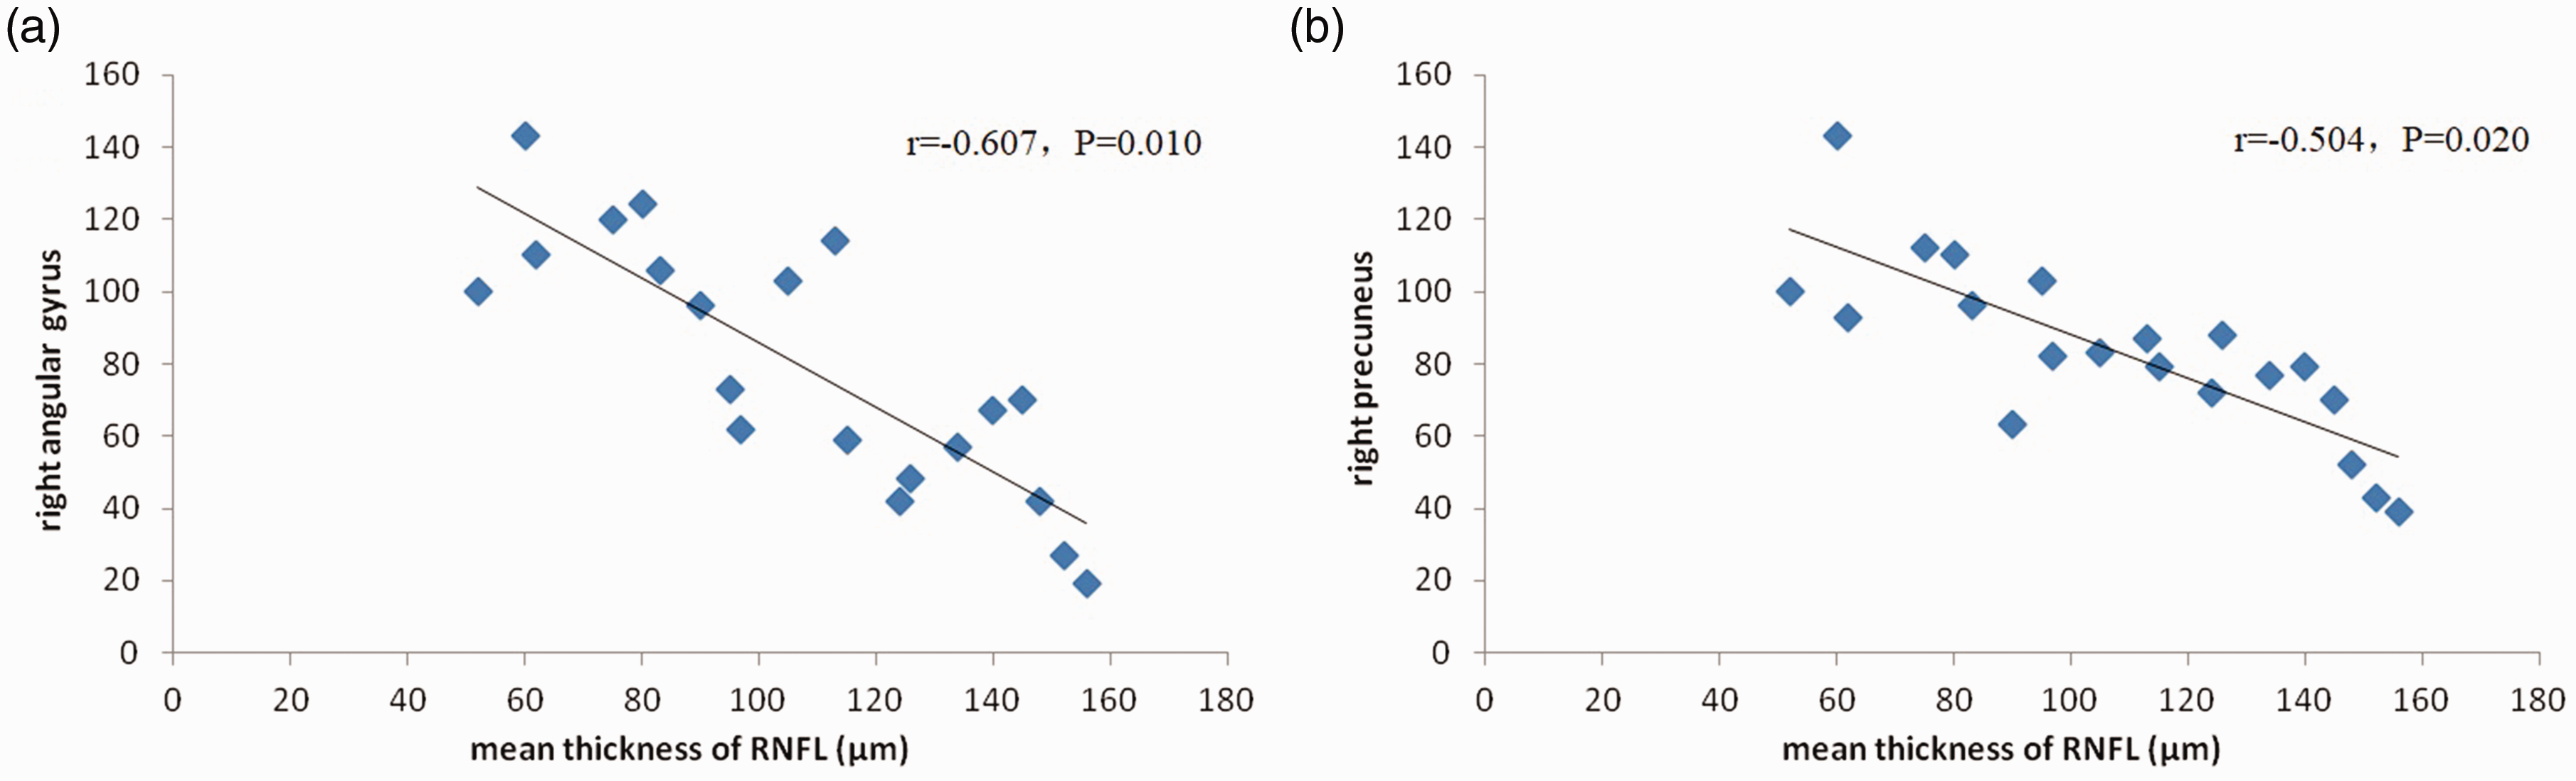
Average thickness of fALFF and RNFL in the right angular gyrus and right anterior cuneiform lobe in the NTG group. FALFF values in the right angular gyrus of the NTG group showed a negative linear correlation with the average RNFL thickness (r = –0.607, P = 0.010). FALFF values in the right precuneus of the NTG group showed a negative linear correlation with the average RNFL thickness (r = –0.504, P = 0.020). FALFF, fractional amplitude of low frequency fluctuation; NTG, normal-tension glaucoma; RNFL, retinal nerve fiber layer.
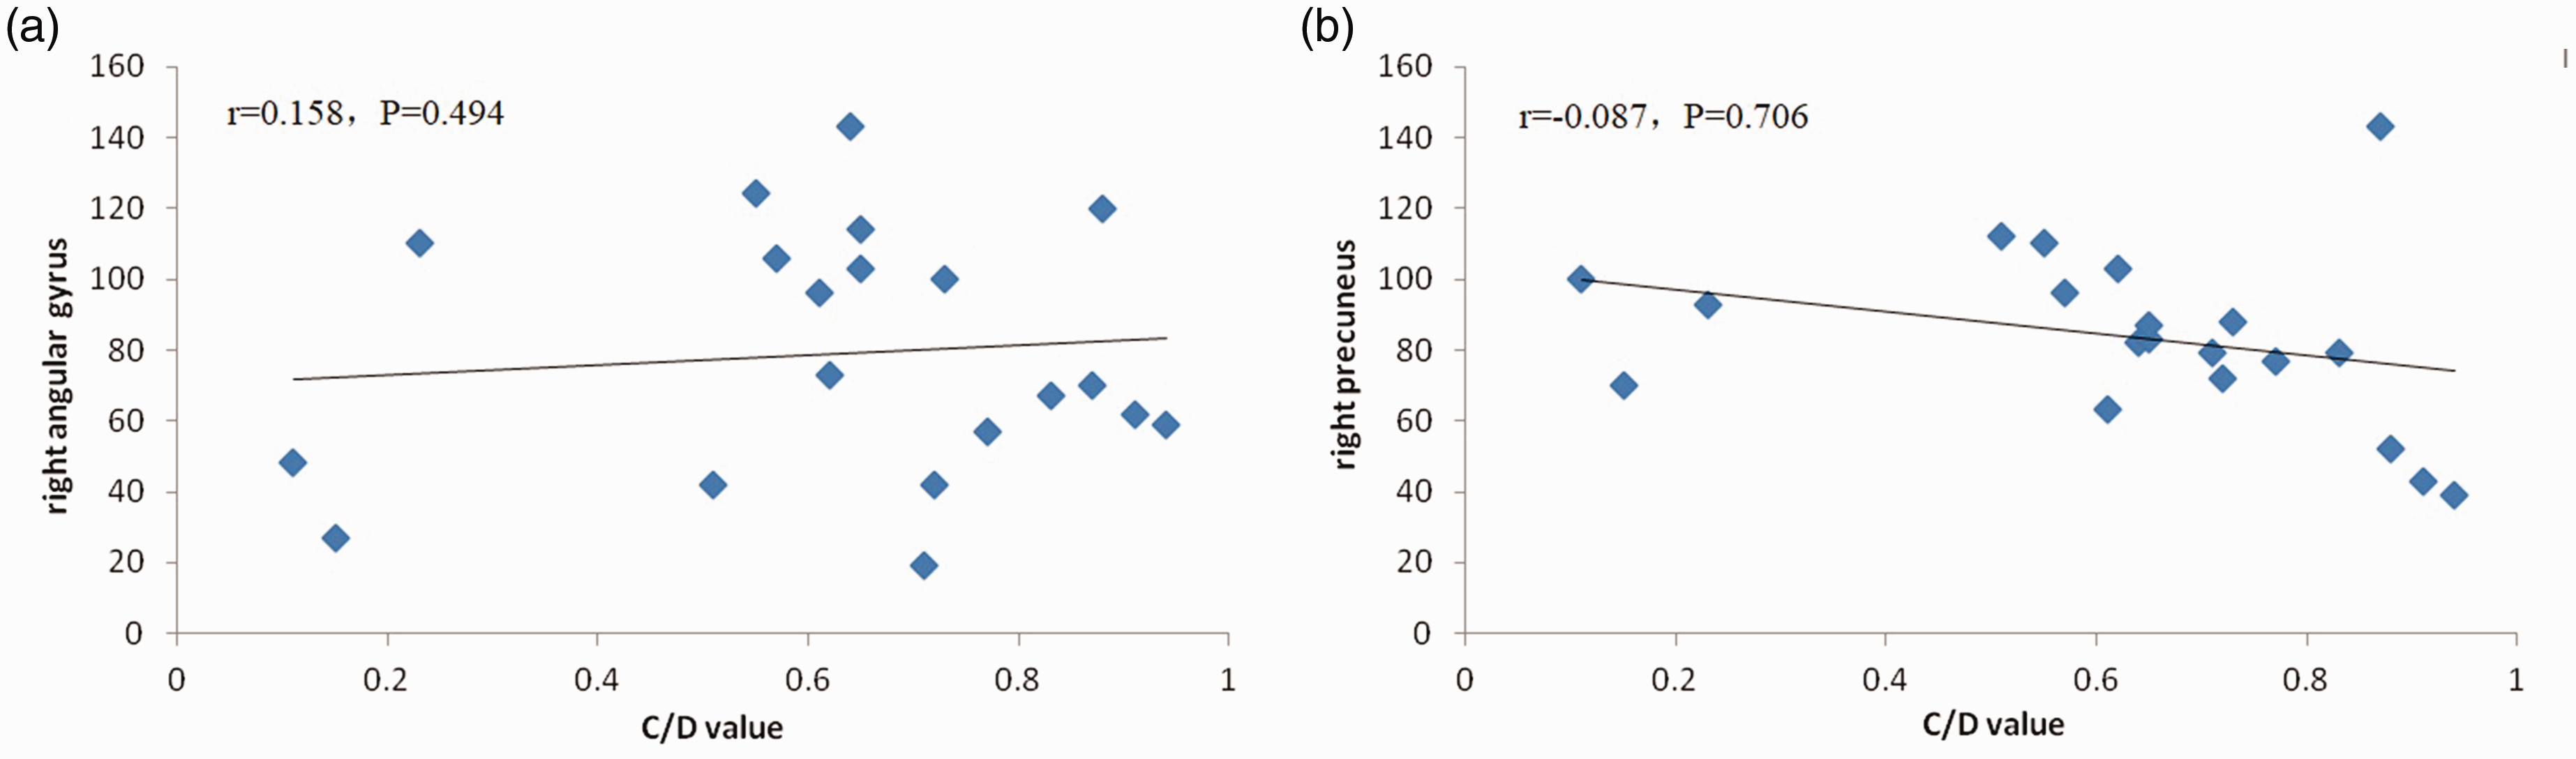
FALFF and C/D values of the right angular gyrus and right anterior cuneiform lobe in the NTG group. FALFF values in the right angular gyrus of the NTG group showed no significant correlation with C/D values (r = 0.158, P = 0.494); fALFF values in the right precuneus of the NTG group showed no significant correlation with C/D values (r = –0.087, P = 0.706) (see Fig. 4). C/D, cup-disc; fALFF, fractional amplitude of low frequency fluctuation; NTG, normal-tension glaucoma.
Correlation analysis between rsfMRI-fALFF value of NTG abnormal brain area and its visual field detection results
In the NTG group, there was no significant correlation between the fALFF value of the right cerebral angular gyrus and right anterior cuneiform lobe and the MD value of the visual field (right angular gyrus: r = 0.096, P = 0.468; right precuneus: r = 0.026, P = 0.845) (Fig. 6), nor with PSD value (right angular gyrus: r = 0.064, P = 0.626; right precuneus: r = –0.145, P = 0.268) (Fig. 7).
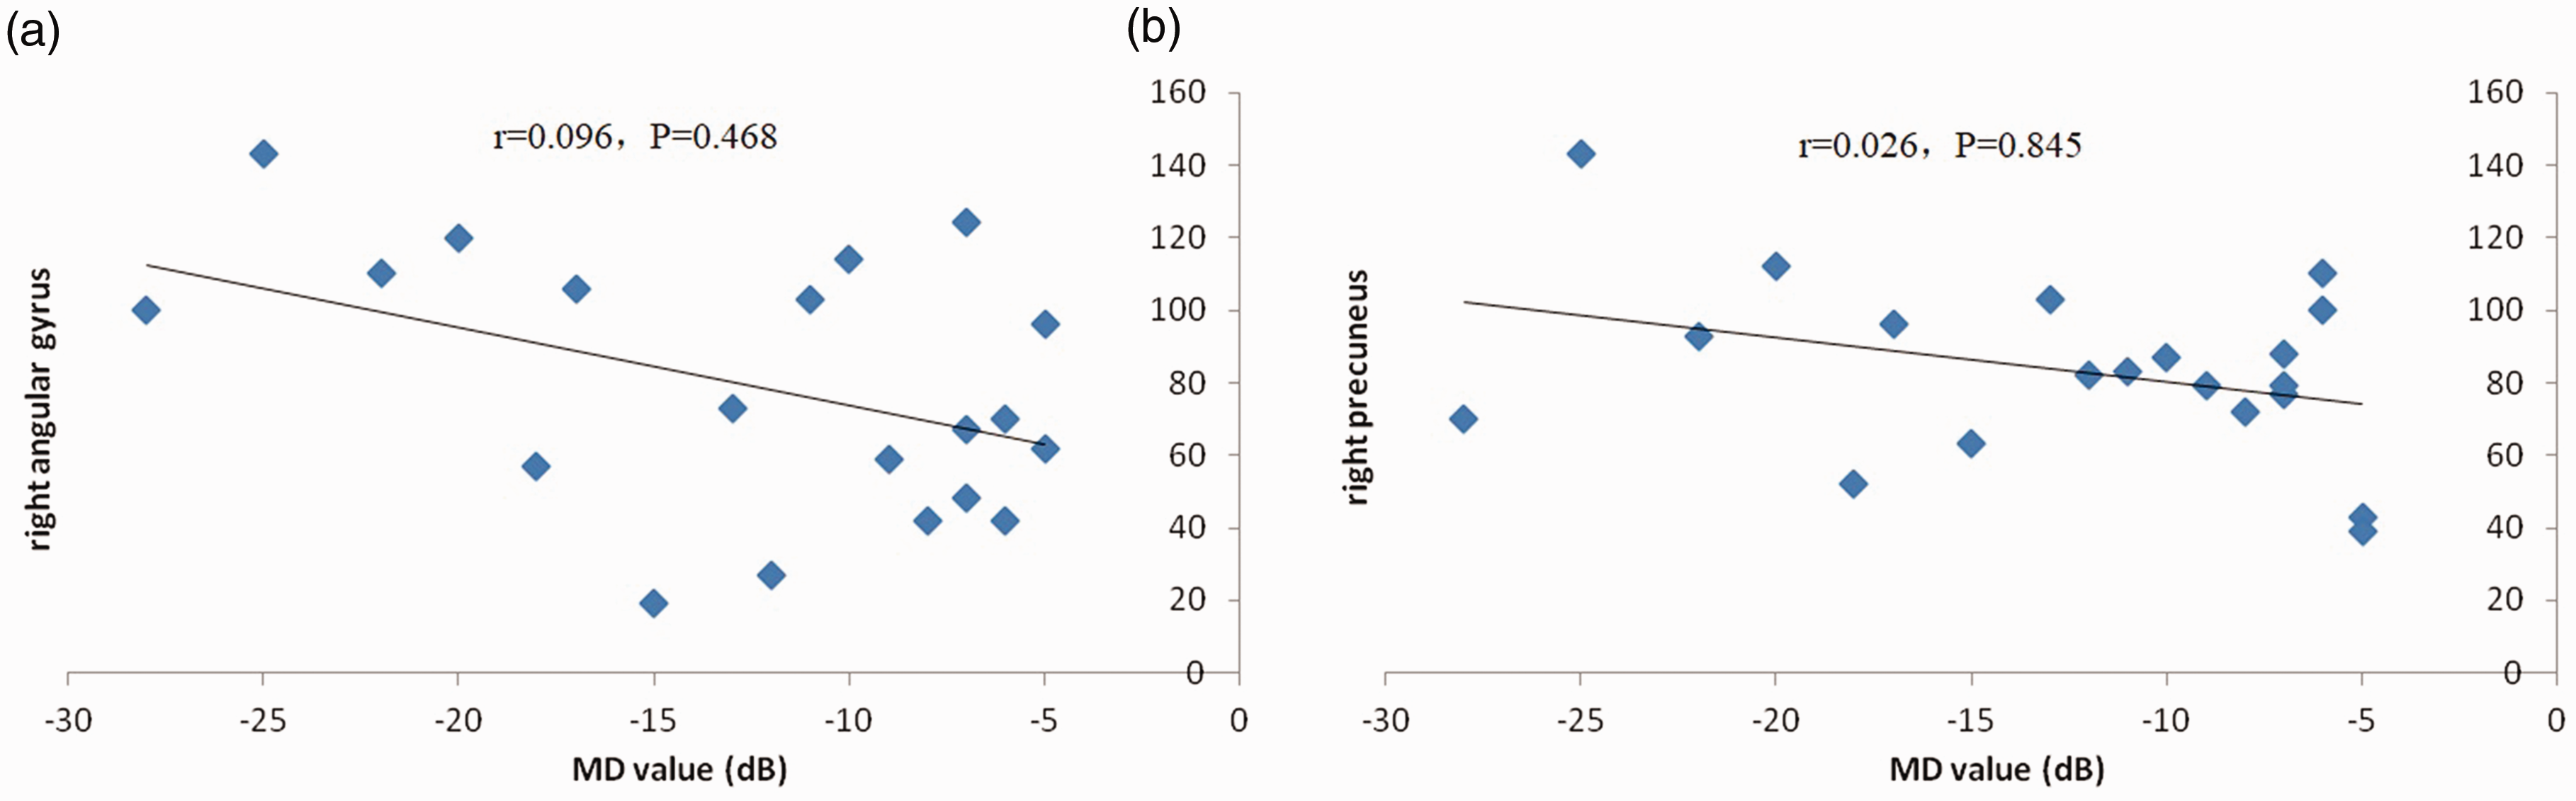
FALFF and MD values of the right angular gyrus and right anterior cuneiform lobe in the NTG group. (a) There was no significant correlation between the fALFF value of the right cerebral angular gyrus and the MD value of the visual field (r = 0.096, P = 0.468). (b) There was no significant correlation between the fALFF value of the right anterior cuneiform lobe and the MD value of the visual field (r = 0.026, P = 0.845). FALFF, fractional amplitude of low frequency fluctuation; MD, mean deviation; NTG, normal-tension glaucoma.
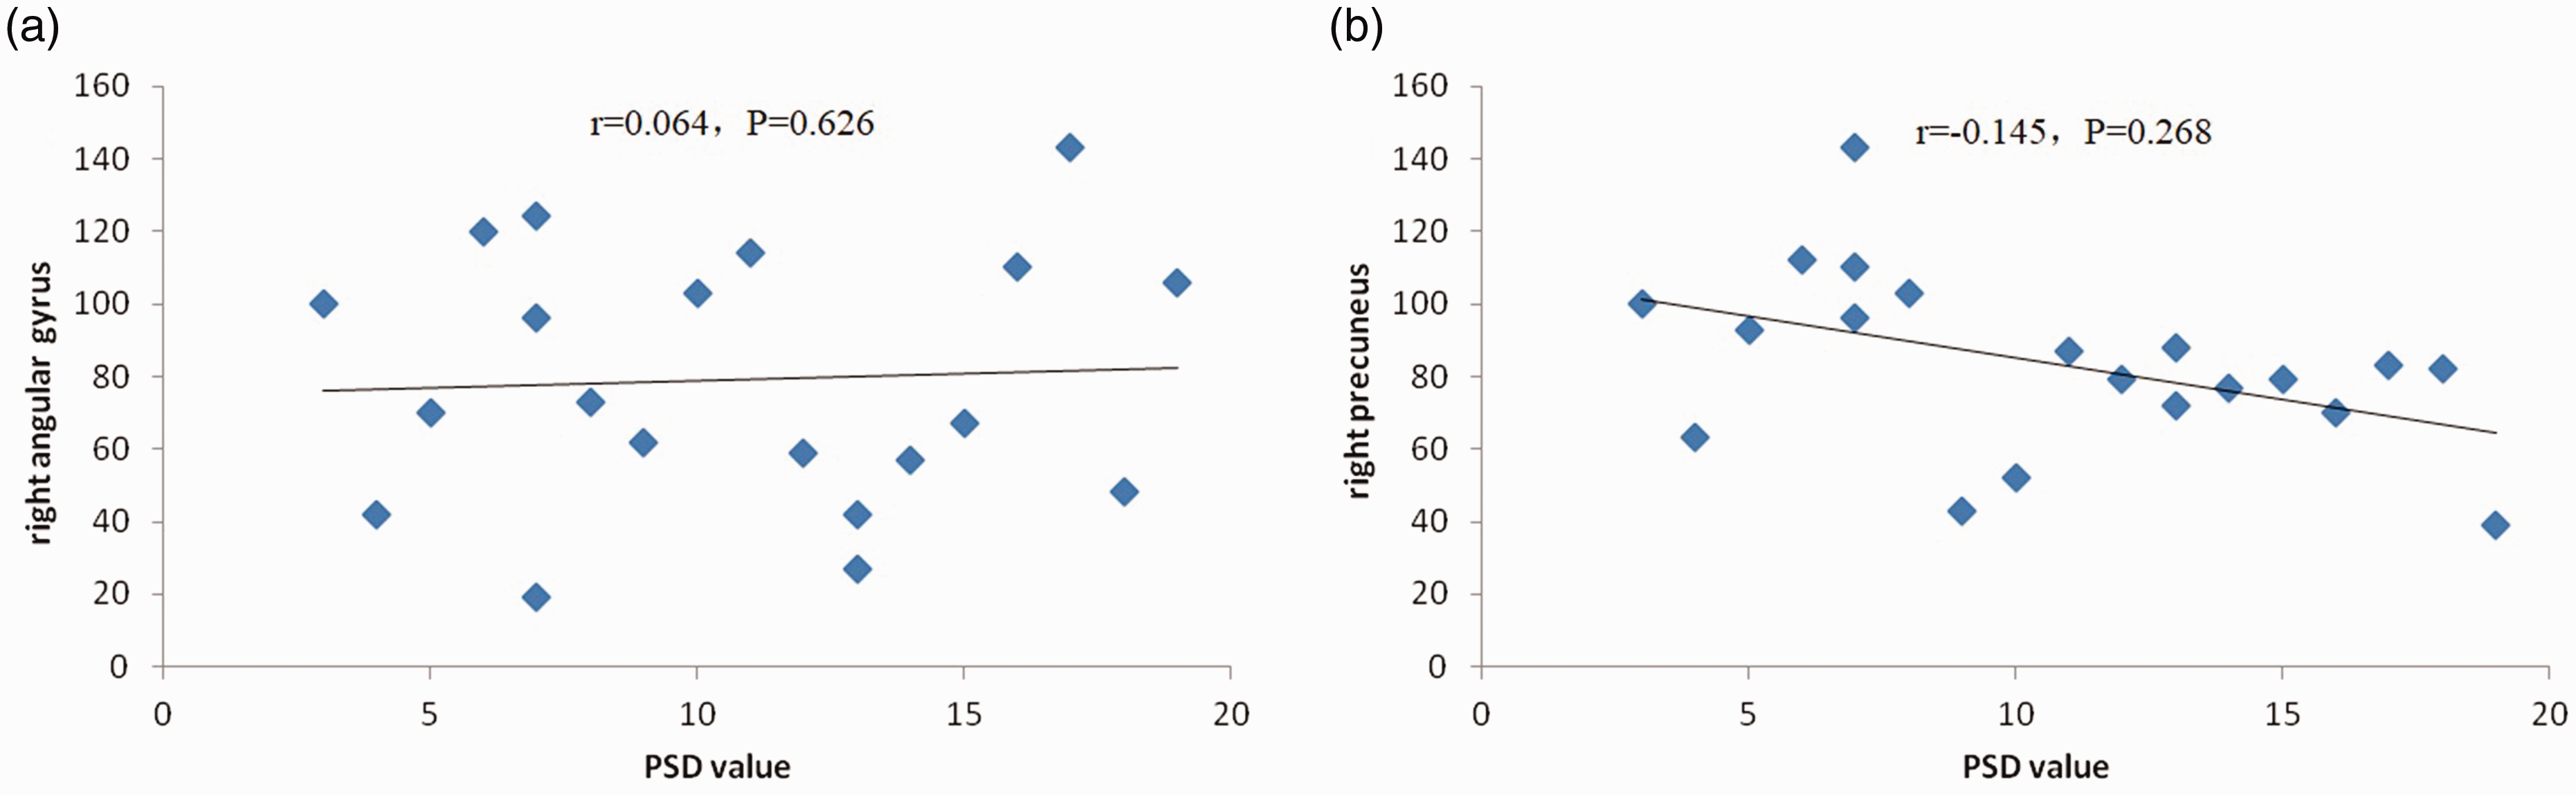
The values of fALFF and PSD in the right angular gyrus and right anterior cuneiform lobe of the NTG group. (a) There was no significant correlation between the fALFF value of the right cerebral angular gyrus and PSD value (r = 0.064, P = 0.626). (b) There was no significant correlation between the fALFF value of the right anterior cuneiform lobe and PSD value (r = –0.145, P = 0.268). FALFF, fractional amplitude of low frequency fluctuation; NTG, normal-tension glaucoma; PSD, pattern standard deviation.
Discussion
NTG is a special type of glaucoma characterized by chronic and progressive damage to the optic nerve. The condition of NTG is obscure and diverse. By the time of diagnosis, the disease has caused serious damage to visual function. At present, the cause and pathogenesis of NTG are unclear. NTG is more dangerous than other types of glaucoma, resulting in a heavy burden to patients and society. The prevalence of NTG in China is increasing in clinical proportions. At present, there is no clear and established standard for the early diagnosis of NTG; all potential standards are currently in the exploratory research stage. However, early diagnosis is important for improving the prognosis of NTG. Therefore, the study of methods for the early detection and diagnosis of NTG is particularly important. Previous studies have been limited to the eyes of patients with NTG as research objects versus healthy individuals for correlation analysis. However, the potential brain areas related to NTG have rarely been studied (6,7). In recent years, animal experiments (8–10) and human in vivo studies (11–14) have confirmed changes in the visual pathways of glaucoma animal models and patients with glaucoma. The studies conducted by Gupta et al. (15,16) further showed that the structure of the visual pathway changed, and changes in the function of the large cerebral cortex of patients with glaucoma occur earlier than those in the visual field and morphology. In recent years, the rapid development of in vivo imaging technology, as a non-invasive and accurate method of brain function localization imaging, provides us with an effective means to explore the central changes of glaucoma. rsfMRI-fALFF is a new method of resting data-driven analysis based on the application of ALFF, which can improve the sensitivity and specificity of spontaneous brain activity detection. It can better reflect the default network of the brain resting state and reduce the impact of physiological noise, such as the ventricular system and the large blood vessel lacuna. It is characterized by reliable and repeatable measurements, and its physiological phenomenon is less questioned. Therefore, it can be used to observe the changes in the visual cortex of patients with NTG. It is a reliable, non-invasive approach to studying the central mechanism of NTG and monitoring the progress of human NTG lesions. This method is expected to provide a clinical examination basis for the early detection and diagnosis of NTG, avoid irreversible damage to the visual function through early treatment, and provide new ideas and a broader vision for the further in-depth study of NTG.
Does the rsfMRI-fALFF technique show any specific abnormality in the potentially related brain areas of patients with NTG? This was the focus of the present study. Our results showed that, in the NTG group, the fALFF value in the right angular gyrus and right anterior cuneiform lobe was significantly decreased; however, there was no brain area detected with an increased fALFF value. These findings suggest that the dysfunction of the angular gyrus and anterior cuneiform lobe may play a role in the pathogenesis of NTG. However, it is unclear whether the results of the present study indicate the cause of NTG or whether NTG exerts some effect on the brain after its occurrence. The nature and intensity of the effect warrant further investigation. The angular gyrus belongs to the parietal lobe, which is an important brain area connecting the somatosensory, visual, and auditory systems. Its main function is the processing and understanding function of language. In addition, it is associated with the functions of memory, attention, and spatial cognition (17). Damage of the angular gyrus is related to numerous diseases. In patients with mental disorders, bilateral angular gyrus are asymmetric, and the abnormal language function observed in mental disorders is related to the pathological changes of those angular gyrus (18). The anterior cuneiform lobe is located in the upper parietal lobe and adjacent to the visual cortex. Together with the lower parietal lobe, it participates in the integration of various information, such as consciousness in visual space construction, image, plot memory retrieval, introspection, and self-cognition (19). Therefore, decreased brain functional activity in the anterior cuneiform lobe and lower parietal lobe may indicate decreased integration of information in the brain of patients with NTG. Chen et al. (20) and Li et al. (21) found changes in the anterior cuneiform lobe and the gray matter of the angular gyrus in patients with glaucoma. Although their results were not consistent, they provided a basis for structural changes in the functional abnormalities of the angular gyrus and the anterior cuneiform lobe. Wang et al. (22) and Lin et al. (23) studied anisometropic amblyopia and found that the angular gyrus and anterior cuneiform lobe also exhibited local consistency or decreased functional connection. Using the rsfMRI technique, it was found that the angular gyrus and the anterior cuneiform lobe belong to the same default network. Moreover, white matter fiber bundles and functional connections were identified, which are similar in terms of function, such as visual information processing. The findings are consistent with the results of the present study, indicating that these may be the key brain areas involved in the structural and functional changes of the visual cortex in NTG. This evidence provides a basis for revealing the pathogenesis and neurobiological mechanism involved in this process and offers a new perspective for the early diagnosis of NTG.
We analyzed the relationship between fALFF and RNFL, C/D ratio, MD, and PSD to investigate the value of rsfMRI-fALFF in the diagnosis of NTG. The pathological basis of NTG-induced visual function damage is mainly a RNFL defect and optic disc damage (24–26). OCT can accurately determine the RNFL thickness and optic disc parameters around the optic disc, with high resolution. These parameters can be repeatedly measured and quantitatively analyzed, providing a normal reference value and optic disc analysis procedure of RNFL. Consequently, this provides strong support for the diagnosis and follow-up of NTG (27,28). The present study found that fALFF values in the right angular gyrus and right precuneus were negatively correlated with RNFL values. However, they were not significantly correlated with the C/D ratio, MD, and PSD values. At present, the RNFL value is a sensitive and objective index commonly used in the clinical evaluation of NTG. In the early stage of NTG, the RNFL value may be significantly lower than that observed in healthy volunteers. Change in the RNFL value is highly sensitive in the evaluation of the severity of NTG, indicating that this value plays an important role in the monitoring of NTG progression. Therefore, rsfMRI-fALFF can provide additional information regarding the function of the deep visual cortex in patients with NTG, which has a certain clinical reference value. Furthermore, it can be used as a supplementary examination method for the clinical diagnosis of NTG and a reference index for the evaluation of disease severity.
In the present study, there are several reasons responsible for the lack of a relationship between the fALFF values and those of the C/D ratio, MD, and PSD. First, there are individual differences in the cortical response caused by different retinas following image stimulation. This can easily cause errors when performing an analysis with the C/D ratio, MD, and PSD. Second, the repeatability of fALFF relative to the C/D ratio, MD, and PSD is poor, which may affect the experimental results. Third, there are degenerative changes in visual pathways in patients with NTG, which may lead to complex functional integration of visual cortex remodeling or a compensation mechanism. Lastly, visual field examination is a subjective psychophysical examination method, which has many influencing factors and is prone to errors; small-scale early optic neuropathy may not reflect the corresponding abnormalities of the visual field. Visual field deficiency occurs only following the death of more retinal ganglion cells.
The present study has some limitations: the small sample size and the presence of numerous influencing factors in the process of examination. Therefore, we need to increase the sample size in future research studies, strengthen the specification, remove the adverse factors, further verify the accuracy of the results, and provide a theoretical basis for the clinical diagnosis and treatment of NTG. With the further improvement of image scanning technology, it is expected that rsfMRI-fALFF technology will be more widely used in ophthalmic clinical practice.
In conclusion, the changes in rsfMRI-fALFF imaging parameters reflect alterations in multiple brain regions of patients with NTG, suggesting that NTG is a complex nervous system disease. The correlation between the values of fALFF and RNFL indicates that rsfMRI-fALFF technology will provide imaging support for the diagnosis and follow-up of NTG.
Footnotes
Declaration of conflicting interests
The author(s) declared no potential conflicts of interest with respect to the research, authorship, and/or publication of this article.
Funding
The author(s) received the following financial support for the research, authorship, and/or publication of this article: The National Natural Science Foundation of China (No. 81660163); Jiangxi Provincial Key Research and Development Program (No. 20171BBG70097); Jiangxi Science and Technology Support Program (No. 20161BBG70164); Jiangxi Provincial Department of Education Science and Technology Project (No. GJJ150242); and Jiangxi Provincial Health Planning Commission Science and Technology Project (No. 20155131 and 20181032).