
Abstract
Background
Sinusoidal obstruction syndrome (SOS) due to chemotherapy can cause severe hepatotoxicity, leading to impaired outcome in patients with colorectal cancer. A previous study introduced gadoxetic acid-enhanced magnetic resonance imaging (Gd-EOB-MRI) to diagnose SOS.
Purpose
To assess the reproducibility of Gd-EOB-MRI-based SOS diagnosis and its relationship with response to chemotherapy and long-term outcome.
Material and Methods
Twenty-six Gd-EOB-MRI scans of patients undergoing chemotherapy for colorectal liver metastases (CRLM) were retrospectively analyzed. Three radiologists, blinded to clinical data, independently scored presence and severity of SOS on a 5-point scale (0, definitely not present to 4, definitely present). Patients with a score ≥3 were considered SOS+. Inter-observer agreement between readers was assessed with kappa statistics. Response (RECIST 1.1.), occurrence of new CRLM during follow-up (hepatic progression) and overall survival (OS) were compared between patients with and without SOS.
Results
The inter-observer agreement of SOS scores was poor, with quadratic kappas of 0.17–0.40. For the binary outcome of SOS+ (confidence level [CL] 3–4) vs. SOS– (CL 0–2) agreement was poor, with kappas of 0.03–0.37. Median follow-up was 24 months (range 4–44 months). Response and OS between patients with and without SOS did not differ significantly for any of the readers.
Conclusion
Inter-observer agreement for the diagnosis of SOS on Gd-EOB-MRI is poor. No significant correlation with relevant outcomes was found for any of the readers. Therefore, MRI for SOS diagnosis might be less useful than previously reported. Other techniques should be explored to accurately diagnose SOS in absence of histological confirmation.
Keywords
Introduction
Colorectal cancer (CRC) is the third most diagnosed cancer in the Western world (1), with 15%–25% of patients presenting with distant metastases at the time of diagnosis (2,3). Of the patients with liver metastases, only 10%–15% are eligible for primary hepatic resection (4–6). In the remaining patients with initially unresectable colorectal liver metastases (CRLM), neoadjuvant chemotherapy (nCTx) is generally administered to make the resection possible, which improves progression-free survival (7,8). An adverse effect of (n)CTx is hepatotoxicity, including sinusoidal obstruction syndrome (SOS). SOS is a condition that affects the healthy liver parenchyma by sinusoidal endothelial injury. Chemotherapy initiates disruption of the wall integrity of the sinusoidal endothelial cells, leading to obstruction, which in turn results in increased pressure within the sinusoidal cells that causes dilation of the sinusoids. Microscopically, SOS is characterized by an irregular liver texture with affected areas of lobules mixed with intact parenchyma, causing its heterogeneous appearance on imaging (9). In 2004, the first study about chemotherapy-related SOS was published; since then, an increasing number of studies has shown that predominantly oxaliplatin-based chemotherapy gives a high risk of SOS and subsequent significant toxicity to the liver parenchyma (9–15).
Even though most patients with SOS have no clinical symptoms (12,16), diagnosing SOS is of clinical relevance, because SOS has been correlated with increased morbidity and complications related to (major) hepatic resection (7,10,13,17–23). Another important clinical consequence of SOS is that it can diminish the response to further chemotherapy (24,25). The gold standard test for the diagnosis of SOS is histopathology, which is only available after surgery or liver biopsy, the latter having a risk for sampling error (12,15). Elevated liver enzymes and low platelet count have been associated with SOS and contribute to the diagnosis (10,13,26–28), but a reliable preoperative non-invasive tool is missing. Several diagnostic imaging methods have been proposed but have only shown moderate sensitivity and specificity when detecting SOS (13,27-29). Gadoxetic-acid (Gd-EOB) is a liver-specific paramagnetic gadolinium-based contrast agent for magnetic resonance imaging (MRI) and is used in clinical practice for the detection and differentiation of hepatic lesions. It specifically allows assessment of the liver parenchyma during a delayed phase (after 20 min, hepatobiliary [HPB] phase) due to the accumulation of contrast in the hepatocytes (30). As SOS causes changes in the hepatic blood flow and damages the sinusoidal cells, HPB phase imaging with Gd-EOB-MRI has been reported to be able to detect SOS (30). The changed blood flow is hypothesized to lead to a disturbed uptake of contrast in the hepatocytes, which results in a heterogeneous enhancement on Gd-EOB-MRI. Shin et al. (31) proposed a promising method to evaluate the reticular enhancement pattern of the liver parenchyma on HPB phase Gd-EOB-MRI, to diagnose oxaliplatin-induced SOS in patients with CRLM. They showed that patients that received nCTx for CRLM had a diffuse low reticular signal intensity on Gd-EOB-MRI, with a good inter-observer reliability (κ = 0.77). So far, this single-center report on a Gd-EOB-MRI-based scoring system has not yet been validated by other groups. In addition, the clinical significance of the MRI diagnosis of SOS has not yet been investigated in terms of treatment or survival outcomes. Therefore, the aim of the present study was to assess the reproducibility of Gd-EOB-MRI, assess SOS by readers with different levels of expertise, and assess its relationship with response to chemotherapy and long-term outcome.
Material and Methods
Patients
This retrospective study was approved by the local Institutional Review Board of the Netherlands Cancer Institute‐Antoni van Leeuwenhoek hospital (IRB AVL) and informed consent was waived (18.313/IRBd18066). The records of 71 consecutive patients with CRLM who received Gd-EOB-MRI scans at our institution between October 2015 and September 2016 were retrospectively reviewed. Patients were included if they met the following inclusion criteria: (i) presence of CRLM; (ii) treatment with (n)CTx for CRLM; and (iii) an available Gd-EOB-MRI scan (within six months after completion of CTx). Patients were excluded if they underwent previous liver surgery, had chronic liver disease (such as cirrhosis), or if they received radiation therapy (i.e. stereotactic body radiation or external beam) to the liver, as this can affect the liver texture. Only one MRI scan per patient was included for analysis in case of multiple Gd-EOB-MRI scans per patient. In that case, the MRI closest in time to CTx was selected for analysis. A total of 103 Gd-EOB-MRI scans were assessed for eligibility in 66 patients. Forty patients were excluded for the following reasons: time between chemotherapy completion and MRI was more than six months (n = 24); the scan was acquired before the start of chemotherapy (n = 8); presence of chronic liver disease (n = 3); the scan was performed after surgical intervention (n = 3); the scan was performed after radiation therapy to the liver (n = 1); or the patient did not receive CTx (n = 1). This resulted in a final inclusion of 26 scans (of 26 patients) in the present study. The flow chart is presented in Fig. 1. Patients underwent regular follow-up with imaging according to our local guidelines, based on national guidelines. For patients undergoing palliative treatment (CTx only), the follow-up consisted of a contrast-enhanced computed tomography (CE-CT) scan every three months during treatment. For treatment with curative intent (i.e. nCTx followed by resection) it consisted of a CE-CT scan every three months in the first year, then every six months, and then annually until five years after surgery. Finally, for all patients, the first date of hepatic progression, date of death, and date of last follow-up were recorded.
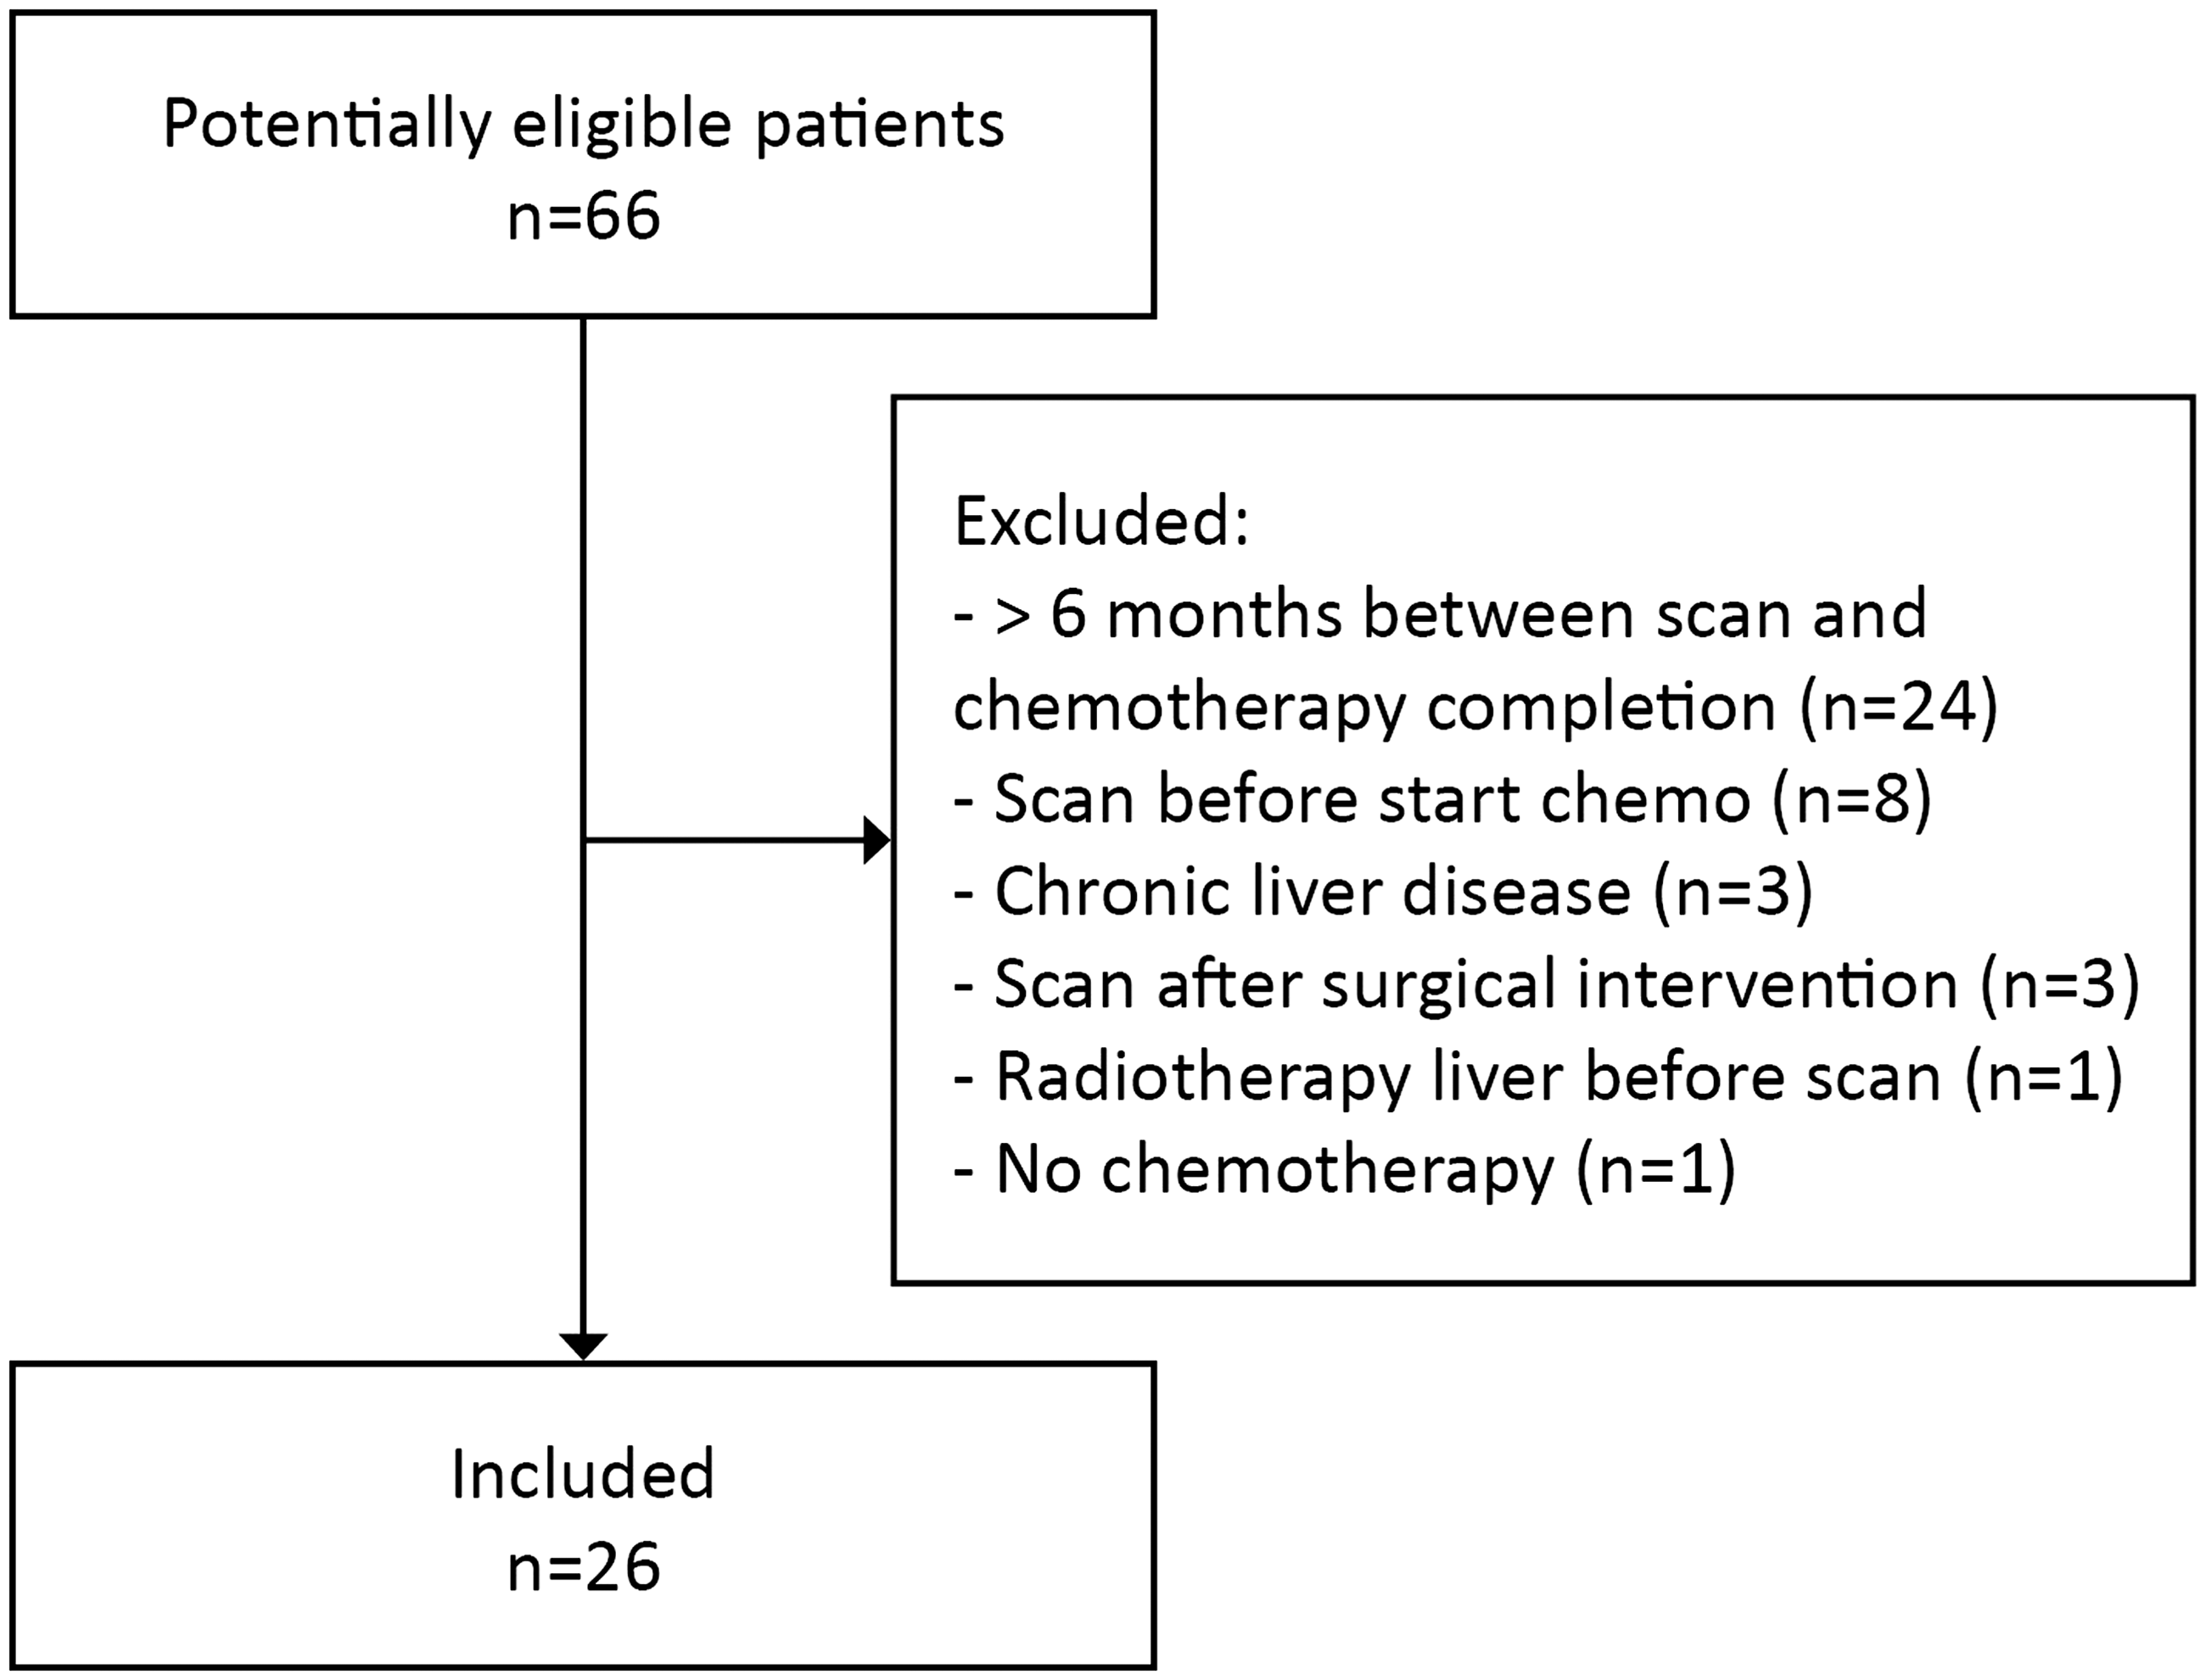
Flow chart of patient selection.
MRI
All MRI scans were acquired using a 3.0-T MRI system (Achieva or Ingenia Philips Healthcare, Best, The Netherlands), using a body array coil. Routine liver MR images (T2-weighted [T2W], unenhanced T1-weighted [T1W], diffusion-weighted imaging [DWI]) were acquired before administration of disodium gadoxetate (Primovist®, Bayer HealthCare, Berlin, Germany). For the contrast-enhanced images, standard four-phase images were acquired after the intravenous injection of 10 mL Primovist (a rapid bolus [3 mL/s]), followed by a 30 mL saline flush with an injection rate of 3 mL/s): the arterial phase at 25 s; the portal venous phase at 60 s; the intermediate phase at 3 min; and the HPB phase at 20 min. The images were acquired with a fat-suppressed three-dimensional T1W fast field echo (FFE), breath-hold in expiration (12 s) sequence with the following parameters: TR = 3.5 ms; TE1 = 1.13 ms; TE2 = 2.2 ms; flip angle = 10°; field of view = 400 (RL) × 296 (AP) × 212 (FH) mm; slice thickness = 3 mm; gap = 0 mm.
Image analysis
For the diagnosis of SOS, only the Gd-EOB-MR images in the HPB phase were independently reviewed by three radiologists with varying experience in abdominal MRI, who were blinded to clinical outcome. Readers 1 (RBT), 2 (BH), and 3 (JH) had 20, 13, and 5 years of experience in liver MRI, respectively. The criterion to diagnose SOS was the level of reticular hypointensity in the liver on the delayed hepatobiliary phase, recorded according to a 5-point confidence score as proposed by Shin et al. (31). Confidence score 0 (“definitely not present”) was used if no signs of reticular hypointensity were present in the liver (i.e. homogenous high signal intensity in the liver). Confidence score 1 (“probably not present”) was used for subtle hypointense reticulations in only a few sections. For fine reticulations in limited areas, confidence score 2 (“equivocal”) was used. More prominent reticulations in all sections were scored with a confidence score 3 (“probably present”). Finally, if the liver showed marked hypointense reticulations, confidence score 4 (“definitely present”) was used. Before reading the cases, all three observers were trained in using the abovementioned scale by reviewing the paper and the images provided in the previous study. In addition, consensus on the abovementioned features for each confidence level (CL) was discussed and consensus was reached. The diagnosis for SOS on MRI was considered positive at a CL score of 3 or 4. The response to (n)CTx was evaluated on the same MRI scan that was used to score SOS, by an independent board-certified radiologist (MM), blinded to the SOS score. The response rate was defined according to the Response Evaluation Criteria in Solid Tumors (RECIST) 1.1. and patients were dichotomized as responders (complete [CR] and partial response [PR]) versus non-responders (stable disease [SD] and progressive disease [PD]) (32). During follow-up, hepatic progression was defined as the occurrence of new lesions in the liver on imaging, and overall survival (OS) was defined as the time from start of chemotherapy to death from any cause or last follow-up (censor). In the absence of histopathological diagnosis, the following surrogate endpoints were evaluated for each individual reader based on their diagnosis of SOS (i.e. CL3–4): response rate and OS. Patients were followed until death or last follow-up scan, whichever occurred first.
Statistical analysis
Descriptive statistics were used to assess baseline characteristics. The inter-observer agreement of the 5-point confidence scores between radiologists were assessed with quadratic weighted kappa coefficients. Additionally, a binary positive (CL 3–4) or negative diagnosis (CL 0–2) for SOS on MRI was assessed with Cohen’s kappa (33). The κ values of the degree of agreement were interpreted as follows: 0.81–1.00 = excellent agreement; 0.61–0.80 = good agreement; 0.41–0.60 = moderate agreement; 0.21–0.40 = fair agreement; and < 0.21 = poor agreement.
Fisher’s exact test was used to compare the response rates between the responders and non-responders. OS was analyzed using the Kaplan–Meier method and was compared between patients with and without SOS (per reader) with the log-rank test. Analyses were performed with Statistical Package for the Social Sciences (SPSS, version 25.0, IBM Inc., Chicago, IL, USA) and a P value ≤ 0.05 was considered statistically significant.
Results
Baseline characteristics are described in Table 1. A total of 26 patients were included (73% male; median age = 60 years; age range = 39–83 years). The chemotherapy regimen consisted of either oxaliplatin-based (35%), oxaliplatin-based in combination with bevacizumab (54%), or non-oxaliplatin based chemotherapy (12%). The median follow-up was 24 months (range = 6–44 months) and the median time between chemotherapy completion and Gd-EOB-MRI scan was 24 days (range = 0–145 days). Patients had a median of 5 liver metastases (range = 2–15).
Patient characteristics.
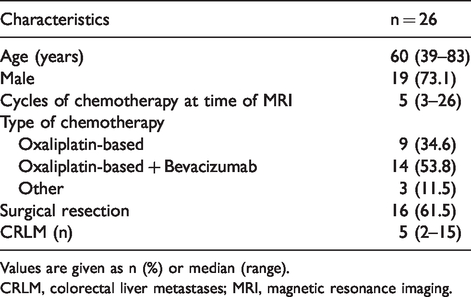
Values are given as n (%) or median (range).
CRLM, colorectal liver metastases; MRI, magnetic resonance imaging.
Inter-observer agreement
There were considerable variations in overall scoring trends between the three readers (Fig. 2). Reader 1 showed a tendency towards more conservative (or lower) scores (46% as definitely not present [0] and 4% as equivocal [2]) and reader 2 scored 65% of the cases as “definitely not present (0)” and never scored “definitely present (4).” Reader 3, on the contrary, never scored “definitely not present (0),” but “equivocal (2)” in 42% of the cases. When comparing these SOS scores between all readers, the inter-observer agreement was poor with quadratic kappa’s ranging from 0.17 (95% confidence interval [CI] = −0.08–0.43) to 0.40 (95% CI = 0.14–0.65) as shown in Table 2. The inter-observer agreement for the binary outcome of positive SOS (CL 3–4) versus negative SOS (CL 0–2) remained low, with kappa’s ranging from 0.03 (95% CI -0.21–0.28) to 0.37 (95% CI -0.02–0.76; Table 2), depending on which readers were compared.
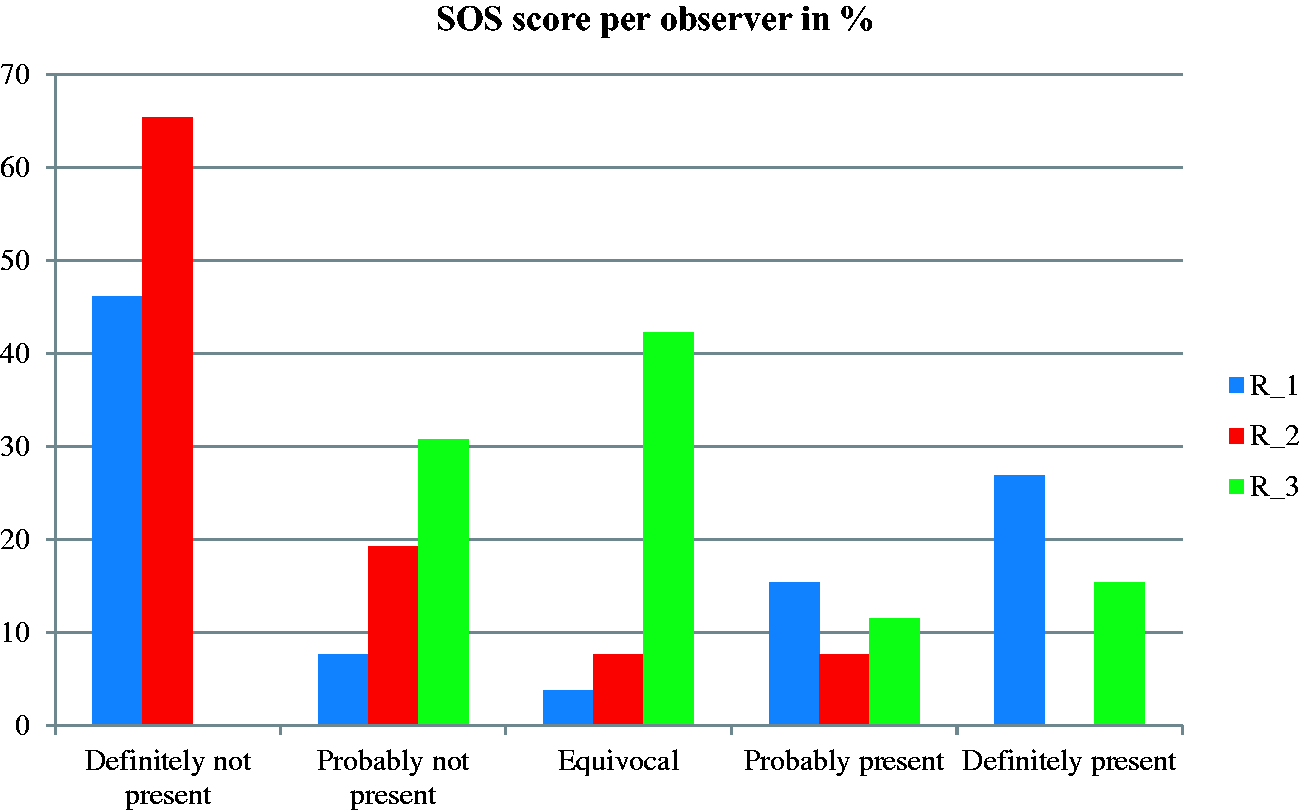
Confidence scores of the three readers for diagnosing SOS. R_1, Reader 1; R_2, Reader 2; R_3, Reader 3.
Inter-observer agreement of the confidence scores between all three readers.
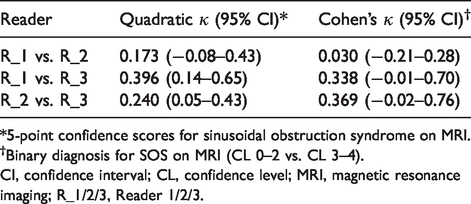
*5-point confidence scores for sinusoidal obstruction syndrome on MRI.
†Binary diagnosis for SOS on MRI (CL 0–2 vs. CL 3–4).
CI, confidence interval; CL, confidence level; MRI, magnetic resonance imaging; R_1/2/3, Reader 1/2/3.
Finally, for the highest confidence level (i.e. CL 4), two out of the three readers agreed on the presence of SOS in 38%. An example of a typical case of SOS is shown in Fig. 3.
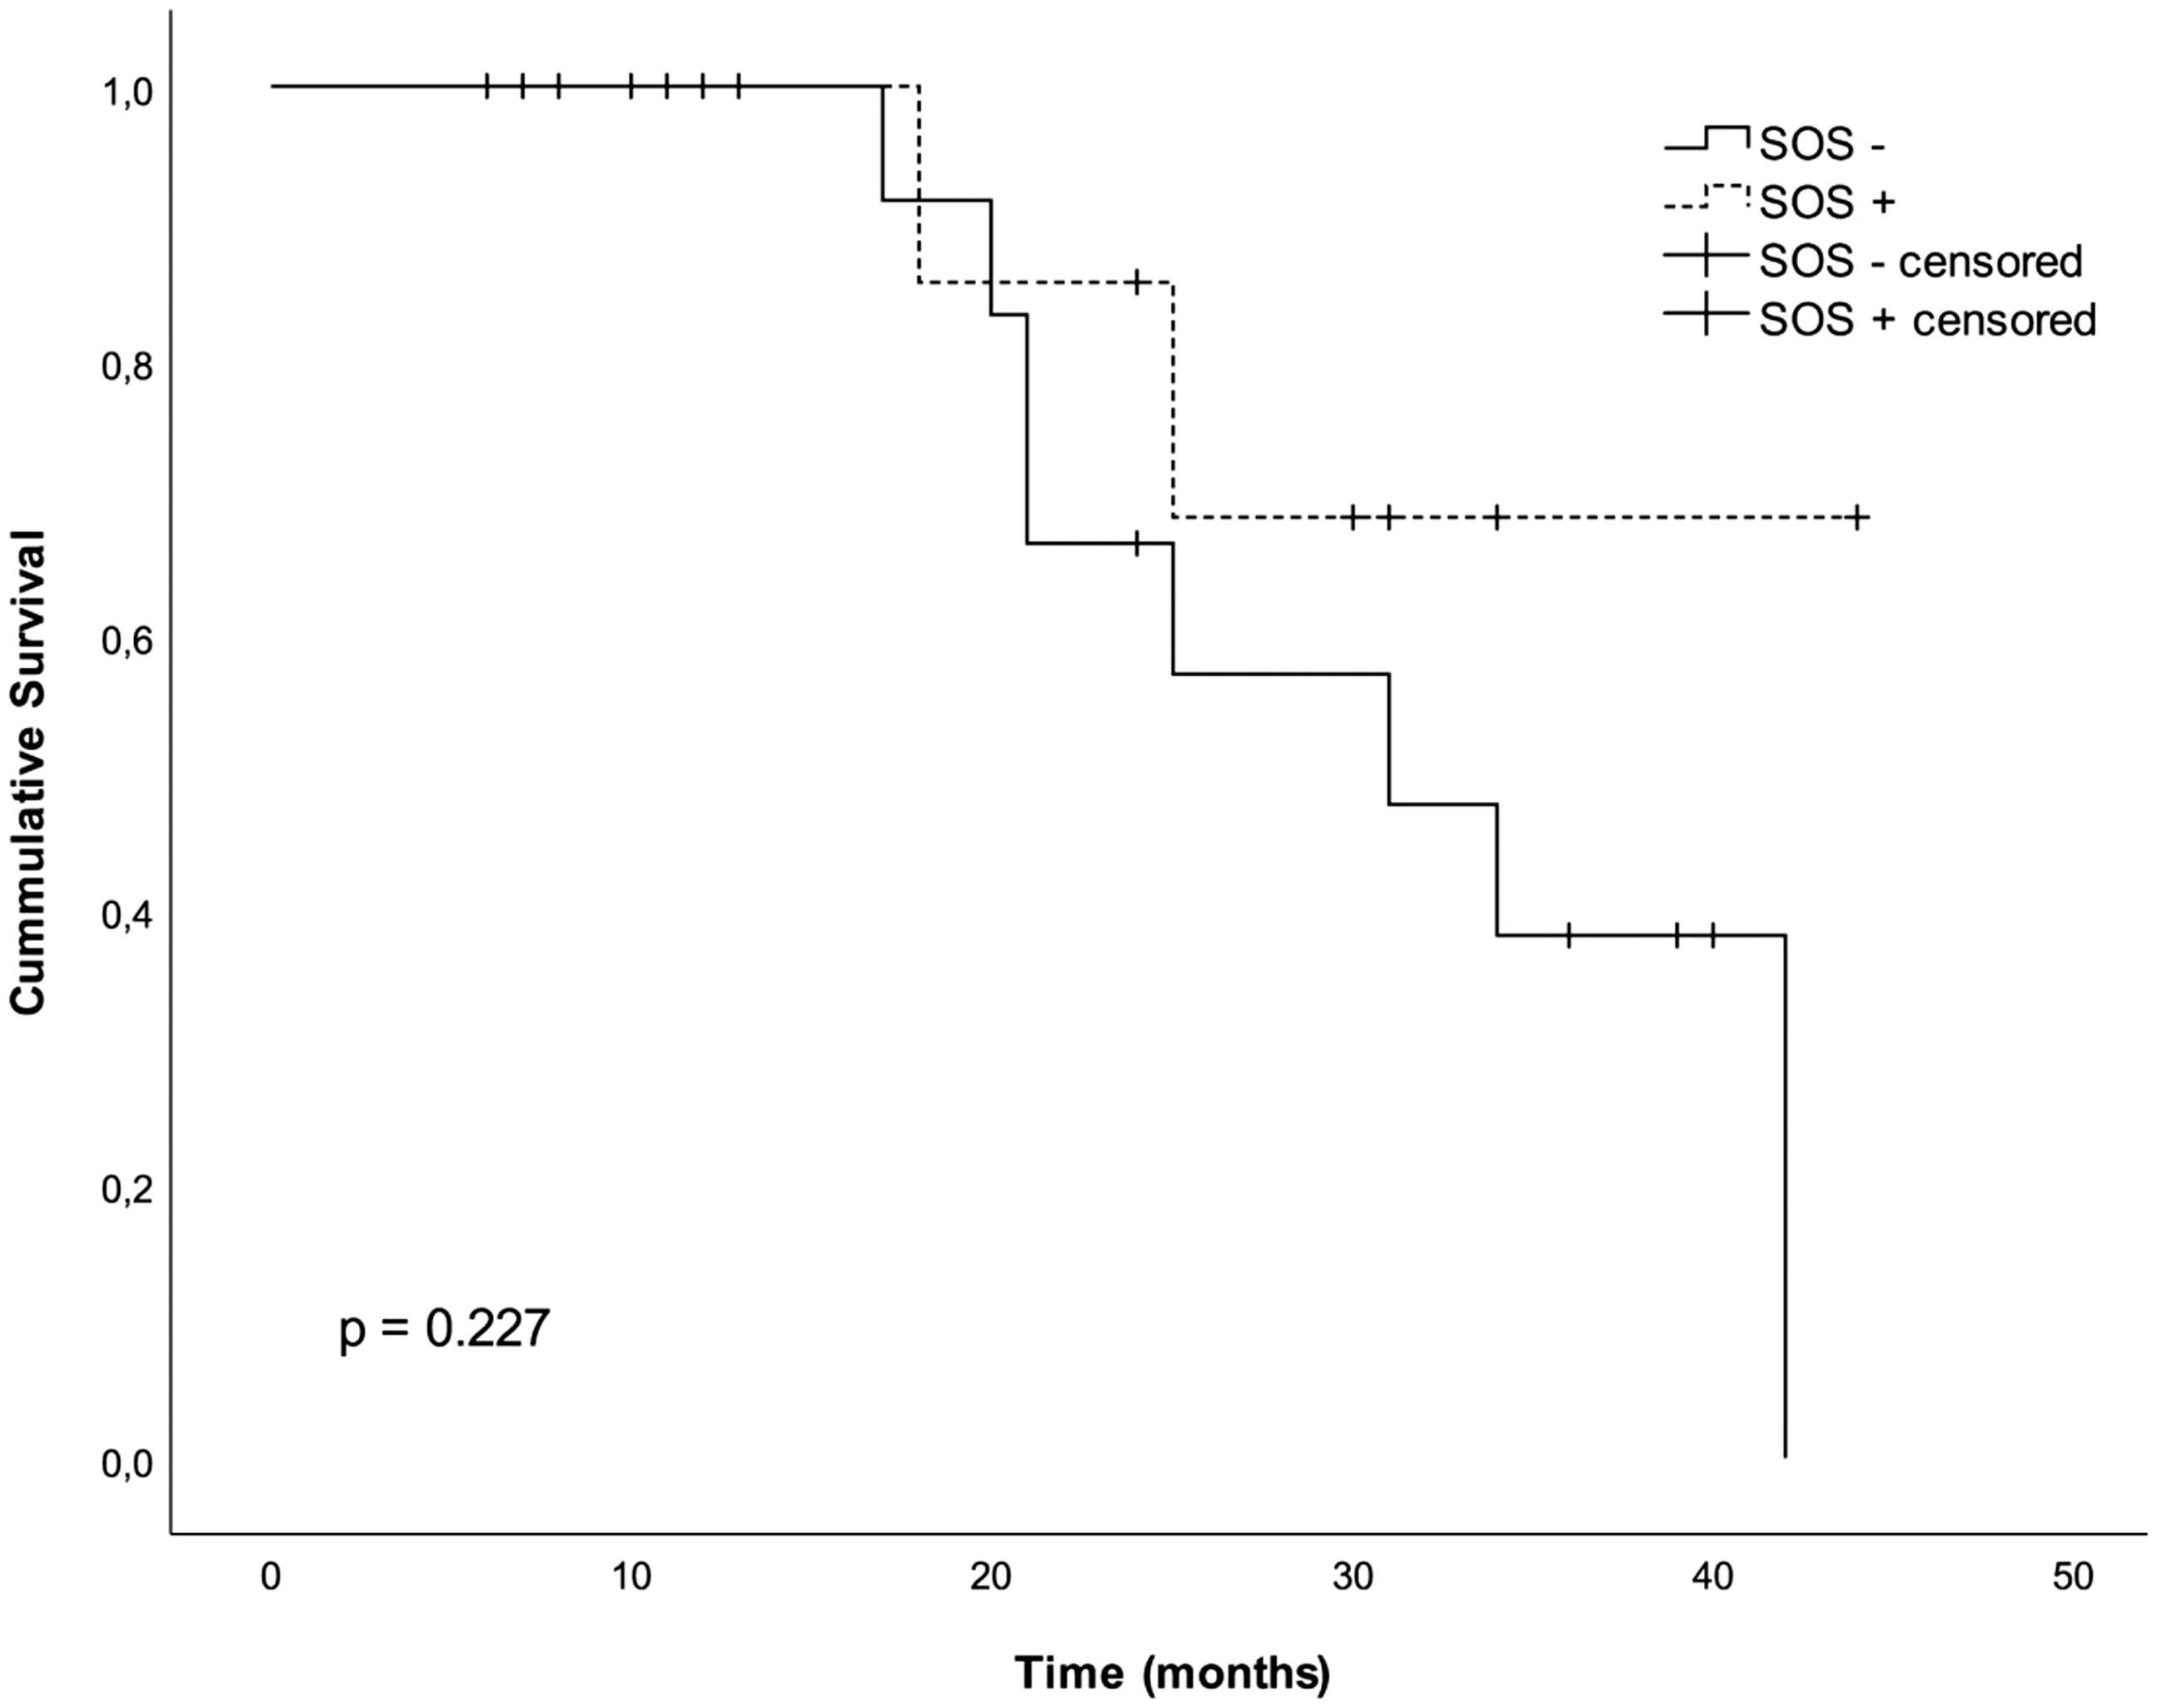
Kaplan-Meier curve of the overall survival in patients treated with chemotherapy for CRLM and with Gd-EOB-MRI positive sinusoidal obstruction syndrome (SOS+; CL=3, 4) vs. negative SOS (SOS --; CL0,1,2) for Reader 1. Median follow-up: 24 months (range 4–44 months). CL, confidence level; CRC, colorectal liver metastases; Gd-EOB-MRI, gadoxetic acid-enhanced magnetic resonance imaging; SOS, sinusoidal obstruction syndrome.
Response to chemotherapy
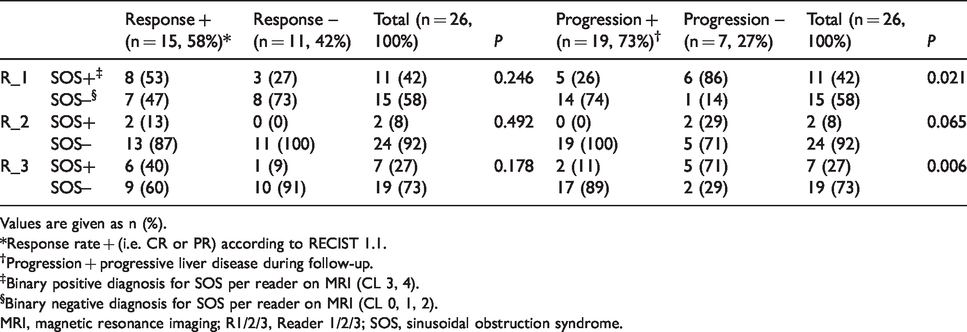
Response to (n)CTx on Gd-EOB-MRI was as follows: 2 (8%) patients had CR; 13 (50%) patients had PR; 4 (15%) patients had SD; and 7 (27%) patients had PD. Therefore, 15 patients were responders versus 11 non-responders. There were no significant differences in SOS scores between the non-responders and responders (Table 3). For Reader 1 only, there was a non-significant trend towards higher SOS scores (CL 3–4) in responders versus non-responders (53% vs. 27% respectively; P = 0.246).
Response rates and progression between both SOS+ vs. SOS–, between all three readers.
Values are given as n (%).
*Response rate + (i.e. CR or PR) according to RECIST 1.1.
†Progression + progressive liver disease during follow-up.
‡Binary positive diagnosis for SOS per reader on MRI (CL 3, 4).
§Binary negative diagnosis for SOS per reader on MRI (CL 0, 1, 2).
MRI, magnetic resonance imaging; R1/2/3, Reader 1/2/3; SOS, sinusoidal obstruction syndrome.
Long-term outcome
During follow-up, 19/26 (73%) patients developed hepatic progression (i.e. new metastases in the liver). Patients with SOS had significantly less hepatic progression during follow-up, compared to patients without SOS (as identified by two radiologists, P = 0.021 and P = 0.006, respectively; Table 3). None of the readers found a significant relation between SOS+ and OS, as shown by the Kaplan–Meier curve of Reader 1 in Fig. 4. Two-year OS in patients with OS was 50%–86% compared to 67%–77% in patients without SOS in all three readers.
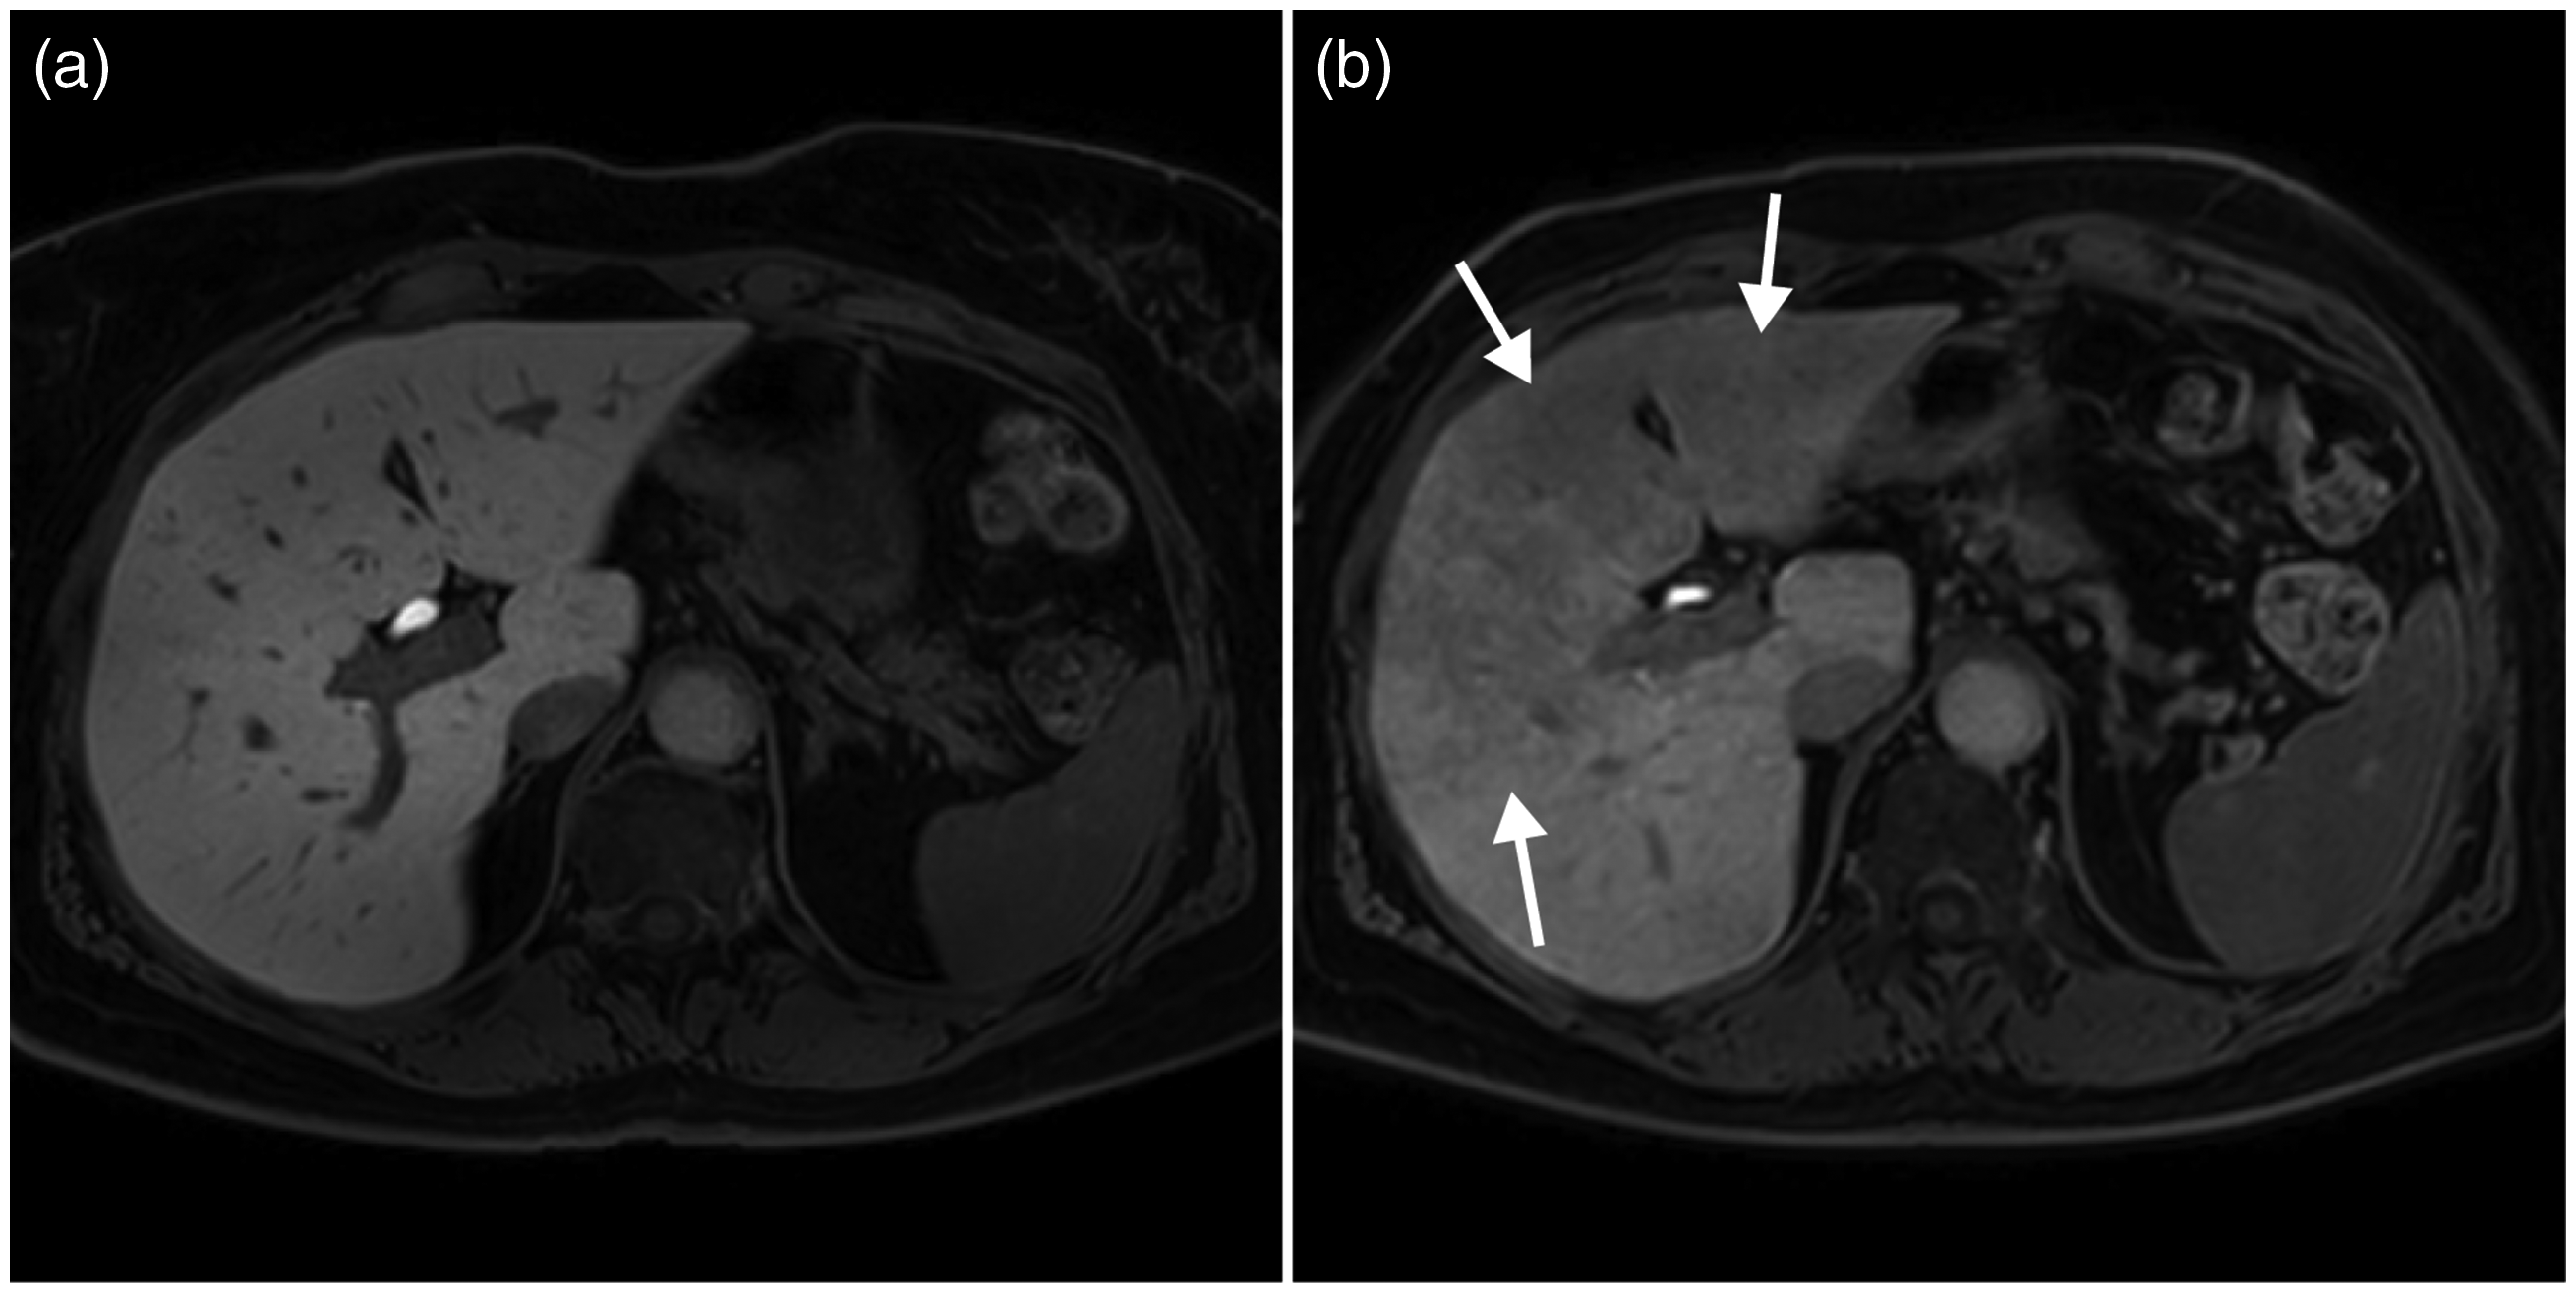
Gd-EOB-MRI with a typical case of SOS in a patient treated with chemotherapy. (a) Pre-treatment normally enhancing liver parenchyma in the hepatobiliary phase without signs of SOS. (b) Post-treatment; obvious hypointense reticulations, most prominent in segments 3, 4, and 5. Gd-EOB-MRI, gadoxetic acid-enhanced magnetic resonance imaging; SOS, sinusoidal obstruction syndrome.
Discussion
In the present study, we assessed the reproducibility of the method proposed by Shin et al. (31) to diagnose SOS (grade) on HPB phase Gd-EOB-MRI. Furthermore, we compared response and survival rates between patients with and without MRI-based SOS for each reader. Our study showed a low overall agreement between three independent readers, for both the individual 5-point diagnostic confidence scores (κ = 0.17–0.40) as well as for the binary diagnosis of SOS (κ = 0.03–0.37). No significant relationship between SOS+ (diagnosed by any of the readers) and response to chemotherapy was found. Strikingly, a contradictory finding compared to literature was found: patients with MRI-based SOS had significantly less hepatic progression during follow-up. Additionally, a tendency towards a higher response rate in patients with SOS+ was observed (although not significant), which further supports the lack of value for MRI-based SOS diagnosis.
The agreement between readers of the present study is much lower than reported by Shin et al. (31), who reported an inter-observer agreement of 0.765 between two observers, although they also found a high variability in the confidence scores for mildly affected cases (31). There are a few reasons why the results of our study may differ from those of Shin et al. First, a third reader was used in the current study and expertise per reader was different. Second, Shin et al. (31) have created the MR criteria for SOS (i.e. confidence score) and it is likely that they were more familiar with its use and interpretation, resulting in a higher inter-observer agreement. Third, the population between the two studies differs. In the present study, all patients underwent (n)CTx regardless of the resectability (only 16/26 patients underwent surgical resection), while Shin et al. only included patients with CRLM that were eligible for surgical resection. Therefore, it is expected that patients in the present study have a higher liver disease burden than the (primarily) resectable CRLM livers mentioned in the paper from Shin et al. A higher disease burden (reflected by the high number of liver metastases per patient [median = 5, range = 2–15]) can decrease the sensitivity of detecting SOS, as the liver parenchyma can enhance heterogeneously in the presence of many metastases, leading to both over- and underestimation of SOS (34,35). Specifically, grading of SOS in the five categories can be challenging in these cases, as SOS is often heterogeneously spread throughout the liver as a patchy pattern intermingled with healthy areas of liver parenchyma and metastases.
In the present study, the histopathological data of SOS were lacking, because a significant proportion of patients had irresectable disease. Even in the 16 patients that did have a hepatic resection, histopathological diagnosis of SOS was missing due to the fact that this requires additional immunostaining that is not part of routine clinical practice (12). Therefore, we studied the relationship of MRI-based SOS with response to chemotherapy and long-term outcome, as SOS has been reported to correlate with clinical outcome. If the absence of SOS would be associated with higher response rates and better long-term outcome, this would support a value for Gd-EOB-MRI to diagnose SOS. Yet, neither of the readers found a significant relationship between SOS diagnosis and response or OS, though a trend towards a lower response rate in patients without MRI-based SOS was seen. Additionally, for two out of the three readers, significantly more hepatic progression was observed in patients without MRI-based SOS. Both findings are counterintuitive and also in contrast with (large) previous studies that reported a worse outcome (e.g. diminished response to CTx or more PD) in patients with SOS (22,24,25). In part, this can be attributable to the small sample size in this study and the fact that only half of the patients underwent surgical resection. Possibly, the changes on MRI that were diagnosed as SOS were only mild and therefore did not correlate to outcome (yet) in the present study. The current results question the value of Gd-EOB-MRI in the diagnosis of SOS, as reproducibility is low and a relation between MRI-based SOS and clinical outcome is lacking.
Besides visual assessment of SOS on imaging, other methods have been studied to diagnose SOS non-invasively. The currently most promising (combination of) non-invasive biomarkers has been reported by Pereyra et al. (26), who found an association between aspartate aminotransferase (AST) platelet ratio index (APRI) + albumin-bilirubin grade (ALBI) score and chemotherapy associated liver injury (CALI) in a large multicenter study (n = 500). Unfortunately, the imaging-based biomarkers studies so far have not been found to be accurate enough to diagnose SOS. For example, an increased spleen size can be found in patients with SOS (on CT or MRI), but low to moderate kappa values have also been reported for spleen-size measurements (10,29,36). Park et al. (37) reported a higher spleen volume index (SVI) in patients with “clinically suspected SOS” (e.g. elevated non-invasive markers API, APRI, platelet count to spleen ratio [PSR], FIB-4), yet they did not correlate this to histopathology. O’Rourke et al. (37) tried to detect sinusoidal injury with ferubcarbotran-enhanced MRI with an area under the receiver operating characteristic curve of only 0.611. Another study by Han et al. (39) reported that post-oxaliplatin heterogeneity of liver parenchyma (i.e. POHL) on CE-CT scans was correlated with elevated AST and ALT levels, but not with histopathology. Histopathology remains the gold standard, which has the disadvantage of a risk for sampling error when acquired by biopsy or a late diagnosis when found after liver resection. For now, evidence for routine use of Gd-EOB-MRI for (mild) SOS diagnosis is lacking. It seems that severe cases could be easier to diagnose, as two out of the three readers agreed by 38% on the presence of SOS in the higher confidence levels (i.e. CL 4; Fig. 3). Therefore, it is important to mention severe/obvious SOS in an MRI report because of the abovementioned clinical implications.
The present study has some limitations. First, it is a retrospective study with a small sample size. Second, we could not correlate the Gd-EOB-MRI scores with histopathology, because these data were not available. Alternatively, response to chemotherapy and survival were used as surrogate endpoints with a clear clinical value. Further, the scans were scored by three radiologists with varying expertise and follow-up time was long.
In conclusion, SOS assessment using Gd-EOB-MRI is not reproducible between radiologists with varying expertise. In the present study, no relation with clinically relevant outcome was observed for any of the three readers. Therefore, in contrast to previous reports in literature, our study suggests that Gd-EOB-MRI seems less useful for the assessment of SOS. Alternative biomarkers should be further explored, as the presence of SOS has been correlated with increased morbidity related to (major) liver resection after nCTx in patients with liver-metastasized CRC.
Footnotes
Declaration of conflicting interests
The author(s) declared no potential conflicts of interest with respect to the research, authorship, and/or publication of this article.
Funding
The author(s) received no financial support for the research, authorship, and/or publication of this article.