
Abstract
Background
Spinal cord injury (SCI) is a severe central nervous system injury that can generally induce different degrees of sensory and motor dysfunction
Purpose
To clarify the changes of diffusion tensor imaging (DTI) parameters after spinal cord myelotomy in rats with SCI.
Material and Methods
Eighteen Sprague Dawley (SD) rats were randomly divided into the Sham group (n=6), SCI group (n=6), and Mye group (n=6), respectively. The DTI values at 1, 3, 7, and 21 days after modeling were collected by magnetic resonance imaging (MRI). The spinal specimen at the injury site was collected on the 21st day for Nissl’s staining to assess the changes in neurons.
Results
The fractional anisotropy (FA) values in both the SCI group and Mye group significantly decreased. In addition, the FA values between the two groups were statistically significant (P < 0.001). The apparent diffusion coefficient (ADC), mean diffusivity (MD), axial diffusivity (AD), and radial diffusivity (RD) values all decreased and then increased (P < 0.001). Pearson correlation test showed that the ADC, MD, and AD values were positively correlated with the Basso Beattie Bresnahan (BBB) score. Nissl’s staining showed a higher number of Nissl’s bodies, and deep staining of Nissl’s bodies in the Mye group, while the morphology of neurons was relatively good. The number of neurons in the Mye group was significantly higher after myelotomy compared to the SCI group (P < 0.001).
Conclusion
The DTI parameters, especially ADC values, could non-invasively and quantifiably evaluate the efficacy of myelotomy for rats with SCI.
Introduction
Spinal cord injury (SCI) is a severe central nervous system injury that can generally induce different degrees of sensory and motor dysfunctions (1). Currently, the treatment for SCI mainly includes surgical decompression, drug therapy, genetic therapy, tissue material therapy, and rehabilitation therapy (2). Some researchers have demonstrated that decompression by myelotomy could help to stop the bleeding and clear necrotic tissues of the injury. Accordingly, myelotomy has been considered as a potentially promising method for preventing secondary injuries (3). Yet, thus far, very few studies have used imaging methods to evaluate myelotomy.
Diffusion tensor imaging (DTI) is a magnetic resonance (MR) technique capable of non-invasively measuring the magnitude and direction of diffusion of water molecules in nerve tissues (4). By combining the eigenvalues λ1, λ2, and λ3, several scalar measures of diffusion have been proposed: “Apparent Diffusion Coefficient” (ADC) is a primary measure, represents the magnitude of water diffusion, whereas “axial diffusivity” (AD) and “radial diffusivity” (RD) describe, respectively, the magnitude of diffusion parallel and perpendicular to the primary axis of the diffusion tensor (5). The overall directivity (anisotropy) of the diffusion of water molecules in tissues could be reflected by the fractional anisotropy (FA) (6). The “mean diffusivity” (MD) offers an index reflecting the overall diffusivity of water molecules (7). DTI studies in animal models of spinal cord injury indicate that DTI is a reliable imaging technique with important histological and functional correlates (8).
Previous studies on myelotomy were mainly ex vivo animal experiments. At the same time, the feature of the non-invasiveness of DTI could help the continuous observation of the injuries and nerve recovery in living animal models (9).
Therefore, the aim of the present study was to clarify the changes of DTI parameters after spinal cord myelotomy in rats with SCI.
Material and Methods
Animal models
Eighteen healthy Sprague Dawley (SD) rats of clean grade, with a mean body weight of 200 ± 10 g were purchased from the Beijing Jinmuyang Laboratory Animal Company. The rats were randomly divided into the Sham group, SCI group, and Mye group and were given free access to food and drinking water. They were kept in the environment with constant humidity and temperature, with a 12-h/12-h light/dark cycle. In order to meet the inclusion criteria, all the rats received magnetic resonance imaging (MRI; Bruker Pharmasca 7.0/16 us, Germany) scanning before the operation to rule out the spinal nerve-related diseases. All the rats scored 21 points (the highest point) in the Basso Beattie Bresnahan (BBB) scale. All animal studies (including the mice euthanasia procedure) were done in compliance with the regulations and guidelines of Capital Medical University institutional animal care and conducted according to the AAALAC and the IACUC guidelines (AEEI-2015-055).
Sham group
All the SD rats in the Sham group were anesthetized by intraperitoneal injection of 10% chloral hydrate (0.4 mg/g, Kermel, Tianjin, PR China). Later, the skin of the surgical area was prepared and disinfected. The skin and subcutaneous tissues were resected with the center of T10 to expose the spinal processes and vertebral plates of T9 and T10, which were then resected.
SCI group
After the vertebral plate of the rats was resected, the Infinite Horizon impactor (IH-0400 Impactor, Precision Systems, and Instrumentation, LLC, USA) was used to impact the spinal cord with the potential energy of 25 g/cm (10 g × 25 mm) (10). Immediately after SCI, those rats that shook their bodies quickly retracted their lower limbs and wagged their tails were included in the study as per previously published criteria (11). After being rinsed with normal saline, the wound was sutured layer by layer. The incision was disinfected and 4 × 10⁵ U penicillin and 20 mL normal saline were immediately subcutaneously injected into the back of rats for three continuous days. Artificial urination was performed four times per day after the operation until the spontaneous urination was established.
Mye group
The rat models in the Mye group were induced by the spinal impactor, after which a self-designed spinal cutter (Patent No. ZL 2018 2 1322624.5) was used for myelotomy. In brief, an incision 3 mm in length and 1 mm in depth was made at the midline of the dorsal spinal cord, centered on the injury site. The hematomas and necrotic tissues were rinsed by normal saline at room temperature, and the muscle and skin were sutured layer by layer after the surgery. The rats were more attentively cared for after the surgery and formally monitored once daily. If a rat is not gaining weight as quickly as expected, or exhibits other signs of morbidity, novel supplemental items are provided to encourage eating. The rats were removed from the study and euthanized if body weight loss from peak weight exceeded 20%.
MRI scanning
The rats were placed in the prone position, and throughout the MRI scanning, they were maintained on anesthetic administered by inhalation of isoflurane (1.5%–2%). The MRI scanning was performed by the BRUKER 7.0-T MRI (Bruker Pharmasca 7.0/16us, Germany) scanner. T2-weighted (T2W) images were completed with the spin echo sequence. Axial T2W imaging was acquired with the following parameters: TR/TE = 3000/45 ms; field of view (FOV) = 35 × 35 mm; and slice thickness = 1 mm. Sagittal T2W imaging was obtained with the following parameters: TR/TE = 3000/45 ms; FOV = 40 × 40 mm; and slice thickness = 0.5 mm. For DTI scanning, the single spin echo-echo planar imaging (SE-SPI) technique was used with the following parameters: TR/TE = 6250/22 ms; FOV = 4 × 4 cm; matrix = 128 × 128; scanning time = 15 min; layer thickness = 1 mm; b value of diffusion-weighted coefficient = 1000 s/mm2. The number of diffusion gradient directions was 30. The scanning covered the injured area and was performed before and at 24 h, three days, seven days, and three weeks after the injury.
The Paravision version 5.1 software provided by the BRUKER Company was used to define the midline of the white matter on the T2W images. The T2 images were separated as the whole spinal cord, gray matter, and white matter, respectively, which were then used as the template for DTI processing. The pre-processing of DTI images included the following: (i) registration of T2W images; (ii) eddy-current correction; and (iii) calculation of the DTI parameters including FA, ADC, MD, RD, and AD. The injury center (T10) was defined as the region of interest (ROI). The parameters of the injury area were analyzed.
Behavioral assessment
The Basso Beattie Bresnahan (BBB) was used to evaluate locomotor function by placing the rat on a flat surface that was 1 m in diameter and evaluating the hind limb (HL) function of the rat for 3 min. The joint movement, HL movement, stepping, forelimb (FL)–HL coordination, trunk position and stability, paw position, and tail position were classified and assessed by 21 items in this scale, which represented the scores during the continuous recovery of the rats.
The scores of the rats were assessed before and at one day, three days, seven days, and 21 days after the injury. The rats were placed in the space with the area of 2 × 2 m, and the 4-min behaviors were assessed by two investigators (double-blind) independently (12,13).
Nissl’s staining
After MRI scanning at 21 days after the injury, mice were given an intraperitoneal injection of 10% chloral hydrate (0.4 mg/g, Kermel, Tianjin, PR China). The spinal tissues within the area of 5 mm around the injury were obtained and embedded in paraffin. The section was performed with the thickness of a slice of 4 µm and an interval of 500 µm. Three consecutive slices were obtained for each sample for the examination. These procedures were performed for all the rats in the Sham group (n = 6), SCI group (n = 6), and Mye group (n = 6). The deparaffinage of the slices was performed by immersing the slices into dimethylbenzene I solution for 20 min, followed by dimethylbenzene II solution for 20 min, absolute ethanol I solution for 10 min, absolute ethanol II solution for 10 min, 95% ethanol solution for 5 min, 90% ethanol solution for 5 min, 80% ethanol solution for 5 min, 70% ethanol solution for 5 min, and rinsing with distilled water. Then the slices were stained by toluidine blue for 10 min, subjected to 95% ethanol differentiation, and dried in an electronic dryer. After vitrification by dimethylbenzene for several minutes, the slices were mounted by neutral balsam and then examined by a microscope. Finally, the photos were collected for analysis.
Statistical analysis
SPSS 21.0 software (SPSS Inc., Chicago, IL, USA) was used for statistical analysis. Shapiro–Wilk normality test was first performed for the data. Analysis of variances (ANOVA) for repeated measurements was used to analyze the changes of each parameter within each group, as well as among the groups at different timepoints. Pearson correlation test was used to explore the correlation between the BBB scores and DTI parameters. The data were described as means and standard deviation. P < 0.05 was considered statistically significant.
Results
Conventional MRI findings
As shown in Fig. 1, T2W sagittal imaging shows that spinal cord edema in the Mye group was lower than in the SCI group after 21 days.
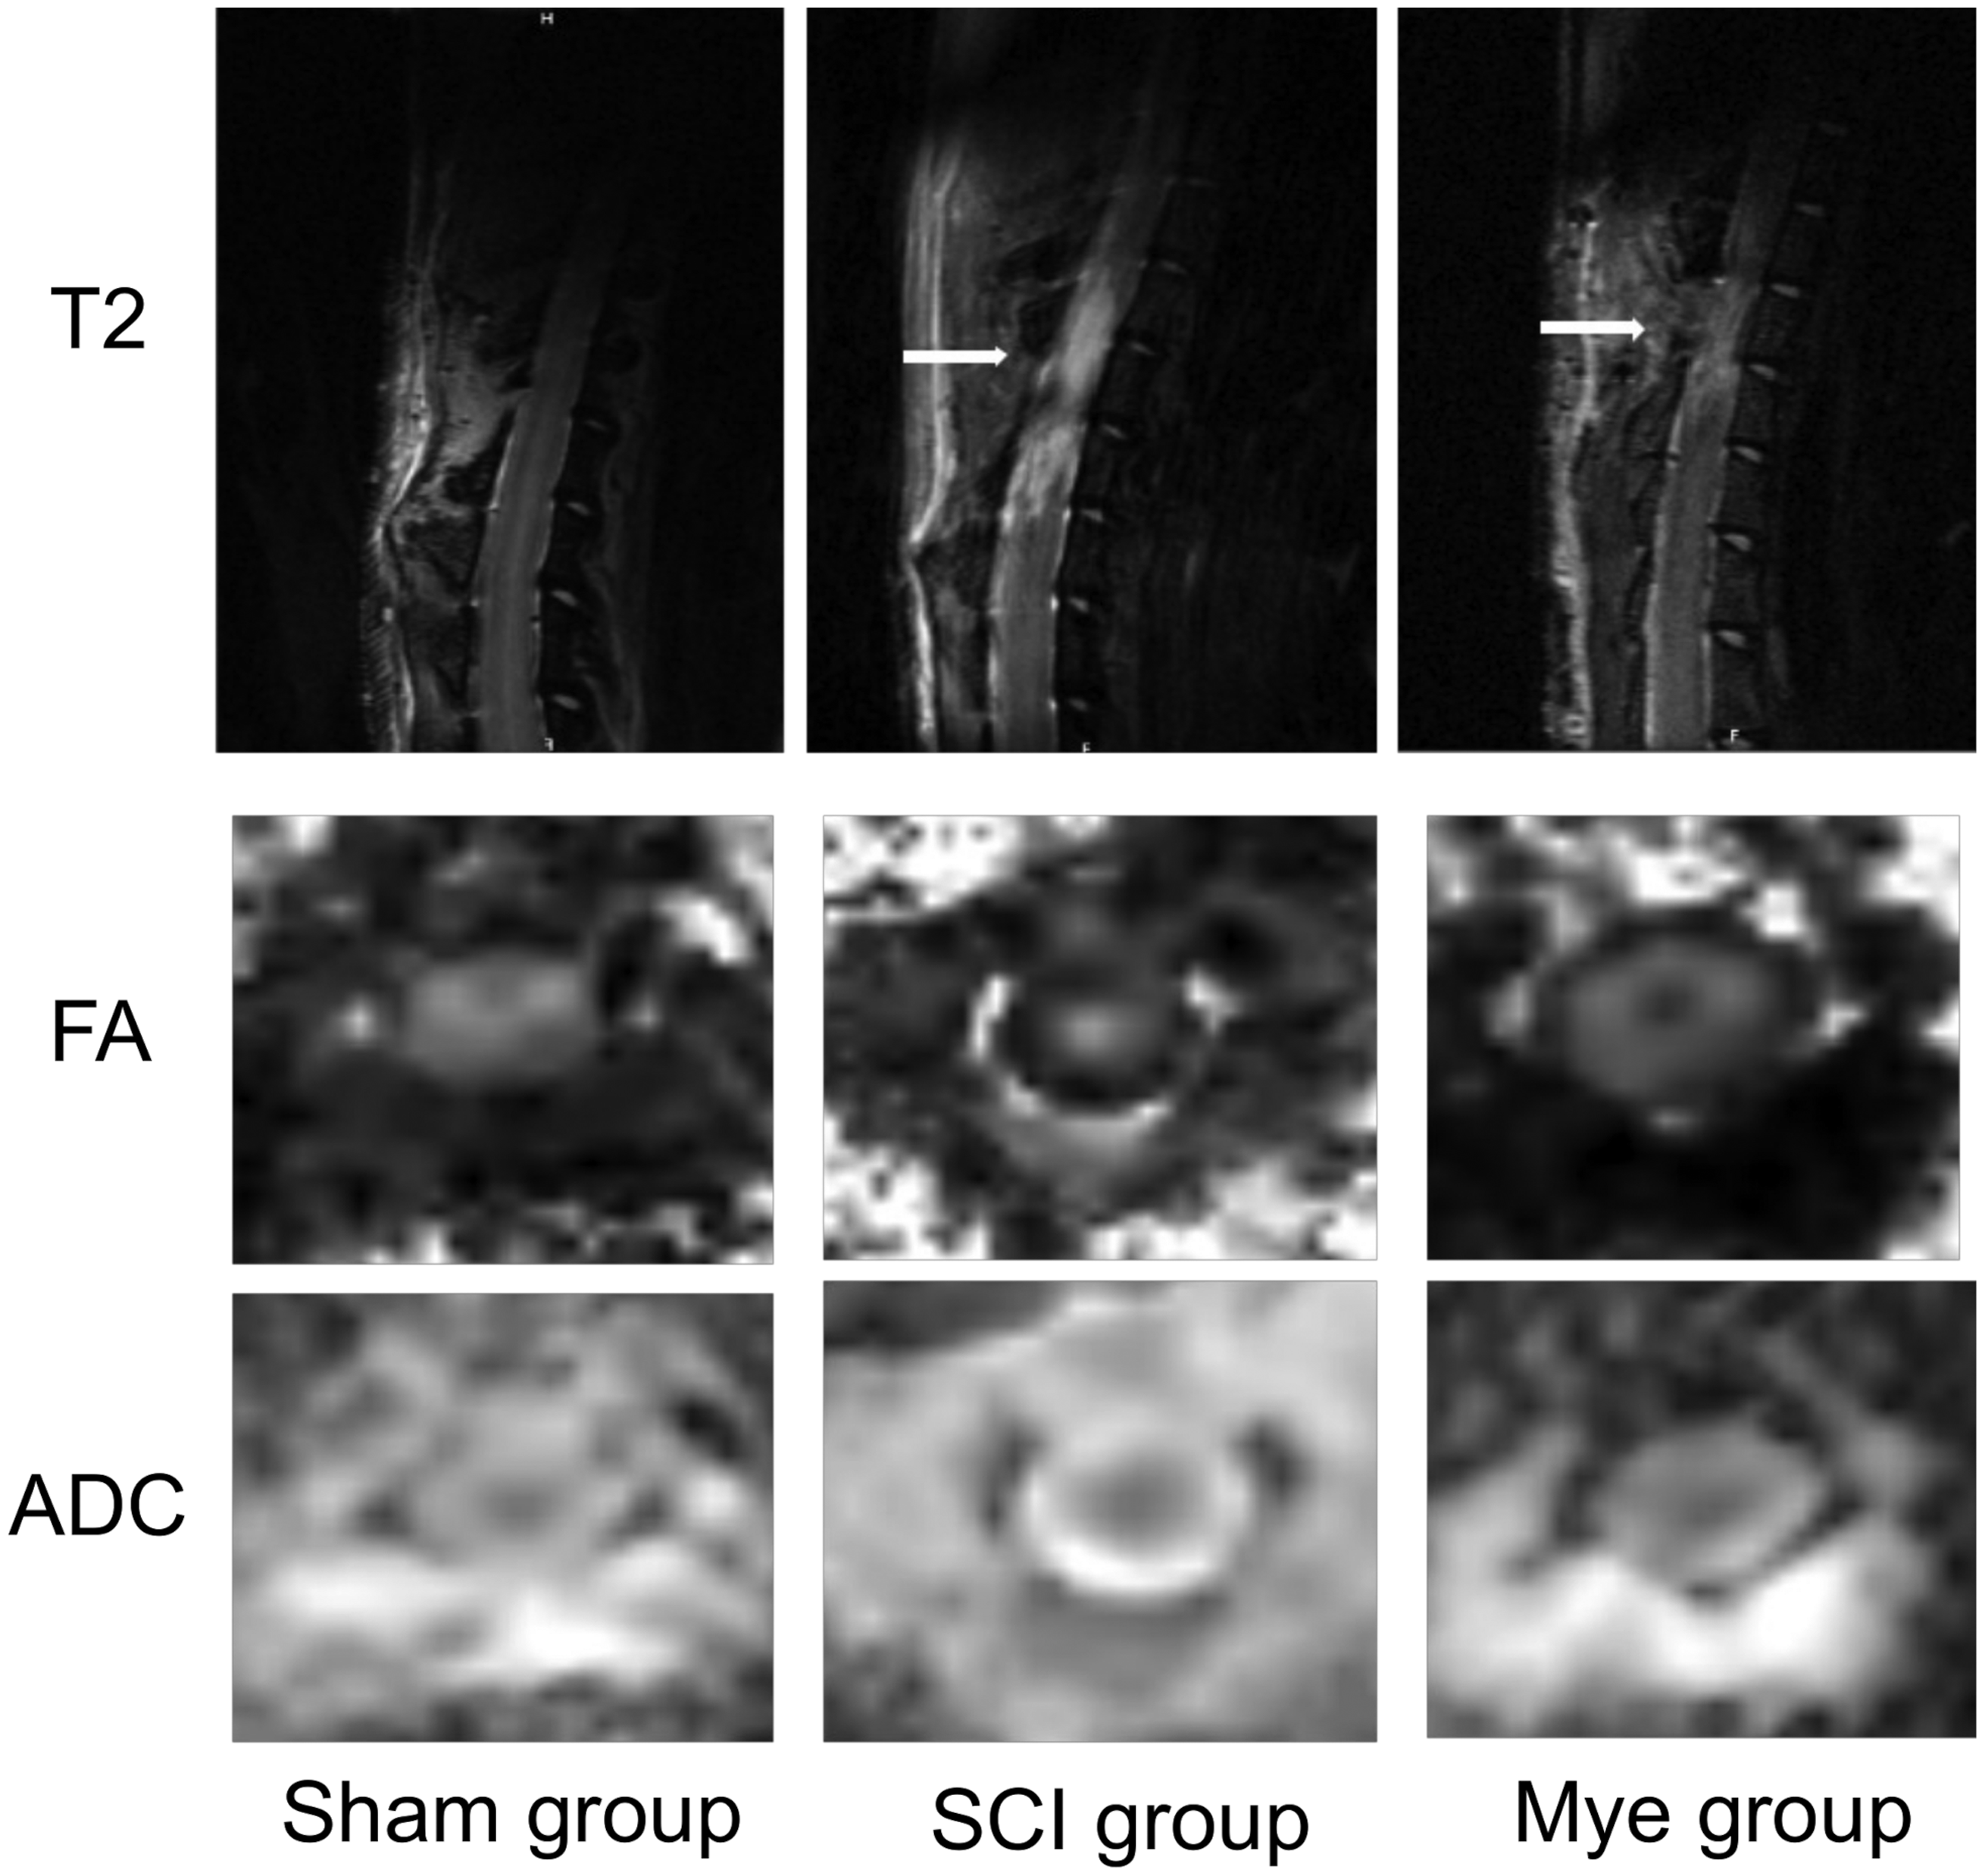
In vivo magnetic resonance sagittal images at three weeks. (a) T2W image, a white arrow shows the injury site. (b) FA and ADC maps from the diffusion tensor imaging. ADC, apparent diffusion coefficient; FA, fractional anisotropy; T2W, T2-weighted.
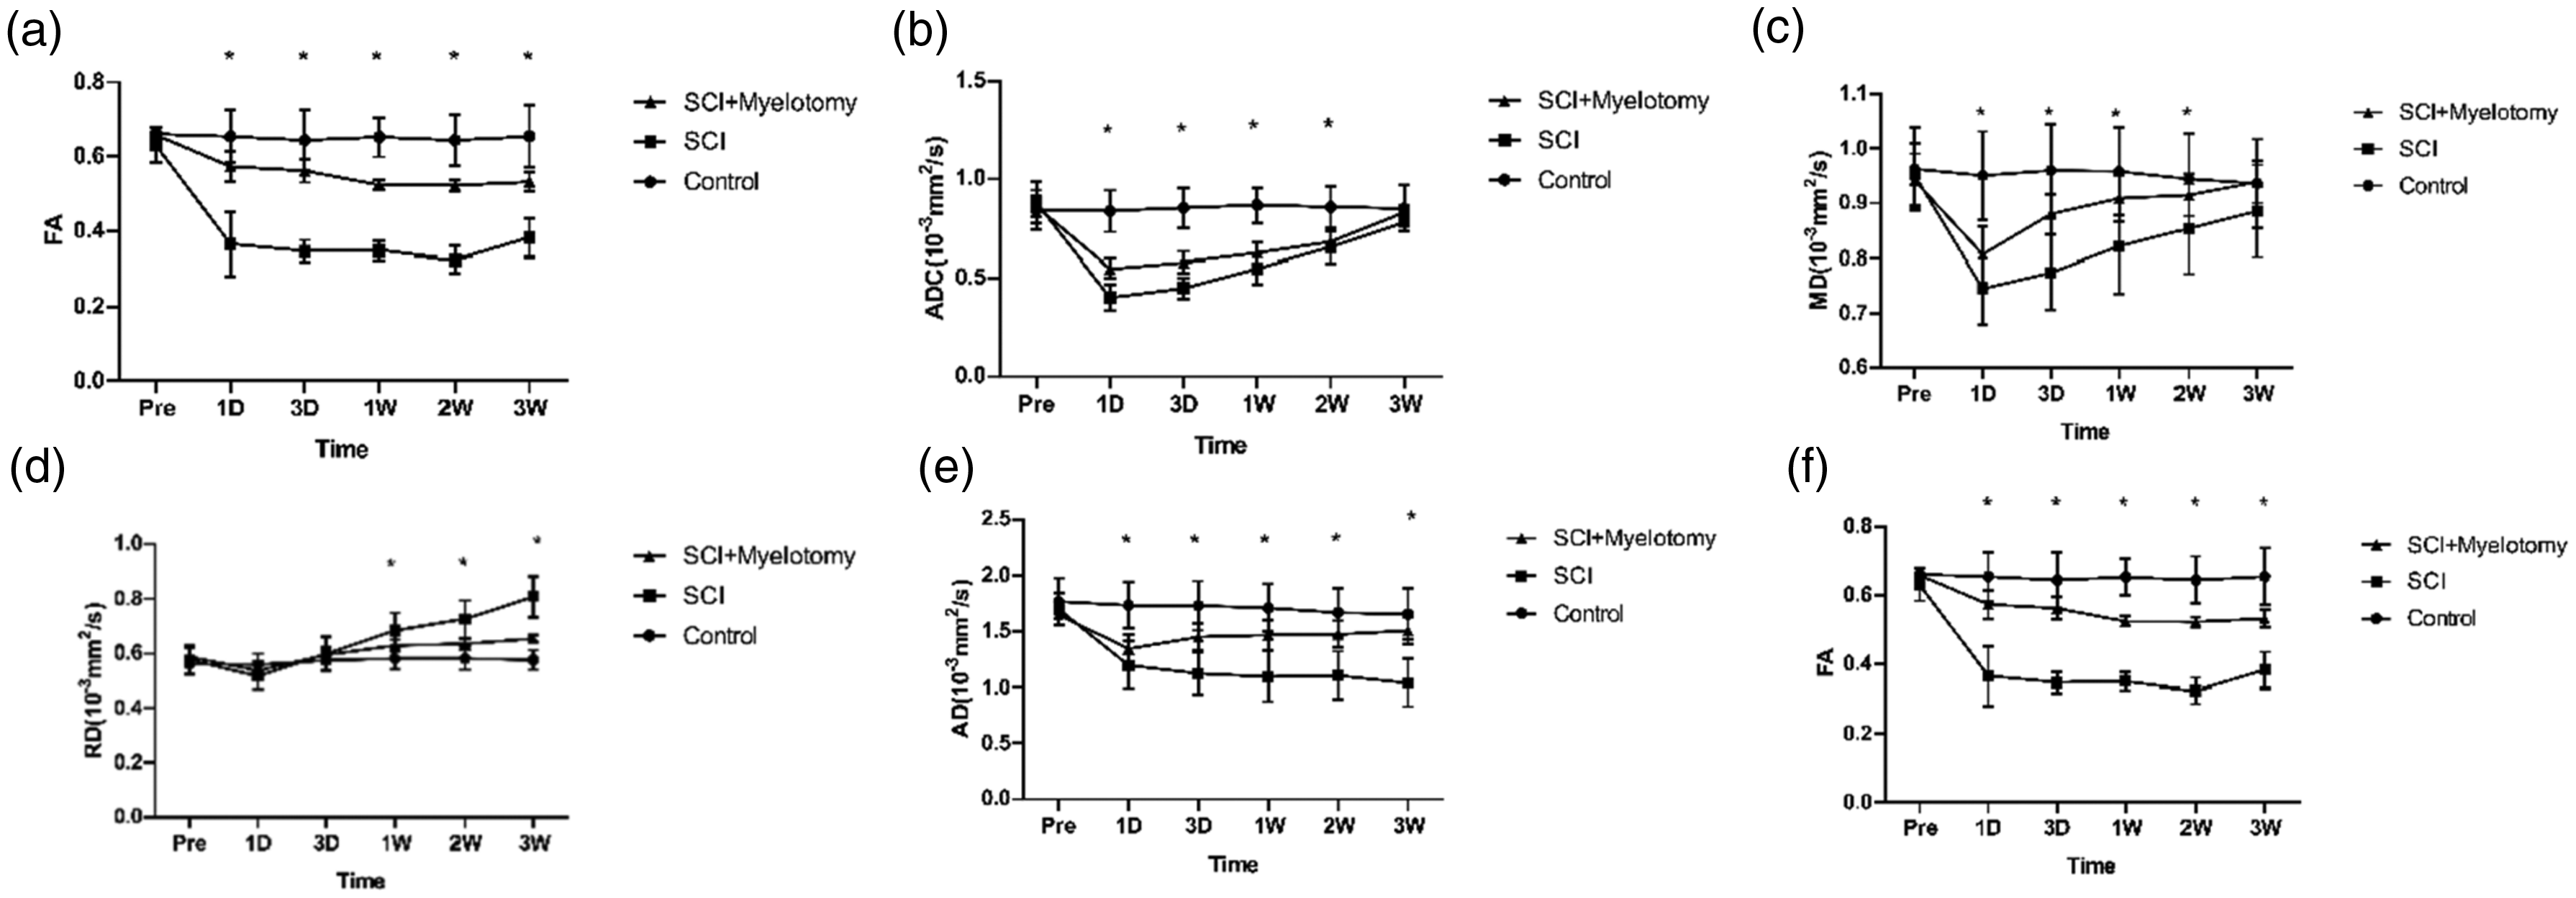
Comparisons of the DTI parameters, including FA (a), ADC (b), MD (c), RD (d), AD (e), before and after the surgery. All the parameters are expresses as means and standard divisions. P < 0.05 was considered statistically significant. *P < 0.001. (f) The BBB scores of the rats after spinal cord injury and myelotomy. All the data are expressed as means ± SD. P < 0.05 was considered statistically significant. *P < 0.001. AD, axial diffusivity; ADC, apparent diffusion coefficient; BBB, Basso Beattie Bresnahan;FA, fractional anisotropy; MD, mean diffusivity; RD, radial diffusivity.
DTI parameters
Fig. 2 shows the changes in DTI parameters before and after the myelotomy. The FA values in the three groups were generally consistent before the injury (P > 0.05). However, the FA values were significantly different among the three groups after the surgical intervention (P < 0.001), and there were interactions between the timing and grouping (P < 0.001). The FA value in the SCI and Mye groups significantly decreased one day after the SCI. The observations were continued to three days after the SCI, which showed that the changes in FA values were unsubstantial at one week, two weeks, and three weeks after the SCI, while the FA values in both groups did not show evident recovery. Pair-wise comparisons at different timepoints showed that compared with the Sham group, the FA values in the SCI group (P < 0.001), and Mye group (P < 0.001) were significantly lower at all timepoints. Also, the FA values in the Mye group were significantly higher than in the SCI group at all the timepoints (P < 0.001). These findings suggested that myelotomy could significantly change the FA value of DTI after SCI (Fig. 2a).
The ADC values in the three groups were not significantly different before the injury (P > 0.005) but changed differently with the time of injury. The ADC values in the three groups all recovered to a comparable level three weeks after the injury, with statistically significant differences found only at four timepoints, namely one day, three days, one week, and two weeks after the injury (P < 0.001). The ADC value in the SCI group significantly decreased one day after the injury, then started to increase gradually, and recovered to the level close to normal value at about three weeks after the injury. Compared with the SCI group, the ADC values in the Mye group were significantly higher at all the timepoints (P < 0.001), thus suggesting that myelotomy could significantly change the ADC value of DTI after SCI (Fig. 2b).
The changes in MD values were similar to ADC values. The MD values were different among the Sham group, SCI group, and Mye group, and the changes at different timepoints varied greatly. The MD value substantially decreased in the SCI and Mye groups after the SCI and reached the lowest levels one day after the injury. Compared with the Mye group, the decrease of MD was relatively less substantial and was higher than that in the SCI group one day after the injury. ANOVA for repeated measurements showed that MD values were significantly different among different groups (P < 0.001), and significantly different among different groups at the same timepoints (P < 0.001), thus suggesting that myelotomy could significantly change the MD value of DTI after SCI (Fig. 2c).
The RD values decreased after the SCI and reached the lowest levels at 24 h after the injury, but then gradually increased afterward and recovered to an even higher level than the normal one. The RD values in the SCI group were significantly higher than the Sham group at seven days, 14 days, and 21 days after the injury (P < 0.001). The RD values in the Mye group were significantly higher than the Sham group at 14 days and 21 days after the injury (P < 0.001). In addition, the RD values in the Mye group were significantly lower than the SCI group at seven days, 14 days, and 21 days after the injury (P < 0.001), which suggested that myelotomy could significantly change the RD value of DTI after SCI (Fig. 2d).
The AD values in the three groups underwent different changes with the time after the SCI. The AD values in the SCI group tended to decrease after the injury and were significantly different than the values in the Sham group (P < 0.001). The AD values in the Mye group started to recover at three days after the injury and continued to increase thereafter. The differences with the SCI group were statistically significant (P < 0.001), which suggested that myelotomy could significantly change the AD value of DTI after SCI (Fig. 2e).
Behavioral assessment
The BBB scores of the rats in all the three groups were 21 points before the SCI. The BBB scores of each group were 0 on the first day after the injury, which was significantly lower compared to 21 points before the injury (P < 0.001). The nerve functions of the rats gradually recovered with time. The recovery of behavior was significantly faster in the Mye group than the SCI group (P < 0.001), thus suggesting that myelotomy could significantly improve the nerve function in rats (Fig. 2f).
Correlations between DTI parameters and BBB score
Pearson correlation test was conducted for the DTI parameters and BBB score. The findings showed that the ADC value (R2 = 0.930; P = 0.002), MD value (R2 = 0.800; P = 0.016), and AD value (R2 = 0.830; P = 0.012) of the injury site were all positively correlated with the BBB score. Yet, FA and RD values were not significantly correlated with the BBB score (P > 0.05). The correlation of the ADC value was higher than the correlations of MD and RD values with the BBB score, thus suggesting that ADC was most closely correlated with the locomotive function and measuring the ADC value could predict the behavior (Fig. 3).
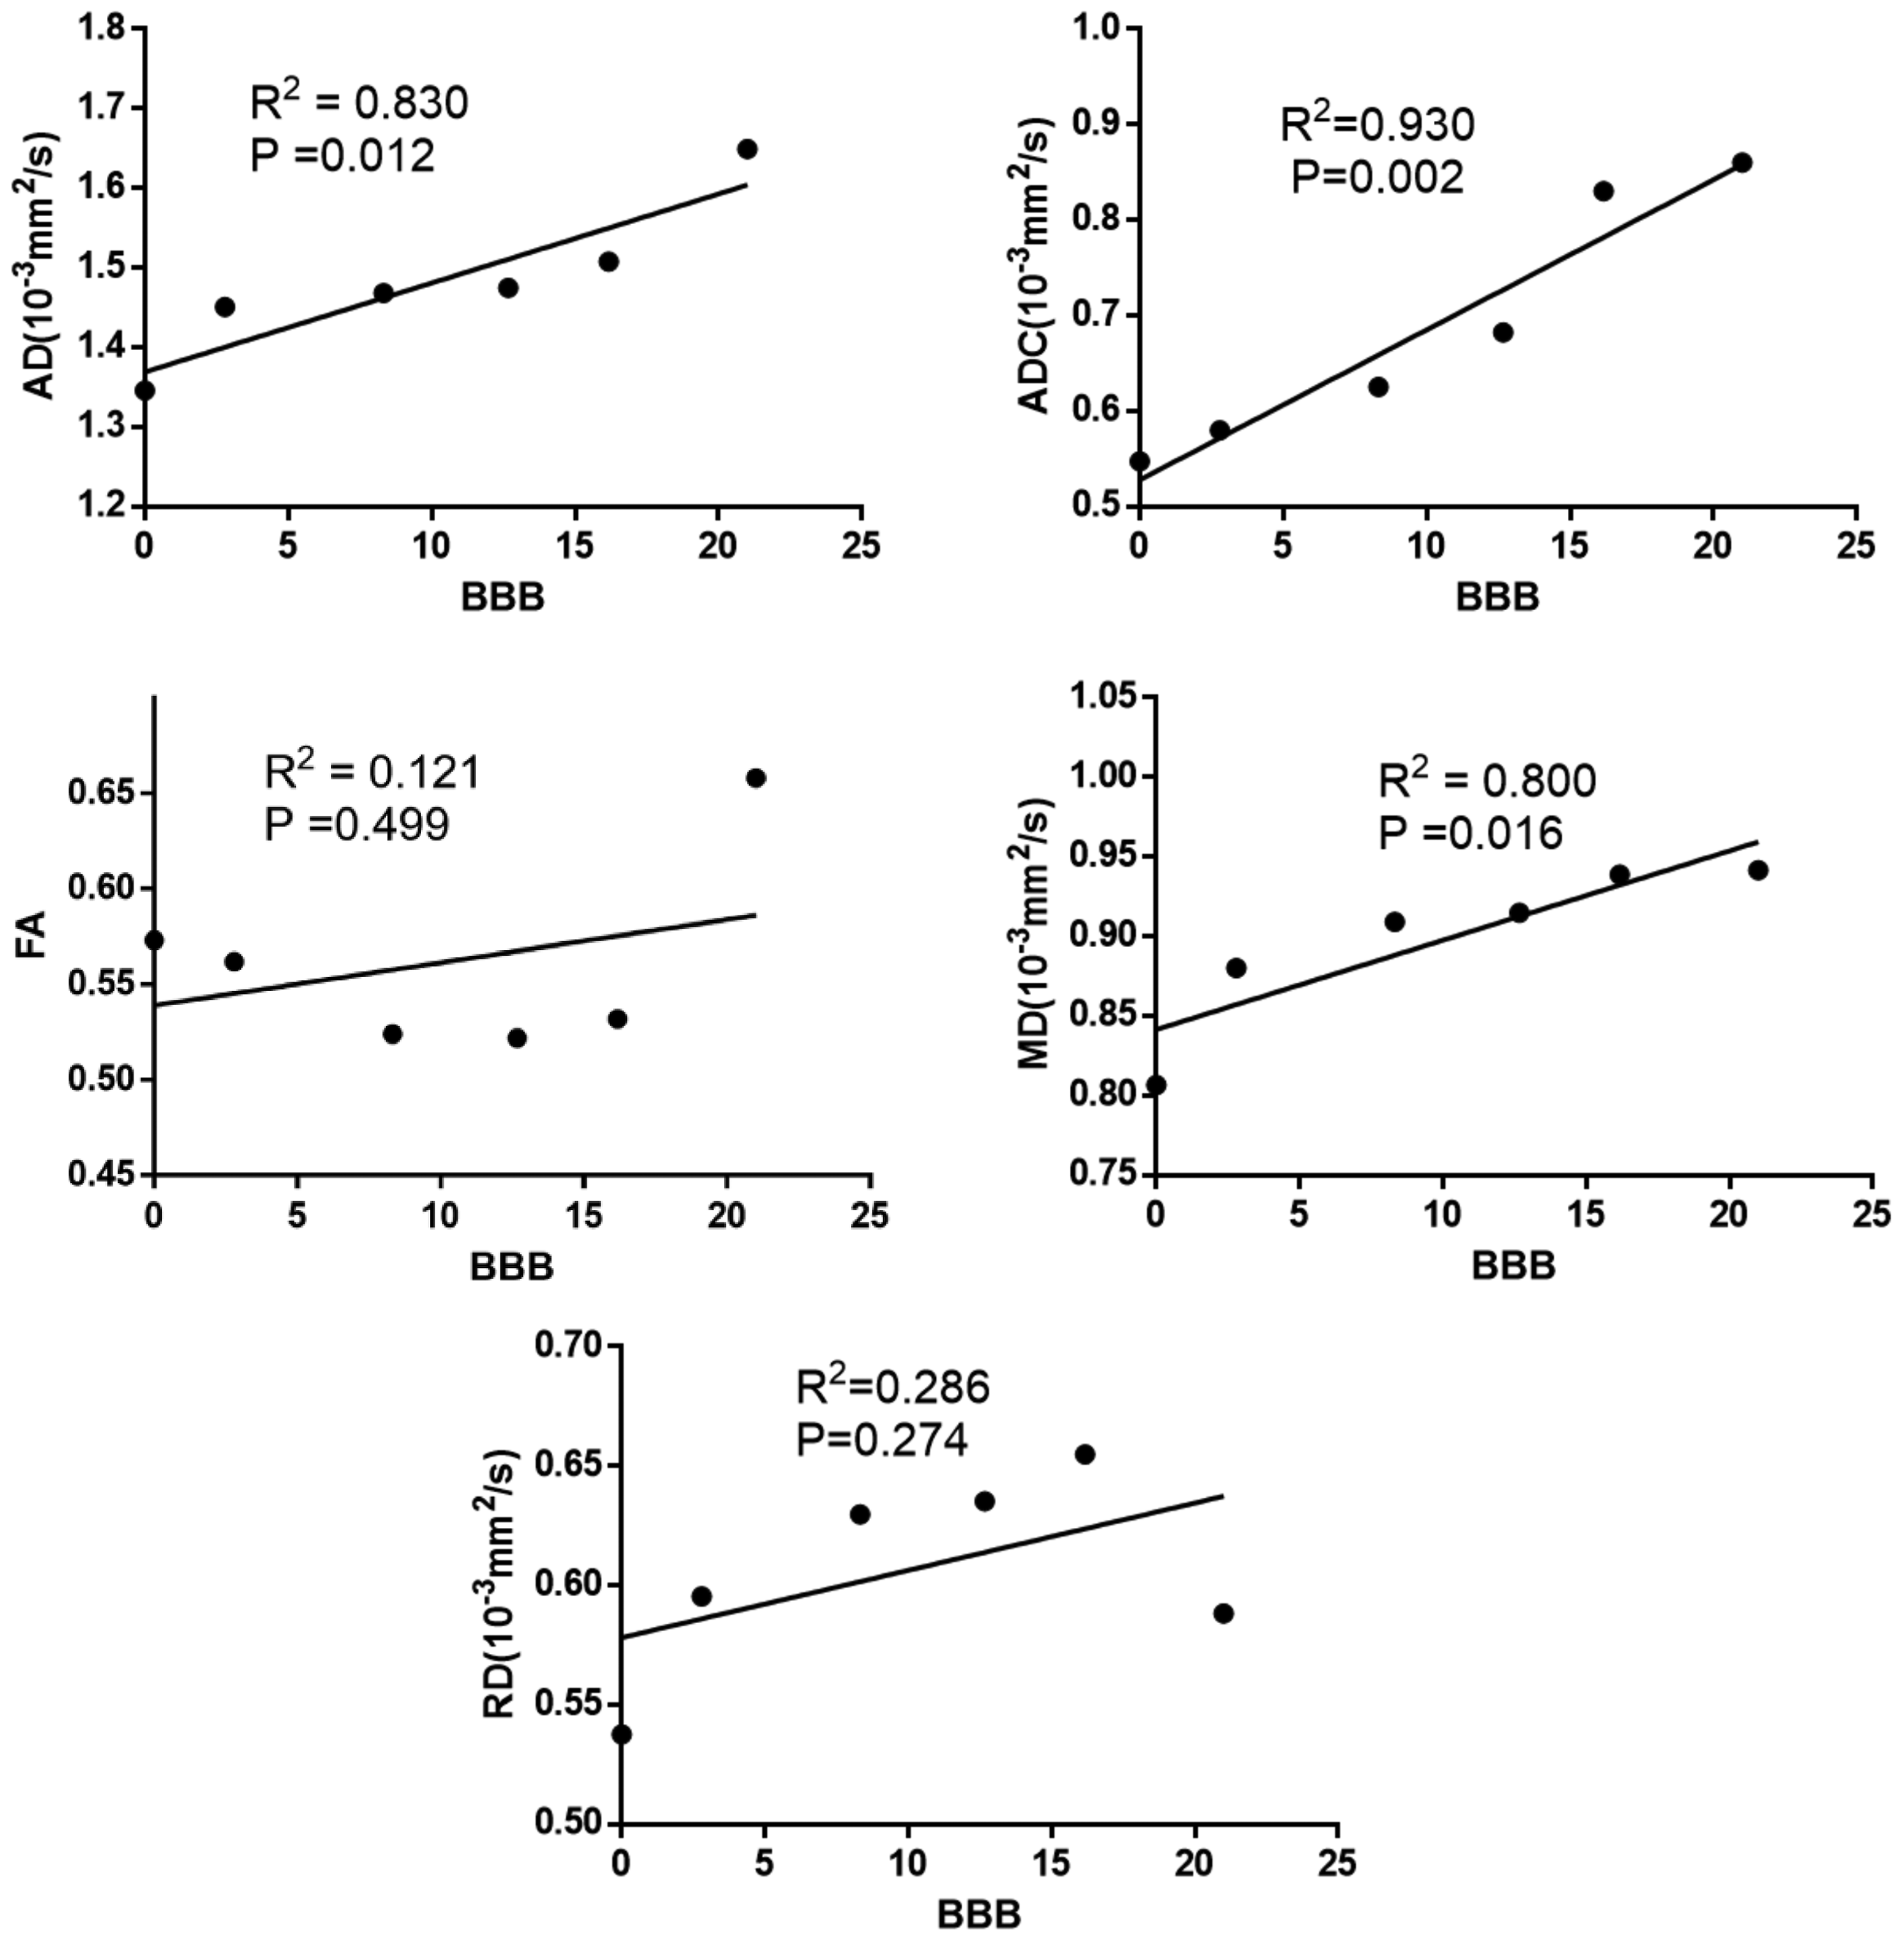
Correlations of diffusion tensor imaging parameters with the behavioral score.
Nissl’s staining findings
Nissl’s bodies, which were dark blue granules, were shown by Nissl’s staining, and the cellular nuclei were light blue. The number of Nissl’s bodies was relatively high in the SCI group; they were evenly distributed in the cytoplasm and the morphology of neurons was normal. Destruction of Nissl’s bodies was found in the groups without myoelotomy, where the number of Nissl’s bodies was lower, the staining was light, and shrinkage of the neuron bodies was present. In the Mye group, fewer Nissl’s bodies were destructed, the number was relatively higher, staining was deep, and the morphology of neurons was better. The number of neurons in the Mye group after the myelotomy was higher than in the SCI group (Fig. 4).
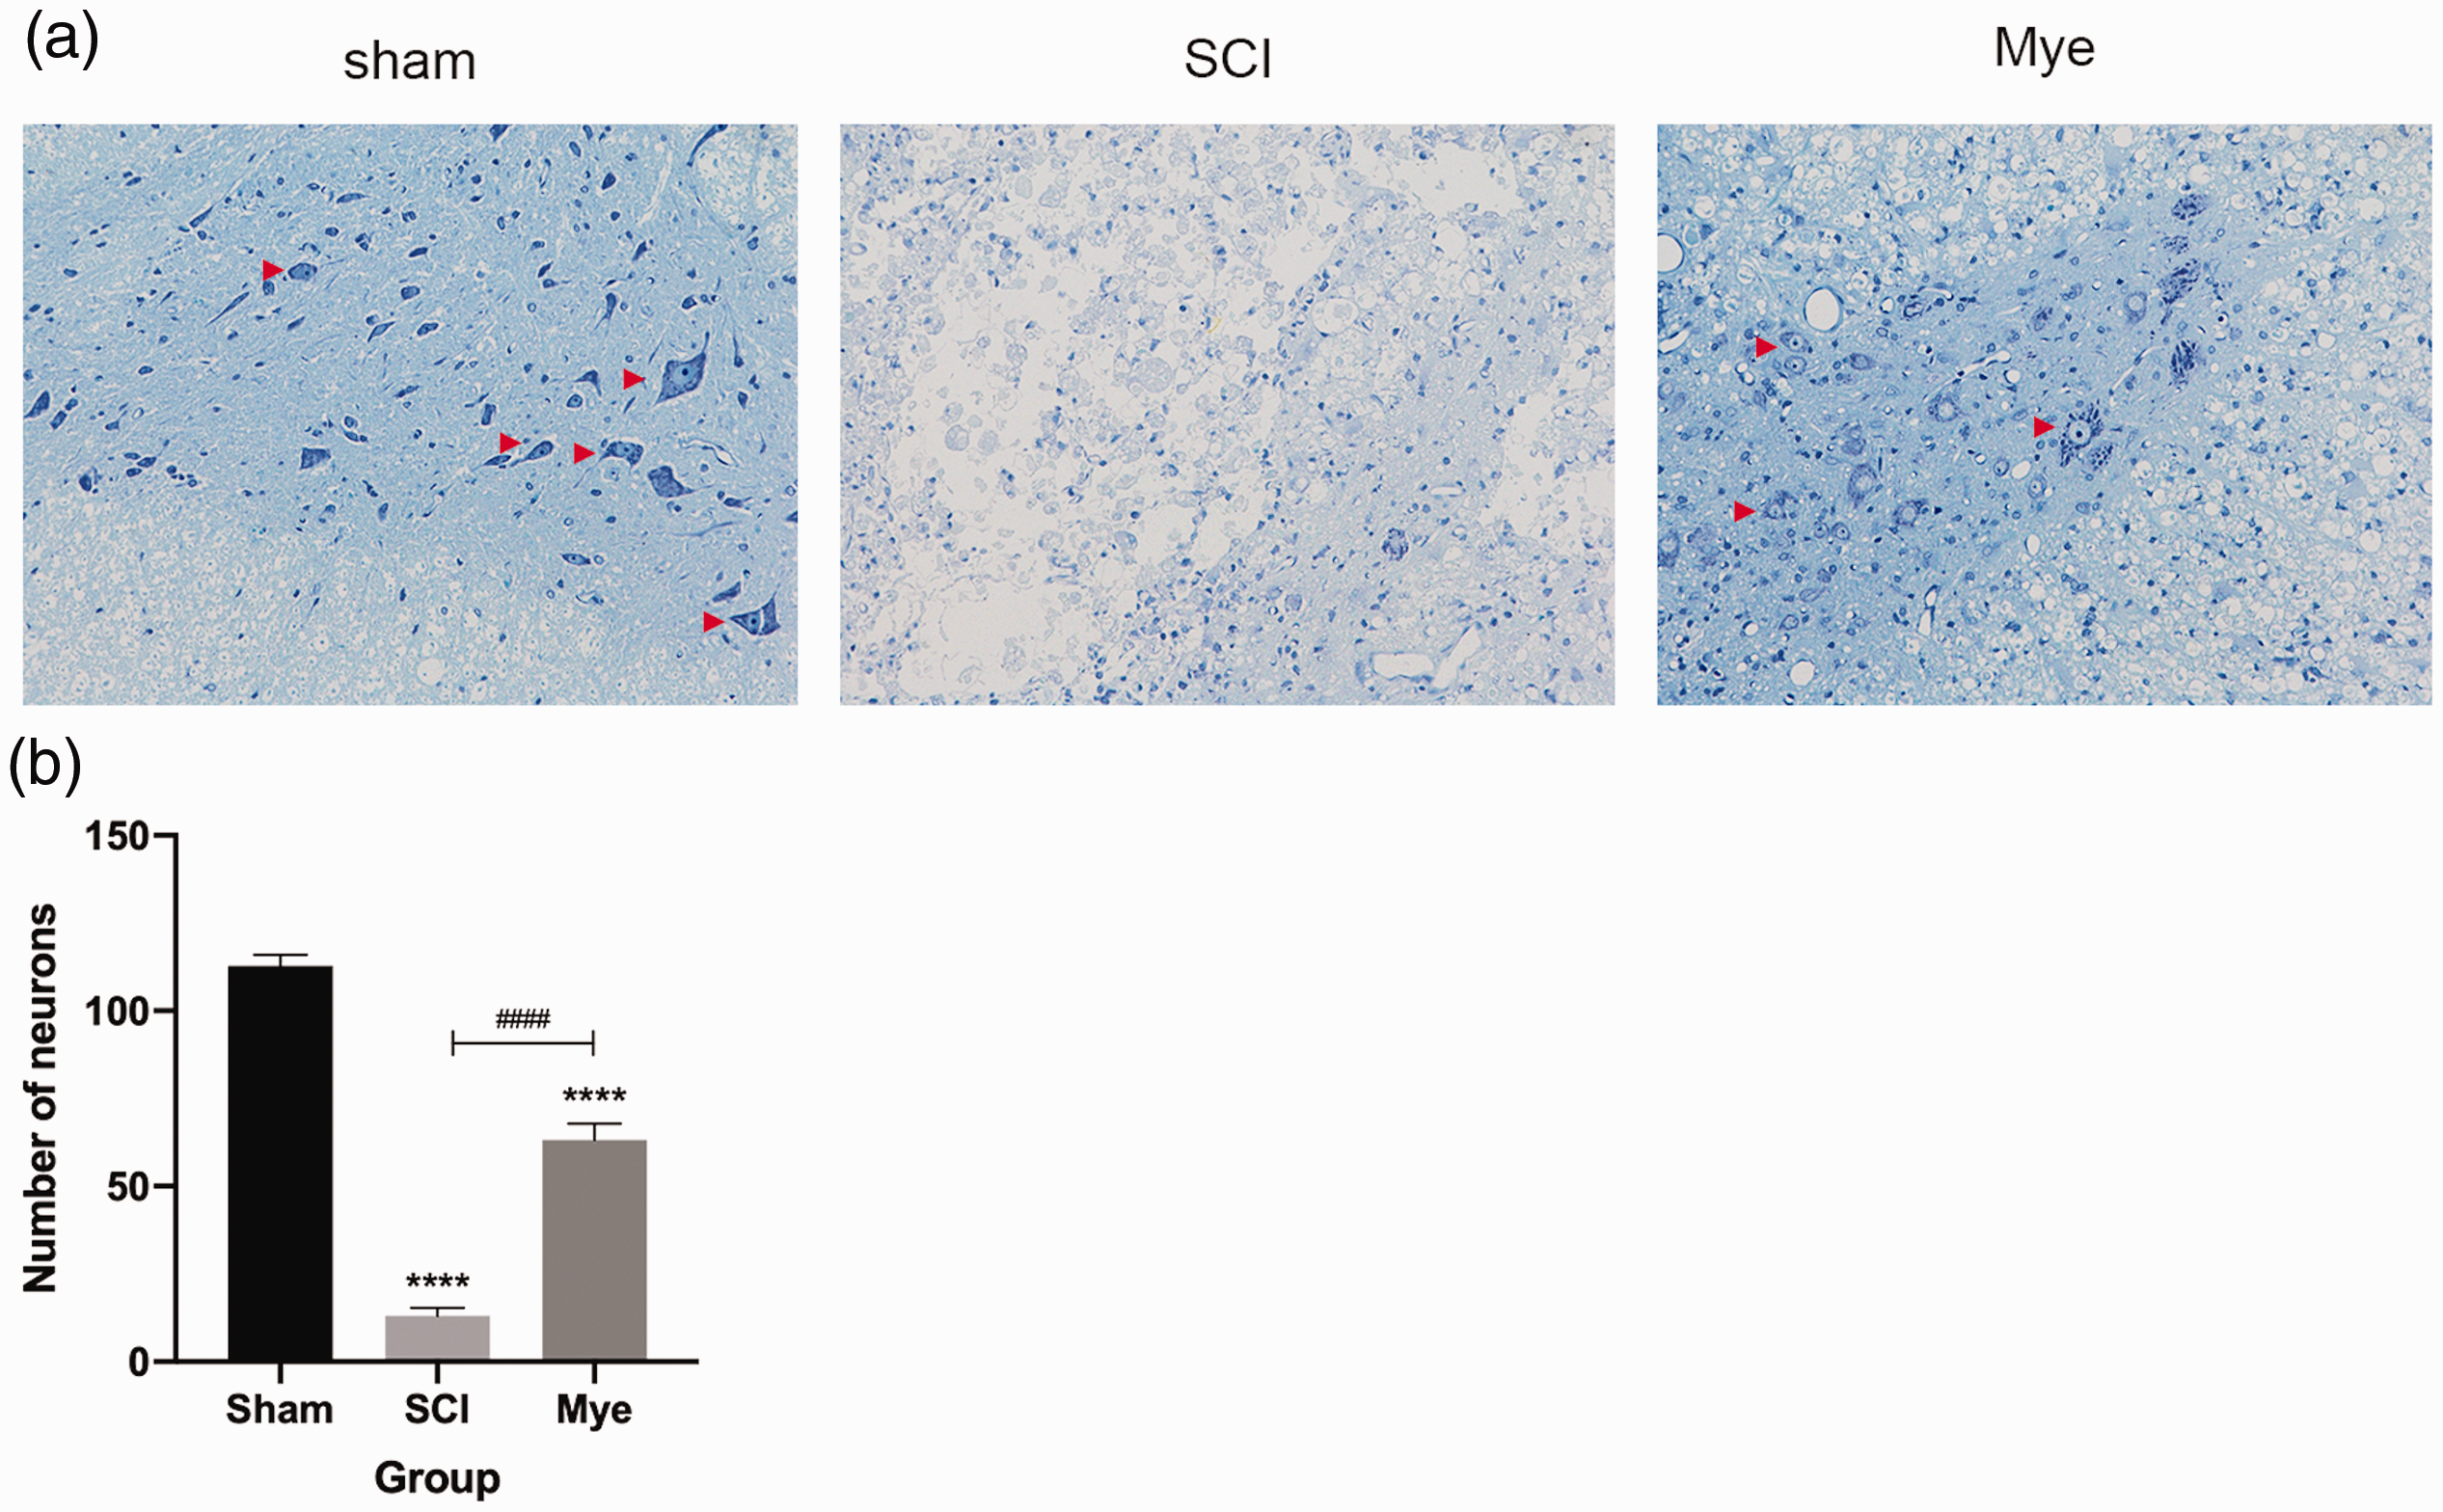
(a) Images of the spinal cord anterior horn of the rats in the Sham, SCI, and Mye groups. The red arrows show the neurons. (b) Comparison of the number of motor neurons in the spinal cord anterior horn of the rats in the Sham, SCI, and Mye groups. The data were analyzed by one-way ANOVA, followed by Tukey’s test. ****P < 0.0001, compared with the Sham group; ####P < 0.0001, compared with the SCI group.
Discussion
Mechanical impacts generally cause acute SCI, and the primary SCI is followed by various pathological changes that can last for several weeks (14). Previous studies have shown that myelotomy could promote the recovery of motor functions in rats with SCI, especially the ones with moderate injuries (15–17). Our results revealed that after myelotomy, the Nissl’s bodies increased in the injury site, which suggested that the metabolic functions of the neurons gradually recovered and the neuron functions were partially recovered.
DTI could be used to quantitatively and qualitatively evaluate the injured tissues. The FA value could reflect the integrity of the axons, with the higher FA values indicating better integrity of axons, and lower FA values indicating more severe injuries of axons (18). Our results showed that the FA value decreased after SCI, thus suggesting that the axons were injured after the SCI. Also, the FA value was higher in the Mye group than in SCI group, which suggested that the integrity of axons was better in the Mye group than the SCI group. These findings demonstrated that myelotomy could protect the axons, as well as help the recovery of axons.
ADC value reflects the intensity of diffusivity, our findings showed that the ADC value decreased after the SCI, and then gradually increased. Edema, including intracellular and extracellular edema, was evident after the injury, and the diffusion of water molecules, which was displayed as decreased ADC value, was chaotic. In the later phase, the edema was absorbed, and the diffusion directions were more consistent, resulting in the increased ADC value (12). The recovery of ADC value in the Mye group was significantly better than in the SCI group, which suggested that after myelotomy, the edema of the Mye group disappeared faster than the SCI group.
The BBB score of HL motility during walking has become a universal measure of functionality following the induction and treatment of spinal cord injury in rats (11). In this study, the BBB scores showed that the HL functions of the rats in the Mye group were significantly better than in the SCI group at one day, three days, one week, two weeks, and three weeks after the SCI, thus suggesting that the myelotomy had a protective effect on the recovery of motor functions. The major effects after the injury were manifested by the dynamic changes of the FA, ADC, AD, MD, and RD values. The findings on the dynamic changes of the parameters in the spinal cord were similar to the previously reported results (13,19).
The behavioral scores of the rats decreased after the SCI, while the recovery of the nerve functions in rats from different groups varied. The recovery of the rats in the Mye group was faster than in the SCI group, thus suggesting that myelotomy improved the nerve functions of the rats (20). The correlation analysis showed that the correlation between the ADC value and nerve functions was higher than the correlation between the FA value and nerve functions, therefore suggesting that ADC value could be used to predict the nerve functions after SCI (21).
Nissl’s body could indirectly reflect the physiological functions and structures of neurons. Upon the over-stimulation of neurons, Nissl’s body could shrink or disappear (22). After the lesions disappear, Nissl’s body could concurrently restore the synthesis of proteins and cellular metabolism. Therefore, Nissl’s body could be used to indicate the status of neurons (23). The findings of this study showed that after myelotomy, the staining of Nissl’s body increased at the injury site, which suggested that the metabolism of neurons was gradually recovering and that neurons functions were partially restored.
The present study has some limitations. First, we used a model that induces only contusion and does not incorporate hemisection, transection, and segment resection. Future study with the contusion plus compression model will be performed to confirm the effect of myelotomy in the treatment of SCI. Second, the spatial resolution remains inadequate and it is difficult to visualize the individual funiculi on diffusion-weighted images, particularly in the lower thoracic cord. DTI of these segments is affected more by artifacts arising from cardiac and respiratory motion as well as cerebrospinal fluid pulsation (24).
In conclusion, the findings of the present study showed that the DTI parameters, especially ADC values, could non-invasively and quantifiably evaluate the efficacy of myelotomy for rats with SCI. DTI technology might accelerate breakthroughs in this field. In clinical practice, it might change therapeutic strategy of spinal cord injury.
Footnotes
Acknowledgements
The authors acknowledge the help of all the co-workers.
Declaration of conflicting interests
The author(s) declared no potential conflicts of interest with respect to the research, authorship, and/or publication of this article.
Funding
The author(s) received the following financial support for the research, authorship, and/or publication of this article: This work was supported by a grant from the National Key R&D Program of China (2018YFF0301104), the National Natural Science Foundation of China (General Program 81870979), the Special Fund for Basic Scientific Research of Central Public Research Institutes (2018CZ-1; 2019CZ-1), the Basic Scientific Research Foundation of China Rehabilitation Research Center (2018ZX-30), the Beijing Municipal Science and Technology Commission (Z181100004118004; Z171100001017076), and the Beijing Science and Technology Major Project (D161100002816004).