
Abstract
Background
Apart from the immunohistochemical Ki-67 labeling index (LI), clinicians need a non-invasive and convenient way to predict the prognosis of patients with soft-tissue sarcoma (STS).
Purpose
To investigate the correlation between quantitative parameters of contrast-enhanced ultrasound (CEUS) and Ki-67 LI in STS.
Material and Methods
A total of 25 patients diagnosed with STS who underwent CEUS examination using SonoVue®, between January 2019 to November 2020, were included in the study. They were then divided into a high-proliferation group and low-proliferation group according to 30% Ki-67 positive tumor cells. The quantitative parameters in the semi-automatic time intensity curve analysis software, including arrival time, time to peak, peak intensity, rise time (RT), rise slope, 50% wash-out time, and 50% wash-out intensity, were extracted from the time intensity curve of CEUS by two independent observers. Statistical evaluation of the correlation and difference between CEUS quantitative parameters and Ki-67 LI between the two groups was performed. According to the area under the curve (AUC) analysis, optimal cutoff points of parameters with significant difference were determined.
Results
CEUS RT of the high-proliferation group in STS was significantly higher than that of the low-proliferation group (ρ = 0.509, P = 0.01). The most reasonable cutoff to distinguish between low- and high-proliferation groups was 10.84 s. The sensitivity, specificity, and the AUC were 86.7%, 80%, and 0.80, respectively.
Conclusion
CEUS RT was correlated with Ki-67 LI of STS, which can be used as a minimally invasive auxiliary tool to predict the prognosis of STS in clinical practice.
Introduction
Soft-tissue sarcoma (STS) is a rare tumor originated from mesenchymal tissue, accounting for 1% of adult malignant tumors and 7%–15% of children malignant tumors (1,2). Unfortunately, the prognosis of STS is generally poor and prone to recurrence and metastasis. Clinicians often need to predict the prognosis and cure opportunity of a particular patient, which has an important impact on the follow-up treatment and the quality of life of patients (3).
Ki-67 labeling index (LI), an indicator of cell proliferation, has been considered an important independent prognostic factor of STS (4,5). Although the current literature does not clearly point out that Ki-67 LI will affect the decision-making of neoadjuvant or adjuvant therapy, the treatment of STS is affected by tumor stage. Because of its objectivity and repeatability, Ki-67 LI has gradually replaced the original mitotic count in some new grading systems of STS (6,7). In previous studies, it is generally believed that when Ki-67 LI exceeds 30%, STS has strong proliferative ability and poor prognosis (8,9). However, the evaluation of Ki-67 LI requires pathological examination, which means a certain time interval and trauma. In order to evaluate the proliferation ability of STS conveniently and non-invasively and assist clinicians in making more accurate prognosis prediction, an increasing number of researchers pay attention to the correlation between imaging examination and Ki-67 LI.
Contrast-enhanced ultrasound (CEUS) can display the tumor microvessel in real time with almost no side effects and a wide range of applications (10,11). The relationship between tumor microvascular angiogenesis regulated by vascular endothelial growth factor (VEGF) and Ki-67 LI has been confirmed in previous research (12). In addition, it has been found that CEUS hemodynamic parameters are related to the expression of Ki-67 LI in breast cancer and neuroendocrine tumors (13–15). The aim of the present study was to investigate the correlation between quantitative CEUS parameters and Ki-67 LI in STS.
Material and Methods
This study was a retrospective study approved by the medical ethics committee and was exempted from informed consent.
Patients
From January 2019 to November 2020, a total of 53 patients with suspected soft-tissue masses of musculoskeletal system underwent CEUS in our hospital. The exclusion criteria were as follows: (i) no pathological diagnosis (n = 19); (ii) treatment history of STS (n = 2); (iii) no quantitative Ki-67 LI (n = 5); and (iv) no quantitative CEUS parameters (n = 2). Finally, 25 lesions were screened into this study.
CEUS
Standardized ultrasound examinations, including conventional ultrasound (gray-scale ultrasound, color, and spectral Doppler ultrasound) and CEUS, were performed by two ultrasound doctors with >10 years of experience at our institution. The patients were in the right position and the masses were fully exposed. CEUS was examined by Logiq E9 (GE Healthcare, Milwaukee, WI, USA) US 54 machine with C1-6VN convex array probe (2–6 MHz) and 9L linear array probe (5–9 MHz), including 19 tumors with convex array probe and four tumors with linear array probe. The maximum diameter and location of the masses (superficial fascia or deep fascia) were determined on the gray-scale ultrasound. SonoVue® contrast agent (Bracco, Milan, Italy) was used for CEUS with a standard mechanical index of 0.1. Two milliliters of contrast medium were injected through the anterior cubital vein in a bolus way and timing was started. Then, 5 mL of saline were injected. Each tumor was observed on the single section with the most blood flow signal in color Doppler flow imaging for 2 min.
Data acquisition
Two ultrasound doctors with >5 years of experience in the musculoskeletal system independently performed CEUS qualitative and quantitative analysis of STS without any knowledge of the patients.
First, the CEUS perfusion mode of STS was qualitatively analyzed by the two observers according to the shape and distribution of blood vessels detected by CEUS (16) (Fig. 1): P1 = no enhancement in the lesion; P2 = only peripheral enhancement; P3 = scattered strip enhancement; P4 = fine striated enhancement; P5 = uneven enhancement of the whole lesion, accompanied by flaky non perfusion area; and P6 = homogeneous high enhancement in the whole lesion.
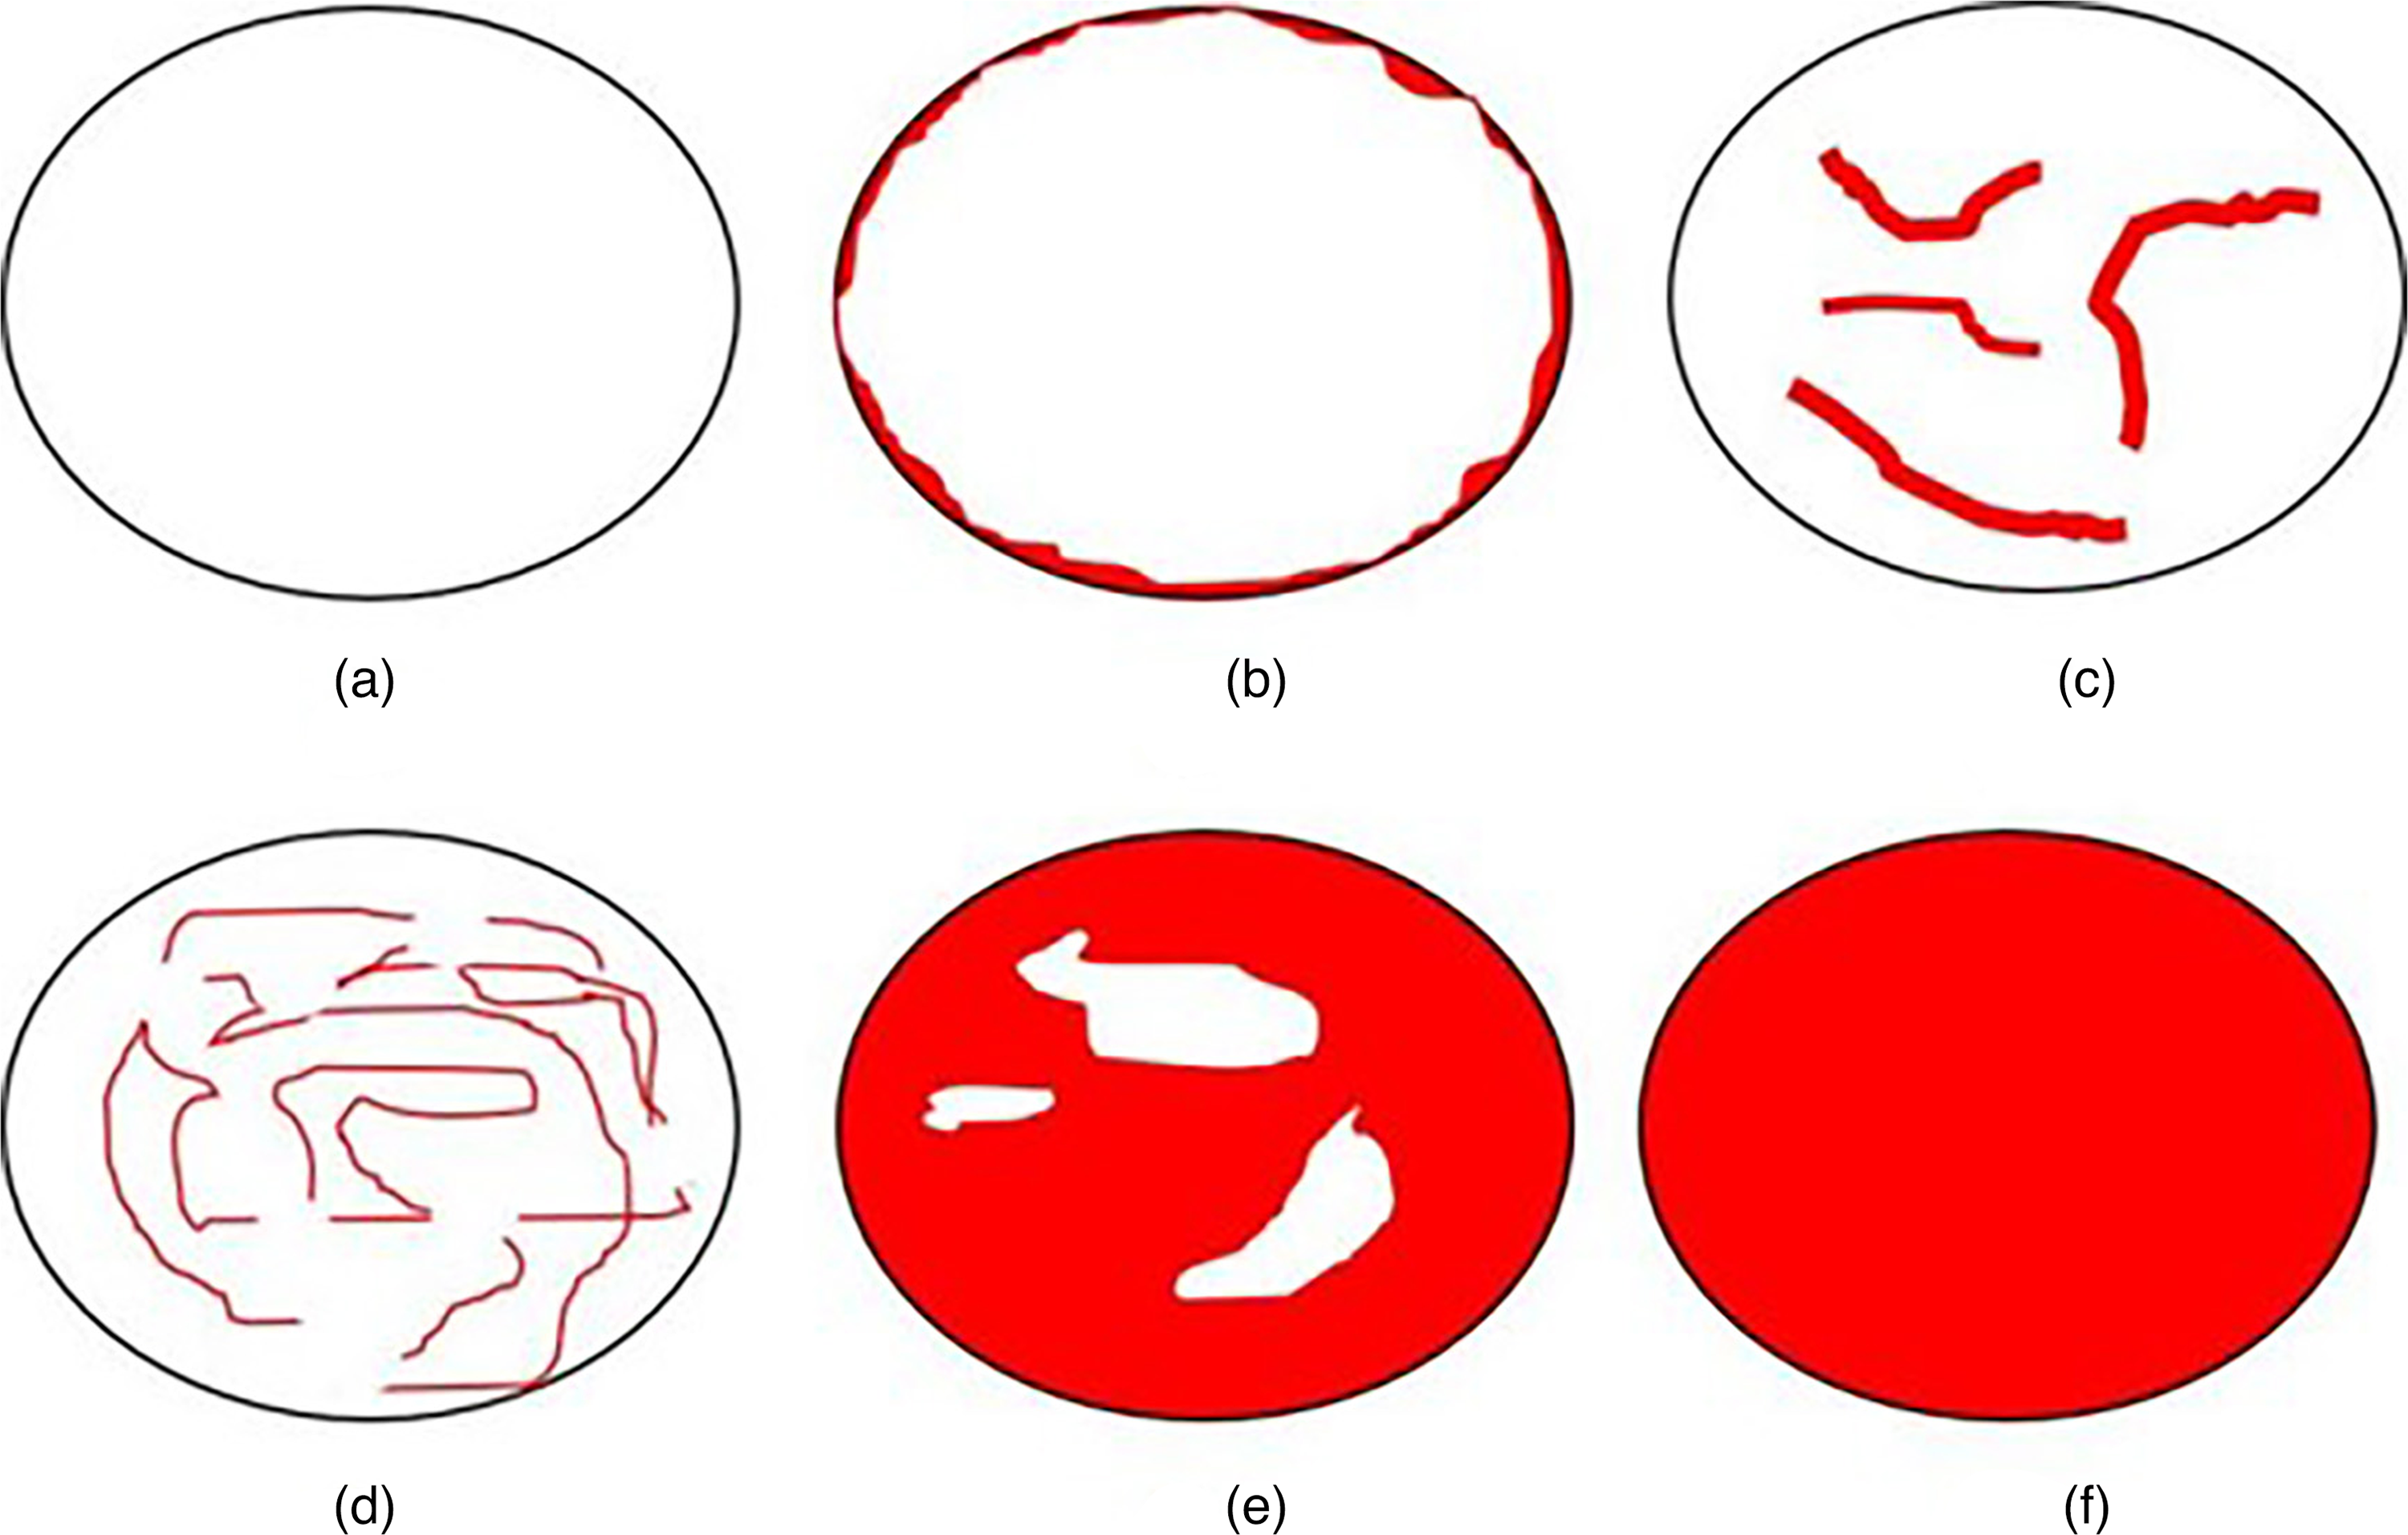
Schematic diagram of six perfusion patterns of contrast-enhanced ultrasound (a–f: P1–P6).
In order to obtain quantitative parameters, the two observers analyzed the region of interest (ROI) using the semi-automatic time intensity curve (TIC) analysis software of GE-Logiq-E9 ultrasound diagnostic instrument. The ROI included the perfusion area of contrast medium as far as possible but avoided covering the lesion boundary, and then TIC was obtained. The following parameters in the curve were recorded and calculated (Fig. 2): arrival time (AT); time to peak (TTP); peak intensity (PI); arrival intensity (AI); rise time (RT); rise slope (RS); 50% wash-out time; and 50% wash-out intensity. The data used in the final analysis were the average of the measurements of the two observers. In addition, RT = TTP–AT and RS = (PI–AI)/RT. All quantitative analyses were carried out directly on the ultrasound machine.
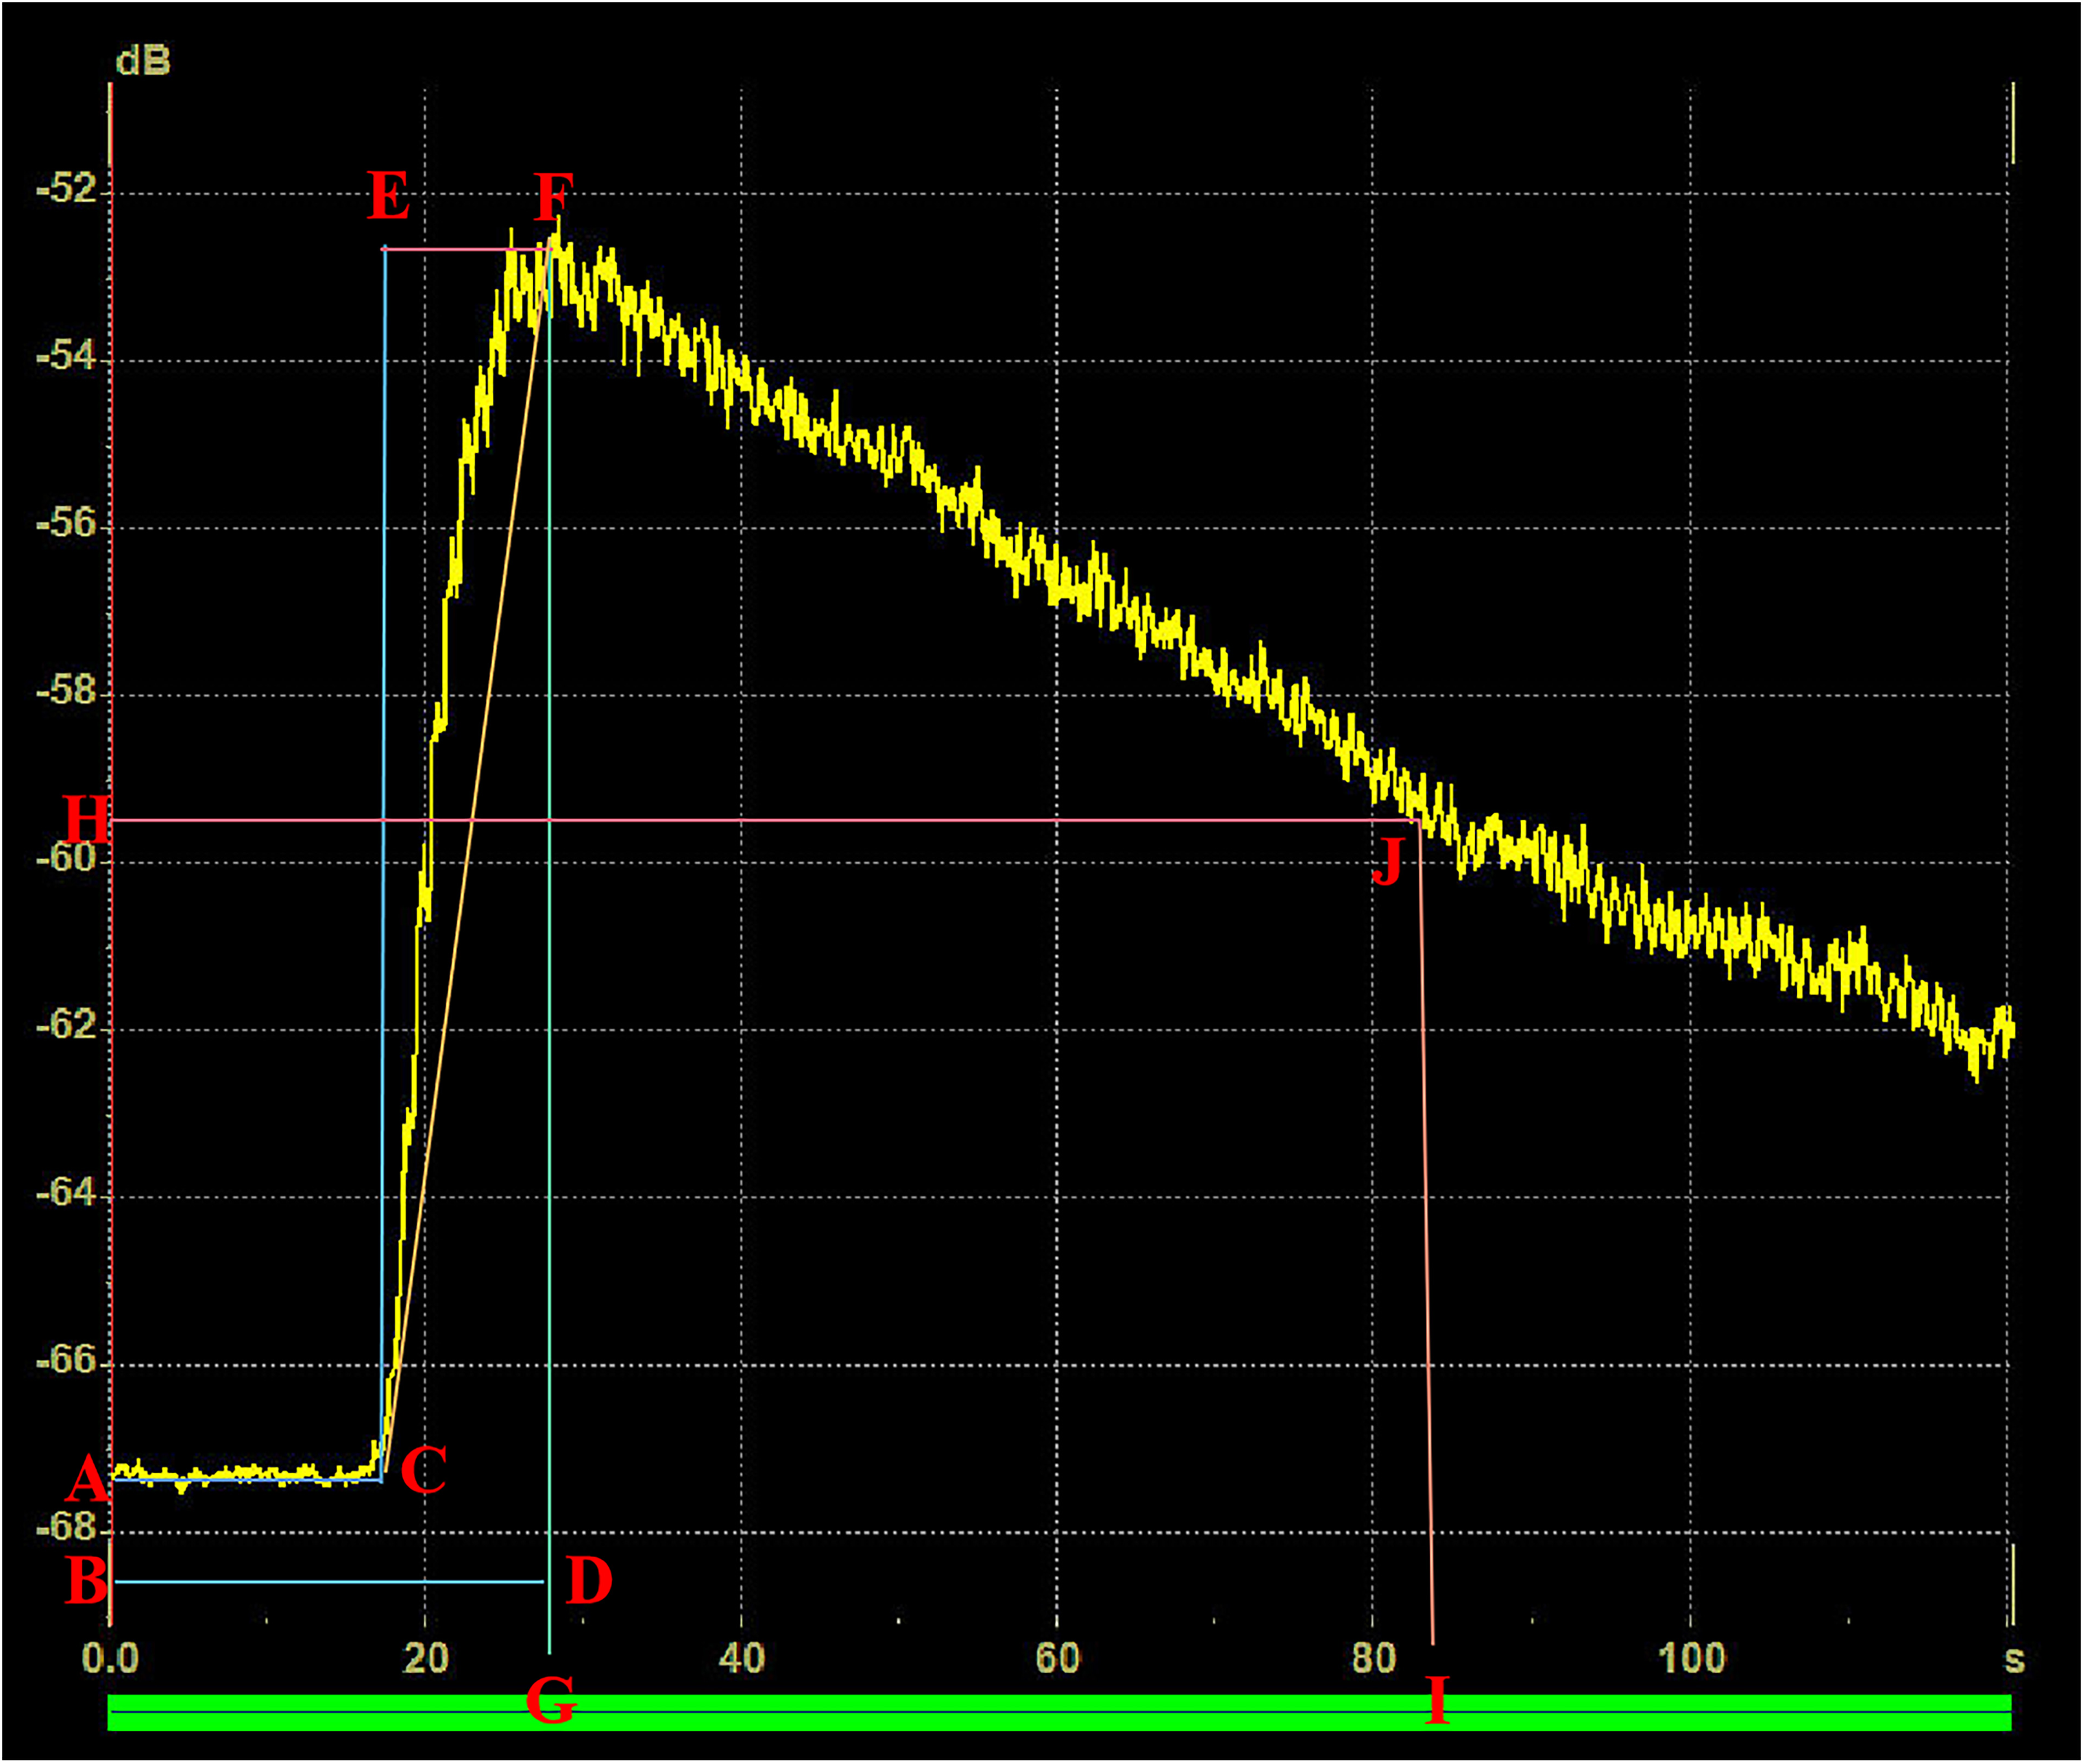
Schematic diagram of a typical TIC curve and quantitative parameters: (a–c) arrival time; (b–d) time to peak; (f, g) peak intensity; (e, f) rise time; (c, e, f) rise slope; (h, j) 50% wash-out time; (i, j) 50% wash-out intensity). TIC, time intensity curve.
Pathology and immunohistochemistry
Formalin-fixed and paraffin-embedded specimens were stained with hematoxylin and eosin. Ki-67 antibody (1:200, Dako) was used for immunohistochemical analysis. An experienced sarcoma pathologist reviewed the immunohistochemical (IHC) staining of pathological sections. Ki-67 LI depended on the percentage of Ki-67 positive tumor cells. Subsequently, the included lesions were divided into two groups (8): if the nuclear staining of tumor cells was >30%, the STS belongs to the high-proliferation group; otherwise, it was in the low-proliferation group.
Statistical analysis
The correlation between CEUS quantitative parameters of STS and Ki-67 LI was evaluated by Spearman’s correlation analysis as follows: 0–0.2 = no correlation or very weak correlation; 0.2–0.4 = low correlation; 0.4–0.6 = medium correlation; 0.6–0.8 = high correlation; and 0.8–1 = very strong correlation. When it came to the difference analysis between high- and low-proliferation group, Student’s t-test or Wilcoxon rank sum test were used for continuous and ordered categorical variables; chi-square test or Fisher’s precision probability test were used for categorical variables. Then, receiver operating characteristic (ROC) curve and area under the curve (AUC) were calculated for parameters with significant differences. The maximum Youden index (sensitivity + specificity–1) was used to estimate the optimal cutoff point. Observer consistency was assessed by intraclass correlation coefficient (ICC) as follows: 0–0.4 = poor consistency; 0.4–0.6 = average consistency; 0.6–0.75 = good consistency; and 0.75–1 = excellent consistency (17). All statistical analyses were performed using SPSS version 25 (IBM Corp., Armonk, NY, YSA). P < 0.05 was considered to be statistically significant.
Results
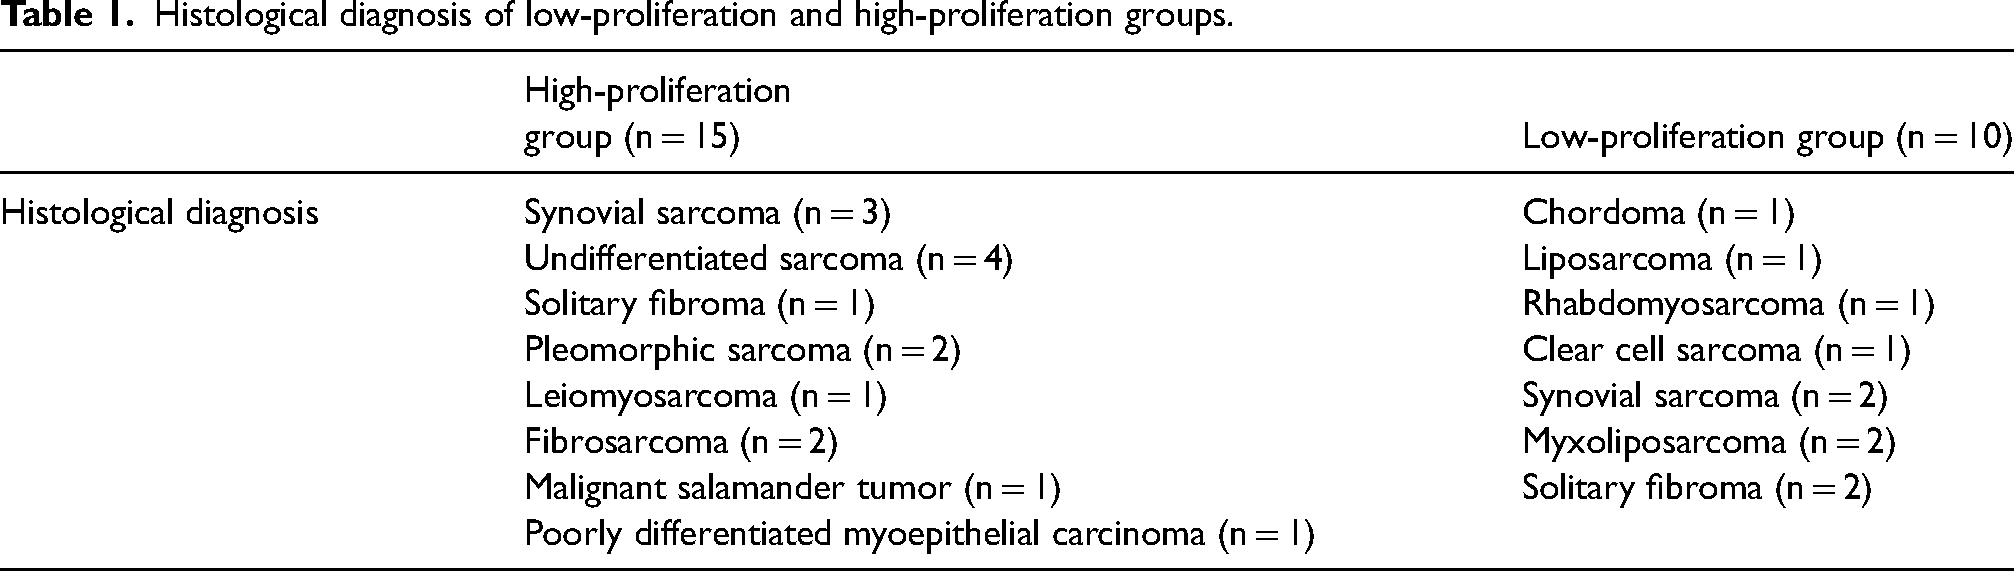
The average age of 25 patients was 59.2 years (range = 35–82 years), which included one patient in the head and neck area, 20 in limbs, and four in the trunk. The Ki-67 LI was in the range of 2%–80% (Fig. 3). There were 15 patients in the high-proliferation group and 10 in the low-proliferation group (Table 1). The mean value of the maximum diameter was 101.87 ± 44.00 mm in the high-proliferation group and 80.60 ± 38.05 mm in the low-proliferation group. The interval between CEUS and immunohistochemistry was 2–35 days (mean = 18.5 days).
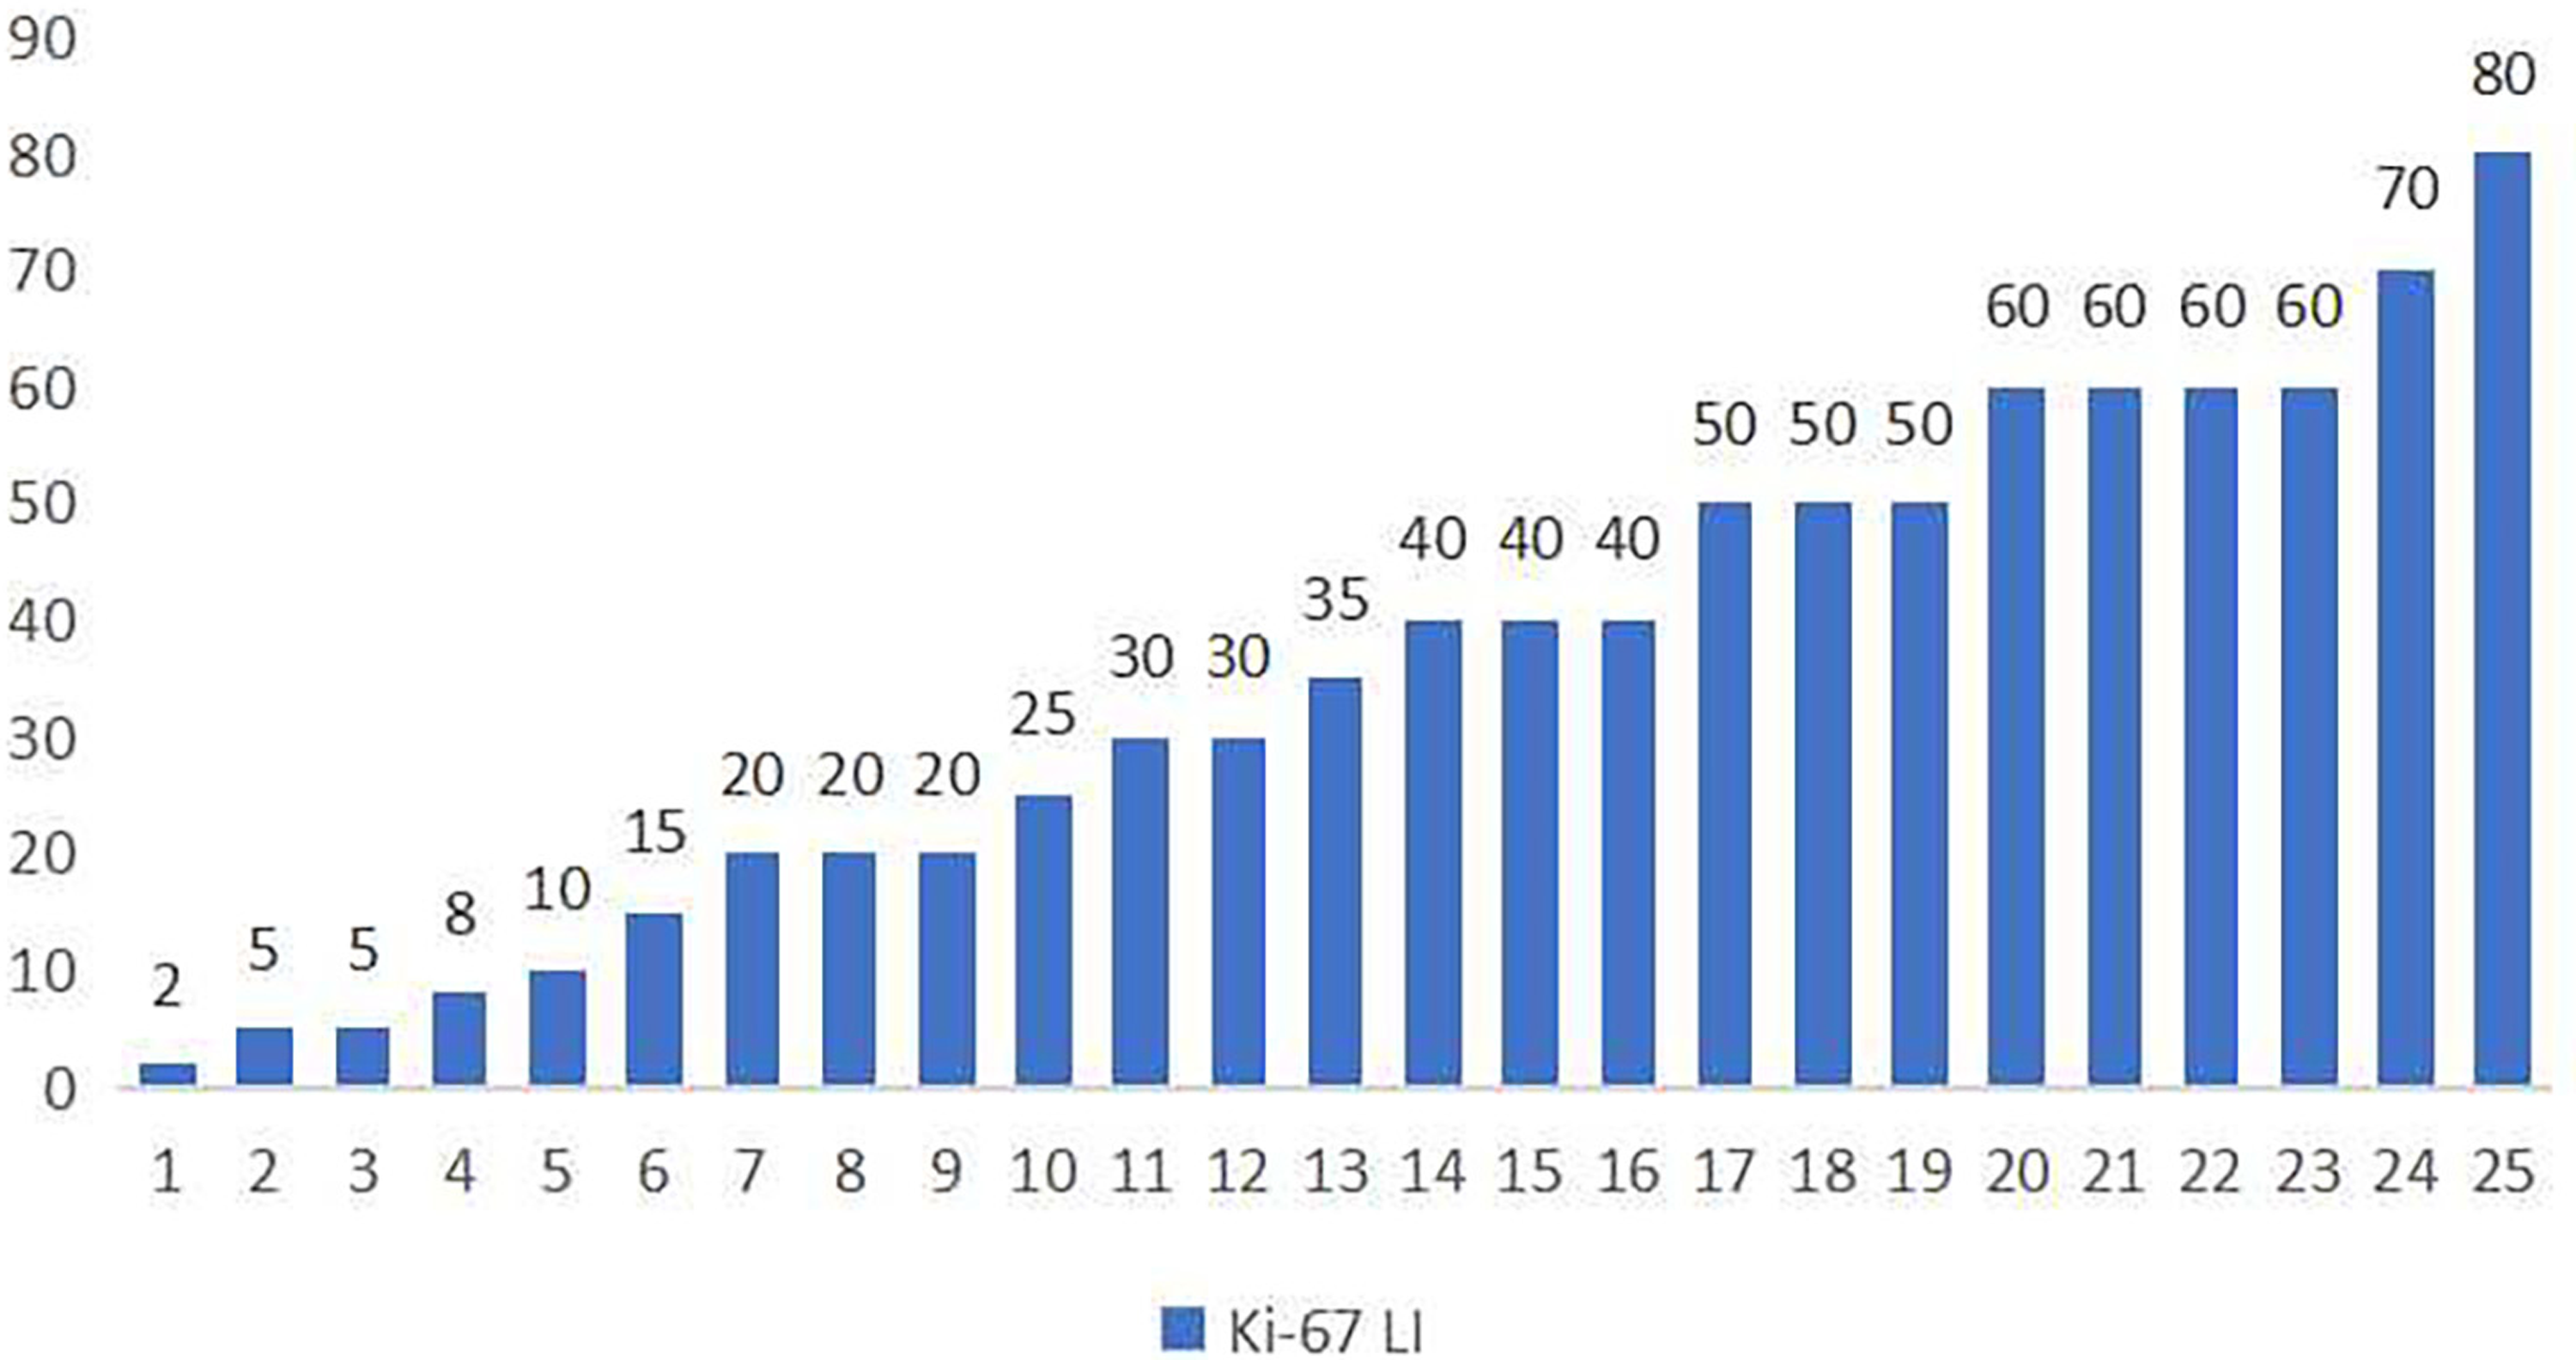
Distribution of Ki-67 LI. LI, labeling index.
Histological diagnosis of low-proliferation and high-proliferation groups.
In the qualitative analysis of this study, the CEUS perfusion pattern of STS was mainly P5 (n = 16/25). The statistical results showed that there was no significant correlation between CEUS perfusion pattern and Ki-67 LI (P = 0.683). In the quantitative analysis, the results revealed a moderate positive correlation between CEUS RT and STS proliferation level (high/low) with a correlation coefficient of 0.50 (P = 0.01) (Table 2). In addition, there was a significant difference in RT between the two groups (P = 0.012). According to the AUC, the most suitable cutoff point was 10.84 s. The sensitivity and specificity of CEUS RT were 86.7% and 80.0%, respectively. The AUC was 0.797 (P = 0.014) (Fig. 4). In addition, the 50% wash-out time of STS showed a correlation (ρ = 0.374) between the two groups, almost reaching statistical significance (P = 0.07). However, AT, TP, PI, RS, and 50% wash-out intensity had no significant correlation with STS proliferation ability between the two groups. ICC showed excellent consistency among two observers (Table 3).
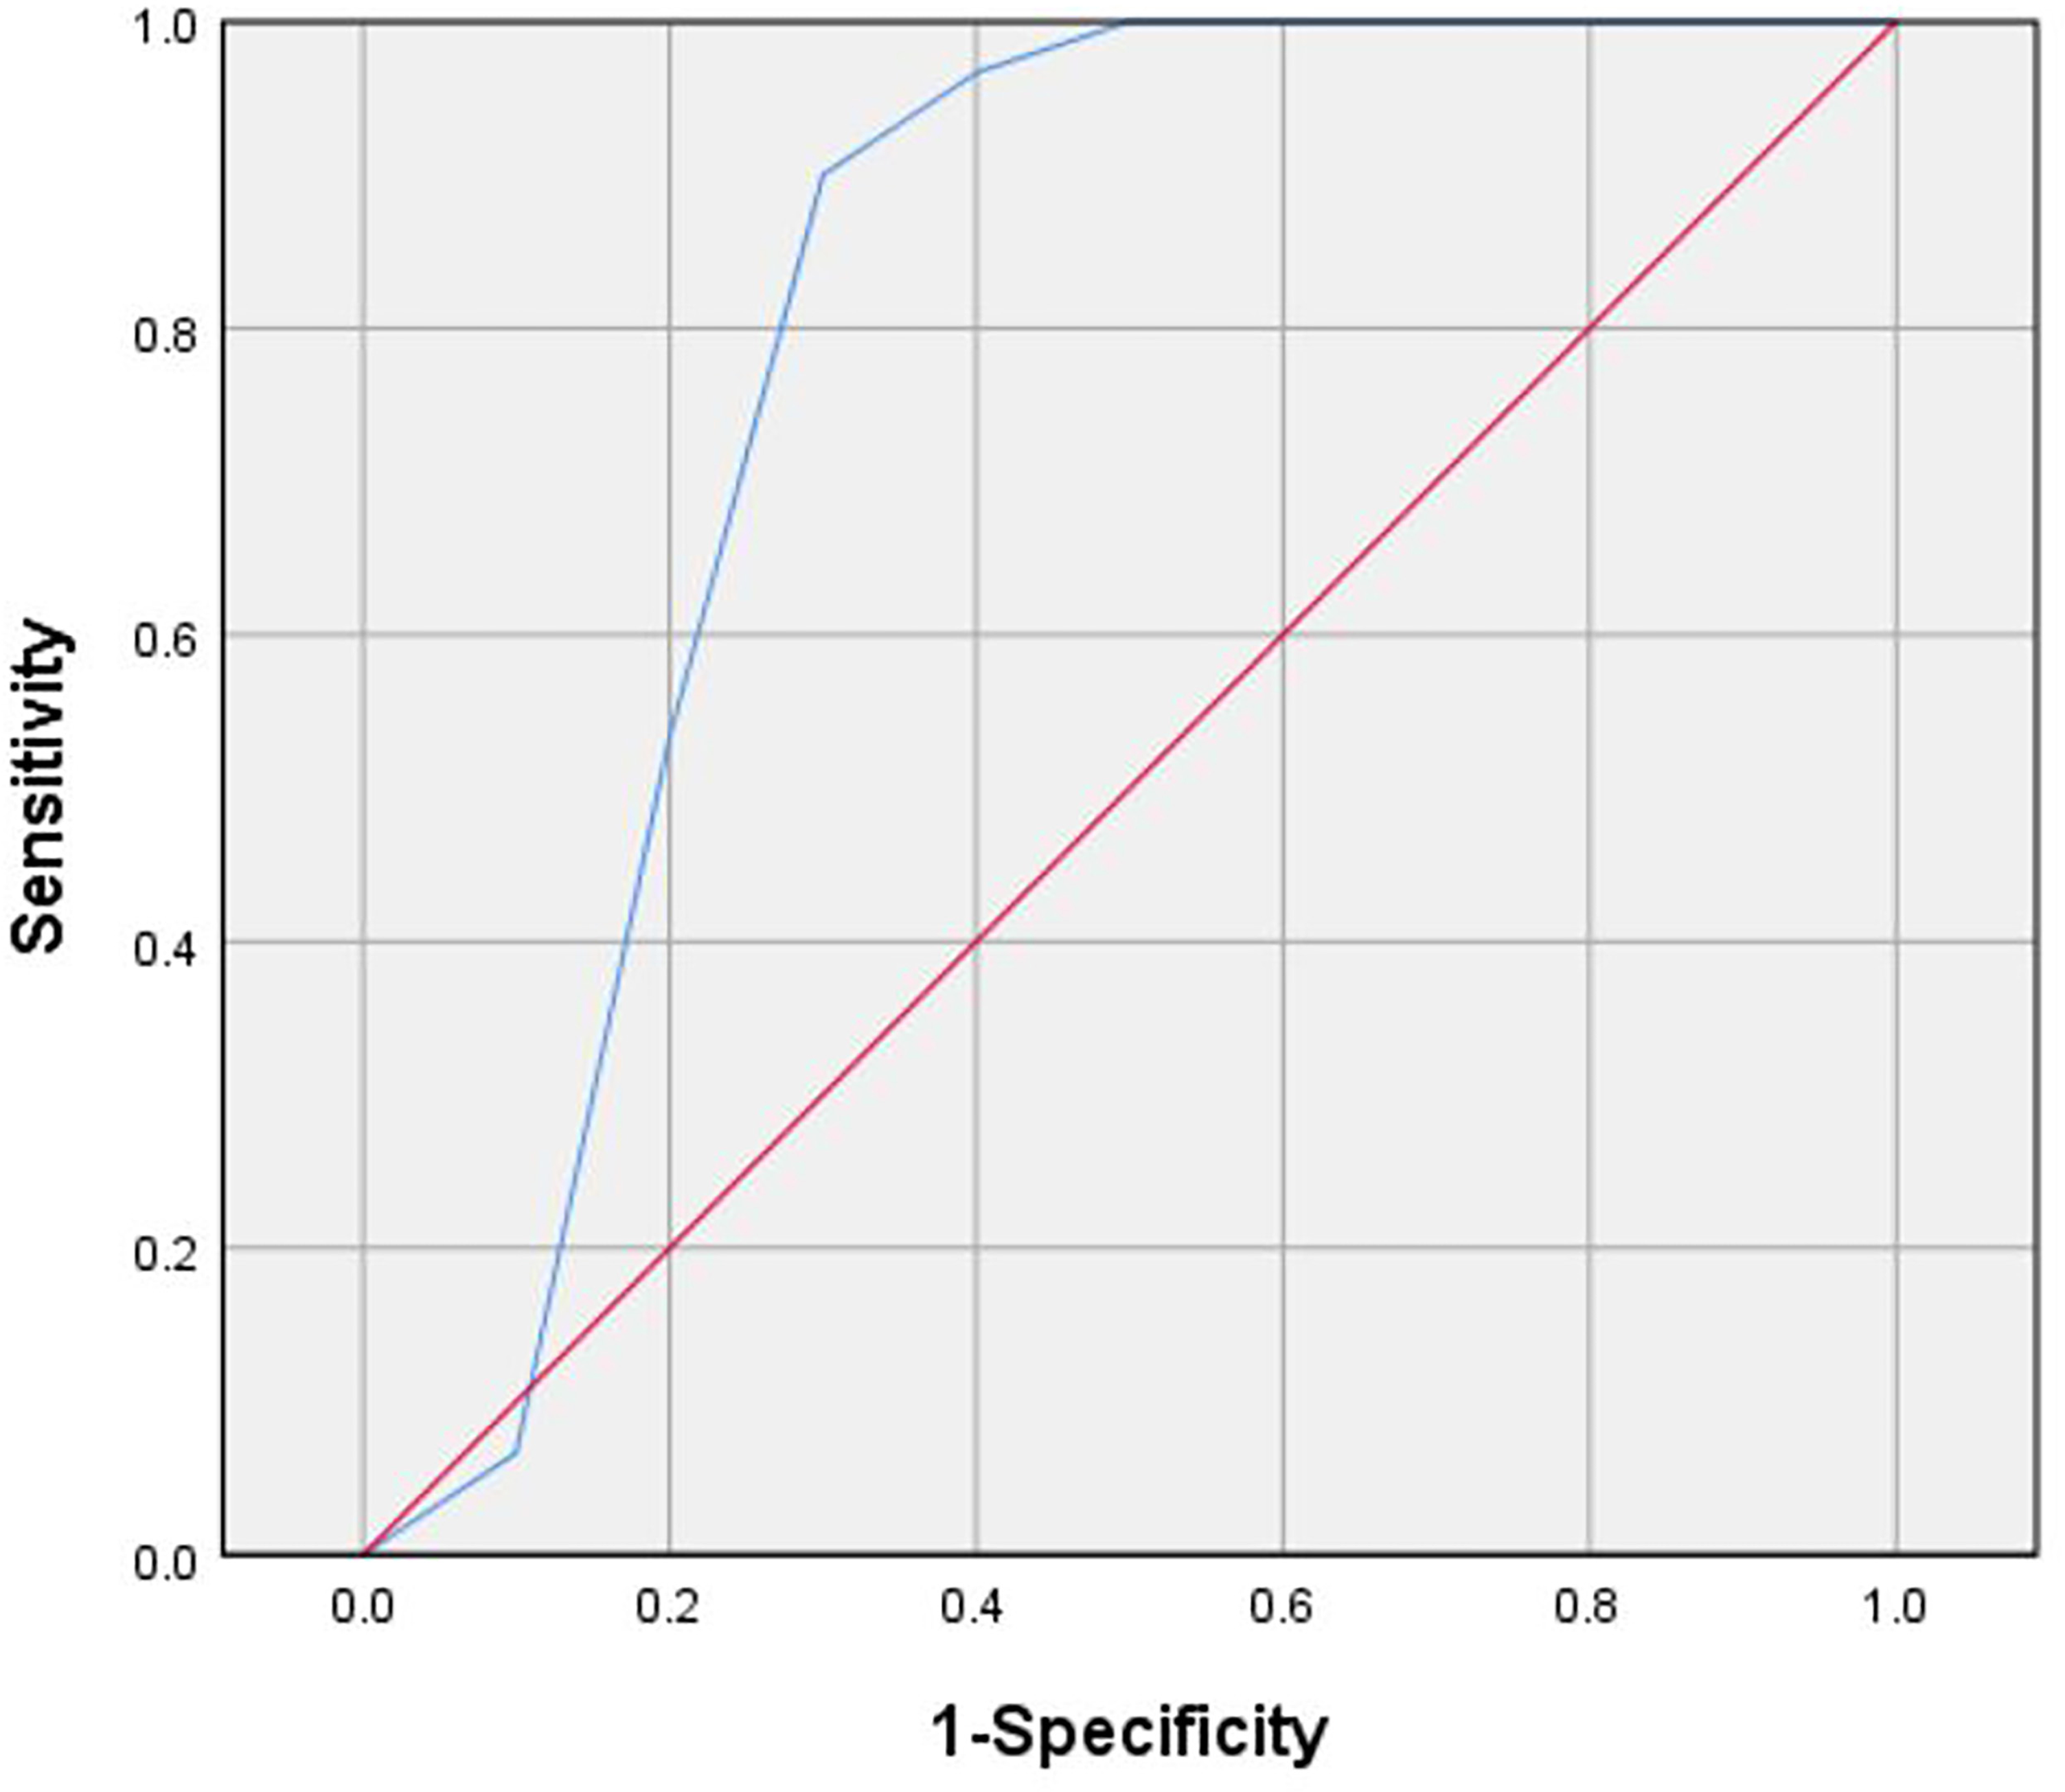
The receiver operating characteristic curve of rise time to differentiate the proliferation ability of soft-tissue sarcoma.
Characteristics of soft-tissue sarcomas included in the study.
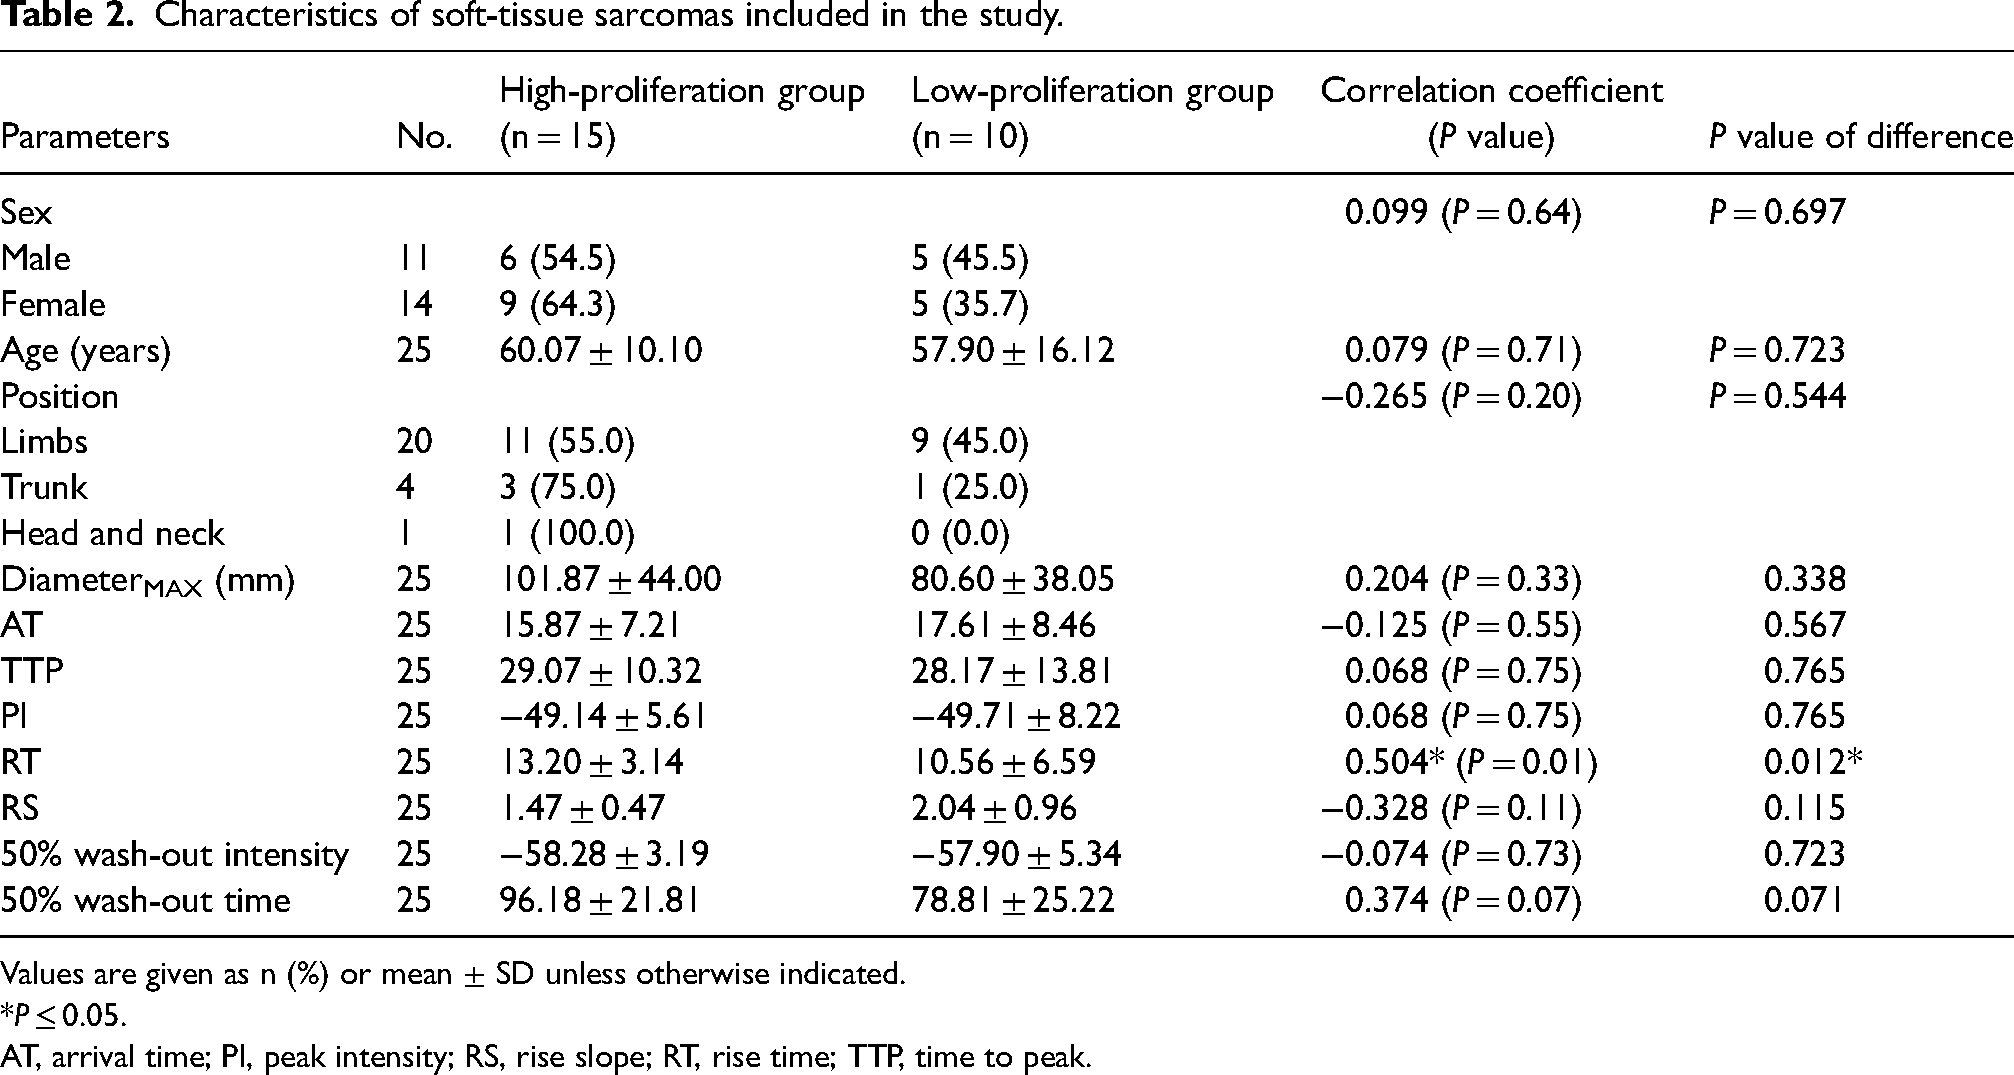
Values are given as n (%) or mean ± SD unless otherwise indicated.
*P ≤ 0.05.
AT, arrival time; PI, peak intensity; RS, rise slope; RT, rise time; TTP, time to peak.
Consistency of CEUS parameters of soft-tissue sarcoma between two observers.
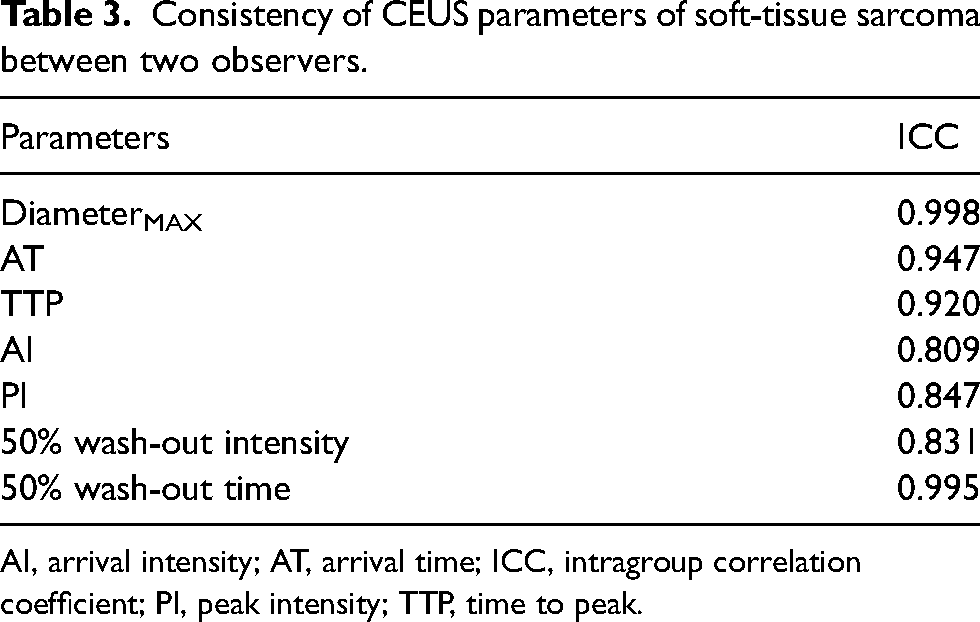
AI, arrival intensity; AT, arrival time; ICC, intragroup correlation coefficient; PI, peak intensity; TTP, time to peak.
Discussion
By studying the correlation between CEUS qualitative and quantitative parameters and Ki-67 LI in STS, this study explored whether CEUS, a minimally invasive and convenient imaging method, can reflect the proliferation ability of STS. The results showed that the longer the RT of CEUS, the stronger the proliferation of STS. Therefore, in clinical practice, if the time from the beginning of the contrast medium entering into the lesion to the maximum filling volume of the contrast medium is >10.84 s, the STS may have a high Ki-67 LI with strong cell proliferation ability (Fig. 5); if not, it may have a low Ki-67 LI with weak cell proliferation ability (Fig. 6).
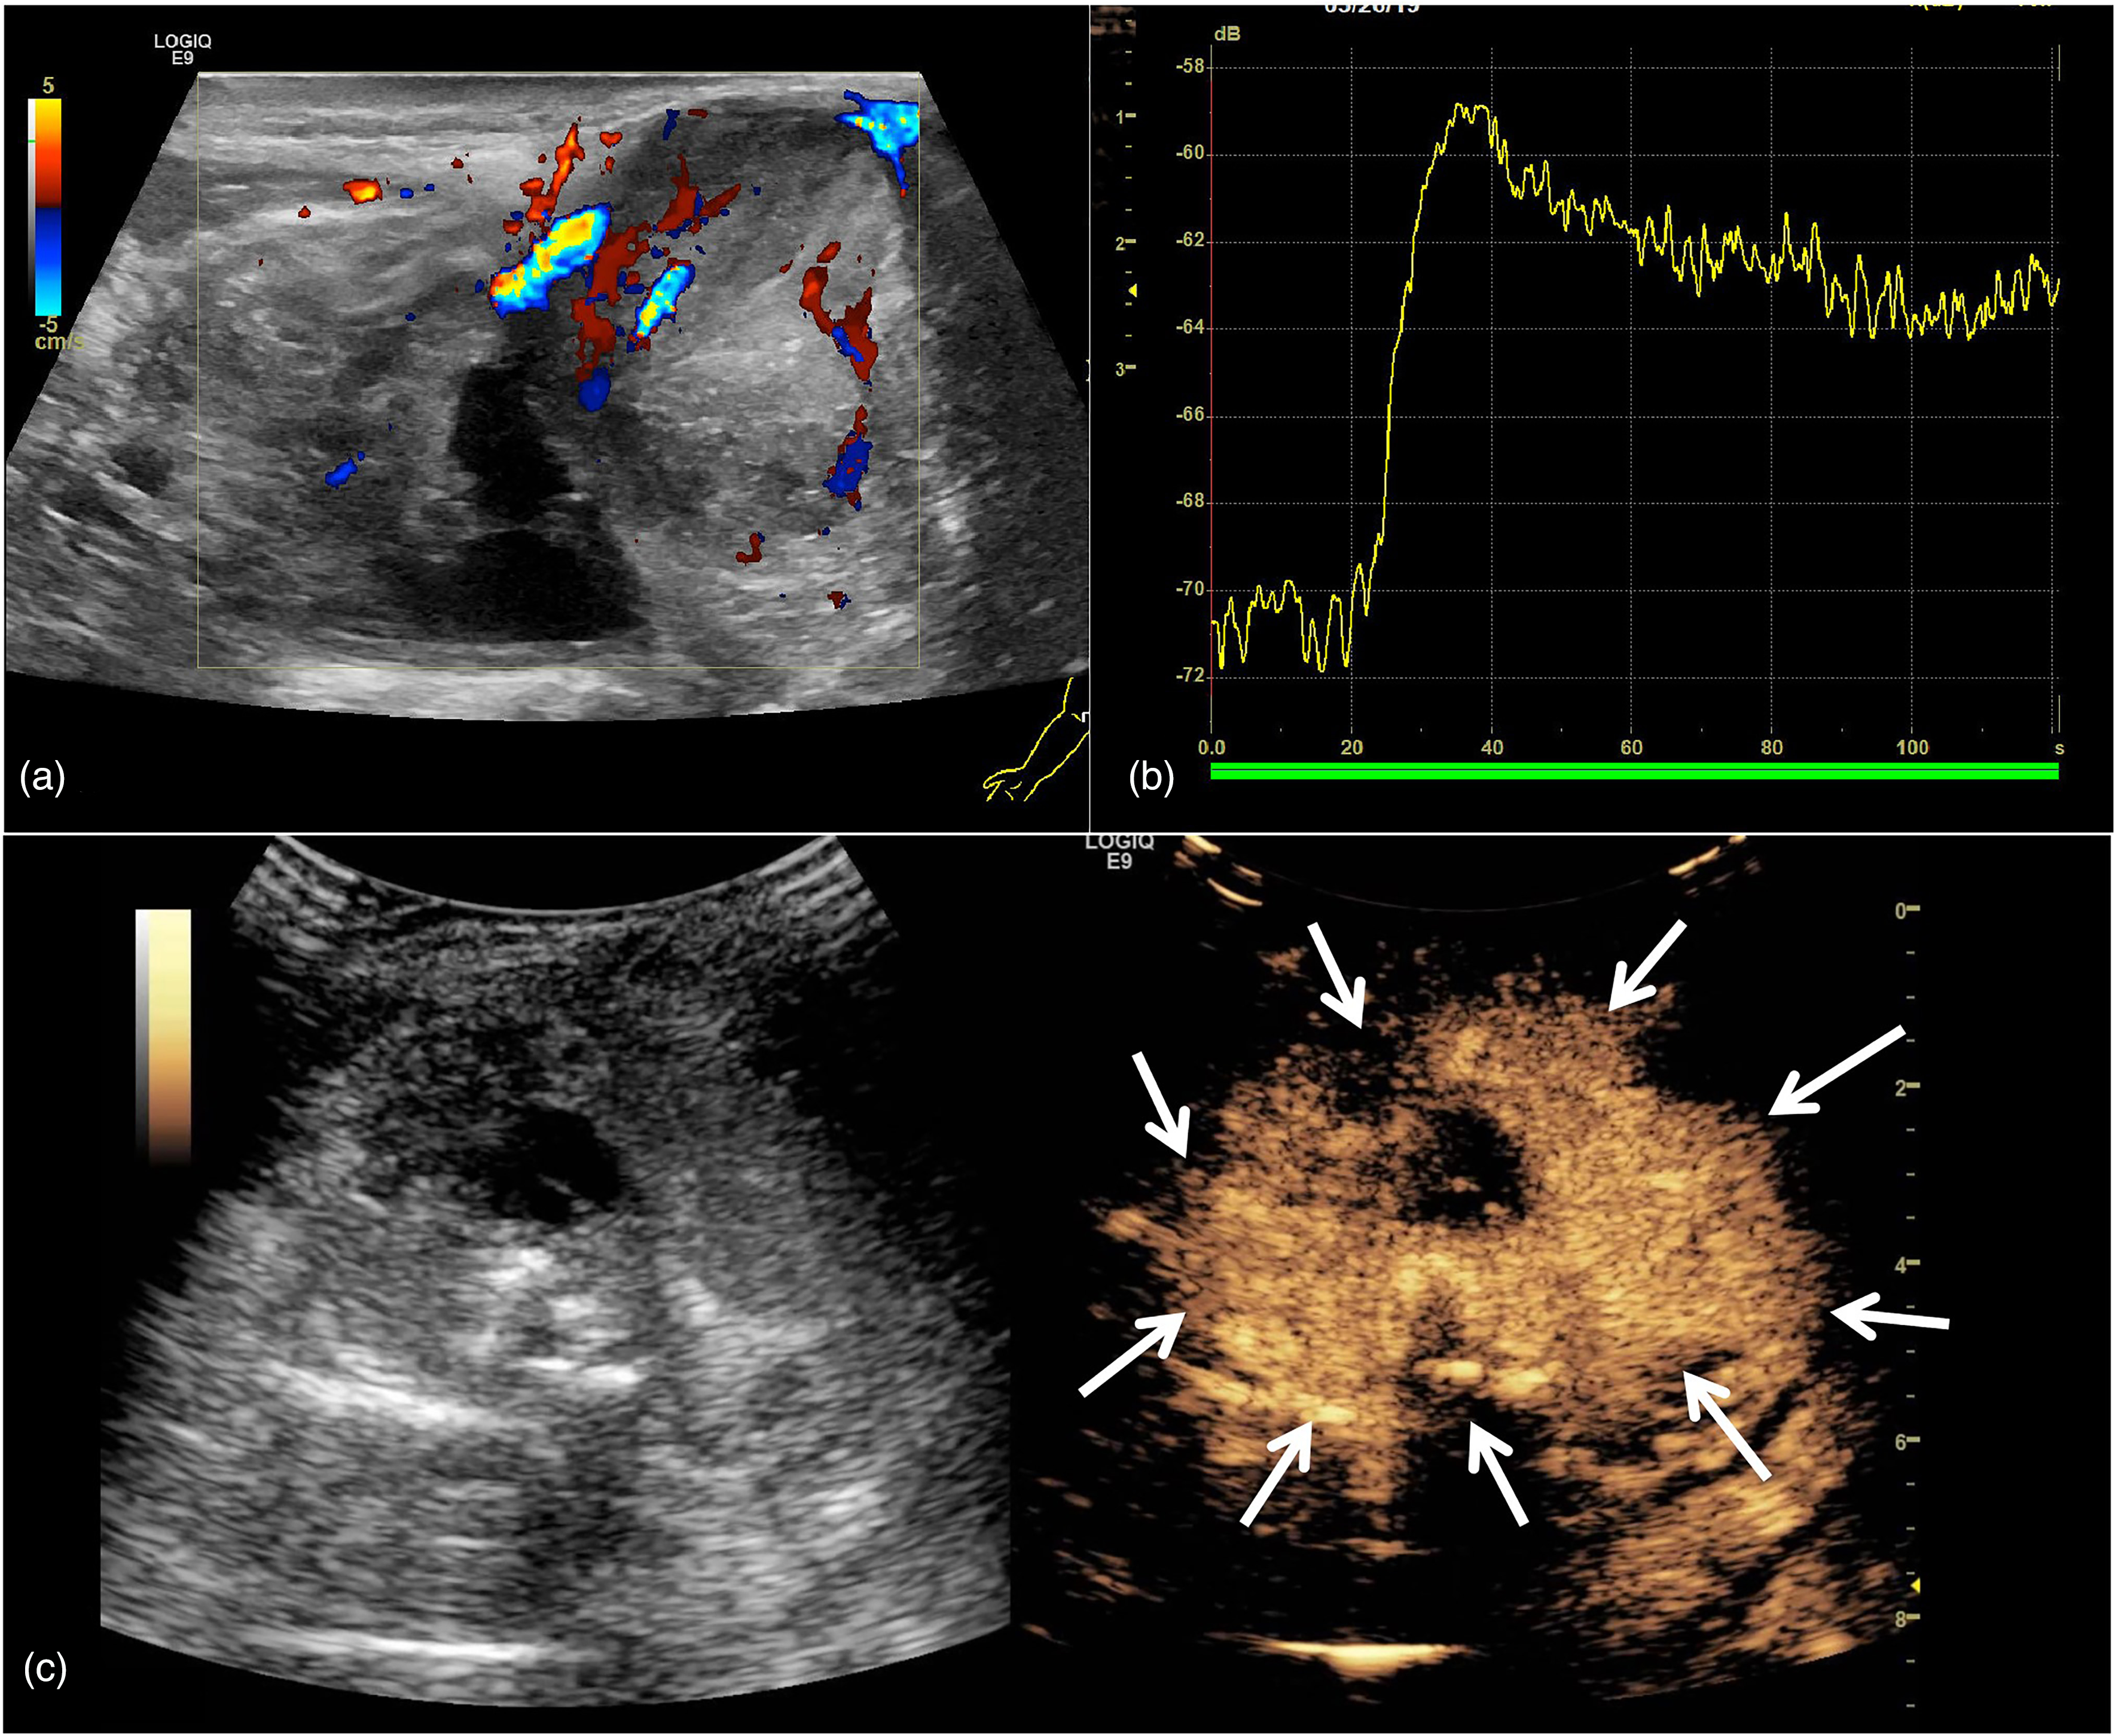
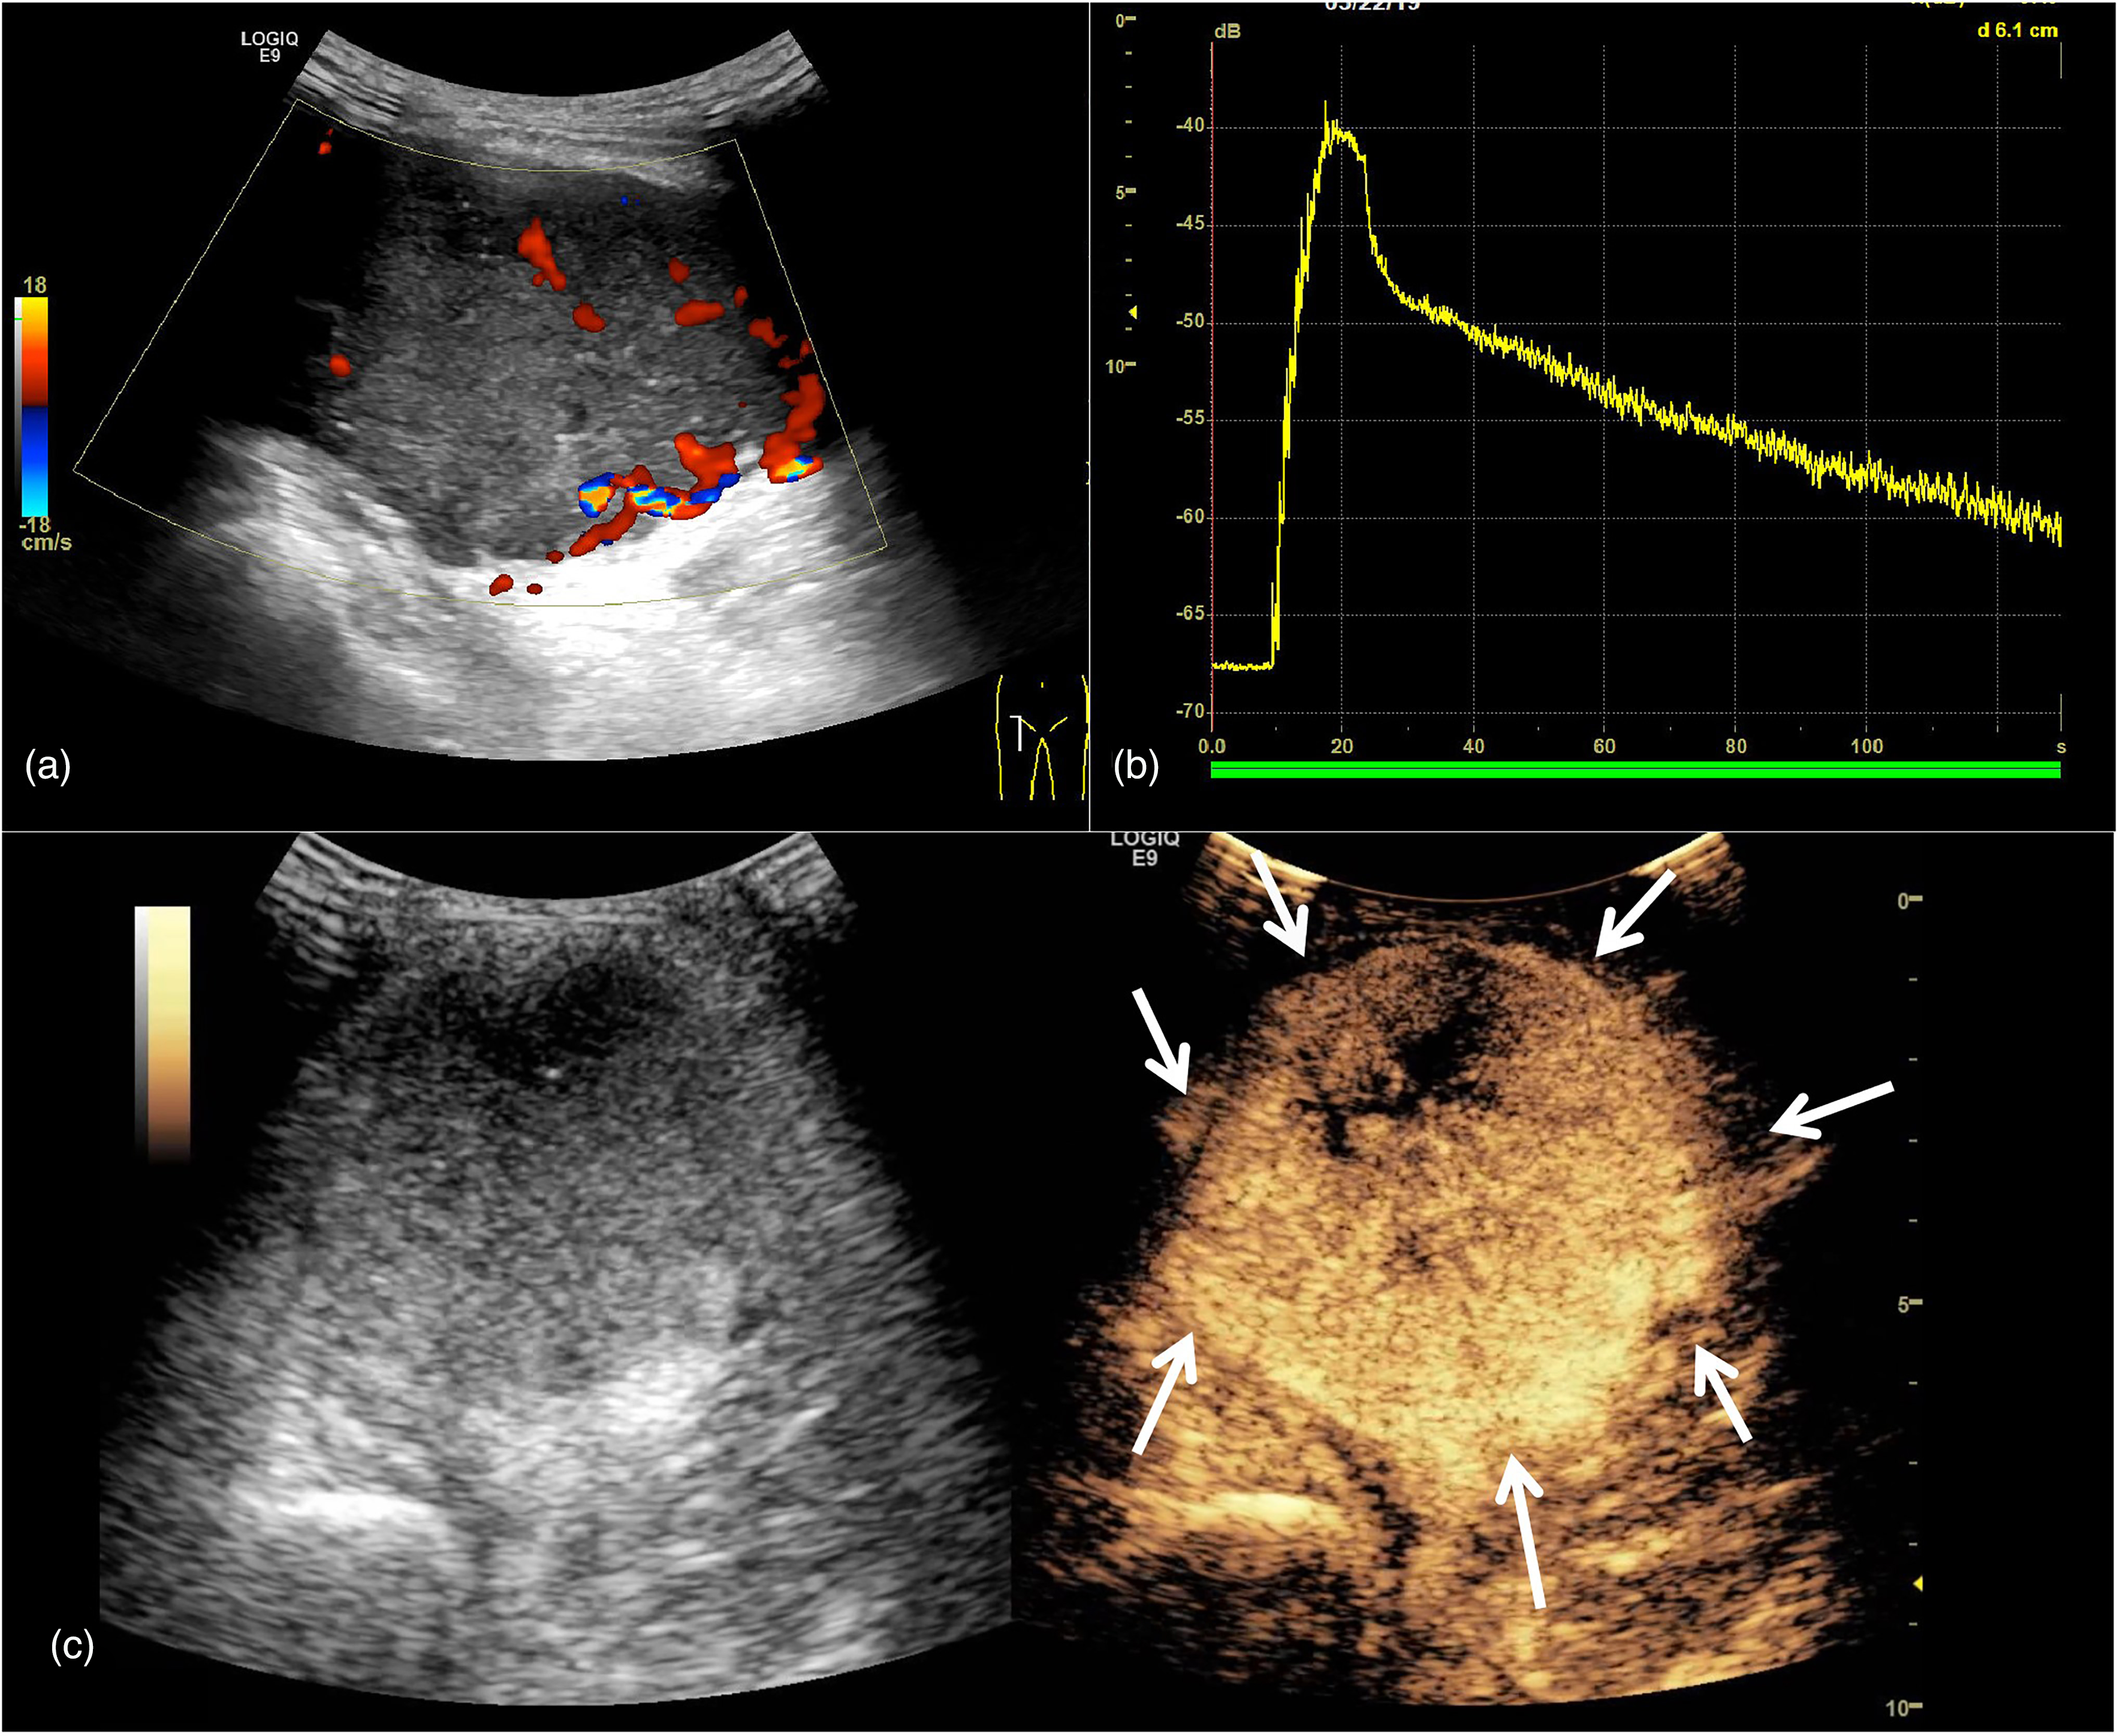
US images of a case of soft-tissue sarcoma with high proliferation. A 70-year-old man presented with synovial sarcoma in the upper extremity. Ki-67 was 60%. (a) Conventional US showed that the maximum diameter of the mass was about 86 mm, and Alder’s blood flow grade was grade III. (b) The rising time of the time intensity curve was 18.34 s. (c) The perfusion pattern of contrast-enhanced US was P5. US, ultrasound.
US images of a case of soft-tissue sarcoma with high proliferation. A 45-year-old woman presented with liposarcoma in the lower extremity. Ki-67 was 20%. (a) Conventional US showed that the maximum diameter of the mass was about 100 mm, and Alder’s blood flow grade was grade III. (b) The rising time of the time intensity curve was 8.93 s. (c) The perfusion pattern of contrast-enhanced US was P5. US, ultrasound.
As shown by an earlier investigation, the more the number of blood vessels in the conventional ultrasound mode, the stronger the proliferation of STS (18). However, color Doppler ultrasound showed only the larger vessels in STS. In the current study, we took the advantages of CEUS in the display of microvessels in tumors to further explore the correlation between microvessel characteristics and cell proliferation in STS (19).
It is generally believed that the higher the Ki-67 LI, the stronger the proliferation ability of tumor cells (20). Proliferative tumor cells secrete high levels of angiogenic factors, especially VEGF. The proliferation of tumor microvessels increases the uptake of contrast media. At the same time, the vascular network formed by angiogenic factors in a short period of time was chaotic, immature, fragile, and highly permeable (18,21). Under these circumstances, the contrast agent can quickly pass through the blood vessels and shorten the uptake time. Du et al. (13) found that PI and RS were positively correlated with Ki-67 LI, while AT, RT, and TP were negatively correlated with it in breast cancer. However, the results in this study showed RT was positively correlated with Ki-67 LI, meaning the stronger the proliferation of STS cells, the longer the filling time of contrast medium. This seemed to be inconsistent with the results of other malignant tumors.
However, compared with other studies, except for the difference of tumor types, STS in this study were mostly bulky (high-proliferation group: 101.87 ± 44.00 mm; low-proliferation group: 80.60 ± 38.05 mm). Most of the new blood vessels in the tumor are distorted and disordered. Narrow lumen, thin wall, and lack of vasoconstrictor components (such as muscle layer) can lead to poor vascular elasticity (22,23). Limited vasoconstriction, lack of lymphatic network, and low perfusion pressure can easily lead to blood stasis. In addition, studies have shown that the tumor itself can directly lead to the activation of the coagulation system, and the increase of various coagulation factors makes the blood tend to hypercoagulable state (24). Finally, blood stasis, vascular endothelial injury, and hypercoagulability are beneficial to the formation of venous tumor thrombosis (25,26). Blood perfusion disorders can lead to stagnation of contrast media in the vascular pool, resulting in slow filling and clearance. In the TIC curve of STS, 50% wash-out time represented the time from the beginning to the time when the contrast medium subsides to 50% of the peak value, so it was closely related to RT. Therefore, except RT, STS with strong proliferative ability tended to have a longer 50% wash-out time, but it was not statistically significant in this research. However, since the sample size of this study was only 25, it could not be ruled out that this was caused by the sample size being too small.
Further, the results of this study illustrated that there was no significant correlation between Ki-67 LI and the quantity of contrast medium uptake in STS. The intensity-related parameters, such as PI, reflected the amount of contrast agent in the vascular bed of STS lesions at each time point. However, considering the large volume and abnormal blood perfusion of STS, it often led to internal ischemia, hypoxia, and necrosis, and eventually liquefaction necrosis, fibrous scar, and even calcification in the tumor parenchyma. These pathological changes, on the contrary, would reduce the internal blood vessels of STS, resulting in the reduction of contrast medium filling. This was also consistent with the qualitative analysis result that 64% of the STS contrast-enhanced ultrasound perfusion pattern was P5. The proportion of CEUS pattern in this study is also consistent with the results of previous studies (16,27).
The present study has some limitations. First, different subtypes of STS have different internal components, which may lead to selection bias. Second, CEUS image is a two-dimensional section of the lesion selected artificially, and Ki-67 LI is only the immunohistochemical staining of local tumor sections. Neither of them could represent the whole lesion, which would inevitably bring about measurement error and bias. Further, this study is a retrospective study, and there will be inevitable selection bias. Finally, the incidence rate of STS is low and the sample size of a single center is small, so the number of cases in this study is quite limited. We hope to conduct prospective research with large samples in the future. At present, our research group is also expanding relevant research content, such as the combination of CEUS and other imaging examinations in the evaluation of the proliferation of STS.
In conclusion, the filling time of ultrasound contrast agent in the lesions was correlated with the Ki-67 LI in STS. CEUS RT might be a non-invasive imaging marker to indirectly evaluate the proliferation of STS cells, which can help clinicians to make the best judgment on the curative effect and prognosis of patients with STS.
Footnotes
Acknowledgements
We are extremely thankful to all the co-workers of our department.
Declaration of conflicting interests
The author(s) declared no potential conflicts of interest with respect to the research, authorship, and/or publication of this article.
Funding
The author(s) disclosed receipt of the following financial support for the research, authorship, and/or publication of this article: This work was supported by the National Natural Science Foundation of China, Jiangsu Province Key Research & Development Plan (grant Nos. 81401427, BE2018703).