
Abstract
Background
Detection and characterization of renal lesions are common in daily clinical practice.
Purpose
To investigate the effectiveness of shear wave elastography (SWE), a novel radiological examination technique, in the characterization of renal masses.
Material and Methods
The study included a total of 68 patients (33 men, 35 women; mean age = 57.71 ± 12.08 years; age range = 19–83 years) who underwent SWE. SWE measurements were obtained at depths of 2–8 cm from the probe surface in two different positions from an analysis window of approximately 0.5 × 1.0 cm on ultrasound. The cutoff SWE was calculated for the differentiation of renal cell carcinoma (RCC) and angiomyolipoma (AML) by receiver operating characteristic (ROC) analysis. When the result was statistically significant, the sensitivity, specificity, accuracy, and positive and negative predictive values of the test were calculated.
Results
Mass-to-parenchyma SWE ratios of RCCs were significantly higher than those of AMLs (P = 0.003). In ROC curve analysis, the SWE cutoff was 1.215 m/s to differentiate RCCs from AMLs. The area under the ROC curve was calculated as 0.74 (95% CI = 0.610–0.871, sensitivity = 70.7%, specificity = 70.6%, positive predictive value = 87.8%, negative predictive value = 44.4%).
Conclusion
The SWE technique is increasingly used and may be useful in distinguishing RCC and AML lesions, and especially clear cell and non-clear cell RCCs.
Introduction
Kidney masses are often incidentally detected during routine radiological imaging of the abdomen (1). Angiomyolipoma (AML) is the most common benign solid renal mass, while renal cell carcinoma (RCC) accounts for about 90% of all renal malignancies (2,3). RCC has three major histological subtypes: clear cell RCC (ccRCC); papillary RCC (pRCC); and chromophobe RCC (4). The treatment of RCC includes radical or partial nephrectomy, while AML is typically monitored without intervention or treated with embolization in cases of large lesions to prevent complications (5). For many years, B-mode ultrasonography (US) was the prominent imaging method to evaluate and characterize kidney lesions. During US, AML classically presents as a hyperechoic lesion with irregular margins, whereas RCC is most commonly hypoechoic. That said, RCCs <3 cm can appear hyperechoic and mimic AML (6,7). For this reason, the differentiation of RCCs from AMLs can be difficult with US. When this is the case, more advanced imaging methods such as computed tomography (CT) and magnetic resonance imaging (MRI) are used. US-guided biopsy can also be performed to differentiate benign and malignant lesions. However, albeit rarely, this method may be associated with complications such as bleeding (8). This has led researchers to develop a new imaging method: sonoelastography. Sonoelastography is based on the measurement of tissue stiffness and the idea that stiffness can be affected by pathological conditions such as neoplasms or inflammation (9,10). To create a quantitative tissue stiffness map, shear wave elastography (SWE) uses a probe to induce mechanical impulses that travel through the tissue as shear waves and to record the movement of these waves with rapid imaging sequences (11).
The aim of the present study was to investigate the effectiveness of SWE in the characterization of renal masses and particularly the differentiation of RCC and AML.
Material and Methods
Study population
The study included a total of 74 patients (36 men, 38 women) who were referred to the US unit between March 2014 and April 2016 for US examination and who were determined to have renal masses. A total of 6 (8%) patients were excluded due to inadequate SWE examination as a result of having lesions below a depth of 8 cm (n = 4) or respiratory motion artifacts due to inadequate breath-holding (n = 2). Therefore, the study was performed with a total of 68 patients (33 men, 35 women; mean age = 57.71 ± 12.08 years; age range = 19–83 years) who underwent SWE. The characterization graph of lesions is presented in Table 1. The range of sizes of AMLs and RCCs were 15–98 mm and 23–180 mm, respectively. AMLs and RCCs were diagnosed with US, CT, and MRI. In total, 15 patients who were hyperechoic on US and with echogenicity equal to or greater than renal sinus were considered to be fat-rich AML and no other radiological modalities were applied to them. Fat-poor AML was diagnosed by CT or MRI without the need for biopsy in two patients who were not hyperechoic on US. The definitive diagnosis was achieved with the pathological examination of the postoperative specimen on RCCs. All postoperative specimens were evaluated by a pathologist with at least 15 years of experience in renal lesions. This prospective study was approved by the ethics committee. All participants provided signed informed consent.
Characterization of the lesions.
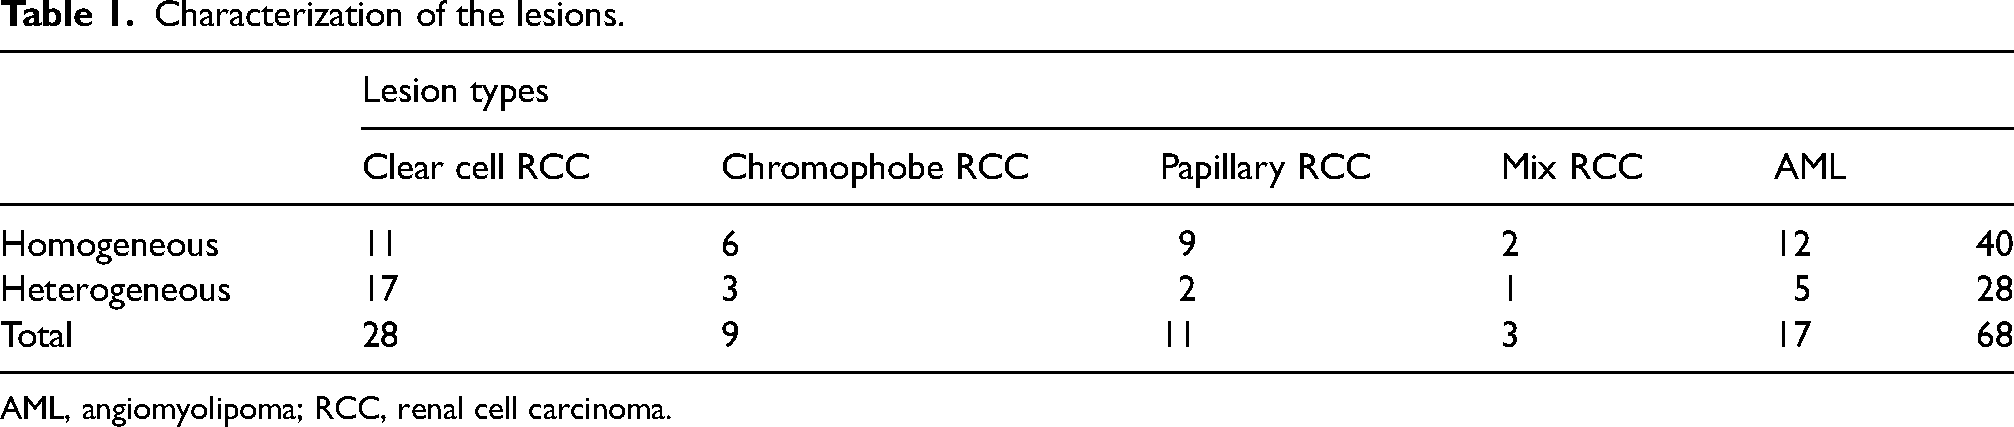
AML, angiomyolipoma; RCC, renal cell carcinoma.
Imaging protocols and SWE technique
A single radiologist with 11 years of experience in conventional US and four years of experience in elastography performed all examinations. B-mode US and SWE examinations were performed in supine and lateral decubitus positions. The US examinations were performed with a Philips ultrasonography device (iU22; Philips Healthcare, Andover, MA, USA) and the SWE examinations with a convex probe (2.5 MHz; Transducer C5-1, B0M2J6, Philips Healthcare).
There was an 8-h fasting interval before sonographic examination. During the examination, the patients were asked to take and hold a deep breath for as long as possible. B-mode US of the kidney was performed for lesion detection. The size and the depth of the lesions were determined and lesions with a depth >2 cm and <8 cm were excluded. The same probe was used without manual compression to perform SWE with the ElastoPQ technique. Measurements were obtained from an analysis window of approximately 0.5 × 1.0 cm by US. This method involves inducing shear waves in a special pulse sequence with a convex probe and measuring the travel speed of these waves within the tissue. The device records these measurements in m/s. During SWE, only one measurement was obtained from the kidney parenchyma at least 1 cm from the renal mass; two different measurements were obtained from the renal mass and their mean was used for statistical analysis. We also evaluated mass-to-parenchyma SWE ratios. According to the standard deviation (SD) value automatically calculated by the examination device, measurements were evaluated as homogeneous (SD < 5) or heterogeneous (SD > 5). For RCCs, measurements were taken from solid areas when possible. No measurements were obtained from cystic and calcified regions. No measurements were taken from the centrally necrotic and calcified masses. Since there were no cystic and calcified areas in the AMLs included in the study, such a distinction was not required. For each patient, all measurements were obtained from the same depth, which was determined according to the center of the mass. The parenchymal measurement was also obtained from the same depth. In order to be able to measure at the same level with the parenchyma in exophytic tumors, care was taken to ensure that the central part of the tumor was within the renal parenchyma. Exophytic tumors that did not meet this requirement were not included in the study.
Statistical analysis
Statistical analyses were performed using SPSS version 25 (IBM Corp., Armonk, NY, USA). Numerical values were presented as mean ± SD or n (%). The normality of data distribution was examined by visual (histogram and probability plots) and analytical methods (Kolmogorov–Smirnov and Shapiro–Wilk tests).
Descriptive analyses were presented as means ± SD for normally distributed variables. Age, lesion size, and lesion depth were normally distributed and thus were compared according to sex, lesion side, lesion character, and pathology subtypes using the Student's t test.
Mass and parenchyma SWE values and mass-to-parenchyma SWE ratios were non-normally distributed; therefore, these variables were compared according to sex, lesion side, lesion character, and pathology subtypes using the Mann–Whitney U test.
The chi-square test was used to determine the statistical significance of the differences between sex, lesion side, lesion character, and pathological subtypes.
One-way ANOVA was performed to determine whether age, lesion size, and lesion depth were significantly associated with the type of mass.
The Kruskal–Wallis test was performed to determine whether mass and parenchyma SWE values and mass-to-parenchyma SWE ratios were significantly associated with the type of the mass. The Mann–Whitney U test with Bonferroni correction was used for pairwise comparison.
Correlation coefficients and statistical significances were calculated using Spearman's correlation when at least one variable was nonnormally distributed or ordinal. For statistical significance, we accepted an overall type I error rate of 5%. Data with P values <0.05 were considered statistically significant.
The diagnostic SWE cutoff for ccRCC versus non-clear cell RCC and RCC versus AML were determined with ROC analysis. If the ROC result was statistically significant, the sensitivity, specificity, accuracy, and positive (PPV) and negative predictive values (NPV) of the test were calculated. If type I error for the area under the curve was <5%, the diagnostic value of the test was accepted to be statistically significant.
Results
Descriptive information according to lesion diameter and SWE is presented in Table 2.
Descriptive information.
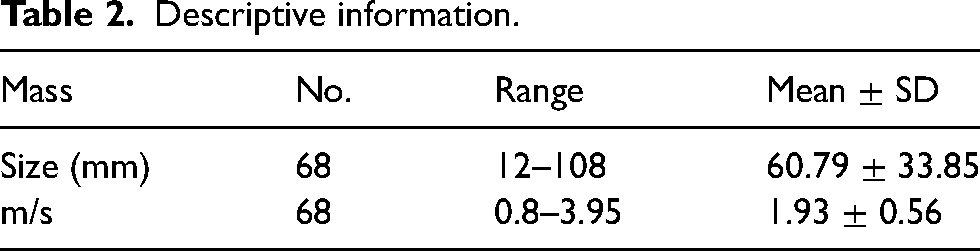
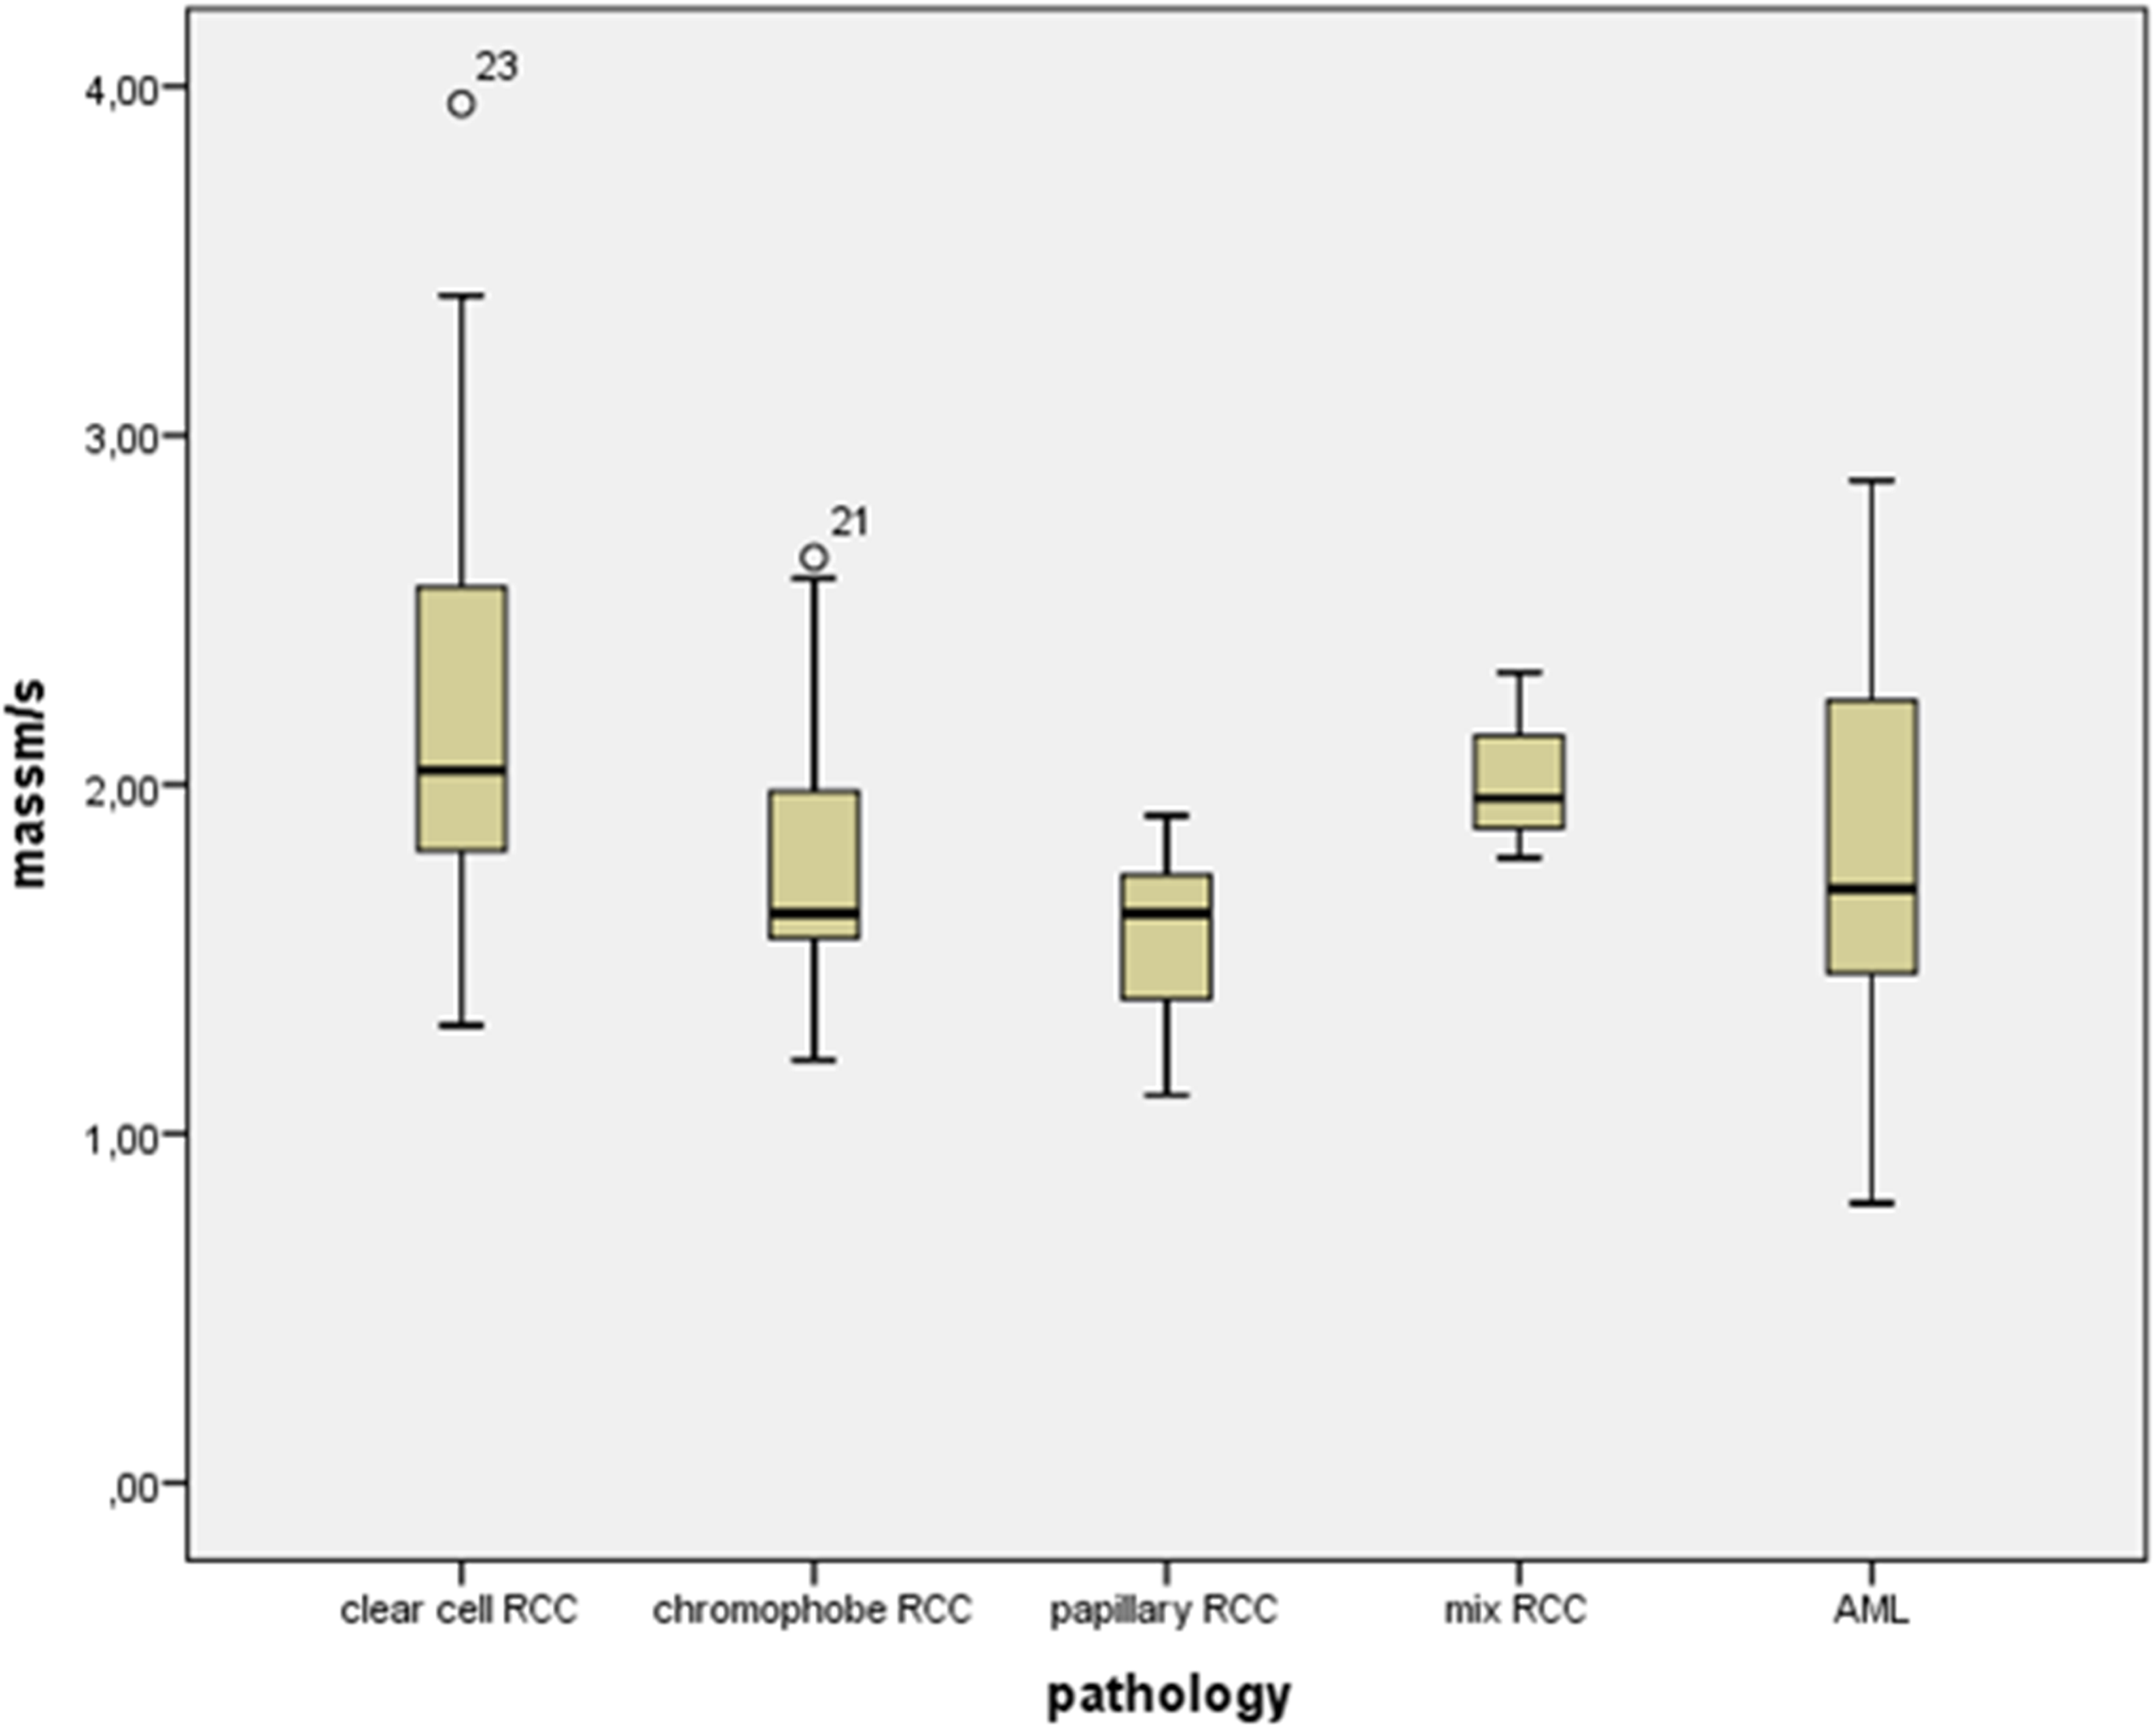
Table 3 provides masses and average elasticity values. The mean elasticity of renal parenchyma was measured as 1.48 ± 0.63 m/s. The higher, lower, and average elasticity values of the masses are presented in Fig. 1.
Range and mean values (in m/s) of the measured lesions. AML, angiomyolipoma; RCC, renal cell carcinoma.
Mean elasticity values of the lesions (in m/s).
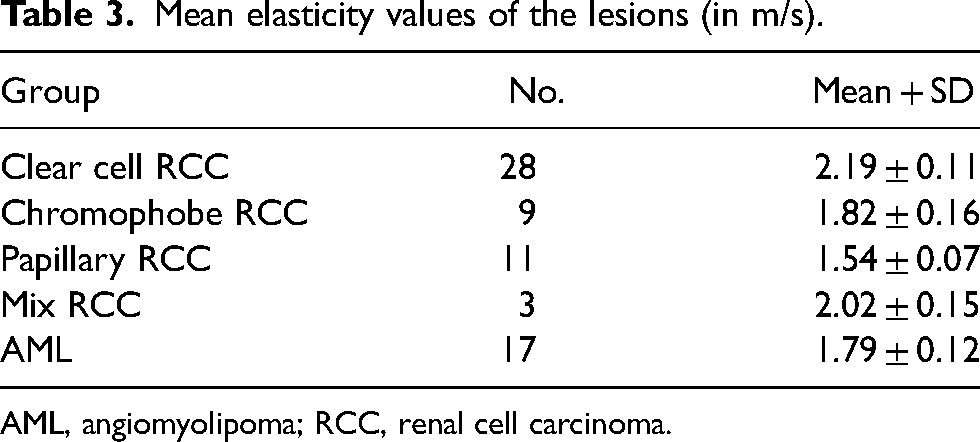
AML, angiomyolipoma; RCC, renal cell carcinoma.
SWE values of renal parenchyma on AML were higher than SWE values of renal parenchyma on RCC (P = 0.028) (Figs. 2 and 3). SWE values were significantly higher for heterogeneous lesions than homogeneous lesions (P < 0.001). SWE values were significantly higher for ccRCC than pRCC (P < 0.001). SWE values were significantly higher for mixed-type RCC than pRCC (P = 0.019). Mass-to-parenchyma SWE ratios of RCCs were significantly higher than those of AMLs (P = 0.003, respectively).
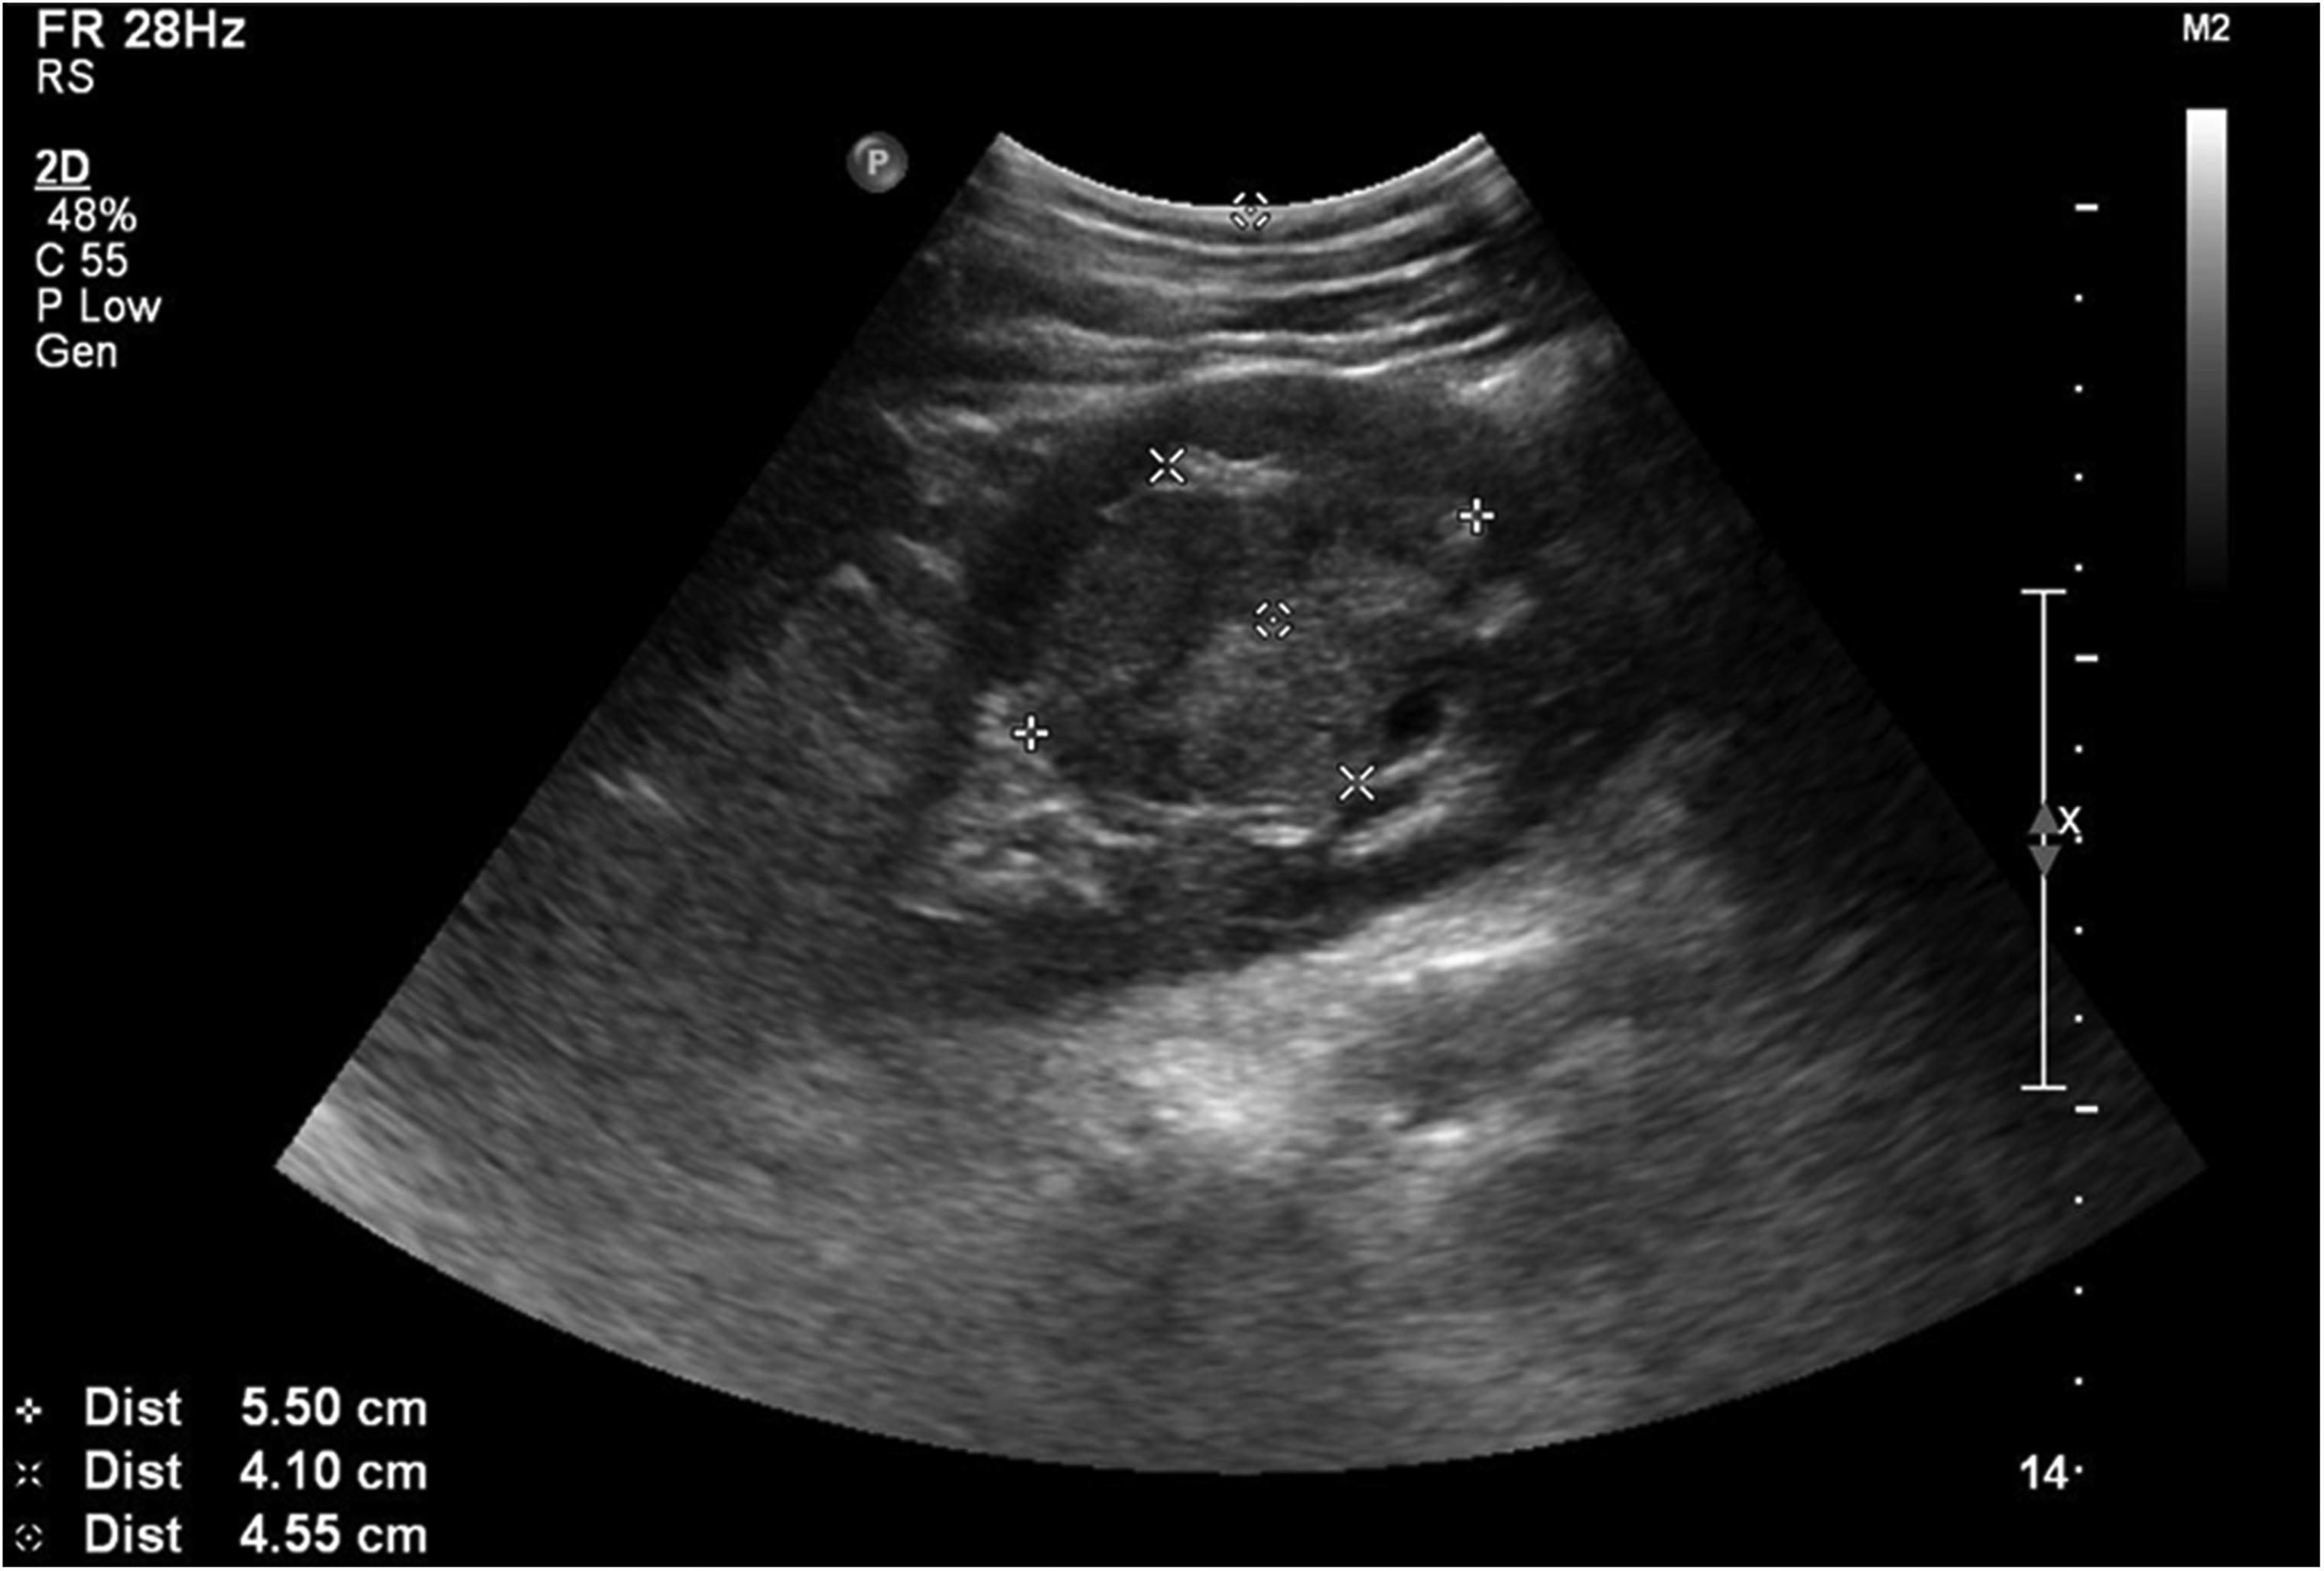
Sizes and depths of clear cell renal cell carcinomas in the mid-left kidney.
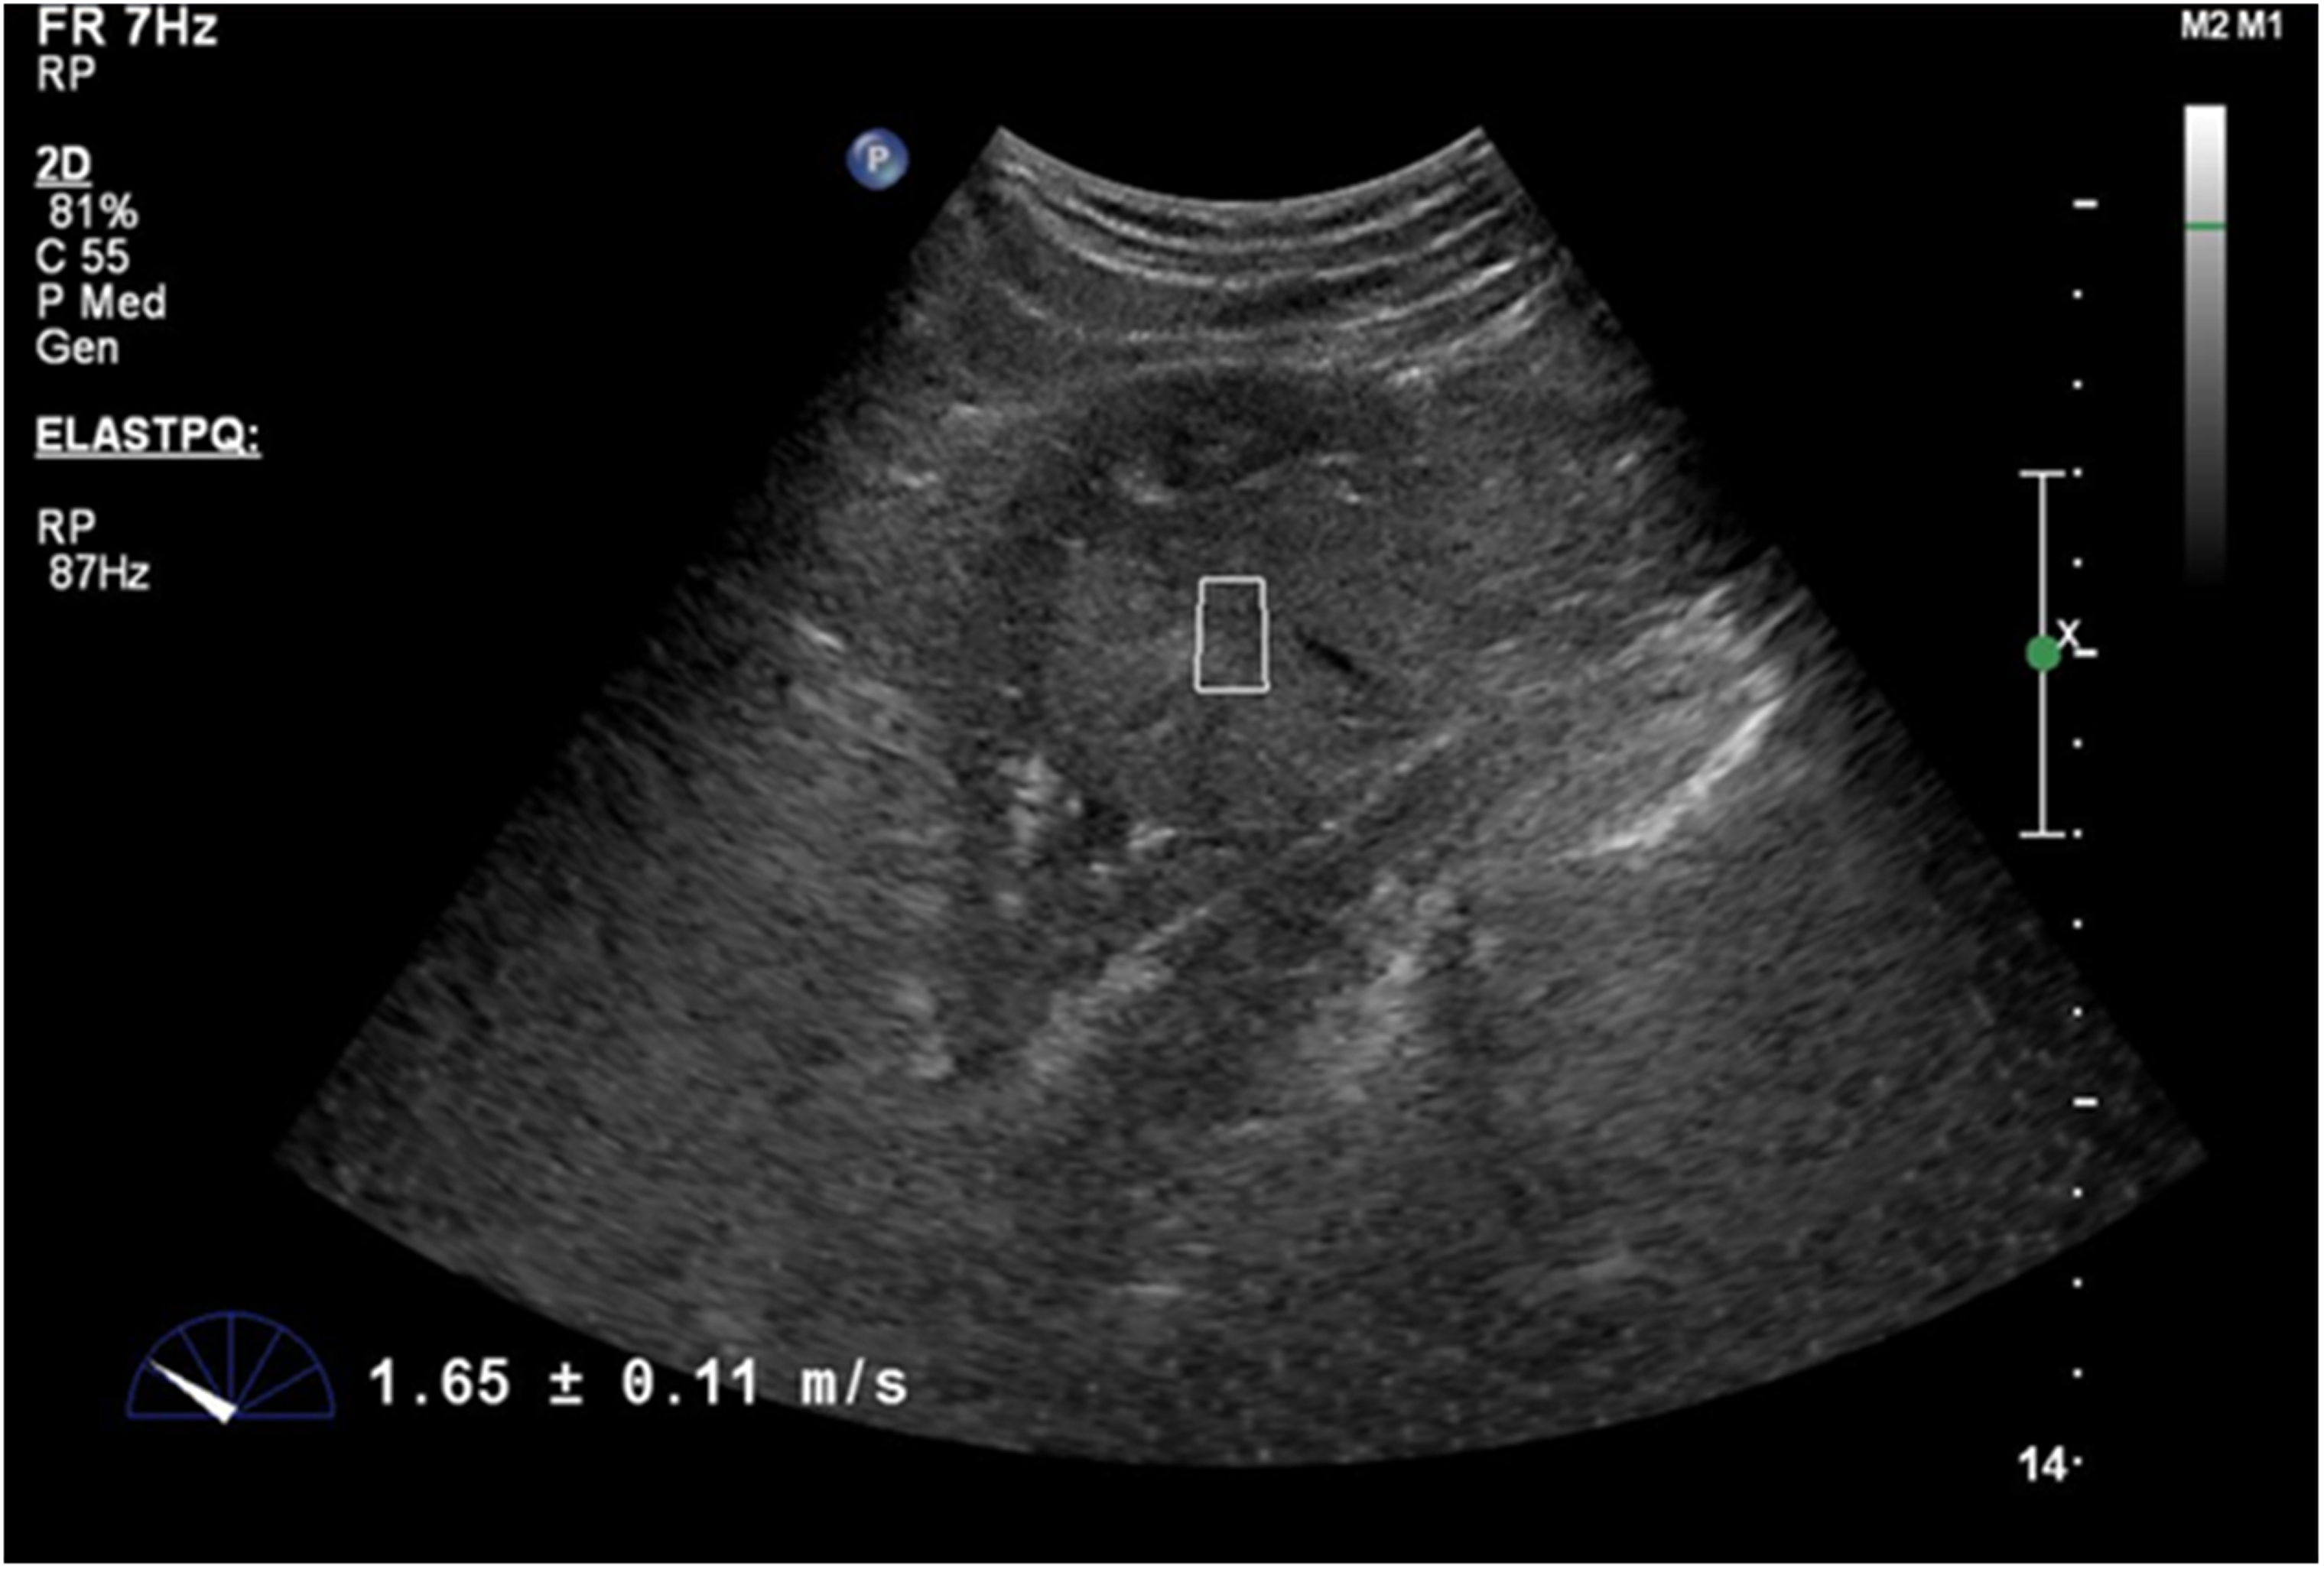
Elasticity of clear cell renal cell carcinoma in the mid-left kidney (in m/s).
In the Kruskal–Wallis test, the mass-to-parenchyma SWE ratio was significantly higher for ccRCC than AML (P = 0.003). SWE values were significantly higher for ccRCC than other RCC subtypes (P = 0.003).
In ROC curve analysis, the SWE cutoff to differentiate ccRCCs from non-ccRCC was 1.81 m/s (area under the ROC curve [AUC] = 0.76; 95% confidence interval [CI] = 0.625–0.895; sensitivity = 75%; specificity = 73.9%; PPV = 77.8%; NPV = 70.8%) (Fig. 4).
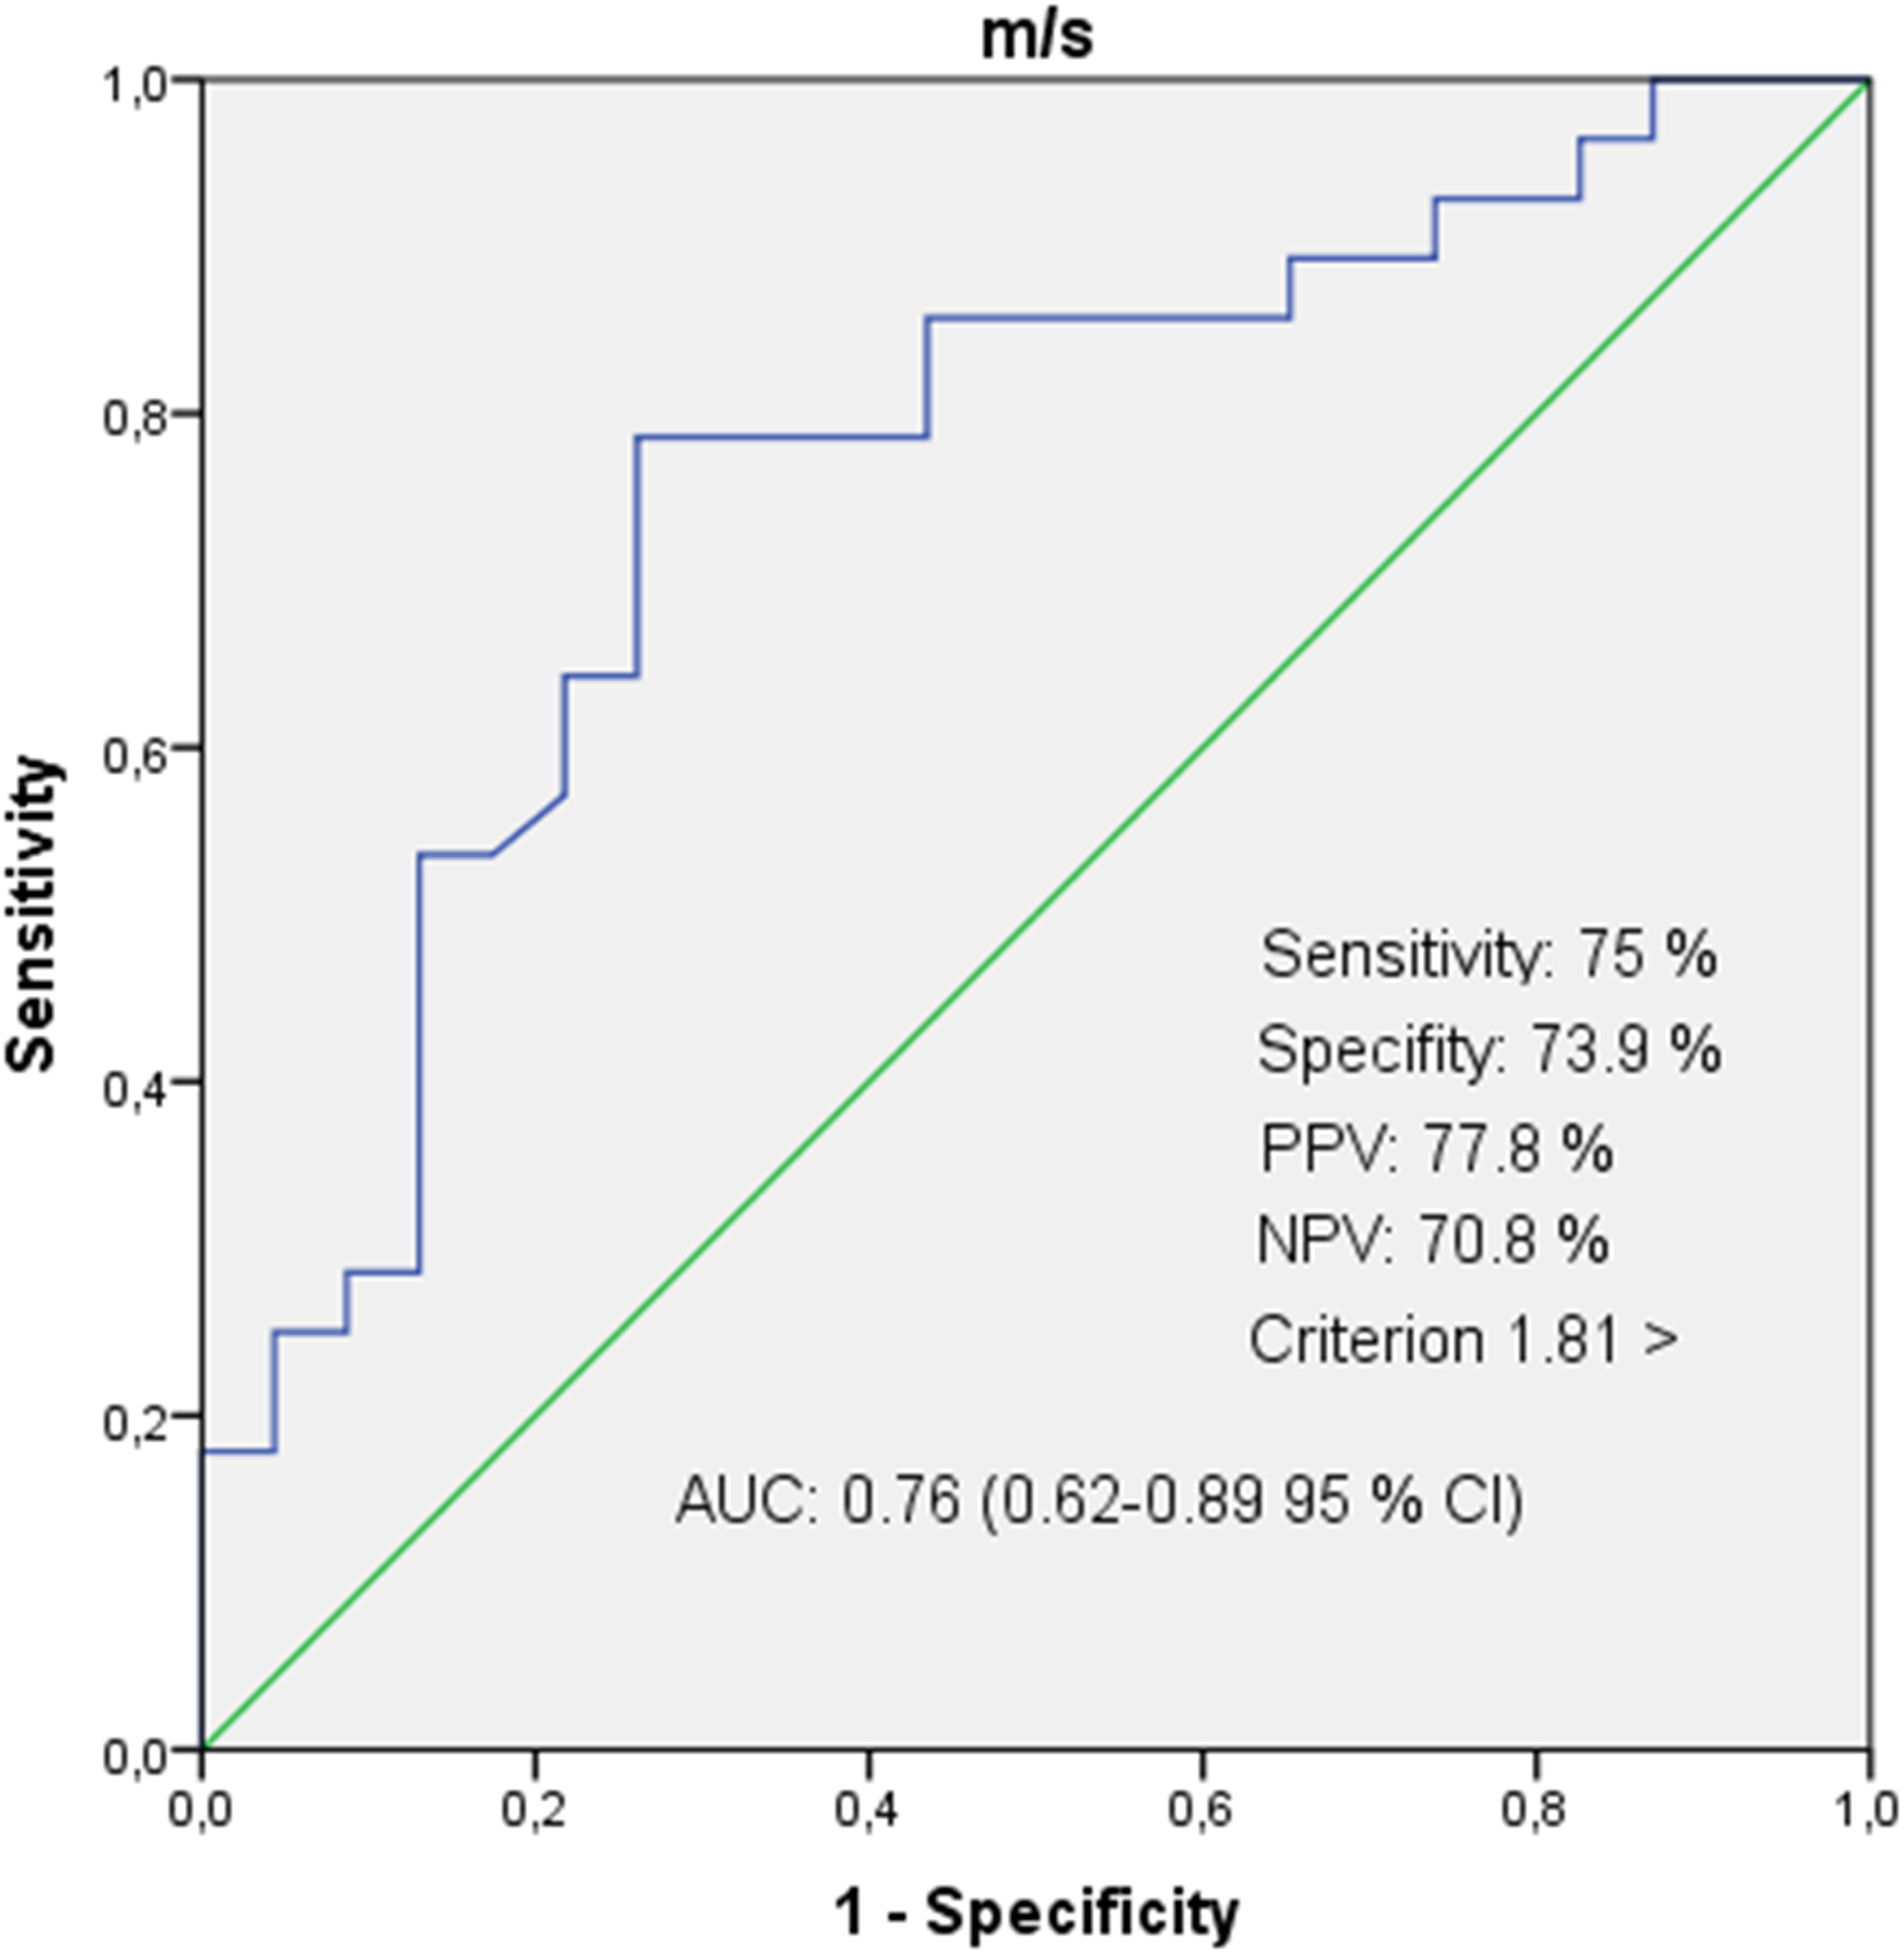
Characteristic curve of shear wave elastography measurements in differentiating clear cell RCC from non-clear cell RCC. RCC, renal cell carcinoma; RO, receiver operating characteristic.
In ROC curve analysis, the SWE cutoff to differentiate RCCs from AMLs was 1.215 m/s (AUC = 0.74; 95% CI = 0.610–0.871; sensitivity = 70.7%; specificity = 70.6%; PPV = 87.8%; NPV = 44.4%) (Fig. 5).
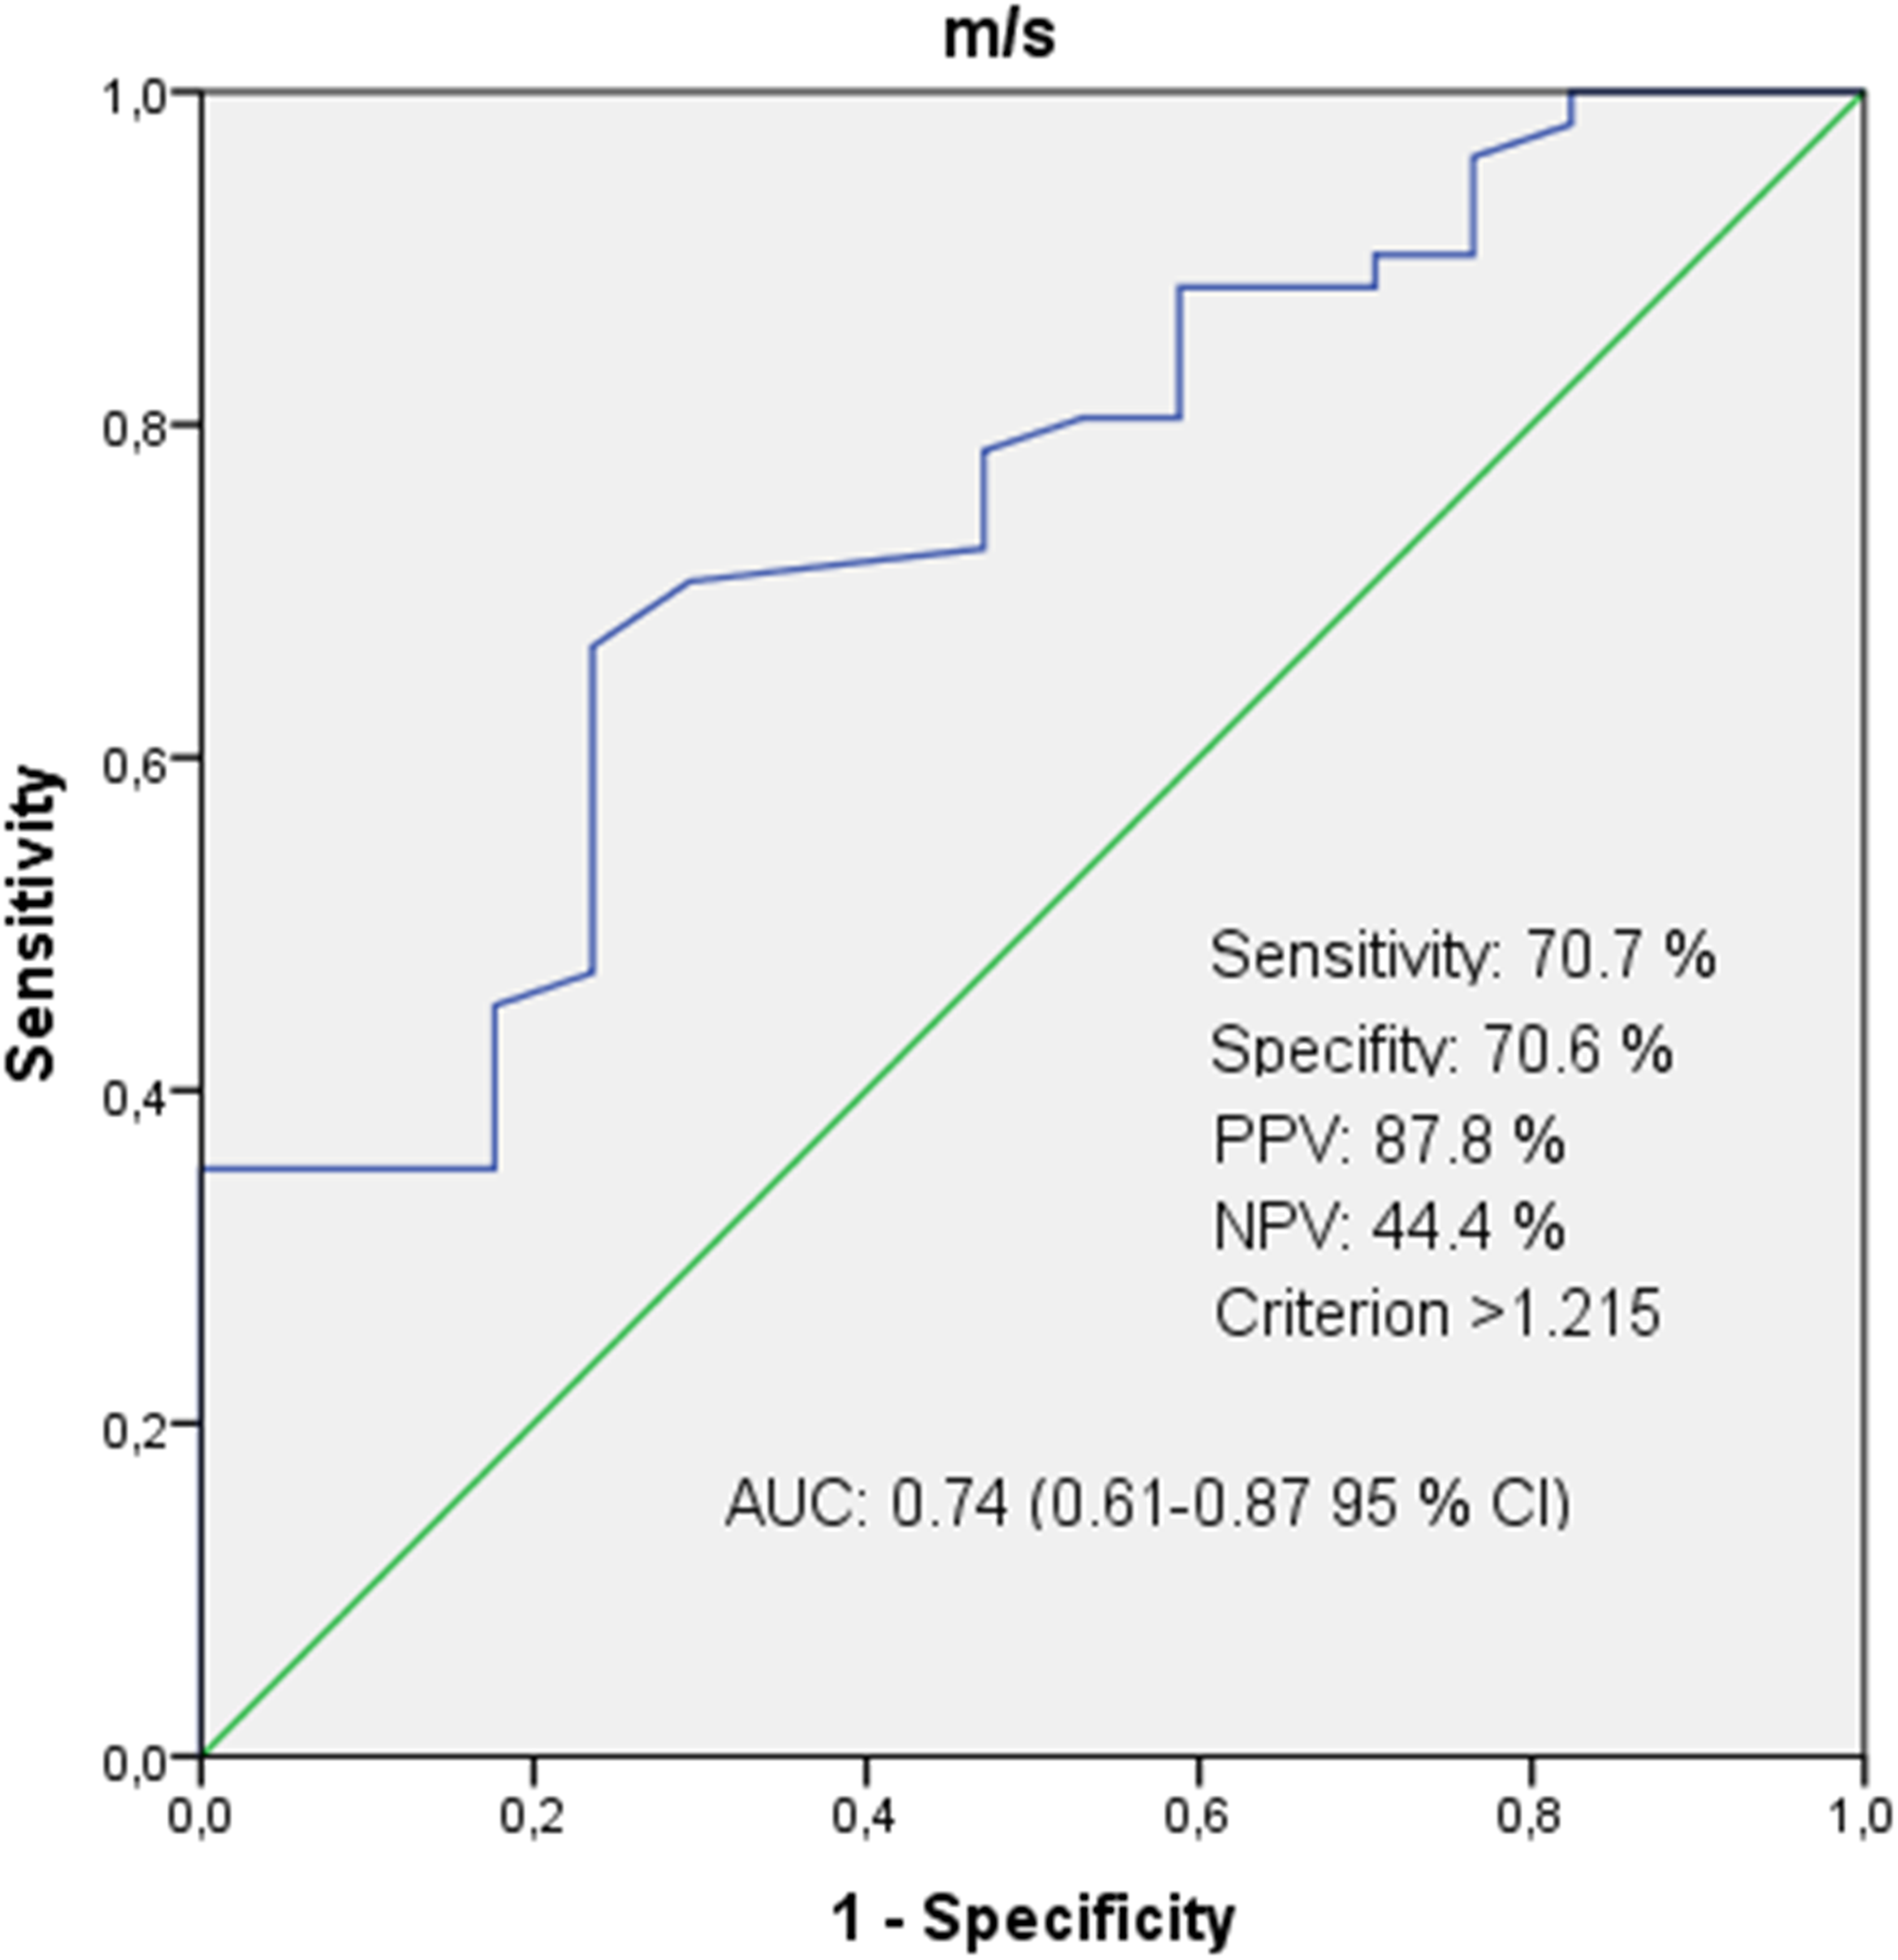
Characteristic curve of shear wave elastography measurements in differentiating RCC from AML. AML, angiomyolipoma; RCC, renal cell carcinoma; ROC, receiver operating characteristic.
Discussion
Elastography is widely used for the non-invasive assessment of the mechanical properties of tissues due to easy access, safety, and low cost (12). There are several different ultrasonographic elastography techniques based on different physical principles (13). SWE is a novel non-invasive quantitative method that determines tissue elasticity by measuring shear wave propagation in soft tissues (14).
The present study aimed to investigate the effectiveness of SWE, a recently introduced novel radiological examination technique, in the characterization of RCCs and AMLs.
There are few studies in the literature that assess the elasticity of kidney lesions such as RCCs and AMLs. Studies on strain elastography and SWE have reported different results. Keskin et al., Onur et al., and Tan et al. reported the sensitivity of strain elastography to be in the range of 90%–94% (15–17). Unfortunately, SWE studies do not report such high sensitivities. For instance, Goya et al. and Lu et al. found the sensitivity of SWE to be 88% and 48%, respectively (18,19). In our study, we calculated the sensitivity of SWE to be 70.7%.
In contrast to Guo et al., we found that the mass-to-parenchyma SWE ratio was significantly higher in cases of ccRCCs than AMLs (P = 0.003). In addition, unlike the study of Guo et al., we compared RCC subtypes and found that SWE values were significantly higher in cases of ccRCC than other RCC subtypes (P = 0.003). This difference may be due to the fact that there was only one non-clear cell RCC in the study of Guo et al., unlike our study. SWE values were significantly higher for ccRCC than pRCC (P < 0.001). SWE values were significantly higher for mixed-type RCC than pRCC (P = 0.019). In ROC curve analysis, the sensitivity of SWE in differentiating ccRCCs from non-clear cell RCCs was calculated as 75% (20).
Similar to the study of Lu et al., we found that SWE values were higher in cases of ccRCC than pRCC (P < 0.001). However, in contrast to Lu et al., we found that SWE values were significantly higher for mixed-type RCC than pRCC (P = 0.019) and similar to the study of Lu et al., SWE was sensitive (75%) in differentiating ccRCCs from non-clear cell RCCs in our study (19).
In contrast to Clevert et al., we found that SWE values were significantly higher in cases of ccRCC than pRCC (P < 0.001) (21).
Similarly to the study of Aydın et al., we found high SWE values in cases of RCCs (22).
Similarly to the study of Cai et al., we found high sensitivity values to differentiate RCCs from AMLs (75%). However, on the contrary, in the study of Cai et al., the mean elasticity of malignant lesions (7.2 ± 2.5 kPa) was lower than that of benign lesions (10.0 ± 2.4 kPa) (23).
The present study has some limitations. First, we had a small number of participants in each RCC subgroup. Therefore, our calculated cutoff values for subgroups other than ccRCC were not reliable. In addition, not having included pathologies such as oncocytomas, urothelial carcinomas, pseudotumors, hemangiomas, and lymphomas, our results are limited to comparisons between RCCs and AMLs and are not applicable to all comparisons between benign and malignant lesions. Studies with sufficient homogeneous numbers of patients with various pathologies will give more meaningful results on the reliability of the technique. Second, in our study, SWE measurements were performed by only one researcher. Measurements by multiple observers would help to evaluate the inter-observer reliability of SWE to provide useful data on the effectiveness of this method. Third, another limitation of our study is that we only measure the renal masses from only two different locations. However, there are other studies with more measurements. Fourth, in our study, we considered small lesions that we saw as hyperechoic on ultrasound as AML and did not use any other radiological modality. As it is known, small RCC may look like AML on US.
In conclusion, SWE is a novel radiologic imaging method that is becoming increasingly common and may be useful in distinguishing ccRCC and non-clear cell RCCs. Results from the literature and our study demonstrate that, at its current stage, the SWE method can potentially contribute to the primary diagnosis of certain lesions. Our results may help guide future larger-scale studies investigating the differentiation of ccRCCs and non-clear cell RCCs. In the future, the effectiveness of SWE will be better understood in the light of larger-scale studies including RCC, AML, and less common benign and malignant renal masses such as oncocytomas, urothelial carcinomas, pseudotumors, hemangiomas, and lymphomas.
Footnotes
Declaration of conflicting interests
The author(s) declared no funding, no potential conflicts of interest with respect to the research, authorship, and/or publication of this article.
Funding
The author(s) received no financial support for the research, authorship, and/or publication of this article.